")
Back to Journals » OncoTargets and Therapy » Volume 14
Chidamide-Induced Accumulation of Reactive Oxygen Species Increases Lenalidomide Sensitivity Against Multiple Myeloma Cells
Authors Jiang D, Zhang K, Zhu Y, Zhu Y, Zou L, Hu J, Cui Y, Zhou W, Chen F, He Y
Received 22 March 2021
Accepted for publication 15 June 2021
Published 6 July 2021 Volume 2021:14 Pages 4061—4075
DOI https://doi.org/10.2147/OTT.S312249
Checked for plagiarism Yes
Review by Single anonymous peer review
Peer reviewer comments 3
Editor who approved publication: Dr Leo Jen-Liang Su
Duanfeng Jiang,1 Kaixuan Zhang,2 Yinghong Zhu,3 Yan Zhu,2 Lang Zou,2 Jian Hu,2 Yajuan Cui,4 Wen Zhou,3 Fangping Chen,1,2 Yanjuan He2
1Department of Hematology, The Third Xiangya Hospital, Central South University, Changsha, 410013, People’s Republic of China; 2Department of Hematology, Xiangya Hospital, Central South University, Changsha, 410008, People’s Republic of China; 3Cancer Research Institute, School of Basic Medical Sciences, Central South University, Changsha, 410078, People’s Republic of China; 4Department of Hematology, the Second Xiangya Hospital, Central South University, Changsha, 410011, People’s Republic of China
Correspondence: Yanjuan He
Department of Hematology, Xiangya Hospital, Central South University, Changsha, Hunan, People’s Republic of China
Tel +86 159 73130688
Email [email protected]
Background: Lenalidomide, an immunomodulatory drug (IMiD), is an effective therapy for the treatment of multiple myeloma (MM). However, prolonged treatment may be accompanied by toxicity, second primary malignancies, and drug resistance. There is an inherent vulnerability in MM cells that high rates of immunoglobulin synthesis resulting in the high level of reactive oxygen species (ROS). This provides a therapeutic potential for MM.
Materials and Methods: The intracellular ROS levels, H2O2 production and glutathione (GSH) levels were measured using detection kit. Cell viability was evaluated using cell-counting kit-8 (CCK-8) and soft agar colony formation assay. Apoptosis was determined in whole living cells using flow cytometry. Chidamide and its anti-myeloma efficacy in combination with lenalidomide were characterized in MM cell lines in vitro and in a mouse xenograft model. Moreover, Western blotting, immunofluorescence and immunohistochemical studies were performed.
Results: ROS levels increased in a time- and dose-dependent manner with chidamide treatment. Moreover, the GSH levels were decreased and the mRNA level of SLC7A11 downregulated after chidamide treatment. The co-treatment with chidamide and lenalidomide increased apoptosis and proliferation inhibition, with combination index (CI) in the synergistic range (0.2– 0.5) using the Chou–Talalay method. The cooperative anti-myeloma efficacy was confirmed in the murine model, and immunohistochemical studies also supported this potentiation. Chidamide enhanced the effect of lenalidomide-induced degradation of IKZF1 and IKZF3 by elevating H2O2. In addition, co-treatment with chidamide and lenalidomide increased biomarkers of caspase and DNA damage.
Conclusion: Elevated ROS production may constitute a potential biochemical basis for anti-myeloma effects of chidamide plus lenalidomide. The results of this study confirm the synergistic effect of chidamide and lenalidomide against MM and provide a promising therapeutic strategy for MM.
Keywords: multiple myeloma, chidamide, lenalidomide, reactive oxygen species
Introduction
Multiple myeloma (MM) is a plasma cell malignancy that remains incurable despite the tremendous improvements during the past decades.1 The main factor crippling the success of MM treatment is the rapid emergence of drug resistance to available therapy.2 Immunomodulatory drugs (IMiDs), such as lenalidomide, are effective therapies for the treatment of MM.3 However, prolonged treatment is associated with toxicity, second primary malignancies, and drug resistance.4 The integration of novel agents into the treatment paradigm may be able to compensate for these deficiencies.
Reactive oxygen species (ROS) are metabolic byproducts of essential cellular activities, such as oxidative phosphorylation and lipid peroxidation.5 ROS include oxygen free radicals and nonradical oxidants, such as O2−, OH−, H2O2, and NO.6 Elevated levels of ROS cause damage to DNA, proteins, and lipids.7 Tumour cells produce high levels of ROS, which maintain pro-tumourigenic signalling and resistance to apoptosis. However, toxic levels of ROS production in cancers can also activate anti-tumourigenic signalling, resulting in oxidative stress-induced tumour cell death.8 Therefore, therapies that can eliminate ROS or elevate ROS production are potential effective cancer therapies. There is an inherent vulnerability in MM cells that high rates of immunoglobulin synthesis resulting in the high level of ROS. This provides a therapeutic potential for MM.9 Recently, studies revealed that lenalidomide triggers antitumour activities in MM primarily by targeting cereblon (CRBN) and inducing ROS-mediated oxidative stress. IKZF1 and IKZF3 are essential transcription factors in multiple myeloma.10 Lenalidomide-mediated elevation of intracellular H2O2 is particularly toxic to MM, and CRBN-dependent degradation of IKZF1 and IKZF3 is a consequence of H2O2-mediated oxidative stress.10,11 Therefore, we hypothesized that drugs with the ability to increase ROS production can enhance the anti-myeloma effect of lenalidomide and reduce the possibility of drug resistance.
Histone deacetylase inhibitors (HDACi) promote oxidative stress and the generation of ROS in cancers, and they are utilized to enhance the antitumour activities of other drugs.12–15 Chidamide, a novel HDACi targeting HDAC1, 2, 3, and 10,16,17 was able to induce ROS generation in lung cancer18 and ROS-dependent apoptosis in leukaemia.19 However, it is not clear if chidamide can increase ROS production and promote tumour cell death in MM. Therefore, we determined if chidamide can enhance the anti-myeloma effect of lenalidomide by generating ROS. In this study, we found that increased sensitivity of MM cells to chidamide is mediated by increased ROS levels, and treatment with the ROS scavenger N-acetyl-cysteine (NAC) reduced cell death. We found that chidamide induces ROS accumulation in MM cells by suppressing SLC7A11 and reducing glutathione. Chidamide-induced ROS promote H2O2-mediated degradation of IKZF1 and IKZF3 and ROS-dependent DNA damage. These results suggest that elevated ROS production may constitute a potential biochemical basis for in vitro and in vivo anti-myeloma effects of chidamide plus lenalidomide. These findings indicate that ROS induction is a common vulnerability that can be targeted in MM with ROS inducers.
Materials and Methods
Cell Lines and Patient MM Cells
The human myeloma cell lines ARP-1, KMS-28, ANBL6, ANBL6-BR, KMS-11 and RPMI-8226, and human B-lymphocyte GM12878 cells were obtained from the Cancer Research Institute of Central South University. The use of the above cell lines was approved by the ethics committee of the Cancer Research Institute of Central South University. The MM cells were grown in RPMI 1640 (Gibco, USA) medium supplemented with 10% foetal bovine serum (Gibco, USA) at 37 °C in a 5% CO2 incubator. ANBL6 bortezomib-resistant (BR) and the parental cells were cultured in the presence of IL-6 (2.5 ng/mL) and ANBL6-BR was cultured in the presence of bortezomib (2 nmol/L). Three patients with MM according to the International Myeloma Working Group (IMWG) guidelines20 were enrolled following approval from the ethical committee of Xiangya Hospital, Central South University. Informed consent was obtained from the patients according to the Declaration of Helsinki. The clinical information of the clinical samples is described in Supplementary Table S1. Patient MM cells were purified as previously reported,21 and cultured in RPMI 1640 supplemented with 15% foetal bovine serum.
Reagents and Antibodies
Chidamide was provided by Shenzhen Chipscreen Biosciences, Ltd (Shenzhen, China); lenalidomide was obtained from SL Pharmaceutical Co., Ltd (Beijing, China), dissolved in dimethyl sulfoxide (DMSO, in vitro) or in saline solution (in vivo), aliquoted, and stored at −80 °C. The drugs were diluted to ensure that the content of DMSO was less than 0.1% in the cell culture experiment. Antibodies against cleaved caspase-3 (#AF7022), cleaved PARP (#AF7023), γ-H2AX (#AF8482), xCT (#DF12509), IKZF1 (#DF6659), IKZF3 (#DF3472), β-actin (#AF7018), and anti-rabbit Alexa Fluor 594 (#S0006) were purchased from Affinity Biosciences (Cincinnati, OH, USA). Antibody against Ki67 (#GB13030-2) was purchased from Servicebio (Woburn, MA, USA). HRP-conjugated secondary goat anti-rabbit (#L3012) and goat anti-mouse (#L3032) antibodies were purchased from Signalway Antibody (College Park, MD, USA). Matrigel was purchased from BD Biosciences Discovery Labware (Two Oak Park, Bedford, MA, USA).
Cell Viability and Apoptosis Assays
Cell viability assay was performed using CCK-8 solution (Dojindo, Japan) by following the manufacturer’s instructions. Briefly, the cells were seeded in 96-well plates (5 × 10³ cells per well) and exposed to chidamide (0–8 μM) or lenalidomide (0–8 μM) at increasing doses, alone or in combination for 48 hours. CCK-8 assay was performed according to the standard procedure and the plate was measured at 450 nm using a microplate reader (PerkinElmer, USA). The combination index (CI) was calculated with CompuSyn software (ComboSyn, Inc., Paramus, NJ, USA), which is based on the Chou Talalay method.22 For apoptosis assay, the cells were harvested after treatment for indicated time, washed with ice-cold PBS, and re-suspended in 400 μL binding buffer. Next, 20 μg/mL FITC-Annexin V and 5 μg/mL propidium iodide (US Everbright Inc, USA) were added to each sample and incubated for 15 minutes. Flow cytometry (Becton Dickinson, USA) was used to analyse the stained cells, and apoptotic cells were defined as Annexin V-positive cells.
Soft Agar Colony Formation Assay
The effect of chidamide and lenalidomide on MM cells was determined using a soft agar colony formation assay. Colony formation assay was performed as previously described.21,23 Briefly, after treatment for 24 hours, cells were suspended in 0.28% agar (Dalian Meilun Biotechnology, China) in RPMI 1640 medium containing 20% FCS, and plated on solidified agar (0.58%) in 12-well plates (2, 000 cells per well). The plates were incubated for 10 days at 37 °C in 5% CO2. The number of colonies was determined using an inverted microscope (Olympus, Japan) and a graph was plotted using IMAGEJ software (NIH, Bethesda, MD, USA).
Western Blotting Analysis
Cells were collected and the total protein was extracted using radioimmunoprecipitation assay buffer (NCM Biotech, China) with freshly added proteinase inhibitor. Proteins were then separated by 10–12% sodium dodecyl sulphate-polyacrylamide gel electrophoresis and transferred to 0.22 μm PVDF membranes (Millipore, USA). The membranes were blocked with 5% skim milk and then incubated with primary antibodies overnight at 4 °C. The respective horseradish peroxidase-conjugated secondary antibodies were added, and protein signals were developed with enhanced chemiluminescence reagents (Affinity Biosciences). ChemiDox XRS Chemiluminescence imaging system (Bio-Rad, USA) was used to capture and analyse the developed images.
Real-Time Quantitative Polymerase Chain Reaction (qRT-PCR)
Total RNA was isolated using TRIzol reagent (Invitrogen, USA). cDNA synthesis was performed using HiScript II 1st Strand cDNA Synthesis Kit (Vazyme, China) with 1.0 μg total RNA of each sample. Gene-specific primers were synthesized by the Beijing Genomics Institute (Supplementary Table S2). Gene expression (mRNA) was analysed using the ChamQ Universal SYBR qPCR Master Mix (Vazyme, China) and LightCycler 480 real-time PCR instrument (Roche, Switzerland) in a two-step qRT-PCR (95 °C for 30 s, followed by 40 cycles of 95 °C for 10 s and 60 °C for 30 s). All reactions were run in triplicate. The CT values were calculated using the Standard Curve Method, and the mRNA levels of the target genes were calculated using the 2−ΔΔCt method. Human B-lymphocyte GM12878 cells were used as a calibrator.
Measurement of Reactive Oxygen Species (ROS) Generation
The intracellular ROS levels were measured using a Reactive Oxygen Species Assay Kit (Beyotime, China). Briefly, the cells were pre-treated with or without 15 mmol/L N-Acetyl-L-cysteine (NAC, Sigma-Aldrich, USA) for 2 hours at 37 °C and then incubated with various drugs for the indicated times. After treatment, the cells were collected and resuspended in RPMI 1640 medium containing 10 μmol/L of 2,7-dichlorodihydro-fluorescein diacetate, followed by incubation at 37 °C for 20 minutes. Fluorescence intensity was measured at 488 nm excitation and 525 nm emission using EnVision multimode plate reader (PerkinElmer EnVision, USA).
Measurement of H2O2 Production
A hydrogen peroxide assay kit (Solarbio, China) was used to determine H2O2 production. The H2O2 content was estimated according to the manufacturer’s instructions. The cells (1 × 10⁶) were lysed with 200 μL of frozen acetone by using the ultrasonic method. After centrifugation at 8000 g for 10 min at 4 °C, the supernatant was removed and stored on ice for further analysis.
Assessment of GSH Levels
The intracellular levels of glutathione (GSH) were measured using GSH and GSSG Assay Kit (Beyotime, China). Briefly, the cells were collected and lysed using the frozen-thawed method in liquid nitrogen and 37 °C bath. The total GSH levels were determined by the enzymatic recycling method. Oxidized glutathione (GSSG) was produced by derivatizing GSH with 2-vinylpyridine. Detailed measurements were carried out according to the kit instructions. The concentration of reduced GSH was calculated by subtracting the GSSG levels from the total GSH (GSH = total GSH − 2 × GSSG). Intracellular GSH level was determined on the basis of cellular protein concentrations, which were determined with the Bicinchoninic Acid method.
Immunofluorescence Analysis
After treatment for 24 hours, cells were collected and placed on glass substrates. Next, the cells were covered with glass slide and fixed with 4% paraformaldehyde for 20 minutes. The fixed cells were rinsed thrice, permeabilized with 0.1% Triton X-100 (Sigma, USA) for 15 minutes, and blocked with 5% BSA in phosphate buffered saline (PBS) for 1 hour at room temperature (15–25 °C). The cells were incubated overnight at 4 °C with primary antibody and stained with Alexa Fluor 594 goat anti-rabbit IgG (Affinity, USA) for 1 hour at room temperature in the dark, followed by counterstaining with 4′,6-diamidino-2-phenylindole (Sigma, USA). After three PBS rinses, the samples were covered with coverslip using Antifade Solution (Solarbio, China). The images were analysed and captured by confocal fluorescence microscope (Olympus, Japan).
Tumour Xenografts in Mice
The mouse experiment was approved by the Institutional Animal Care and local veterinary office and ethics committee of Central South University, China. Animal welfare were guaranteed according to the 3Rs and the EU guidelines 2010/63/EU. Female B-NDG mice (6-week-old) (NOD-Prkdcscid IL2rgtm1/Bcgen, Biocytogen, Beijing, China) were used.21,23 MM xenograft mouse model was established through subcutaneous injection of 1×10⁶ ARP-1 cells (in 100 μL of Matrigel-cell suspension mixture) into the left abdomen. After 10 days, when the tumours became palpable, the mice were randomised into four groups: control, chidamide, lenalidomide, and combination groups. Tumour-bearing mice were treated with solvent control, chidamide (15 mg/kg by intraperitoneal injection (i.p), 5 days weekly for 14 days), and lenalidomide (15 mg/kg i.p. 5 days weekly for 14 days). Calliper measurements of the tumour diameters were performed 3 days weekly, and the tumour volume was estimated as the volume of an ellipse using the following formula: 0.5 × length × width2. Tumour volumes were measured every 3 days, and when the tumour volume reached 2000 mm3, the animals were sacrificed. The tumours were excised, weighed, and fixed for immunohistochemical analysis.
Statistical Analysis
All data are expressed as mean ± standard deviation (SD) and are representative of at least three separate experiments. SPSS 19.0 Student’s t-test was used to compare two independent groups, and the corresponding bar graph or line charts were drawn by GraphPad Prism 7 software. Differences between two data sets were analysed using two-tailed Student’s t-test. Probability values <0.05 indicated statistical significance. Mice were randomly assigned to groups using the random number table. The animal studies did not include blinding and sample size estimation tests.
Results
Proliferative Toxicity of Chidamide is Related to ROS Level in MM Cells
The effect of chidamide on MM cell lines (ARP-1, KMS-28, ANBL6, ANBL6-BR, KMS-11 and RPMI-8226) was determined using the CCK-8 assay. The 50% inhibitory concentration (IC50) was determined using different concentrations (0.5–8 μM for 48 h). As shown in Figure 1A, the IC50 values were approximately 2–12 μM for the six MM cell lines. Then, we investigated the basal ROS levels in the above cell lines. As shown in Figure 1B, ARP-1 cells had the highest and RPMI-8226 had the lowest ROS levels among the six myeloma cell lines. In addition, the result showed that higher basal ROS levels were correlated to lower IC50 values or higher proliferative toxicities of chidamide (Figure 1C). When supplementing the culture medium with ROS scavenger NAC, the proliferative toxicities of chidamide on MM cells were evidently reversed (Figure 1D and E), suggesting that the cell death induced by chidamide, at least in part, is ROS-dependent.
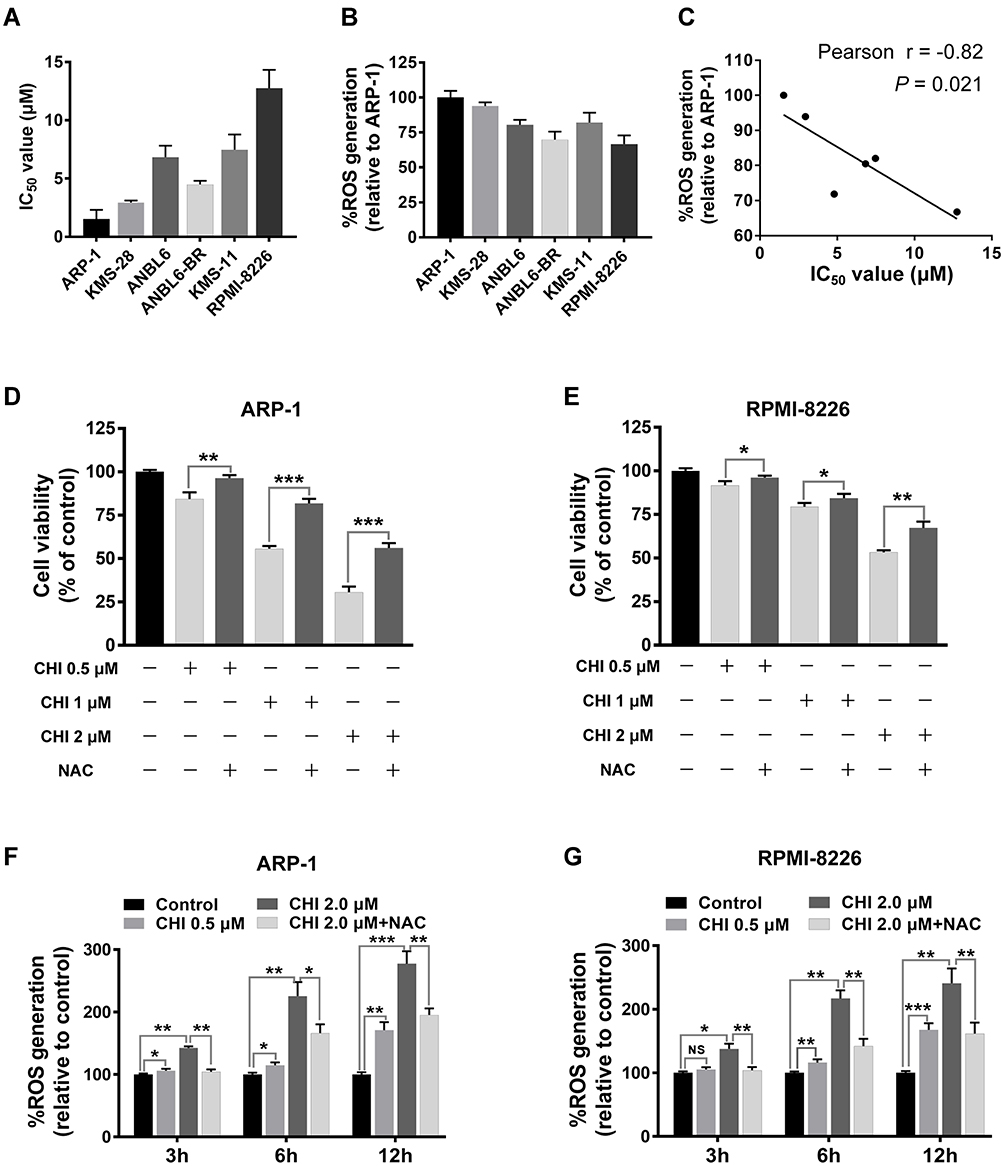 |
Figure 1 MM cells with higher ROS levels are vulnerable to chidamide (CHI) -mediated cytotoxicity. (A) cells were treated with chidamide for 48 hours at indicated concentrations, the growth inhibition IC50 values of six MM cell lines were examined using CCK-8 assays. (B) basal ROS levels in the six MM cell lines, using Reactive Oxygen Species Assay Kit. (C) Pearson correlation analysis for IC50 values and relative ROS levels in the six MM cell lines. Each dot indicates mean value of IC50 values (corresponding to X-axis) and relative ROS levels (corresponding to Y-axis) of one MM cell line. (D and E) ARP-1 and RPMI-8226 cells were pretreated with or without 15 mmol/L NAC and then treated with different doses of chidamide, and cell viabilities were evaluated using CCK-8 assays. (F and G) ROS levels were measured after treatment with different doses of chidamide (0, 0.5 and 2 μM) for indicated time (0, 3, 6 and 12 hours), pretreated with or without 15 mmol/L NAC, in ARP-1 and RPMI-8226 cells. NS, p > 0.05; *, p < 0.05; **, p < 0.01; ***, p < 0.001. |
Chidamide Induces ROS Accumulation via SLC7A11 Suppression and GSH Reduction in MM Cells
Previous studies have demonstrated that the anti-tumour mechanism of chidamide is related to ROS production.18,19 To explore chidamide-induced ROS accumulation in myeloma cells, we measured the level of ROS generated by chidamide co-treatment with or without ROS scavenger compounds in ARP-1 and RPMI-8226 cells. As shown in Figure 1F and G, ROS levels increased significantly in a time- and dose-dependent manner. In the presence of 15 mM NAC, chidamide-induced ROS production was reduced in both ARP1 and RPMI-8226 cells, suggesting that intracellular ROS accumulation is chidamide-dependent.
GSH is a major cellular anti-oxidant, and it provides reducing equivalents to eliminate ROS.24 To further unveil the potential mechanism underlying chidamide-induced ROS accumulation, we subsequently determined the level of GSH with or without chidamide treatment. The results showed that the GSH levels were decreased after chidamide treatment in MM cells (Figure 2A and B). Our above data showed that NAC, a biosynthetic precursor of GSH, prevented chidamide-induced cell death. This suggests that GSH reduction by chidamide is necessary for the proliferative toxicity of chidamide. SLC7A11 encodes the cystine-glutamate antiporter, xCT, which is responsible for the cellular intake of cystine, the precursor of GSH.15 The suppression of this antiporter can reduce cellular GSH levels and increase cellular ROS. To investigate if chidamide can induce the production of ROS through SLC7A11/xCT suppression, we quantified changes in SLC7A11 expression through qRT-PCR analysis. As shown in Figure 2C and D, chidamide treatment downregulated the mRNA level of SLC7A11. Consistently, the protein levels of SLC7A11/xCT downregulated by chidamide were also observed in Western blotting analysis (Figure 2E and F) and immunofluorescence analysis (Figure 2G and H).
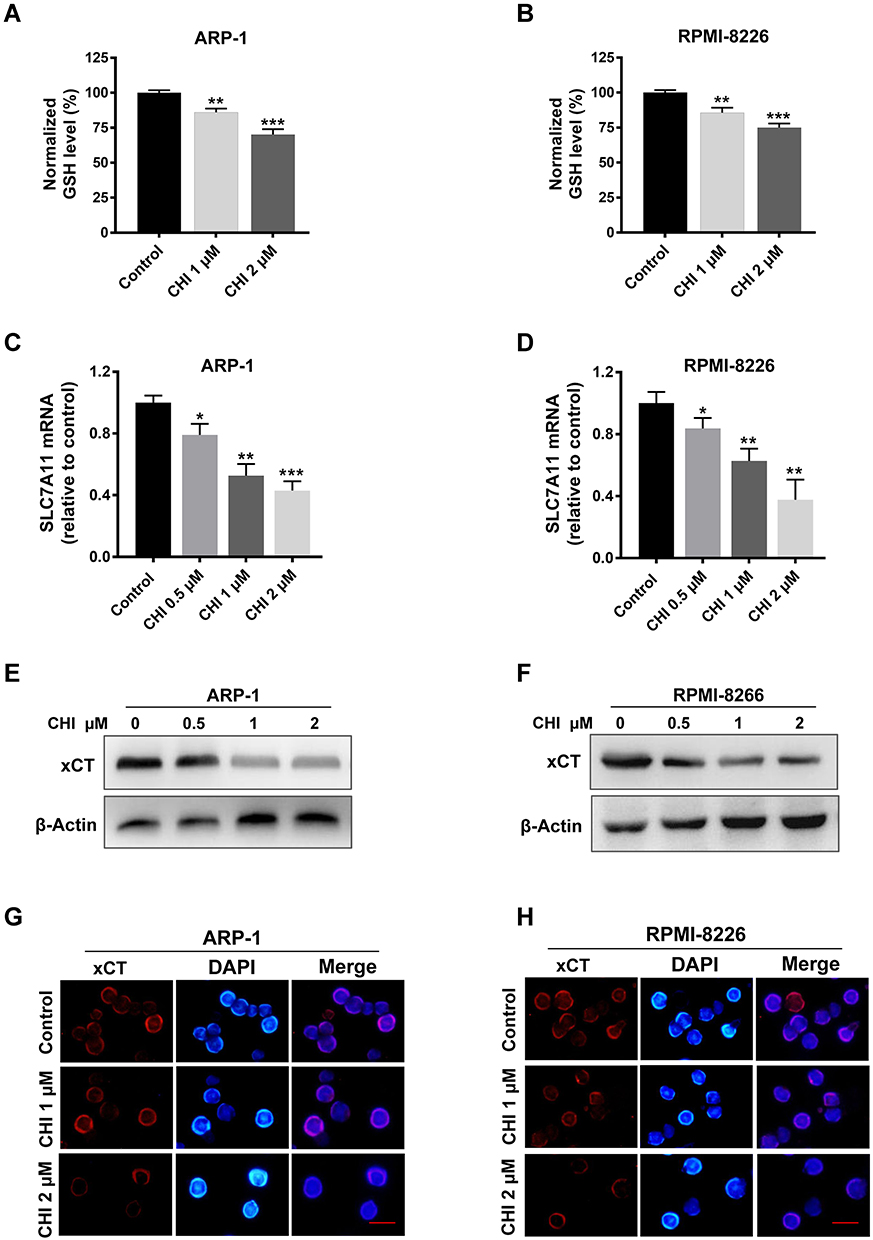 |
Figure 2 Chidamide (CHI) induces ROS production via SLC7A11 suppression and GSH reduction in MM cells. (A and B) GSH levels were measured using GSH and GSSG Assay Kit after chidamide treatment for 24 hours in ARP-1 and RPMI-8226 cells. (C and D) changes of SLC7A11 mRNA levels with different doses of chidamide treatment for 24 hours in ARP-1 and RPMI-8226 cells. (E-H) changes of SLC7A11/xCT protein levels with different doses of chidamide treatment for 24 hours in ARP-1 and RPMI-8226 cells using Western blotting and immunofluorescence analysis. Scale bars represent 20 μm. *, p < 0.05; **, p < 0.01; ***, p < 0.001 vs control. |
Chidamide Enhances the Inhibitory Effects of Lenalidomide Against the Proliferation of MM Cells
The inherent vulnerability of MM that high rate of immunoglobulin synthesis and high level of ROS may provide a therapeutic potential.9 Therefore, to explore the clinical implication of chidamide-induced ROS accumulation in MM, we evaluated chidamide and its anti-myeloma efficacy in combination with lenalidomide. For this purpose, ARP-1, RPMI-8226 cells were treated with different concentrations of chidamide and lenalidomide singly or in combination for 48 hours. The synergistic effect was investigated by using the Chou–Talalay method,22 and the CI was calculated by using CompuSyn. As shown by the results of the CCK-8 assay (Figure 3A-D and Figure S1), the combination treatment significantly accelerated cell death in myeloma cells, compared with the monotherapies; moreover, each MM cell line displayed significant synergistic effects with CI in the synergistic range (>0.3). Based on the appropriate CI, we choose the suitable synergistic dose for the following study (Table S3 and S4).
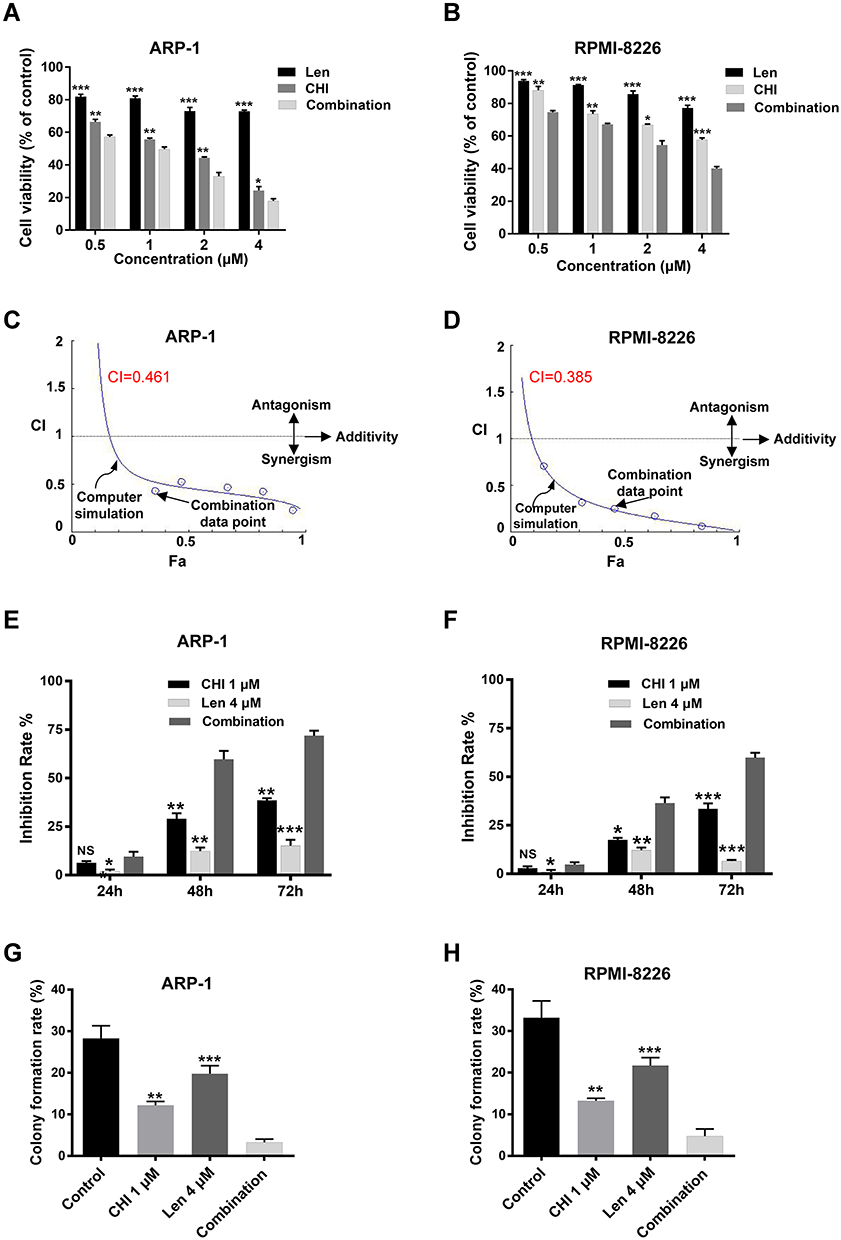 |
Figure 3 Chidamide (CHI) synergies with lenalidomide (Len) in inhibiting the proliferation of MM cells. (A and B) ARP-1 and RPMI-8226 cells were treated with chidamide combined with lenalidomide in different doses (1: 1 ratio of the two drugs) combinations for 48 hours, and the cell viability was analyzed using CCK-8 assay. (C and D) combination index (CI) values were calculated with the CompuSyn software. CI < 1 indicates synergy; CI = 1 is additive; and CI > 1 means antagonism. (E and F) ARP-1 or RPMI-8226 cells were treated with 1 μM chidamide and/ or 4 μM lenalidomide for 24 hours, inhibition rate were determined by CCK-8. (G and H) colony forming assay studies of colony formation rate of ARP1 and RPMI-8226 cells pretreated with 1 μM chidamide and/ or 4 μM lenalidomide for 24 hours and incubated for 10 days in solidified agar. NS, p > 0.05; *, p < 0.05; **, p < 0.01; ***, p < 0.001 vs combination. |
To further confirm the synergistic effect of chidamide and lenalidomide on MM cells, ARP-1 or RPMI-8226 cells were treated with 1 μM chidamide and 4 μM lenalidomide singly or in combination. Next, CCK-8 and soft agar colony formation assays were performed. Consistently, the combination treatment resulted in enhanced cytotoxic effects on MM cells, compared with the single treatments at the different indicated times (Figure 3E and F). A significant decrease in clonogenic ability was observed in MM cells after treatment with a combination of chidamide and lenalidomide, compared with the single agents (Figure 3G, H and Figure S2).
Chidamide Promotes the Induction of Apoptosis by Lenalidomide in MM Cells
HDAC-inhibiting and anti-myeloma activities of chidamide have been demonstrated in MM.25 To further investigate the combined effect of chidamide and lenalidomide, cell cycle analysis and apoptosis assay were performed using flow cytometry. As shown in Figure 4A and B, the apoptotic effect of lenalidomide on both ARP-1 and RPMI-8226 cells was enhanced markedly by chidamide. Increased G1 arrest was also observed in ARP-1 cells treated with both drugs, compared with those treated with a single drug (Figure S3). Furthermore, chidamide and lenalidomide exhibited a synergistic effect on apoptosis induction in primary MM cells from three patients (Figure 4C and D). In addition, we determined the activation of caspase-3 and PARP, a key event that occurs during apoptosis. As shown by the results of Western blotting analysis (Figure 4E and F), the co-treatment with chidamide and lenalidomide increased apoptosis activation in MM cells.
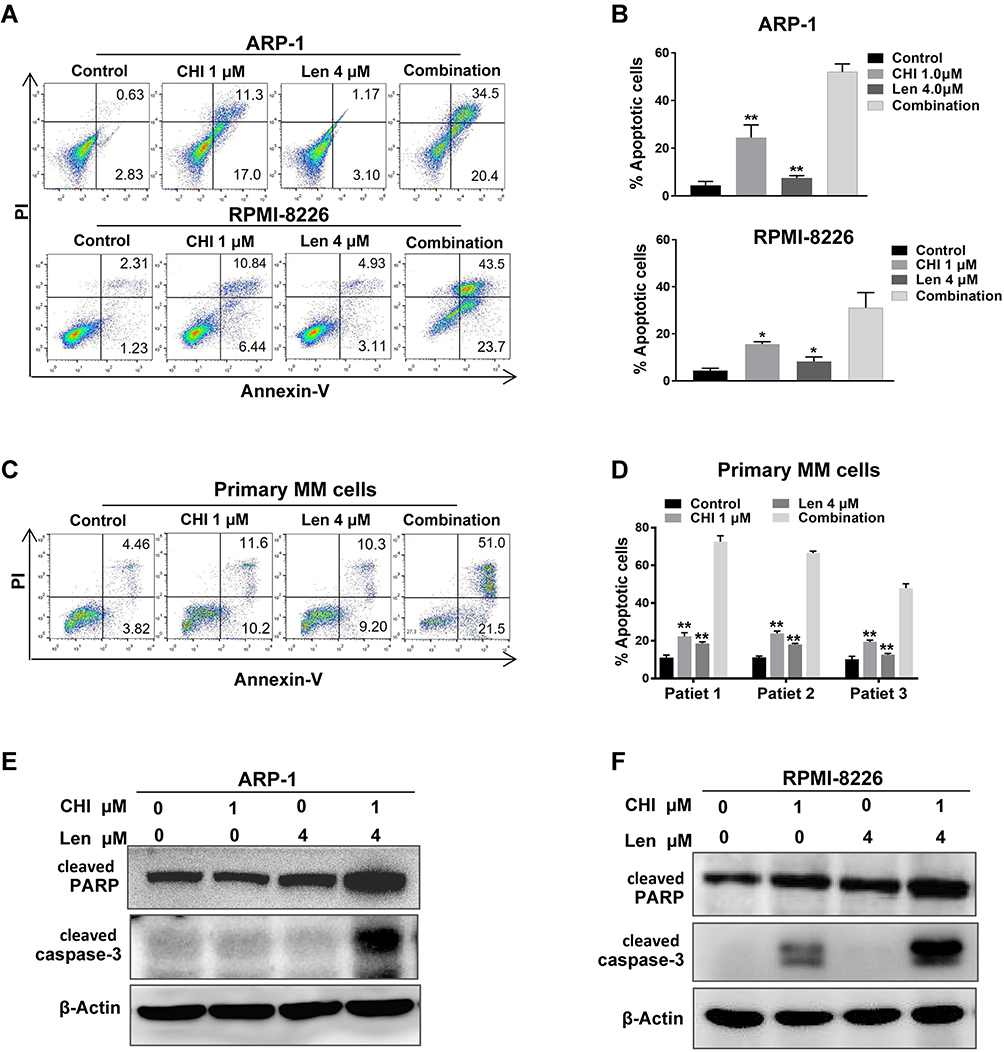 |
Figure 4 Chidamide (CHI) promotes apoptosis induction of lenalidomide (Len) in MM cells. (A and B) Annexin V-FITC/PI double staining analysis of ARP1 and RPMI-8226 cells treated with 1 μM chidamide and/ or 4 μM lenalidomide for 24 hours. Percentages of MM cell apoptosis based on three independent experiments. (C and D) MM cells derived from 3 MM patients were treated with 1 μM chidamide and/ or 4 μM lenalidomide in vitro for 24 hours, using flow cytometry for analysis. (E and F) expression of apoptosis biomarkers cleaved caspase-3, cleaved PARP were determined using Western blotting, β-actin as reference control. *, p < 0.05; **, p < 0.01 vs combination. |
Chidamide-Induced ROS Accumulation Enhances Anti-Myeloma Effect of Lenalidomide by Elevating H2O2
Our data revealed that chidamide induced ROS accumulation in MM cells. To verify lenalidomide-mediated elevation of intracellular H2O2 in MM cells,11 we first determined the changes in ROS level induced by different doses of lenalidomide treatment for 3, 6, and 12 hours, and an antioxidant, NAC, was used for reverse validation. The doses of lenalidomide used in this part was in accordance with previous studies.11 As shown in Figure 5A and B, ROS levels increased significantly in a dose- and time-dependent manner. In addition, co-treatment with lenalidomide and chidamide resulted in an increased ROS production (Figure S4A and B). Consistently, increased production of intracellular H2O2 was observed in MM cells treated with lenalidomide or co-treated with lenalidomide and chidamide (Figure 5C, 5D and Figure S4C). Lenalidomide-induced degradation of IKZF1 and IKZF3 is mediated by H2O2-induced protein oxidation cascade.11 We hypothesized that H2O2 elevation in MM cells could enhance anti-myeloma effect of lenalidomide, and hence, we treated MM cells with H2O2, chidamide, or the combination of chidamide and lenalidomide. As shown in Figure 5E and F, both lenalidomide and H2O2 treatment induced IKZF1 and IKZF3 degradation. Moreover, chidamide enhanced the effect of lenalidomide-induced degradation of IKZF1 and IKZF3. When co-cultured with NAC, a broad-spectrum ROS inhibitor, the cytotoxicity induced by H2O2 or by chidamide and lenalidomide significantly decreased. Consistently, cell death induced by chidamide, lenalidomide or their co-treatment were reversed by eliminating ROS with NAC (Figure 5G and H).
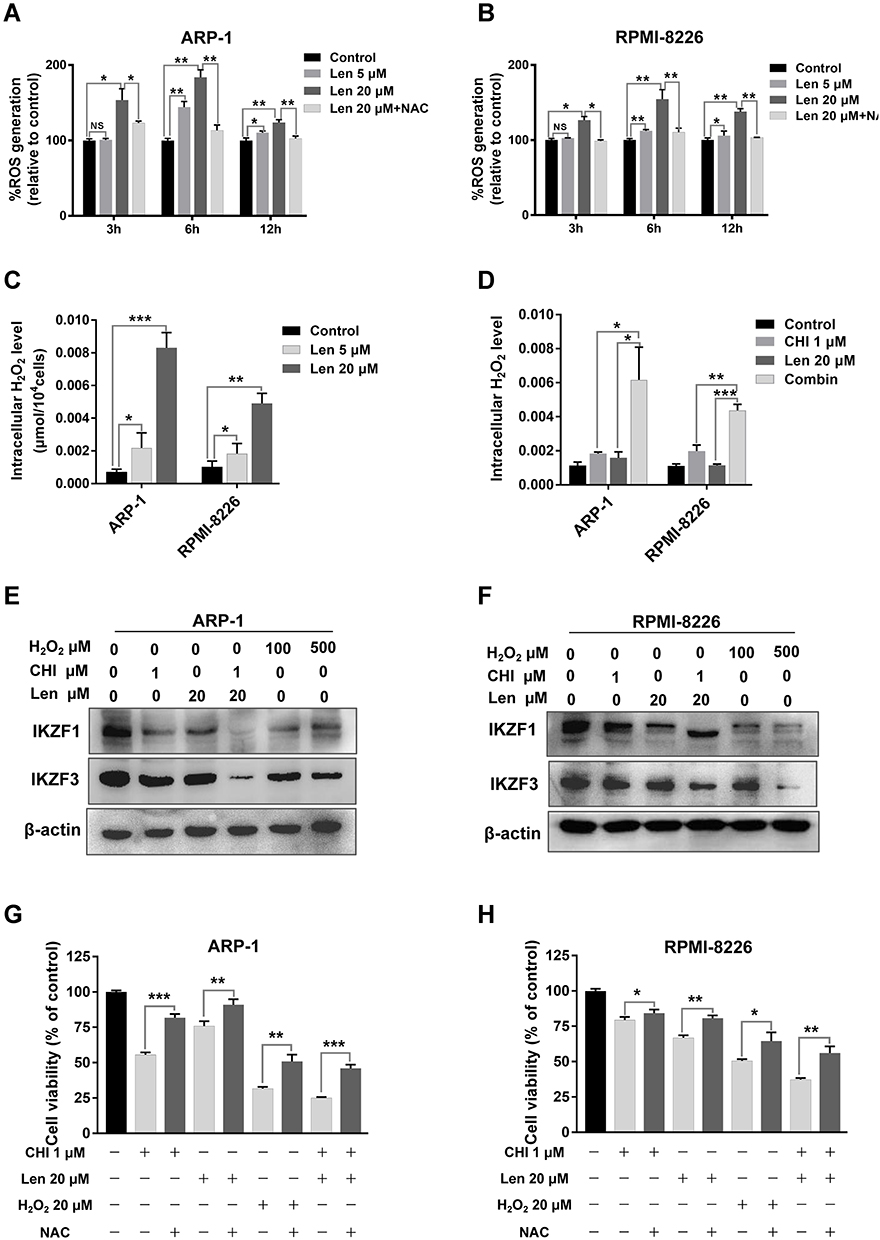 |
Figure 5 Chidamide (CHI)-induced ROS accumulation enhances anti-myeloma effect of lenalidomide (Len) through elevating H2O2. (A and B) ARP-1 and RPMI-8226 cells were treated with different doses of lenalidomide (0, 5 and 20 μM) for indicated time (0, 3, 6 and 12 hours), pretreated with or without 15 mmol/L NAC. Then ROS levels were measured using Reactive Oxygen Species Assay Kit. NS, p > 0.05; *, p < 0.05; **, p < 0.01. (C and D) ARP-1 and RPMI-8226 cells were treated with different doses of lenalidomide (0, 5 and 20 μM) for 12 hours, or 1 μM chidamide and 20 μM lenalidomide for 6 hours. Then H2O2 levels were tested using hydrogen peroxide assay kit. (E and F) after treated with 1 μM chidamide, 20 μM lenalidomide or H2O2 (100 and 500 μM) for 6 hours, expression of IKZF1 and IKZF3 were determined using Western blotting in ARP-1 and RPMI-8226 cells. (G and H) pretreated with or without 15 mmol/L NAC, ARP-1 and RPMI-8226 cells were then treated with 1 μM chidamide, 20 μM lenalidomide or 20 μM H2O2 for 24 hours, and CCK-8 assays were used to evaluate the cell viability. *, p < 0.05; **, p < 0.01; ***, p < 0.001. |
Combination of Chidamide and Lenalidomide Increases ROS-Related DNA Damage in MM Cells
ROS production in tumour cells increases oxidative stress and the induction of cell death.8 It has been reported that chidamide induced ROS-dependent cell death in leukaemia cells.19 Increase in the level of ROS may be the main mechanism associated with the synergistic effect of chidamide on the activity of lenalidomide against MM cells. It is widely accepted that ROS cause cell death mainly by inducing DNA damage.26 For this reason, we subsequently examined the expression of γ-H2AX, a biomarker of DNA damage, in MM cells after treatment with chidamide or in combination with lenalidomide. As shown in Figure 6A-D, increased levels of γ-H2AX were observed in MM cells in response to co-treatment with chidamide and lenalidomide. This indicates that ROS-induced DNA damage contributes to the synergistic effect of chidamide and lenalidomide in MM cells.
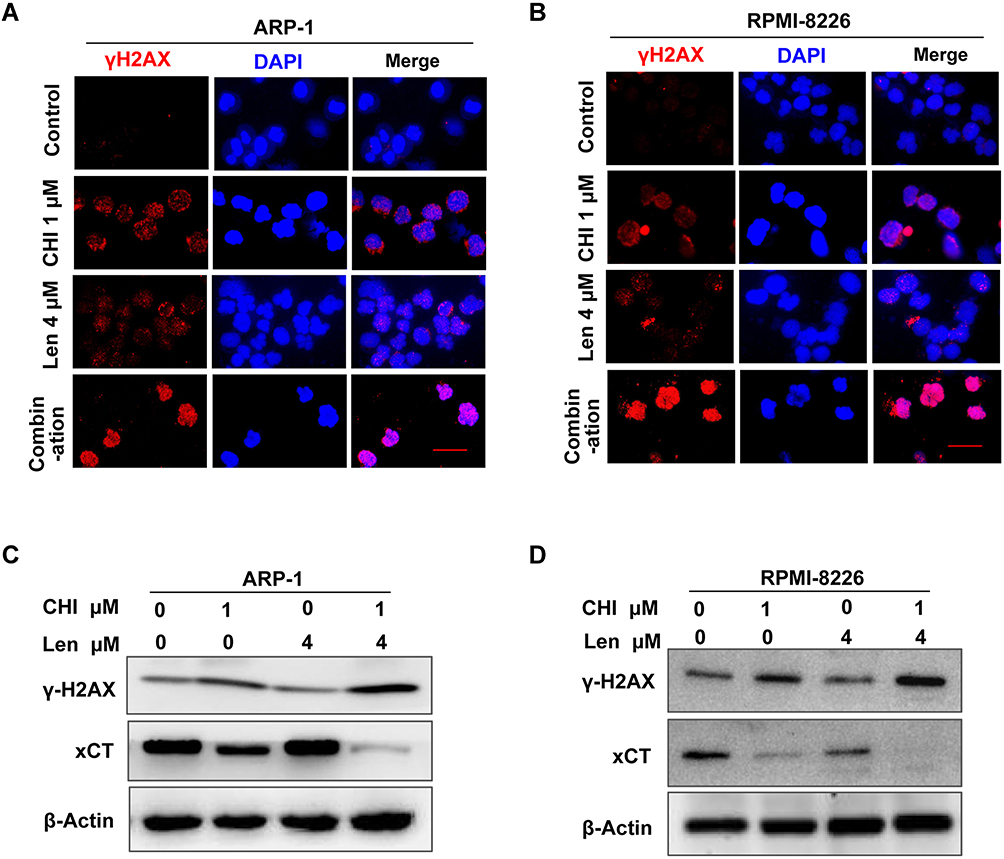 |
Figure 6 Combination of chidamide (CHI) and lenalidomide (Len) increase ROS-related DNA damage in MM cells. (A and B) DNA damage analysis by γ-H2AX foci immunofluorescence. Representative images of γ-H2AX (Red) and nuclei (Blue) in ARP-1 and RPMI-8226 cells treated with single agents or combination for 24 hours. Scale bars represent 20 μm. (C and D) after treated with 1 μM chidamide and/ or 4 μM lenalidomide for 24 hours, expression of γ-H2AX was determined using Western blotting. |
Chidamide and Lenalidomide Inhibits Myeloma Cell Growth Cooperatively in vivo
This study determined the synergistic effect of chidamide and lenalidomide in vitro and explored the combined effect in vivo using an MM xenograft mouse model. As shown in Figure 7A and B, compared with PBS-treated mice, a significant (54–88% in tumour volume and 37–61% in tumour weight) decrease in tumour growth was observed in mice treated with chidamide plus lenalidomide without obvious toxicity (Figure S5). Importantly, co-treatment with chidamide and lenalidomide led to greater reduction in tumour growth than monotherapy, indicating a combined anti-myeloma activity of the two drugs in vivo. Moreover, tumours from mice co-treated with chidamide and lenalidomide showed a significant decrease in cell proliferation (biomarker Ki-67) and a significant increase in cell apoptosis (cleaved caspase-3 and cleaved PARP), compared with those from mice treated with the single drugs (Figure 7C).
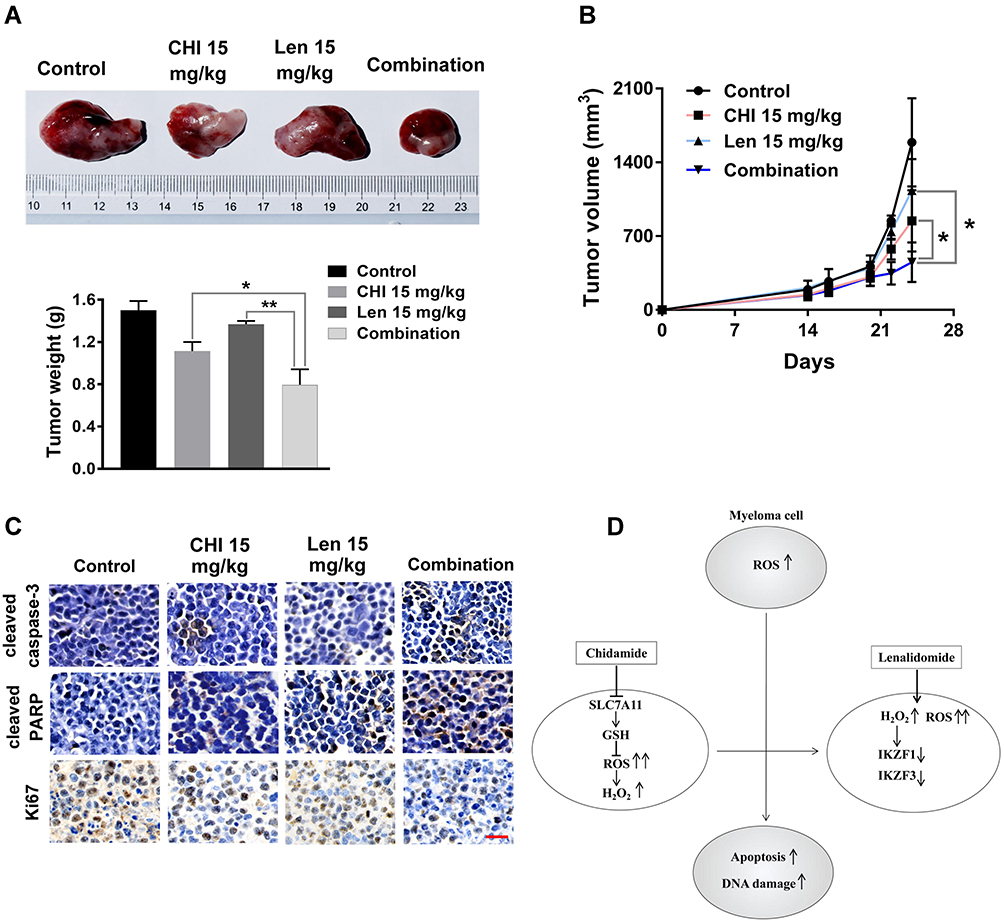 |
Figure 7 Chidamide (CHI) and lenalidomide (Len) exhibit synergistic anti-myeloma effect in vivo. (A and B) efficacy of single-agent and combination treatment of chidamide with lenalidomide in a human myeloma model in B-NDG mice. Tumor volumes and tumor weight of ARP-1 myelomas following treatment with single drugs and combined drugs (n=4). (C) immunohistochemical analyses with anti-cleaved caspase-3, anti-cleaved PARP, anti-Ki-67 induced by the treatment with single agents and combinations in vivo. Scale bars represent 50 μm. *, p < 0.05; **, p < 0.01. (D) The model of our working hypothesis. |
Discussion
Elevated levels of intracellular ROS often accompany malignant transformation due to oncogene activation and/or enhanced metabolism in cancer cells. Different types of tumour cells possess higher levels of ROS and lower antioxidant capacity than their normal counterparts.27 High rates of immunoglobulin synthesis is an additional factor contributing to the overproduction of ROS in MM cells,9 and further induction of oxidative stress may be an effective therapeutic strategy. In this study, we found that both drugs induced ROS production and ROS-dependent cytotoxicity in MM cells. These data strongly suggest that chidamide synergistically promoted the anti-myeloma effect of lenalidomide mainly by inducing ROS accumulation (Figure 7D).
HDAC-inhibiting and anti-myeloma activities of chidamide have been demonstrated in MM.25,28–30 It has been reported that HDAC inhibitor vorinostat increased the levels of ROS in drug-resistant cells, which caused selective apoptotic death of only the drug-resistant tumour cells.15 Thus, we speculated that the overproduction of ROS may be responsible for the anti-myeloma activity of chidamide. As expected, we observed increased ROS with chidamide treatment in a time- and dose-dependent manner in MM cells. More importantly, we found that ROS induction was necessary for chidamide toxicity. This is because the supplementation of the culture medium with NAC, a ROS scavenger, prevented chidamide-induced cell death. To investigate the mechanism underlying chidamide-induced ROS production, we quantified intracellular GSH levels and changes in SLC7A11 expression upon treatment of the MM cells with different doses of chidamide. The results showed that chidamide indeed transcriptionally suppressed SLC7A11 and reduced intracellular GSH levels in two MM cell lines, indicating that chidamide-induced ROS accumulation in MM cells was, at least in part, caused by the reduction of SLC7A11 expression in MM cells, which led to GSH reduction.
MM cells in hypermetabolic state produce elevated levels of ROS,9,11,31,32 which facilitates the effects of chidamide and lenalidomide. Based on the remarkable synergy of 1 μM chidamide and 4 μM lenalidomide, subsequent experiments were performed with both drugs at the indicated doses. Toxic levels of ROS in cells induce cell cycle arrest and apoptosis.33 Our results demonstrate that co-treatment with chidamide and lenalidomide led to marked growth inhibition and apoptosis in MM cells. Consistently, a similar antitumor efficacy was observed in an MM xenograft mouse model. These findings are consistent with those previous studies that demonstrated the collaborative anti-myeloma effect of HDAC inhibitor combined with lenalidomide.34–36 Lenalidomide acts primarily through the inhibition of peroxidase-mediated decomposition of intracellular H2O2 (an important form of ROS6) in MM cells.11 H2O2-mediated oxidative stress causes CRBN-dependent degradation of IKZF1 and IKZF3, which is the main mechanism associated with lenalidomide-mediated cytotoxicity in MM.11 Our data support that lenalidomide treatment increases intracellular ROS and H2O2 levels. Furthermore, we found that chidamide increased lenalidomide-induced H2O2 levels and H2O2-mediated degradation of IKZF1 and IKZF3. Cell death induced by the two drugs was reversed when the cells were co-cultured with NAC, which indicates that ROS induction is necessary for the synergistic effect of chidamide and lenalidomide. Increased ROS can drive a cycle of genomic instability, leading directly to DNA double strand break (DSB), one of the most lethal forms of DNA damage.27 Our data showed that the level of γ-H2AX, an indicator of DSB,37 was increased by co-treatment with chidamide and lenalidomide. This result suggests that the overproduction of ROS may, at least in part, be responsible for the combined effect of chidamide and lenalidomide.
In summary, these results indicate that elevated ROS production may constitute a potential biochemical basis for in vitro and in vivo anti-myeloma effects of chidamide plus lenalidomide. Our current study provides a promising strategy that combines chidamide and lenalidomide for the clinical treatment of MM. Importantly, this study provides a promising strategy that combines ROS-inducing agents and IMiDs for the therapy of MM.
Highlights
- MM cells with higher ROS level were more vulnerable to chidamide-induced ROS accumulation and its associated cytotoxicity.
- Chidamide induces ROS accumulation in MM cells by suppressing SLC7A11 and reducing GSH.
- Chidamide-induced ROS promote H2O2-mediated degradation of IKZF1 and IKZF3 induced by lenalidomide.
- Elevated ROS production constitutes a biochemical basis for anti-myeloma effects of chidamide plus lenalidomide.
Acknowledgments
This work was supported by the National Natural Science Foundation of China (81570117); the Natural Science Foundation of Hunan Province (2018JJ2651); the Medical Science Research Special Fund of Medical and Health Public Welfare Foundation of Beijing (YWJKJJH-KYJJ-B17464); and the Basic Ability Promotion Project in Middle-Aged and the National Natural Science Funds of China (81700125).
Disclosure
The authors declare no conflicts of interest in this work.
References
1. Pawlyn C, Davies FE. Toward personalized treatment in multiple myeloma based on molecular characteristics. Blood. 2018;133(7):660–675.
2. Durer C, Durer S, Lee S, Chakraborty R, Anwer F. Treatment of relapsed multiple myeloma: evidence-based recommendations. Blood Rev. 2019;39:100616.
3. Palumbo A, Hajek R, Delforge M, et al. Continuous lenalidomide treatment for newly diagnosed multiple myeloma. N Engl J Med. 2012;366(19):1759–1769.
4. Bazarbachi AHA, Hamed RA, Malard F, Harousseau JL, Mohty M. Relapsed refractory multiple myeloma: a comprehensive overview. Leukemia. 2019;33(10):2343–2357.
5. Lee TH, Kang TH. DNA oxidation and excision repair pathways. Int J Mol Sci. 2019;20(23):6092.
6. Zorov DB, Juhaszova M, Sollott SJ. Mitochondrial reactive oxygen species (ROS) and ROS-induced ROS release. Physiol Rev. 2014;94(3):909–950.
7. Roy K, Wu Y, Meitzler JL, et al. NADPH oxidases and cancer. Clin Sci. 2015;128(12):863–875.
8. Nogueira V, Park Y, Chen CC, et al. Akt determines replicative senescence and oxidative or oncogenic premature senescence and sensitizes cells to oxidative apoptosis. Cancer Cell. 2008;14(6):458–470.
9. Lipchick BC, Fink EE, Nikiforov MA. Oxidative stress and proteasome inhibitors in multiple myeloma. Pharmacol Res. 2016;105:210–215.
10. Krönke J, Udeshi ND, Narla A, et al. Lenalidomide causes selective degradation of IKZF1 and IKZF3 in multiple myeloma cells. Science. 2014;343(6168):301–305.
11. Sebastian S, Zhu YX, Braggio E, et al. Multiple myeloma cells capacity to decompose H2O2 determines lenalidomide sensitivity. Blood. 2017;129(8):991–1007.
12. El-Naggar AM, Somasekharan SP, Wang Y, et al. Class I HDAC inhibitors enhance YB-1 acetylation and oxidative stress to block sarcoma metastasis. EMBO Rep. 2019;20(12):e48375.
13. Rivera-Del Valle N, Cheng T, Irwin ME, et al. Combinatorial effects of histone deacetylase inhibitors (HDACi), vorinostat and entinostat, and adaphostin are characterized by distinct redox alterations. Cancer Chemother Pharmacol. 2018;81(3):483–495.
14. Dasmahapatra G, Lembersky D, Kramer L, et al. The pan-HDAC inhibitor vorinostat potentiates the activity of the proteasome inhibitor carfilzomib in human DLBCL cells in vitro and in vivo. Blood. 2010;115(22):4478–4487.
15. Wang L, Leite de Oliveira R, Huijberts S, et al. An acquired vulnerability of drug-resistant melanoma with therapeutic potential. Cell. 2018;173(6):1413–1425.
16. Gao S, Li X, Zang J, Xu W, Zhang Y. Preclinical and clinical studies of chidamide (CS055/HBI-8000), An orally available subtype-selective HDAC inhibitor for cancer therapy. Anticancer Agents Med Chem. 2017;17(6):802–812.
17. Ning ZQ, Li ZB, Newman MJ, et al. Chidamide (CS055/HBI-8000): a new histone deacetylase inhibitor of the benzamide class with antitumor activity and the ability to enhance immune cell-mediated tumor cell cytotoxicity. Cancer Chemother Pharmacol. 2012;69(4):901–909.
18. Wu YF, Ou CC, Chien PJ, et al. Chidamide-induced ROS accumulation and miR-129-3p-dependent cell cycle arrest in non-small lung cancer cells. Phytomedicine. 2019;56:94–102.
19. Gong K, Xie J, Yi H, Li W. CS055 (Chidamide/HBI-8000), a novel histone deacetylase inhibitor, induces G1 arrest, ROS-dependent apoptosis and differentiation in human leukaemia cells. Biochem J. 2012;443(3):735–746.
20. Rajkumar SV, Dimopoulos MA, Palumbo A, et al. International Myeloma Working Group updated criteria for the diagnosis of multiple myeloma. Lancet Oncol. 2014;15(12):e538–548.
21. Wu X, Xia J, Zhang J, et al. Phosphoglycerate dehydrogenase promotes proliferation and bortezomib resistance through increasing reduced glutathione synthesis in multiple myeloma. Br J Haematol. 2020;190(1):52–66.
22. Chou TC. Drug combination studies and their synergy quantification using the Chou-Talalay method. Cancer Res. 2010;70(2):440–446.
23. Xia J, He Y, Meng B, et al. NEK2 induces autophagy-mediated bortezomib resistance by stabilizing beclinin multiple myeloma. Mol Oncol. 2020;14(4):763–778.
24. Yang WS, SriRamaratnam R, Welsch ME, et al. Regulation of ferroptotic cancer cell death by GPX4. Cell. 2014;156(1–2):317–331.
25. He J, Chen Q, Gu H, et al. Therapeutic effects of the novel subtype-selective histone deacetylase (HDAC) inhibitor chidamide on myeloma-associated bone disease. Haematologica. 2018;103(8):1369–1379.
26. Groeger G, Quiney C, Cotter TG. Hydrogen peroxide as a cell-survival signaling molecule. Antioxid Redox Signal. 2009;11(11):2655–2671.
27. Moloney JN, Cotter TG. ROS signalling in the biology of cancer. Semin Cell Dev Biol. 2017;80:50–64.
28. Yuan XG, Huang YR, Yu T, et al. Chidamide, a histone deacetylase inhibitor, induces growth arrest and apoptosis in multiple myeloma cells in a caspase-dependent manner. Oncol Lett. 2019;18(1):411–419.
29. Sun Y, Li J, Xu Z, et al. Chidamide, a novel histone deacetylase inhibitor, inhibits multiple myeloma cells proliferation through succinate dehydrogenase subunit A. Am J Cancer Res. 2019;9(3):574–584.
30. Liu Z, Jing Q, Wang Y, et al. The short-term effect of histone deacetylase inhibitors, chidamide and valproic acid, on the NF-κB pathway in multiple myeloma cells. Int J Mol Med. 2018;43(1):285–293.
31. Stellrecht CM, Gandhi V. Myeloma antioxidant status: the good, the bad and the reactive. Leuk Lymphoma. 2009;50(5):691–693.
32. Tessoulin B, Descamps G, Dousset C, et al. Targeting oxidative stress with auranofin or Prima-1Met to Circumvent p53 or Bax/Bak deficiency in myeloma cells. Front Oncol. 2019;9:128.
33. Moon DO, Kim MO, Choi YH, et al. Butein induces G(2)/M phase arrest and apoptosis in human hepatoma cancer cells through ROS generation. Cancer Lett. 2010;288(2):204–213.
34. Tang S, Ma D, Cheng B, et al. Crucial role of HO-1/IRF4-dependent apoptosis induced by panobinostat and lenalidomide in multiple myeloma. Exp Cell Res. 2018;363(2):196–207.
35. Chari A, Cho HJ, Dhadwal A, et al. A Phase 2 study of panobinostat with lenalidomide and weekly dexamethasone in myeloma. Blood Advan. 2017;1(19):1575–1583.
36. Maly JJ, Christian BA, Zhu X, et al. A Phase I/II trial of panobinostat in combination with lenalidomide in patients with relapsed or refractory Hodgkin lymphoma. Clin Lymphoma Myeloma Leuk. 2017;17(6):347–353.
37. Sharma A, Singh K, Almasan A. Histone H2AX phosphorylation: a marker for DNA damage. Methods Mol Biol. 2012;920:613–626.
 © 2021 The Author(s). This work is published and licensed by Dove Medical Press Limited. The full terms of this license are available at https://www.dovepress.com/terms.php and incorporate the Creative Commons Attribution - Non Commercial (unported, v3.0) License.
By accessing the work you hereby accept the Terms. Non-commercial uses of the work are permitted without any further permission from Dove Medical Press Limited, provided the work is properly attributed. For permission for commercial use of this work, please see paragraphs 4.2 and 5 of our Terms.
© 2021 The Author(s). This work is published and licensed by Dove Medical Press Limited. The full terms of this license are available at https://www.dovepress.com/terms.php and incorporate the Creative Commons Attribution - Non Commercial (unported, v3.0) License.
By accessing the work you hereby accept the Terms. Non-commercial uses of the work are permitted without any further permission from Dove Medical Press Limited, provided the work is properly attributed. For permission for commercial use of this work, please see paragraphs 4.2 and 5 of our Terms.