")
Back to Journals » Drug Design, Development and Therapy » Volume 14
Charge Transfer Complex of Neostigmine with 2,3-Dichloro-5,6-Dicyano-1,4-Benzoquinone: Synthesis, Spectroscopic Characterization, Antimicrobial Activity, and Theoretical Study
Authors Yousef TA, Ezzeldin E, Abdel-Aziz HA , Al-Agamy MH , Mostafa GAE
Received 30 April 2020
Accepted for publication 12 August 2020
Published 6 October 2020 Volume 2020:14 Pages 4115—4129
DOI https://doi.org/10.2147/DDDT.S259369
Checked for plagiarism Yes
Review by Single anonymous peer review
Peer reviewer comments 3
Editor who approved publication: Professor Manfred Ogris
Tarek A Yousef,1,2 Essam Ezzeldin,3,4 Hatem A Abdel-Aziz,5 Mohamed H Al-Agamy,6,7 Gamal AE Mostafa3,5
1College of Science, Chemistry Department, Imam Mohammad Ibn Saud Islamic University (IMSIU), Riyadh 11623, Kingdom of Saudi Arabia; 2Department of Toxic and Narcotic Drug, Forensic Medicine, Mansoura Laboratory, Medicolegal Organization, Ministry of Justice, Mansoura, Egypt; 3Department of Pharmaceutical Chemistry, College of Pharmacy, King Saud University, Riyadh 11451, Saudi Arabia; 4Bioavailability Laboratory, Central Laboratory, College of Pharmacy, King Saud University, Riyadh 11451, Saudi Arabia; 5Applied Organic Chemistry Department, National Research Center, Cairo 12622, Egypt; 6Department of Pharmaceutics, College of Pharmacy, King Saud University, Riyadh 11451, Saudi Arabia; 7Department of Microbiology and Immunology, Faculty of Pharmacy, Al-Azhar University, Cairo, Egypt
Correspondence: Gamal AE Mostafa Email [email protected]
Background: Electron donor–acceptor interactions are important molecular reactions for the activity of pharmacological compounds. The aim of the study is to develop a charge transfer (CT) complex: synthesis, characterization, antimicrobial activity, and theoretical study.
Method and Results: A solid CT complex of neostigmine (NSG) with 2,3-dichloro-5,6-dicyano-1,4-benzoquinone (DDQ) was synthesized and characterized by infrared spectra, NMR, and UV–visible spectroscopy. The results confirm the formation of a CT complex. The stability of the CT complex between NSG and DDQ in acetonitrile was determined in solution via spectrophotometric measurement, ie, by calculating the formation constant, molar extinction coefficient, and different spectroscopic parameters. The stoichiometry of the formed NSG–DDQ complex was determined using Job’s method. The absorption band of the NSG–DDQ complex can be used for the quantification of NSG.
Conclusion: The DFT geometry optimization of NSG, DDQ, and the CT complex and the UV comparative study of both theoretical and experimental structures are presented. The experimental results confirm the charge transfer structure. The bacterial study shows that the NSG–DDQ complex has good antibacterial activity against both Gram-positive and Gram-negative bacteria as well as antifungal activity against Candida albicans.
Keywords: charge transfer complex, neostigmine, DDQ, synthesis, spectroscopic, characterization, antimicrobial activity, theoretical study
Introduction
Charge transfer (CT) complexes have achieved great importance in the field of drug receptor binding mechanism, DNA binding, and antibacterial, antifungal, and antineoplastic applications.1–3 This reaction arises from a weak interaction between donors and acceptors.4–8 Moreover, CT complexes have been used as organic semiconductors9 and organic solar cells10 because of their electrical properties.11,12 It has reported that the solid CT complex is stabilized by two non-covalent interactions, namely, hydrogen bond and dipole–dipole interactions.13 Proton transfer reaction between donors and electron acceptors are generally associated with the formation of deep-colored complexes, which typically absorb energy in the ultraviolet or visible region; this can be used for quantification of donor compounds.14,15 Therefore, absorption values at maximum absorption wavelengths are used to determine the quantity of donor drugs. The donors are usually molecules with nitrogen or sulfur atoms, which have free electron pairs or electron-rich aromatic rings.
Hydrogen-related charge transport complexes have received considerable attention in many fields such as surface chemistry16 and solar energy storage.17 They are also used in many biological fields.1–3
Neostigmine is a drug used to treat myasthenia gravis, the Ogilvy syndrome, and urinary retention without a blockage.18,19 It is also used with atropine to end the effects of a non-polarized muscle-blocking drug.18 It is administered by injection either under the skin or by muscular or intravenous route.18 The effects of this drug appear 30 minutes after injection and can last up to 4 hours.18 Side effects resulting from the use of this drug include tight abdominal pain, nausea, increased salivation, and slow heart rate.18 More severe side effects include hypotension, weakness, and allergic reactions. Neostigmine is part of the cholinergic family.18 It works by blocking the action of acetyl cholinesterase and thus increases the level of acetylcholine.18 Neostigmine has been proven to be an effective and safe pharmaceutical compound.20
In the present work, to gain insight about the basic knowledge that can be used to identify the drug receptor mechanism, we synthesized and characterized the formed CT complex of NSG with DDQ in solid state and in solution, which are characterized using different spectroscopic techniques, and theoretically studied its biological applications for the first time.
The stability of the NSG–DDQ complex in solution was characterized using the Benesi–Hildebrand equation to determine the formation constant and molar extinction coefficient. Different spectroscopic parameters (eg, oscillator strength, dipole moment, ionization potential, energy of NSG–DDQ complex, resonance energy, dissociation energy, and standard free energy) were determined. The stoichiometry of the NSG–DDQ complex was assessed using Job's method.
The antibacterial and antifungal activity screening of the NSG–DDQ complex was assessed by the cup-plate diffusion method and minimum inhibitory concentration (MIC) determination and the results were compared with standard antibacterial (imipenem) and antifungal (fluconazole) drugs. Furthermore, the TD-DFT method was used to determine the electronic structure by studying the electron density and frontier molecular orbitals.
Experimental
Materials and Reagents
All chemicals used were a higher-purity grade. High purity neostigmine bromide was purchased from Fluka AG, Buchs SG (Switzerland). DDQ was obtained from Merck Chemical Company (Germany). Acetonitrile was obtained from Winlab Laboratory, UK.
Instruments
A Shimadzu UV-1800 double-beam UV–visible spectrophotometer with 1-cm quartz cells was used. A Perkin-Elmer FT-IR spectrophotometer with KBr pellet was used for recording the IR spectrum (Akron, OH, USA). The NMR spectra were obtained using a Bruker 700 MHz Nuclear Magnetic Spectrometer (Billerica, MA, USA). 1H-NMR spectra were run at 700 MHz and 13C spectra were run at 175 MHz in DMSO-d6. Melting points were measured with a Stuart apparatus (Bibby Scientific Limited, Staffordshire, UK).
Synthesis of NSG CT Complex
The NSG–DDQ complex (which is reddish color) was prepared by mixing 1 mmol (0.303 g) of NSG in 10 mL of acetonitrile with 1 mmol (0.27 g) of DDQ (acceptor) in 10 mL of acetonitrile at room temperature. The solvent was allowed to evaporate at a slow rate and during that time the precipitate was formed. The precipitate was then filtered, washed with a lower volume of acetonitrile, and dried at room temperature. The melting point of the NSG–DDQ complex was recorded at 151 °C compared with 175–177 °C and 210–215 °C for neostigmine and DDQ, respectively. The resulting complex was investigated by FTIR and NMR spectrometry.
Stoichiometry
The molar ratio of NSG to the DDQ (acceptors) that form the CT complex was assessed using Job’s method (continuous variation method).21 Neostigmine acts as as an electron donor with the DDQ being the acceptor to form the CT complex. Stock solutions of 1×10⁻³M of NSG and DDQ were prepared in acetonitrile. A series of nine solutions of different ratios of NSG:DDQ was prepared (1:9, 2:8, 3:7, 4:6 up to 9:1) and was arranged for NSG:DDQ.
Antimicrobial Activity
Antimicrobial Screening
Antimicrobial activity was screened by the cup-plate diffusion method.22 Briefly, NSG and NSG–DDQ were dissolved in dimethyl sulfoxide (DMSO) to give a final concentration 2048 μg mL−1. The NSG and the CT complex (NSG–DDQ) were tested against
Gram-positive bacteria (Staphylococcus aureus ATCC 29213 and Bacillus subtilis ATCC 10400) and Gram-negative bacteria (E. coli ATCC 10418 and Pseudomonas aeruginosa ATCC 27853).
In addition, both NSG and the CT complex (NSG–DDQ) were tested against Candida albicans ATCC 10231, which represent fungi. A total of 3–5 well isolated colonies of the standard strains were suspended in sterile physiological saline to give a turbidity equivalent to 0.5 M McFarland reagent. The adjusted inoculum was swapped in Mueller–Hinton agar in three directions. The cups were placed in the inoculated plates and then removed. Subsequently, 100 μL of the solution was dispensed in the cup. The plates were then incubated for 24 h at 37 °C. Then, 100 μL of DMSO solution was transferred to the cup and used as negative control. Imipenem (10 μg disc−1) and ketoconazole (30 μg disc−1) were used as the standards (positive controls) for antibacterial and antifungal activity respectively. After the incubation time, antimicrobial activity was evaluated by measuring “the zone of inhibition (mm) against the tested microorganisms and compared with that of the standard.” The antimicrobial assay was carried out in triplicate and the mean value was calculated.
Minimum Inhibitory Concentration (MIC) Determination
The MIC was determined by the microbroth dilution method using a 96-well microtiter plate according to EUCAST guidelines.23 Briefly, 100 μL of Muller–Hinton broth was dispensed into each well of the microtiter plate. Each row of the microtiter plate, which contains 12 wells, was used for one microorganism. 100 μL (2048 μg mL−1) of the tested compound was added into the first wells and mixed well by pipetting up and down 6 times. Thereafter, 100 μL from the first well was taken and pipetted to the second well to make a twofold dilution. This procedure was repeated down to the tenth well to reach the concentration of 1 μg mL−1. 100 μL was discarded from the tenth well, then 100 μL of the adjusted inoculums (5 × 10⁵ CFU mL−1) was dispensed into the wells. The last two wells (well number 11 and 12) were used as positive and negative controls, respectively. The microtiter plates were incubated at 37 °C for 1 h. After the incubation period, the MIC results were recorded manually and interpreted according to the recommendations of EUCAST. The MIC is defined as the highest dilution of the drug that kills or inhibits the visible growth of a microorganism.
Quantum Chemical Calculations
Computational density functional theory (DFT) was used with the B3LYP function and the “6–311++G(d,p)” basis set for NSG, DDQ, and the NSG–DDQ complex to understand the perfect ordinary style investigation and geometry optimization for the isolated compounds. Molecular electrostatic potential (MEP) maps were obtained at the same level of theory. Time-dependent DFT calculations were performed by the “B3LYP/6-31G)d)” method in acetonitrile using the default polarizable continuum model. The density functional theory calculations were done using a Gaussian 03 program package.24
Results and Discussion
Synthesis of CT Complex
DDQ and NSG form a charge transfer complex; the electron-deficient benzene moiety of DDQ acts as a π-acceptor and easily accepts a charge from the NSG, which acts as an n-donor. The charge migration is an n–π* transition from the donor HOMO to the acceptor LUMO,25 ie, between the tertiary amidic nitrogen of neostigmine, which forms the radical cation NSG+, and DDQ which forms the radical anions DDQ– (Figure 1). A similar mechanism was previously proposed for CT complexes formed between the tertiary nitrogen of mirtazapine and DDQ– with the radical ions MIRT+· and DDQ─·.26 In addition to a CT complex between the tertiary nitrogen of brucine and DDQ to form radical ions brucine+·DDQ─·.27 The structure of NSG+·DDQ─· is characterized using spectroscopic analyses.
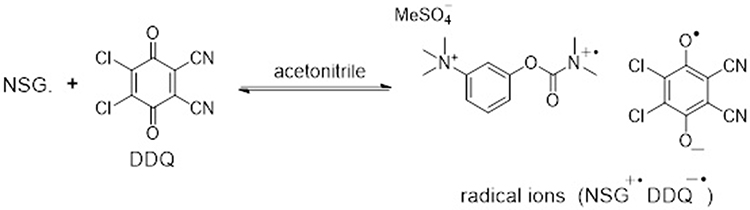 |
Figure 1 The interaction between neostigmine as n-donor and DDQ as π-acceptor and formation of radical ions NSG+·DDQ─·. |
Infrared Spectra
The charge transfer complex of radical ion NSG+·DDQ─· was studied by FTIR spectroscopy. The peak assignments for the important characteristic bands are illustrated in Table 1 and Figure 2. The results of NSG revealed characteristic absorption bands at 3430, 1720, 3110, and 2993 cm−1 corresponding to intramolecular hydrogen bonding, carbonyl function, aromatic C–H, and aliphatic C–H, respectively. On the other hand, these absorption bands of NSG+·DDQ─· complex appeared at 3381, 1656, 3090, and 2995 cm−1, respectively, with right shift for H-bond, C=O, and aromatic C–H. The absorption bands of C=C and C–O of NSG+·DDQ─· complex appeared at 1459 and 1212 cm−1, respectively, when compared with these of NSG which appeared at 1483 and 1179 cm−1, respectively28 (Table 1). The IR spectrum of NSG showed two absorptions bands of amine and amidic C–N at 1388 and 1222 cm−1, respectively, whereas those of NSG+·DDQ─· complex appeared at 1400 and 1292 cm−1. On the other hand, the FTIR spectrum of NSG+·DDQ─· complex exhibited the absorption band of –C≡N (in the DDQ─· anion) at 2225 cm−1 in addition to that of C–Cl at 1046 cm−1.
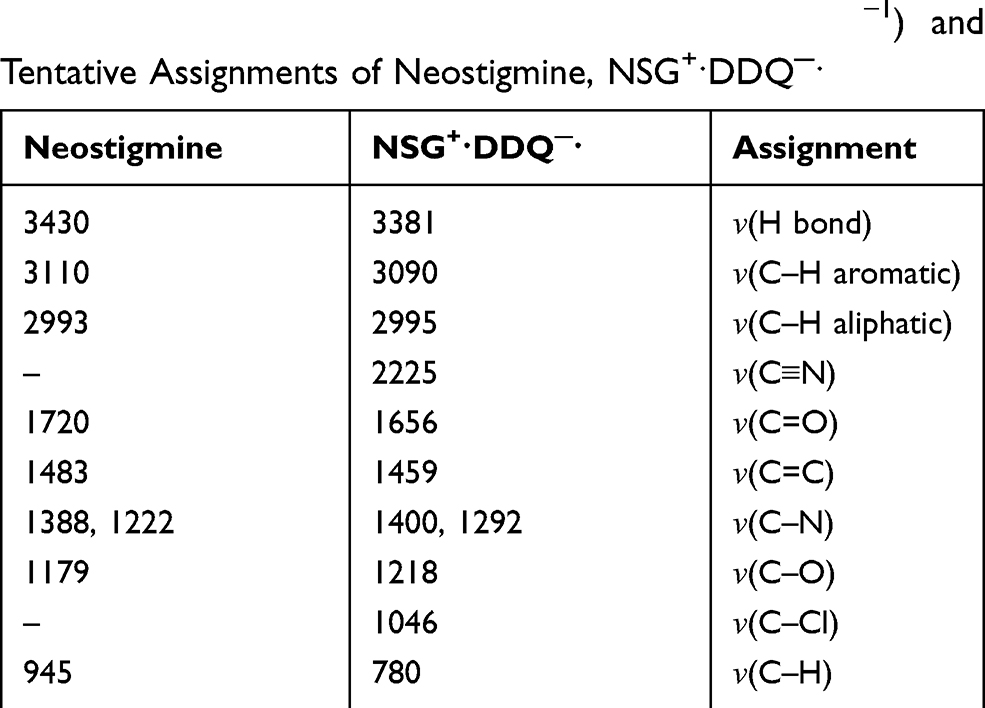 |
Table 1 Infrared Absorption Frequencies (KBr, cm−1) and Tentative Assignments of Neostigmine, NSG+·DDQ─· |
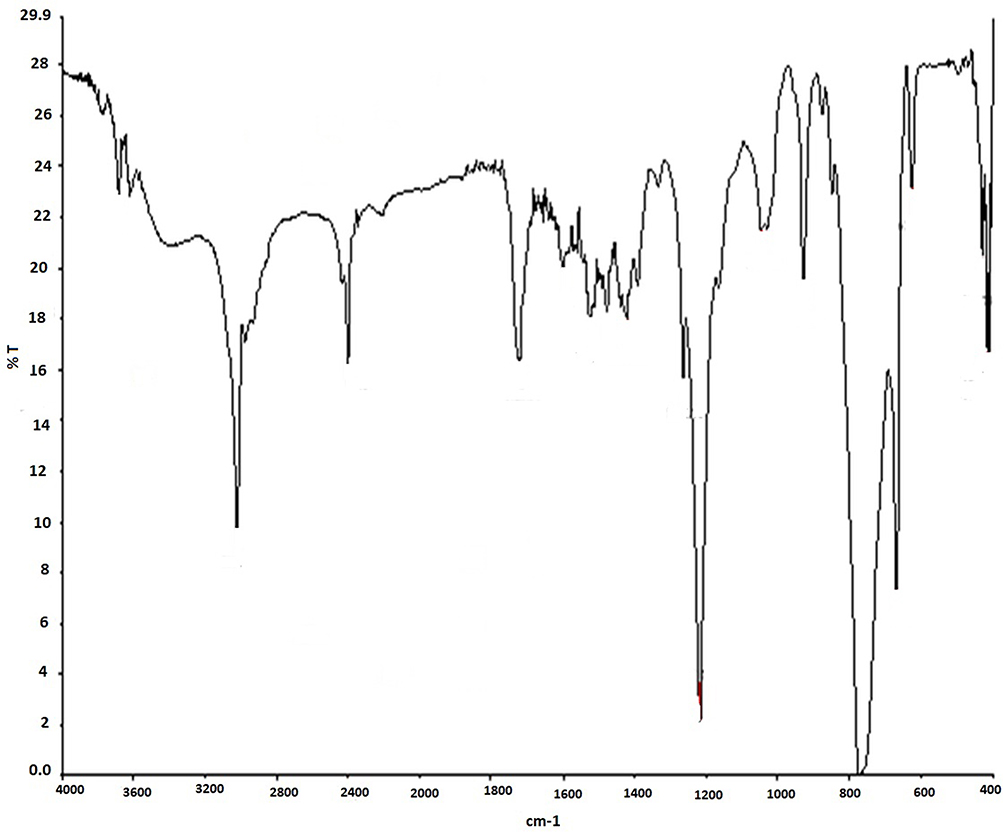 |
Figure 2 IR spectrum of the NSG–DDQ complex. |
NMR
The chemical shift (δ) values from the 1H spectra of free neostigmine29 and NSG+·DDQ─· are recorded in Table 2 and Figure 3. The downfield shifts of aromatic hydrogens are due to the electronic withdrawing nature of tertiary and quaternary nitrogen. The 1H NMR analysis of NSG+·DDQ─· revealed three signals due to the four aromatic hydrogens which appeared as multiples at δ 7.37–7.39 (1H), 7.63–7.66 (1H), and 7.85–7.88 (2H) ppm with no significant changes with these of free NSG. The 1H NMR spectra of CT complexes showed no shift of the signal of aliphatic hydrogens around amidic N at 2.93 (3H) and 3.08 (3H) ppm or quaternary hydrogens which appeared at 3.64 (9H) ppm.
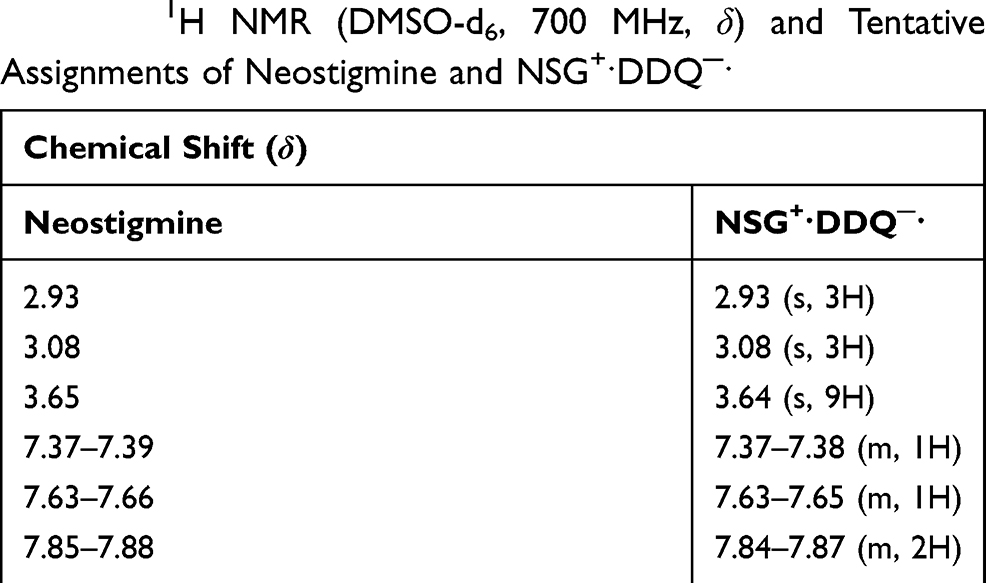 |
Table 2 1H NMR (DMSO-d6, 700 MHz, δ) and Tentative Assignments of Neostigmine and NSG+·DDQ─· |
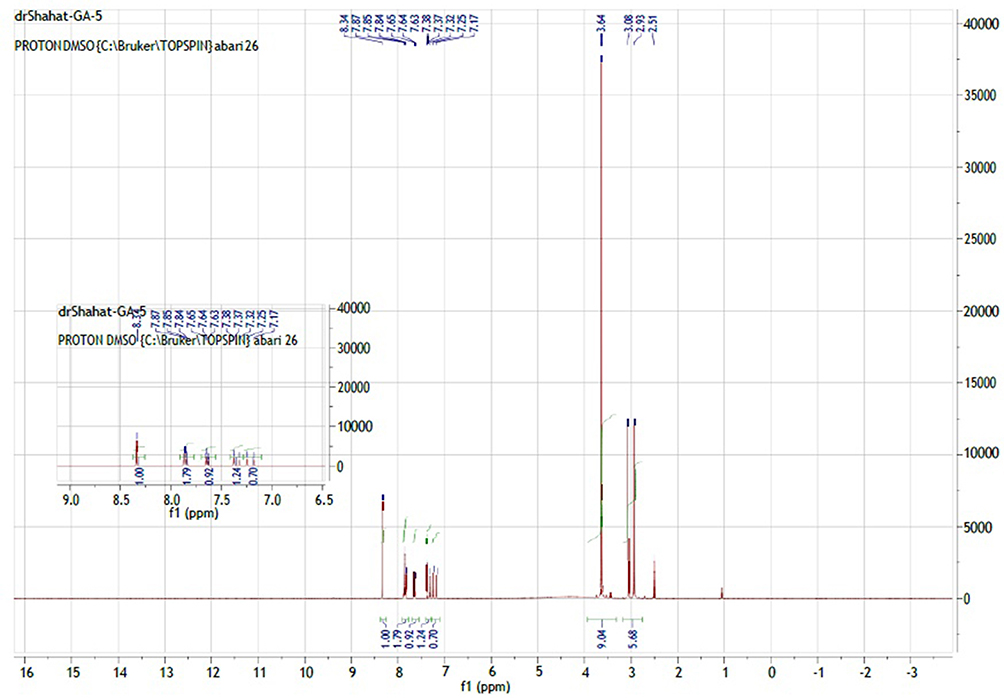 |
Figure 3 IH NMR spectrum of the NSG–DDQ complex. |
The chemical shift values from the 13C spectra of free NSG and NSG+·DDQ─· are illustrated in Table 3 and Figure 4. The table shows that signals of the complex are shifted slightly toward higher or lower field; the signals of DDQ─· carbons appeared beside the signals of NSG+· in the 13C NMR spectrum.
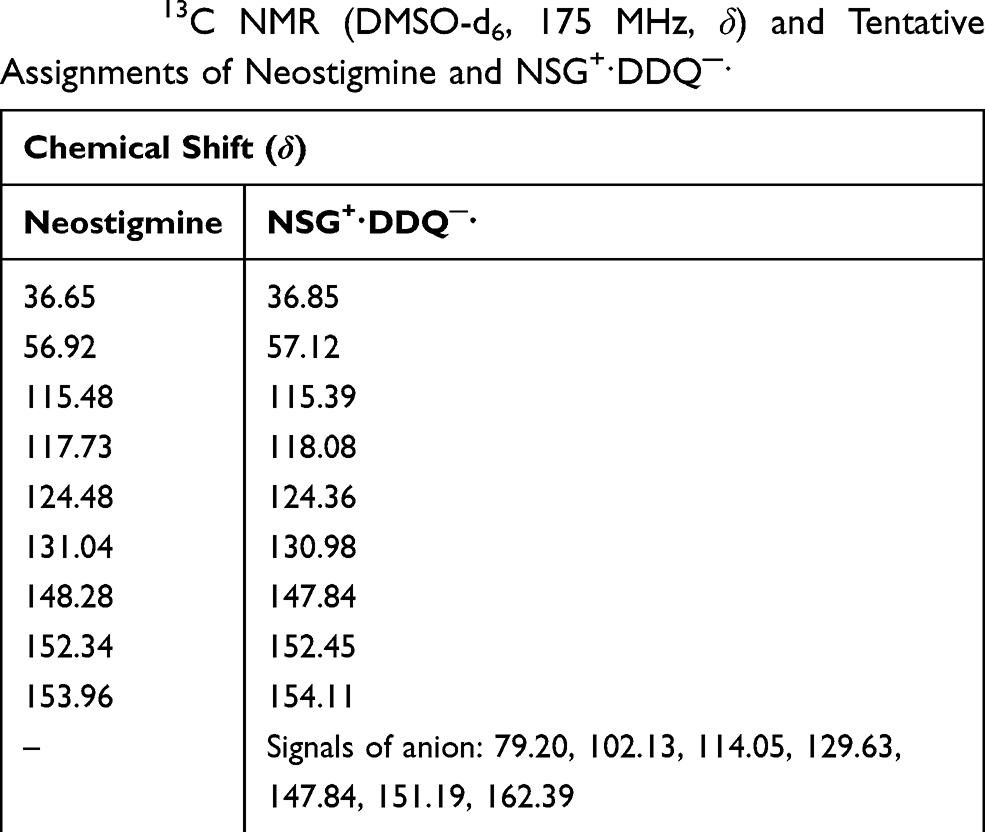 |
Table 3 13C NMR (DMSO-d6, 175 MHz, δ) and Tentative Assignments of Neostigmine and NSG+·DDQ─· |
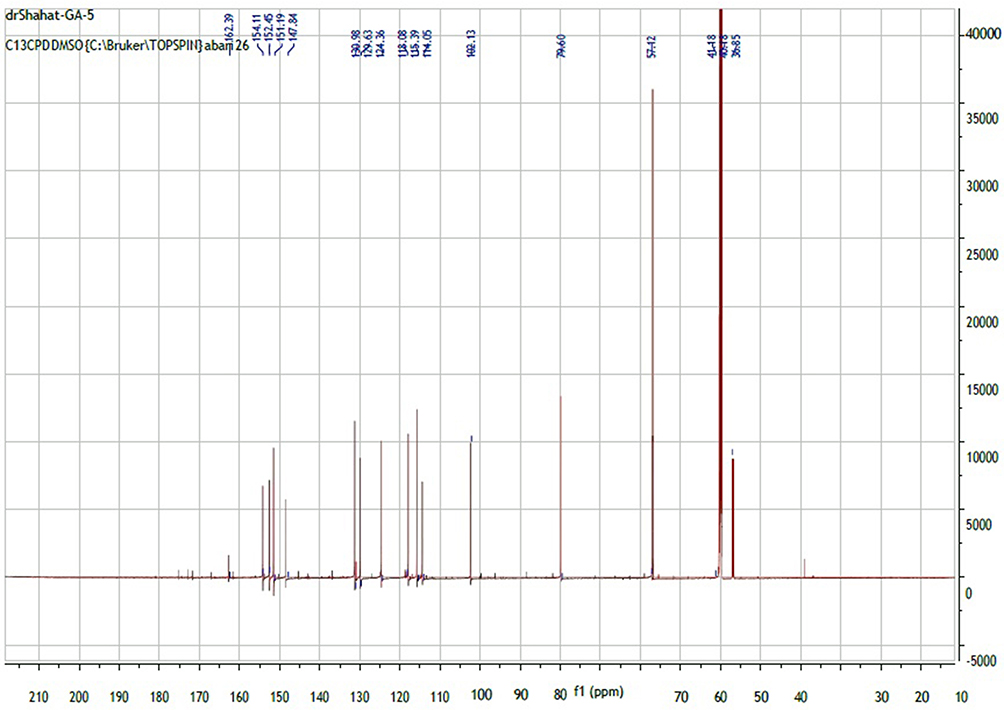 |
Figure 4 13C NMR spectrum of the NSG–DDQ complex. |
UV–Visible Absorption Spectra
The interaction of NSG (electron donor) with DDQ (electron acceptor) in acetonitrile is characterized by the appearance of a new broad band at longer wavelength (460nm), where no absorption of donor (225 or 266 nm) and acceptor (350 nm) is detected (Figure 5). This new band is due to the formation of “colored CT complex”. The change in color from yellow to red and the appearance of a new band confirms the formation of the CT complex (Figure 6). The resulting color was stable for ~10 h.
 |
Figure 5 Absorption curve of NSG–DDQ CT complex (10, 20, 40, 80, 100, and 120 ppm). |
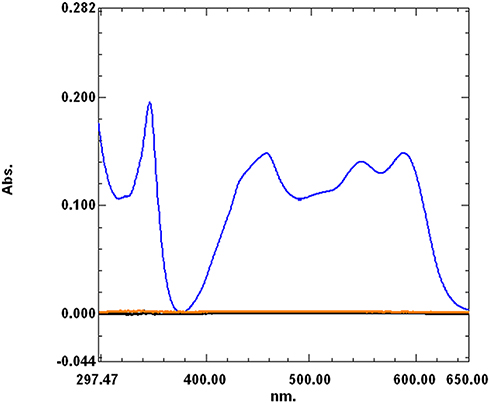 |
Figure 6 Scan spectrum of the complex (40 ppm NSG–DDQ, blue color), drug (40 ppm, black color), and DDQ (1 mg/mL, red color) against acetonitrile as a blank. |
Molecular Composition of NSG–DDQ Complexes
The molar ratio of the complex was assessed by a spectrophotometric method (Job's method).21 NSG reacts with DDQ with a 1:1 M ratio, as presented in Figure 7.
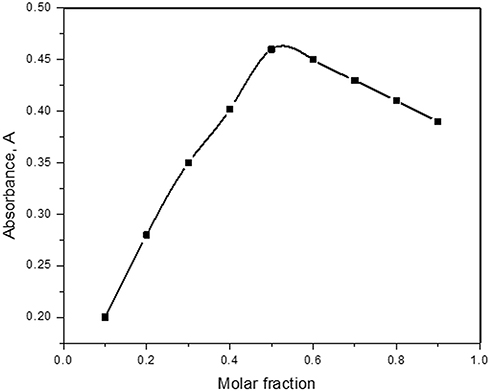 |
Figure 7 Molar ratio method (Job’s method) (1 × 10⁻³M) for NSG–DDQ complex. |
Formation Constant
Several methods have been proposed for the estimation of the equilibrium constants and molar absorption coefficient of CT complexes.13,27,31 The first method for determination of the equilibrium constant of 1:1 complexes in solution is that of the Benesi–Hildebrand relation.30 The modified Benesi–Hildebrand method30 is represented by the following equation:

where [A] is the “molar concentration of the acceptor (DDQ) 0.000044 M, [D] is the molar concentration of the donor (NSG)”, A is the absorbance of the NSG–DDQ complex at λmax, Ɛ is the “molar absorptivity” of the NSG–DDQ complex, and KC is the “association constant of the complex (L mol−1)”. A straight line was obtained (r2= 0.9725) and confirmed our finding of the formation of a 1:1 CT complex. The values of correlation coefficient, KC, and Ɛ for the CT complex (NSG → DDQ) were estimated from the plot of [A]/A against l/[D]10–12 (Figure 8). Table 4 shows the data obtained using the Benesi–Hildebrand equation. The value of Ɛ was calculated from the intercept (1 / Ɛ = intercept) and KC was calculated from the slope of the resulting line (slope = 1 / KC.Ɛ). Ɛ and KC of the complex (NSG–DDQ) in acetonitrile were estimated to be 1.6 × 10⁴ and 6.2 × 10³ L mol−1 cm−1 respectively. The formation constant value indicate the formation of stable CT complex, which agrees with reported values of some CT complexes.13,27,30
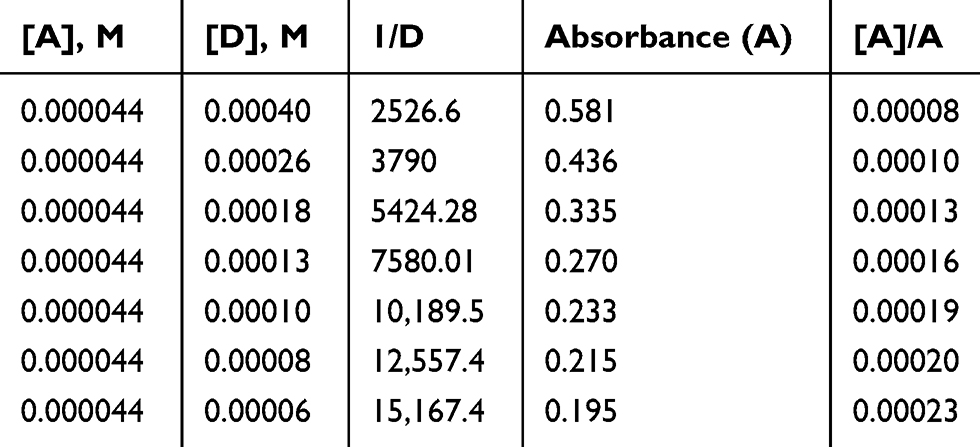 |
Table 4 Benesi–Hildebrand Data of NSG–DDQ Complex |
 |
Figure 8 The 1:1 Benesi–Hildebrand plot for NSG–DDQ systems. |
Spectroscopic Physical Parameters
To confirm the formation of the NSG–DDQ complex and stability, we calculated and analyzed some of the spectroscopic physical parameters. For example, oscillator strength (f)31 and transition dipole moment32 (μ, measured in Debye) were used to measure the integrated strength of the CT bands31 of the formed complex,32 using the following equations:
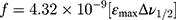
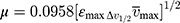
where,  is the bandwidth at half intensity (cm−1), εmax is the “molar extinction coefficient (L mol−1cm−1),” and
  is the “wavenumber at the absorption maximum of the formed complex (cm−1).” The high interaction between NSG and DDQ is indicated by the relatively high values of f (6.38). The high value of the transition dipole moment (24.93 Debye) indicates the formation of strong bonding between NSG with DDQ which confirms the formation of the NSG–DDQ complex.
Ionization Potential (IP)
Ionization potential (IP) of the NSG donor was assessed using the Aloisi and Pignataro equation:33

where  is the “wavenumber (cm−1)” related to the CT band formed due to the reaction between NSG and the acceptors. The IP value of CT complex formation is 9.086 (Table 3). The electron donation potential of NSG is indicated by its IP. As the IP decreases, the electron donation power of NSG increases and the stability of the NSG–DDQ complex increases.
Energy of CT Complex (ECT)
The energy of the NSG–DDQ complex (ECT) was calculated using the following equation:34

where λCT is the maximum wavelength of the examined complex. The estimated value ECT is 2.7 (Table 5). As the energy of the interaction between NSG and the acceptors decreases, the stability of the NSG–DDQ complex increases.
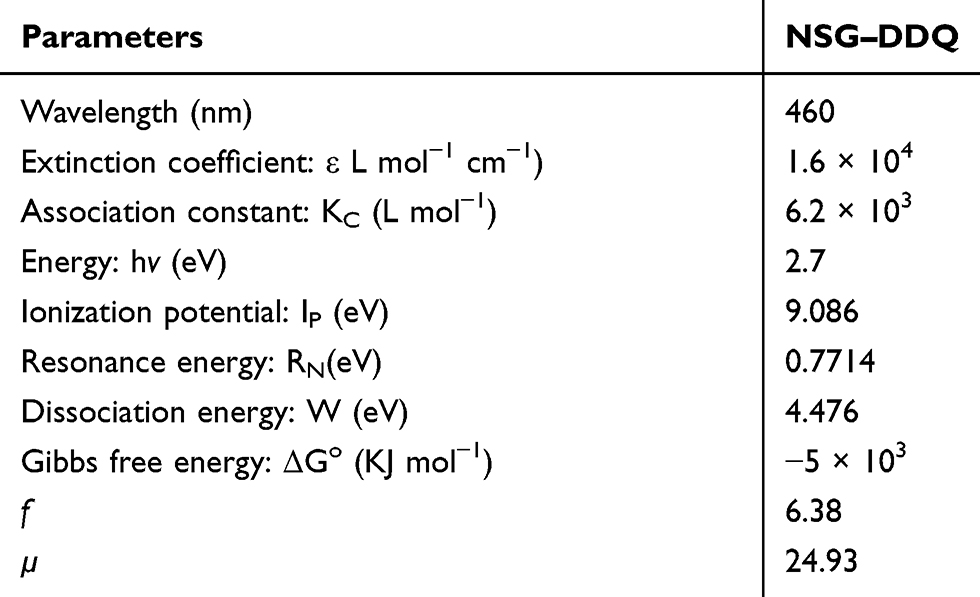 |
Table 5 Spectroscopic Parameters of NSG–DDQ Complex |
Resonance Energy (RN)
The resonance energy of the NSG–DDQ complex was estimated according to the equation presented by Briegleb and Czekalla.35 The value of resonance energy is presented in Table 5.

where εmax is the “molar absorptivity of the NSG–DDQ complex” and RN is the “resonance energy of the NSG–DDQ complex” in the ground state.
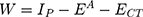
Dissociation Energy (W)
Another parameter to confirm the NSG–DDQ complex formation is the dissociation energy, which indicates the nature of the NSG–DDQ complex. The dissociation energy (W) of the CT complex was estimated using the corresponding NSG–DDQ energy (ECT), IP, and EA, as shown in the following equation. The estimated values is 4.476 and is listed in Table 5.
Standard Free Energy Change (ΔG°)
To further verify the NSG–DDQ complex formation, the standard free energy ΔG° was determined and is recorded in Table 5. The higher negative value suggests that CT complex formation between NSG and DDQ (acceptor) is exothermic. Usually, estimations of ΔG° are progressively negative; as the NSG–DDQ interaction between the donor and acceptors becomes stronger, KCT increases. Consequently, the complex composition has a lower degree of freedom and the values of ΔG° become highly negative values.34 ΔG° is calculated from KCT using the following equation:
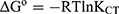
where ΔG° is determined in KJ mol−1, R is the gas constant (1.987 cal mol−1K−1), T is “total temperature (Kelvin)”, and KCT is the “formation constant of the CT complex” at room temperature. A negative ΔG° indicate a spontaneous reaction between NSG and the acceptors (DDQ). The value of standard free energy of the NSG–DDQ complex is –5×10³ KJ mol−1.
Determination of Neostigmine
The spectrophotometric determination of NSG was carried out based on the formation of NSG–DDQ complex at 460 nm (maximum wavelength) (Figure 1). The calibration of NSG was in the range 5−120 ppm. The correlation coefficient (r2) was 0.9967 and molar extinction coefficient (∈ = 1.6 × 10⁴ L mol−1 cm−1). The calibration curve equation was y = ax + b, where a is the slope (0.0041) and b is the intercept (0.1007). The lower limit of quantification and detection was 5 and 1.5 ppm, respectively. The analytical characterization of the investigation method is listed in Table 6.
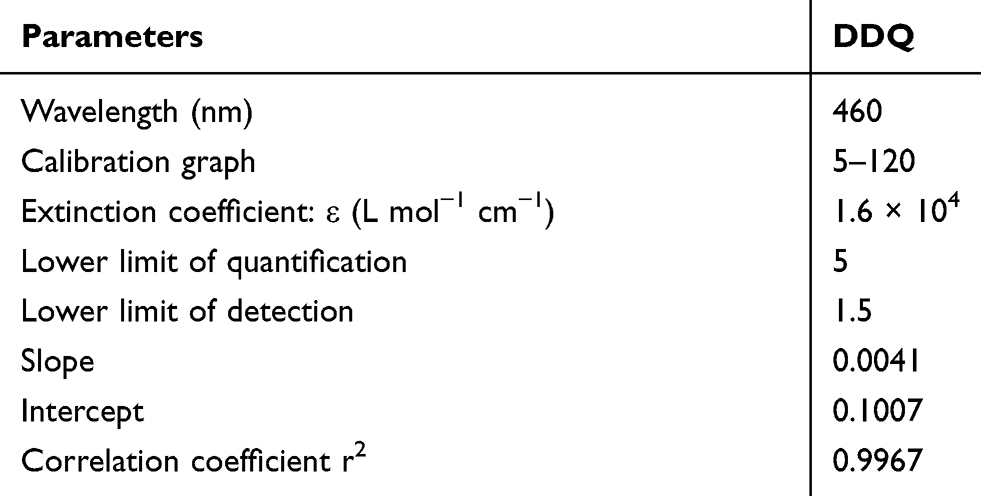 |
Table 6 Spectrophotometric Characterization Parameters of NSG with DDQ |
Antimicrobial Activity
NSG–DDQ showed good antibacterial activity, it is active against Gram-positive bacteria (Staphylococcus aureus ATCC 29213 and Bacillus subtilis ATCC 10400) and Gram-negative bacteria including (E. coli ATCC 10418 and Pseudomonas aeruginosa ATCC 27853). In addition, NSG–DDQ showed good activity against fungi (Candida albicans ATCC 10231). On the other hand, NSG showed no antibacterial activity against tested strains but showed an activity against Candida albicans ATCC 10231. The MIC results of the NSG–DDQ complex compared with the those of NSG and reference materials are presented in Table 7. The results indicate that the NSG–DDQ showed more biological activity compared with NSG.
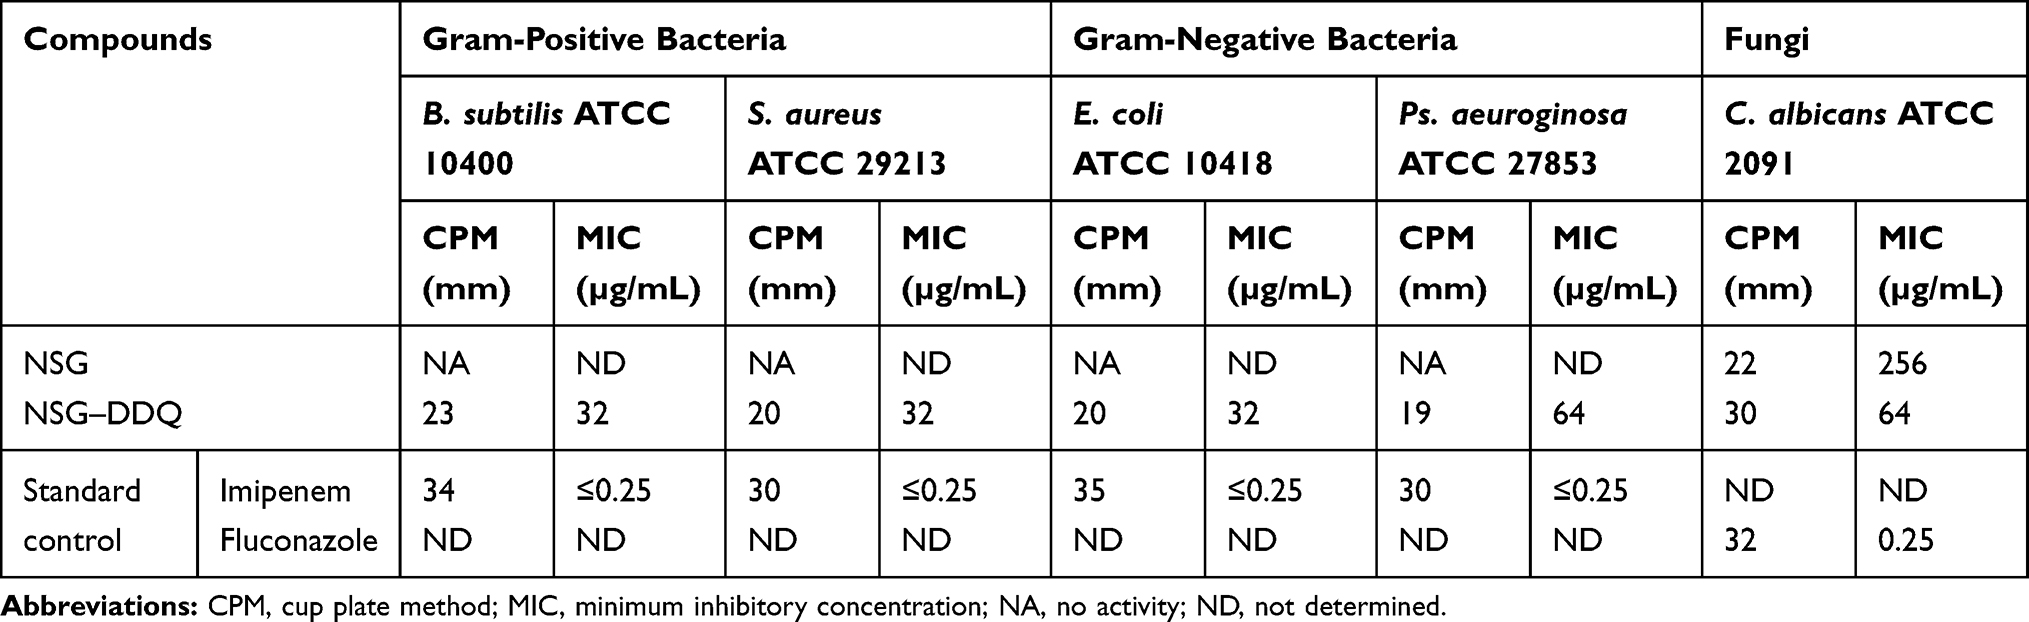 |
Table 7 Results of Cup-Plate Method and Minimum Inhibitory Concentrations (MIC) of Drug (NSG) and CT Complex (NSG–DDQ) |
Computational Studies
Geometry Optimization
Using the 6–311++G(d,p) method, we performed a full geometry optimization of NSG, DDQ, and the CT complexes. A description of the molecular structures, atom numbering, and hydrogen bonding interactions of the complexes is shown in Figure 9. The donor NSG molecule approaches the acceptor molecule DDQ from its tertiary amine side. As illustrated in Figure 9, the NSG–DDQ complex structure is stabilized by two H-bonds, O(25) H–C(13) (2.2582 Å), O(24) H–C(14) (2.7813 Å). These H-bonds regulate the DDQ’s position near the amide C=O group; more active donor sites are provided by Mulliken charges (Figure 10) and MEP maps (discussed in a subsequent section).
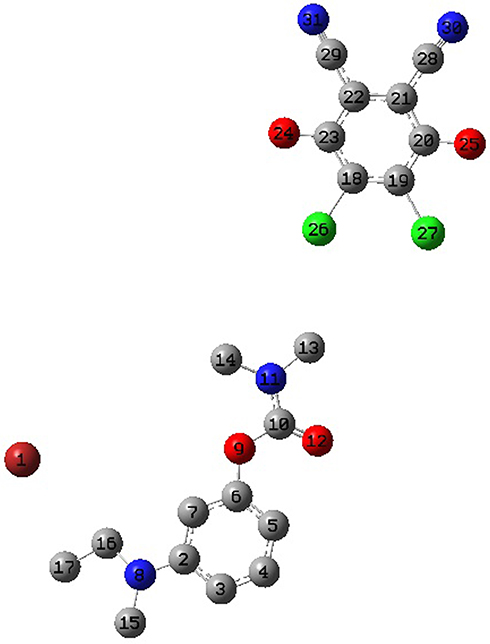 |
Figure 9 Optimized structures of NSG charge transfer complexes. |
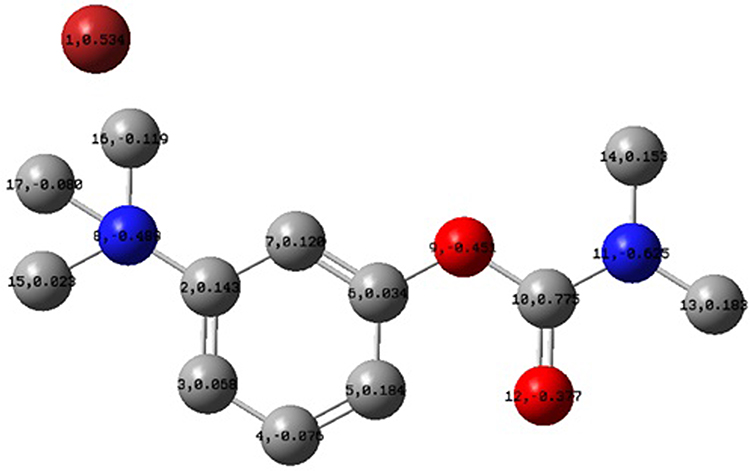 |
Figure 10 Mulliken atomic charges of neostigmine. |
A lengthening of the NSG bonds was observed due to the CT complex formation, specifically for C(10)–N(11) and N(11)–C(13) and N(11)–C(14) by 0.00783, 0.00562, and 0.00693 Å, respectively. Conversely, a decrease of 0.00432 and 0.00117 Å in the lengths of C(20)–C(21) and C(22)––C(23) was observed in the DDQ moiety following the lengthening of C=O groups and the formation of double bonds. Figure 10 shows that N(11) bears the most negative charge, suggesting that DDQ (electron acceptor) has a high possibility of offering electrons. In the solvent, the UV–Vis absorption spectrum should be calculated to understand the nature of the electronic structure and compared directly with available experimental data to investigate the sensitivity of the electronic structure to the solvent. It is known that with TD-DFT functional theory36,37 a reliable determination of UV–Vis absorption spectra is possible. The frontier molecular orbital (FMO) energies and descriptions are given in Figure 11. To determine the nature of each electronic transition, the compositions of molecular orbitals are necessary. For example, if the occupied orbital is from the acceptor and the unfilled orbital from the donor, the corresponding energy could be assigned to the CT process. However, when both the occupied and unfilled orbitals are located on the same moiety, it should be referred to as an internal transition within either the acceptor or the donor system. The stimulated TD-B3LYP spectrum (Figure 12) of the CT complex is in good agreement with the experimental spectrum. It is characterized by three bands at 618 (580 exp), 408 (460 exp), and 402 (420 exp) nm to HOMO-7 → HOMO-1, HOMO-7 → HOMO, and HOMO-8 → HOMO. HOMO-7, HOMO-1, and HOMO predominantly show the π-system of the electron donor drug molecule. Thus, within the drug molecule, the lowest energy band is assigned to the π–π* transition. Alternatively, the 408 nm band is allocated to the charge transition from NSG to the DDQ.
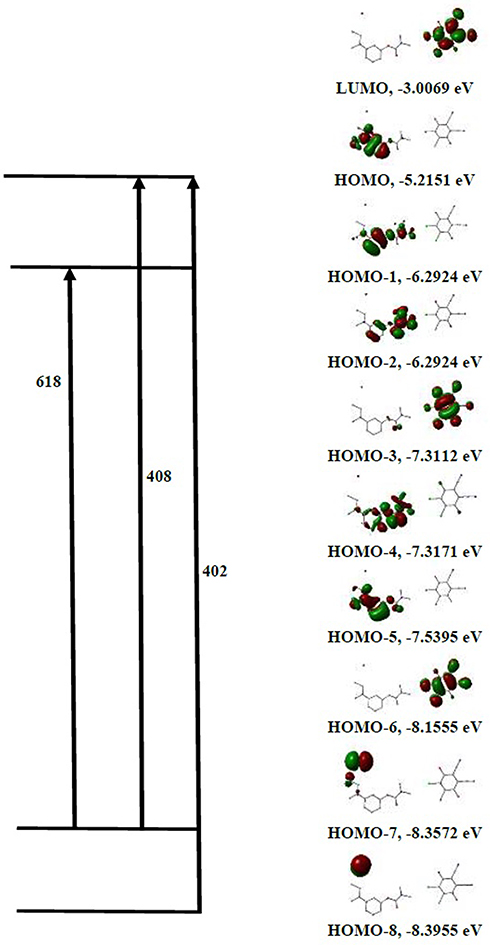 |
Figure 11 Assignments of theoretical electronic absorption transitions of NSG → DDQ charge transfer complexes. |
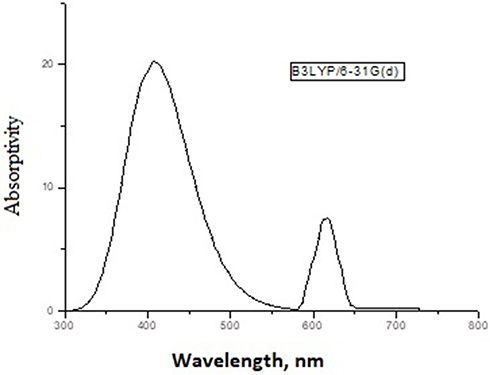 |
Figure 12 Theoretical electronic absorption spectra of NSG → DDQ calculated at TD-B3LYP. |
Molecular Electrostatic Potential
When investigating the reactive sites for electrophilic attacks, nucleophilic reactions, or H-bonding interactions, the molecular electrostatic potential map is vital.38 Specific electrostatic potential values are marked with different colors. The color map used is follows: red ˂ orange ˂ yellow ˂ green ˂ blue. As shown in Figure 13, the MEP map of DDQ shows a positive region, in blue color, in the center of the ring whereas negative potential areas localized on the C=O group. Therefore, a negative potential is found primarily in the dimethylamino group, which may be involved in the H-bond with the molecule of the electron donor, which will be the active site in the process of load transfer. After the DDQ molecules approach the NSG molecule, the positive areas are converted into negative (green color), which suggests a CT cycle from the dimethylamino group to the acceptor molecule’s π-system.
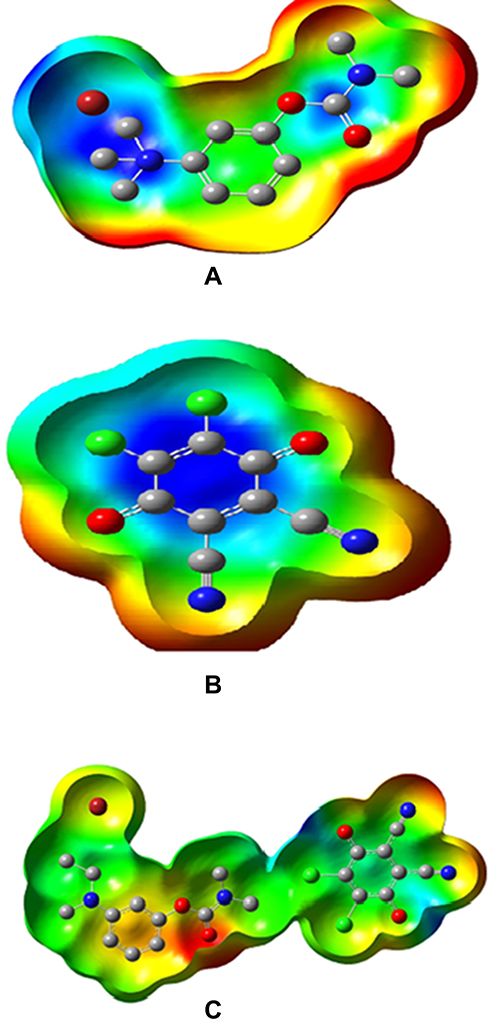 |
Figure 13 Molecular electrostatic potential maps of (A) NSG, (B) DDQ, and (C) NSG → DDQ. |
Natural Bonding Orbital (NBO)
Natural bonding orbital (NBO) analysis provides an efficient theoretical information about intra and intermolecular charge transfer (ICT) and a valuable information about conjugation and hyperconjugation of the molecular system. NBO analysis is the key to identify the weak interaction. The charge densities for DDQ and NSG are shown in Figure 14. The negative charge is delocalized on oxygen atoms of DDQ (donor molecule) due to their donating ability while N(11) almost carries no charge because of their accepting ability. The distribution of atomic charges is also important in the determination of the direction of the dipole moment vector in the complex which depends on the centers of negative and positive charges.
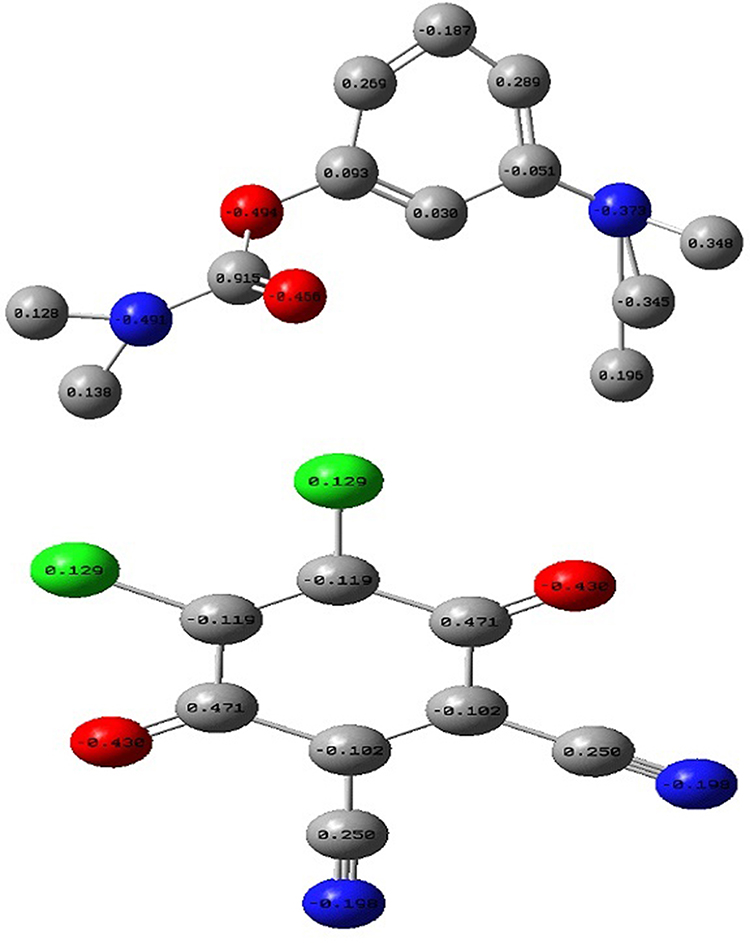 |
Figure 14 The natural bonding orbital charge density for DDQ and NSG. |
Conclusion
Herein, we have described the synthesis, characterization, and antimicrobial activity of the CT complex of NSG–DDQ. The chemical composition of the NSG–DDQ complex was examined and confirmed using spectrophotometry, IR, and NMR spectroscopy. The molecular arrangement of the NSG–DDQ complex in liquid is compatible with that of solid state, with a NSG:DDQ ratio of 1:1. Different physical factors of the NSG–DDQ complexes such as KCT and εCT as well as spectroscopic parameters were calculated. The value for KCT was derived using the Benesi–Hildebrand equation. The studied NSG–DDQ reaction was utilized as a colorimetric method to assay NSG over a wide calibration range. Quantum chemical calculations (optimization, Mulliken charge, and MEP maps) were performed using DFT/B3LYP to further study the H-bond interactions, hybridization, and NSG–DDQ charging distributions. The NSG–DDQ complex showed both antibacterial and antifungal activity while NSG showed only antifugal activity. The antimicrobial activity of the NSG–DDQ (antibacterial and antifungal activities) showed the best biological activity compared with NSG. Therefore, NSG can be used as selective antifungal agent while NSG–DDQ complex can be used as a non-selective antibacterial and antifungal agent.
Acknowledgments
The authors extend their appreciation to the Deanship of Scientific Research at King Saud University for funding the work through the research group project No. RGP-1436-024.
Disclosure
The authors report no conflicts of interest for this work.
References
1. Murugesan V, Saravanabhavan M, Sekar M. Synthesis, spectroscopic characterization and structural investigation of a new charge transfer complex of 2, 6-diaminopyridine with 4-nitrophenylacetic acid: antimicrobial, DNA binding/cleavage and antioxidant studies. Spectrochim Acta A. 2015;147:99–106. doi:10.1016/j.saa.2015.03.083
2. Miyan L, Ahmad A, Alam MF, Younus H. Synthesis, single-crystal, DNA interaction, spectrophotometric and spectroscopic characterization of the hydrogen-bonded charge transfer complex of 2-aminopyrimidine with π-acceptor chloranilic acid at different temperature in acetonitrile. J Photochem Photobiol B. 2017;174:195–208. doi:10.1016/j.jphotobiol.2017.07.002
3. Singaravelan K, Chandramohan A, Saravanabhavan M, Enoch IMV, Suganthi VS. Hydrogen bonded charge transfer molecular salt (4-chloro anilinium-3-nitrophthalate) for photophysical and pharmacological applications. Spectrochim Acta A. 2017;184:318–326. doi:10.1016/j.saa.2017.05.016
4. Singh N, Khan IM, Ahmad A, Javed S. Synthesis and dynamics of a novel proton transfer complex containing 3, 5-dimethylpyrazole as a donor and 2, 4-dinitro-1-naphthol as an acceptor: crystallographic, UV-visible spectrophotometric, molecular docking and Hirshfeld surface analyses. New J Chem. 2017;41(14):6810–6821. doi:10.1039/C7NJ00819H
5. Bai H, Wang Y, Cheng P, Li Y, Zhu D, Zhan X. Acceptor-donor-acceptor small molecules based on indacenodithiophene for efficient organic solar cells. ACS Appl Mater Interfaces. 2014;6(11):8426–8433. doi:10.1021/am501316y
6. Yakuphanoglu F, Arslan M. The fundamental absorption edge and optical constants of some charge transfer compounds. Opt Mater (Amst). 2004;27(1):29–37. doi:10.1016/j.optmat.2004.01.017
7. Kusuma H, Sugihara H. Theoretical studies of 1: 1 charge-transfer complexes between nitrogen-containing heterocycles and I2 molecules, and implications on the performance of dye-sensitized solar cel. J Photochem Photobiol a Chem. 2006;181(2–3):268–273. doi:10.1016/j.jphotochem.2005.12.008
8. Miyan L, Khan IM, Ahmad A. Synthesis, and spectroscopic studies of charge transfer complex of 1, 2-dimethylimidazole as an electron donor with π-acceptor 2, 4-dinitro-1-naphthol in different polar solvents. Spectrochim Acta A. 2015;146:240–248. doi:10.1016/j.saa.2015.02.060
9. Karmakar A, Singh B. Spectroscopic and theoretical studies of charge-transfer interaction of 1-(2-pyridylazo)-2-napthol with nitroaromatics. Spectrochim Acta A. 2017;179:110–119. doi:10.1016/j.saa.2017.01.047
10. Karmakar A, Singh B. Charge-transfer interaction of 4-(2-pyridylazo) resorcinol with nitroaromatics: insights from experimental and theoretical results. J Mol Liq. 2017;236:135–143. doi:10.1016/j.molliq.2017.04.005
11. Karmakar A, Kundu K, Ghosh S, Mukhopadhyay C, Nayek SK, Chaudhuri T. Recognition of steric factor in external association of xanthenocrown-5 and bis-napthalenocrown-6 with bis (benzimidazolium) propane borontetrafluoride. Spectrochim Acta A. 2016;159:141–145. doi:10.1016/j.saa.2016.01.037
12. Chaudhuri T, Shivran N, Mula S, et al. Bodipy recognizes polyaromatic hydrocarbons via C–H... F type weak H-bonding. RSC Adv. 2016;6(64):59237–59241. doi:10.1039/C5RA27748E
13. El-Sheshtawy HS, Ibrahim MM, Aly MR, El-Kemary M. Spectroscopic and structure investigation of the molecular complexes of tris (2-aminoethyl) amine with π-acceptors. J Mol Liq. 2016;213:82–91. doi:10.1016/j.molliq.2015.11.012
14. Alanazi A, Abounassif M, AlRabiah H, Mostafa GAE. Development of two charge transfer complex spectrophotometric methods for determination of tofisopam in tablet dosage form. Trop J Pharm Res. 2016;15(5):995–1001. doi:10.4314/tjpr.v15i5.14
15. Al-Badr A, Mostafa GAE. Spectrophotometric determination of trimipramine in tablet dosage form via charge transfer complex formation. Trop J Pharm Res. 2013;12(6):1057–1063. doi:10.4314/tjpr.v12i6.29
16. Kololkovas A. Essentials of Medicinal Chemistry.
17. Mandal R, Lahiri SC. Interactions of L-amino acids with metronidazole and tinidazole. J Indian Chem Soc. 1999;76:347–349.
18. Martindale SS. The Complete Drug Reference.
19. Ricciardi R, Rossi B, Nicora M, Sghirlanzoni A, Muratorio A. Acute treatment of myasthenia gravis with intranasal neostigmine: clinical and electromyographic evaluation. J Neurol Neurosurg Psychiatry. 1991;54(12):1061–1062. doi:10.1136/jnnp.54.12.1061
20. Neely GA, Kohli A. Neostigmine. StatPearls Publishing; 2018.
21. Job P. Advanced physicochemical experiments. Edinburgh: oliner and boyd. Ann Chem. 1964;1963(16):97.
22. Khan IM, Islam M, Shakya S, Alam K, Alam N, Shahid M. Synthesis, characterization, antimicrobial and DNA binding properties of an organic charge transfer complex obtained from pyrazole and chloranilic acid. Bioorg Chem. 2020;99:103779. doi:10.1016/j.bioorg.2020.103779
23. The European committee on antimicrobial susceptibility testing –EUCAST. 2019.
24. Frisch MJ, Trucks GW, Schlegel HB, et al. GAUSSIAN 03. Revision A. 7. Pittsburgh (PA): Gaussian. Inc.; 2003.
25. Shehab OR, AlRabiah H, Abdel-Aziz HA, Mostafa GAE. Charge-transfer complexes of cefpodoxime proxetil with chloranilic acid and 2,3-dichloro-5,6-dicyano-1,4-benzoquinone: experimental and theoretical studies. J Mol Liq. 2018;257:42–51. doi:10.1016/j.molliq.2018.02.083
26. Demirhan M, Arslan M, Zengin M, Kucukislamoglu M. Investigation of charge transfer complexes formed between mirtazapine and some π-acceptors. J Spectrosc. 2013;7.
27. AlRabiah H, Abdel-Aziz HA, Mostafa GAE. Charge transfer complexes of brucine with chloranilic acid, 2,3-dichloro-5,6-dicyano-1,4-benzoquinone and tetracyanoquinodimethane: synthesis, spectroscopic characterization and antimicrobial activity. J Mol Liq. 2019;286:11074–11085. doi:10.1016/j.molliq.2019.04.031
28. Khan IM, Alam K, Alam MJ. Exploring charge transfer dynamics and photocatalytic behavior of designed donor-acceptor complex: characterization, spectrophotometric and theoretical studies (DFT/TD-DFT). J Mol Liq. 2020;310:113213. doi:10.1016/j.molliq.2020.113213
29. Porst H, Kny L. The structure of degradation products of neostigmine bromide. Pharmazie. 1985;40(5):325–328.
30. Benesi HA, Hildebrand JA. Spectrophotometric investigation of the interaction of iodine with aromatic hydrocarbons. J Am Chem Soc. 1949;71(8):2703–2707. doi:10.1021/ja01176a030
31. Al-Ahmary KM, Soliman SM, Mekheimer RA, Habeeb MM, Alenezi MS. Synthesis, spectral studies and DFT computational analysis of hydrogen bonded-charge transfer complex between chloranilic acid with 2, 4-diamino-quinoline-3-carbonitrile in different polar solvents. J Mol Liq. 2017;231:602–619. doi:10.1016/j.molliq.2017.02.038
32. Refat MS, Saad HA, Adam AMA. Spectral, thermal and kinetic studies of charge transfer complexes formed between the highly effective antibiotic drug metronidazole and two types of acceptors: σ-and π-acceptors. Spectrochim Acta A. 2015;141:202–210. doi:10.1016/j.saa.2015.01.029
33. Aloisi GG, Pignataro S. Molecular complexes of substituted thiophens with σ and π-acceptors. Charge transfer spectra and ionization potentials of the donors. Faraday Trans. 1973;169:534–539. doi:10.1039/f19736900534
34. Refat MS, Adam AMA, Saad HA. Utility of charge-transfer complexation for the assessment of macrocyclic polyethers: spectroscopic, thermal and surface morphology characteristics of two highly crown ethers complexed with acido acceptors. J Mol Struct. 2015;1085:178–190. doi:10.1016/j.molstruc.2014.12.078
35. Briegleb G, Czekalla J. Die Intensität von Elektronenüberführungsbanden in Elektronen-Donator-Akzeptor-Komplexen 1. Z Phys Chem (N F). 1960;24(1_2):37–54. doi:10.1524/zpch.1960.24.1_2.037
36. Gross EK, Dobson JF, Petersilka M. Density Functional Theory of Time-Dependent Phenomena; Density Functional Theory II. Berlin, Heidelberg: Springer; 1996:81–172.
37. Casida ME. Recent Advances in Density Functional Methods, Part I. Chong DP, edited by. Singapore: World Scientific; 1995:115.
38. Shehab OR, Mansour AM. Sparfloxacin charge transfer complexes with2,3-dichloro-5,6-dicyano-1,4-benzoquinone and tetracyanoquinodimethane: molecular structures, spectral, and DFT studies. J Mol Struct. 2015;1093:186–194. doi:10.1016/j.molstruc.2015.03.048
 © 2020 The Author(s). This work is published and licensed by Dove Medical Press Limited. The full terms of this license are available at https://www.dovepress.com/terms.php and incorporate the Creative Commons Attribution - Non Commercial (unported, v3.0) License.
By accessing the work you hereby accept the Terms. Non-commercial uses of the work are permitted without any further permission from Dove Medical Press Limited, provided the work is properly attributed. For permission for commercial use of this work, please see paragraphs 4.2 and 5 of our Terms.
© 2020 The Author(s). This work is published and licensed by Dove Medical Press Limited. The full terms of this license are available at https://www.dovepress.com/terms.php and incorporate the Creative Commons Attribution - Non Commercial (unported, v3.0) License.
By accessing the work you hereby accept the Terms. Non-commercial uses of the work are permitted without any further permission from Dove Medical Press Limited, provided the work is properly attributed. For permission for commercial use of this work, please see paragraphs 4.2 and 5 of our Terms.