")
Back to Journals » Journal of Inflammation Research » Volume 15
Characterization of the TCR β Chain Repertoire in Peripheral Blood from Hepatitis B Vaccine Responders and Non-Responders
Authors Yang J , Li Y, Ye J , Wang J, Lu H, Yao X
Received 4 November 2021
Accepted for publication 26 January 2022
Published 14 February 2022 Volume 2022:15 Pages 939—951
DOI https://doi.org/10.2147/JIR.S347702
Checked for plagiarism Yes
Review by Single anonymous peer review
Peer reviewer comments 2
Editor who approved publication: Professor Ning Quan
Jiezuan Yang,1 Yongtao Li,1 Jing Ye,2 Ju Wang,1 Haifeng Lu,1 Xinsheng Yao3
1State Key Laboratory for Diagnosis and Treatment of Infectious Diseases, The First Affiliated Hospital, Zhejiang University School of Medicine, National Clinical Research Center for Infectious Diseases, Hangzhou, People’s Republic of China; 2Department of Surgical ICU, The Children’s Hospital, Zhejiang University School of Medicine, National Clinical Research Center for Child Health, Hangzhou, People’s Republic of China; 3Department of Immunology, Research Center for Medicine & Biology, Innovation & Practice Base for Graduate Students Education, Zunyi Medical University, Zunyi, People’s Republic of China
Correspondence: Jiezuan Yang, State Key Laboratory for Diagnosis and Treatment of Infectious Diseases, The First Affiliated Hospital, Zhejiang University School of Medicine, National Clinical Research Center for Infectious Diseases, 79 Qingchun Road, Hangzhou, 310003, People’s Republic of China, Tel +86 571 87236756, Email [email protected]
Background: Hepatitis B (HepB) vaccination can effectively prevent the prevalence of hepatitis B virus (HBV) infection. However, the incidence of vaccination failure is about 5∼ 10% and the underlying molecular mechanisms are poorly understood. T cells have an essential role in the recipient’s immune response to vaccine, which could be elucidated by high-throughput sequencing (HTS) and bioinformatics analysis.
Methods: We conducted HTS of the T cell receptor β chain (TRB) complementarity-determining region 3 (CDR3) repertoires in eighteen positive responders (responders) and 10 negative responders (non-responders) who all had HepB vaccination, the repertoire features of BV, BJ and V-J genes and their diversity, respectively, were compared between the positive and negative responders using the Mann–Whitney test. Moreover, the relatively conserved motifs in CDR3 were revealed and compared to those in the other group’s report.
Results: The diversity of TRB CDR3 and the frequencies of BV27 and BV7-9 are significantly increased for HepB vaccine responders compared to those in non-responders. The motifs of CDR3s in BV27/J1-1, BV27/J2-5, and BV7-9/J2-5, respectively, were most expressed as “NTE”, “QETQ”, and “GG-Q (E)-ETQ”. Moreover, the motif “KLNSPL” was determined in nearly 80% CDR3s in BV27/J1-6 from HepB vaccine responders for the first time.
Conclusion: Our results present the comprehensive profiles of TRB CDR3 in the HepB vaccine responders and non-responders after standard vaccination protocol and determine the relatively conservative motifs of CDR3s that may respond to the HepB vaccine. Further results suggest that the profile of TRB repertoire could distinguish the HepB vaccine responders from non-responders and provide a new target for optimizing and improving the efficiency of the HepB vaccine.
Keywords: hepatitis B vaccination, hepatitis B surface antibody, complementarity-determining region 3, immune repertoire, high-throughput sequencing
Introduction
Hepatitis B virus (HBV) infection is a global health threat, which affects 257 million people worldwide according to the 2017 Global Hepatitis Report. Chronic HBV infection could progress into liver cirrhosis, hepatocellular carcinoma (HCC), and even liver failure, if the patients could not be treated effectively and in a timely manner.1,2 Vaccination is one of the safest and most effective measures to prevent infectious diseases. Hepatitis B (HepB) vaccination could effectively prevent and control HBV infection and dissemination.3,4 However, about 5~10% of the individuals could not secrete a protective level of anti-hepatitis B surface antibody (anti-HBs) after a standard vaccine course,5 in which the internal mechanisms are far from being fully elucidated. Moreover, there is seldom research into the profile of T cell receptor (TCR, TR) repertoire in recipients of HepB vaccination.6 So that it is urgent to comprehensively and accurately analyze the effect of vaccination on the profile of immune repertoire (IR) of recipients after the vaccine, which could contribute to grasping the molecular mechanism of the recipient responding to the HepB vaccine.7
Following vaccination, antigen-presenting cells (APCs) capture segments from the vaccine (recombinant hepatitis B surface antigen, rHBsAg) that are hydrolyzed after inoculation. Major histocompatibility complex class II (MHC-II) of APCs present the segments to the TCR of CD4+ T cells and activate them, hereafter CD4+ T cells transform into T helper 2 (Th2) cells. Subsequently, the Th2 could activate B cells and the activated B cells differentiate into plasma cells that secrete protective anti-HBs against HBV infection.8 Although CD4+ T cells play an important role in the process of HepB antibody production, the CD8+ T cells are closely related to the immunobiology and pathogenesis of HBV infection.9 Simultaneously, effective vaccination could produce long-lived immune memory cells that are capable of recognizing and rapidly responding to HBV infection again.10
The function of T cells could be represented by the TR on its cell membrane. Most TRs of peripheral blood mature T cells are composed of alpha and beta chains (TRAV, TRBV), and a few consist of gamma and data chains. TRBVs are directly interaction with specific antigen peptide presented by MHC.11,12 There are three high variable regions in TRBV and defined as CDR1, CDR2 and CDR3. Among them, CDR3 is the most variable and directly determines the antigen binding specificity of TRBV. Moreover, CDR3 with different sequences or lengths represents different clonotypes and functions of T cells. Therefore, the analysis of TRBV CDR3 can profile the clonal diversity of T cells and the immune property of the recipients after HepB vaccination.13,14
In the present study, based on the CDR3 property and enlarged cases, we determined the profile of diversity and similarity of TRBV for HepB vaccine responders and non-responders using HTS and bioinformatics analysis, and analyzed the differences of diversity and similarity indices between the two groups and revealed the relatively conservative motifs of dominant CDR3 in HepB vaccine responders. These results provide comprehensive characteristics of TRBV and the special motif of dominant CDR3 in HepB vaccine responders, which would contribute to improving the favorable outcome of the recipients of the vaccination.
Materials and Methods
Subjects
The present study was conducted between March and December in 2019 at the First Affiliated Hospital, Zhejiang University School of Medicine. The peripheral venous blood (PVB) was taken from 135 recipients of HepB vaccination, and the anti-HBs were quantitated in their sera. According to anti-HBs titre (>10 mIU/mL), among 135 recipients, eighteen subjects were selected as positive responders (responders), and 10 subjects (anti-HBs titre <10 mIU/mL) were selected as negative responders (non-responders). In their medical history, each of the 28 subjects was only immunized with three separate 10-µg doses of a recombinant HepB (surface) vaccine (Heptavax-II®; MSD K.K) during their lives. The vaccine was delivered via subcutaneous injections at 0, 1, and 6 months after they were born, and the first vaccination was given within 12 hours of their birth.15 Moreover, the ten non-responders denied that the anti-HBs had been positive (detectable) when they were asked for their vaccination history.
Additionally, the 28 subjects displayed no clinical or laboratory evidence for any illnesses, and did not receive any HepB and non-HepB vaccinations for the duration of the study. Moreover, except positive anti-HBs, the serological HepB markers were all negative in the eighteen responders, however, the HepB markers were all negative (including negative anti-HBs) in the ten non-responders. Moreover, the HBV DNA levels of the 28 subjects were below the detection limit and the more clinical characteristics are shown in Table 1. Additionally, the project and protocols were approved by the ethics committee of the First Affiliate Hospital, Zhejiang University School of Medicine, and complies with the Declaration of Helsinki (2018). The participants approved and signed an informed consent form.
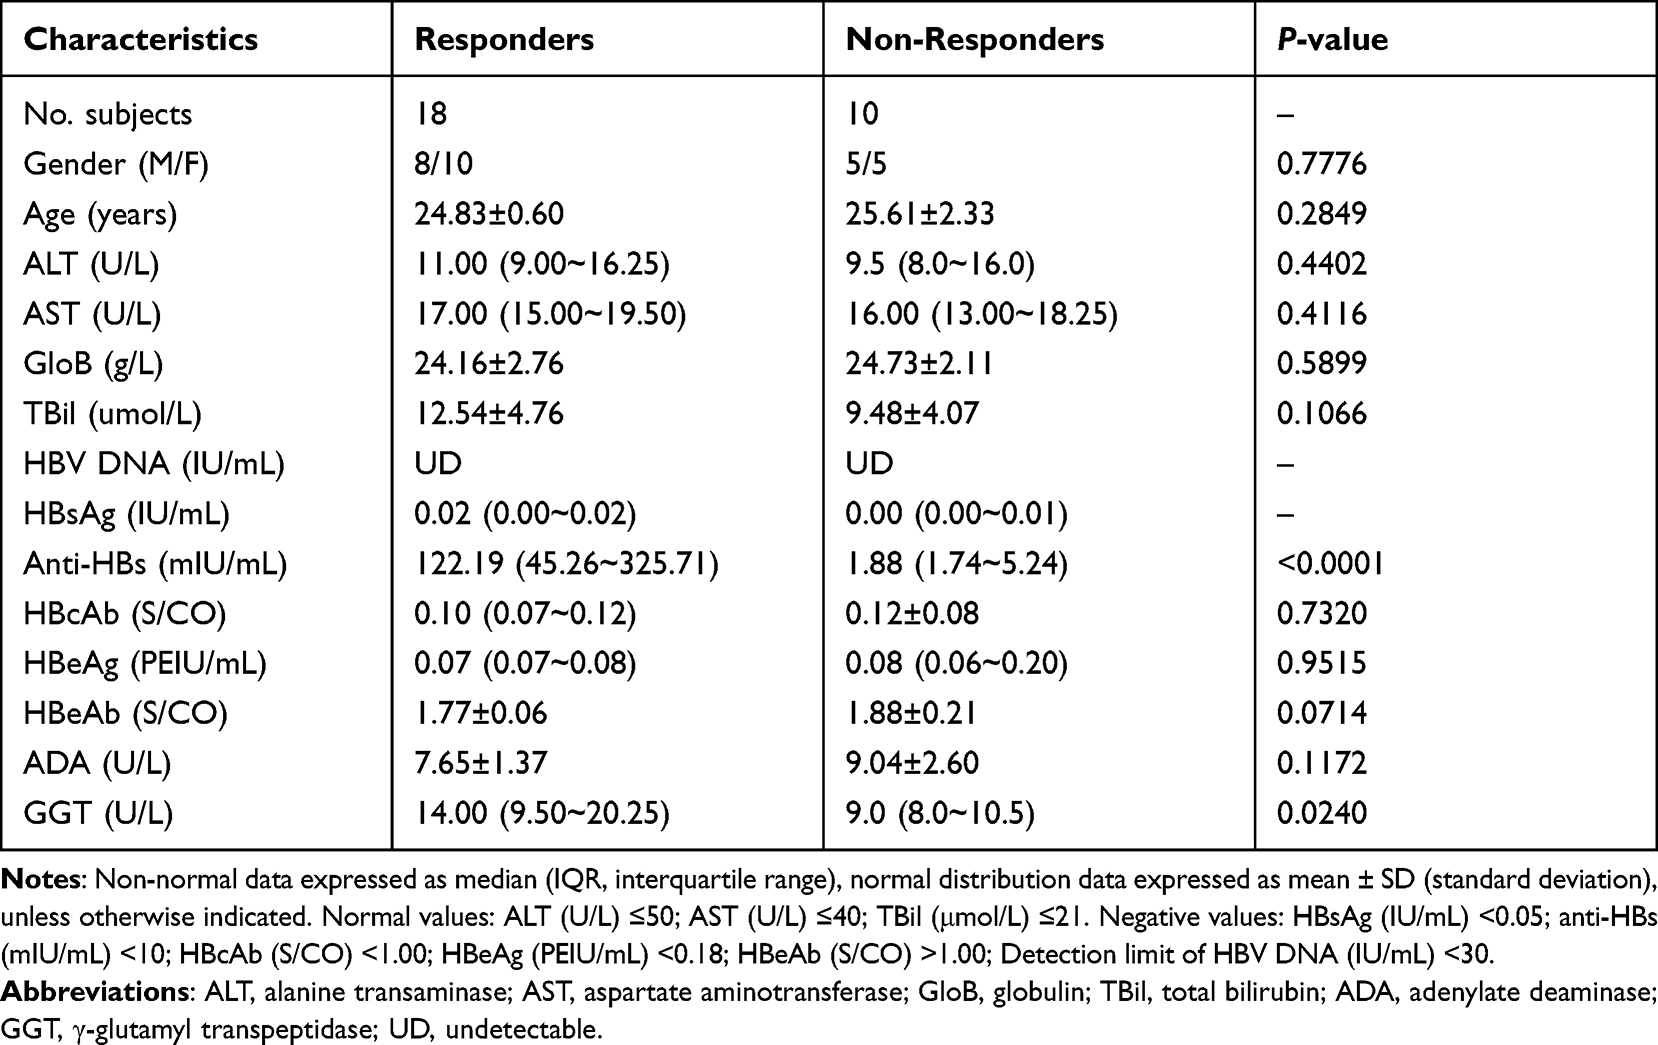 |
Table 1 Demographic and Clinical Characteristics in Hepatitis B Vaccine Responders and Non-Responders |
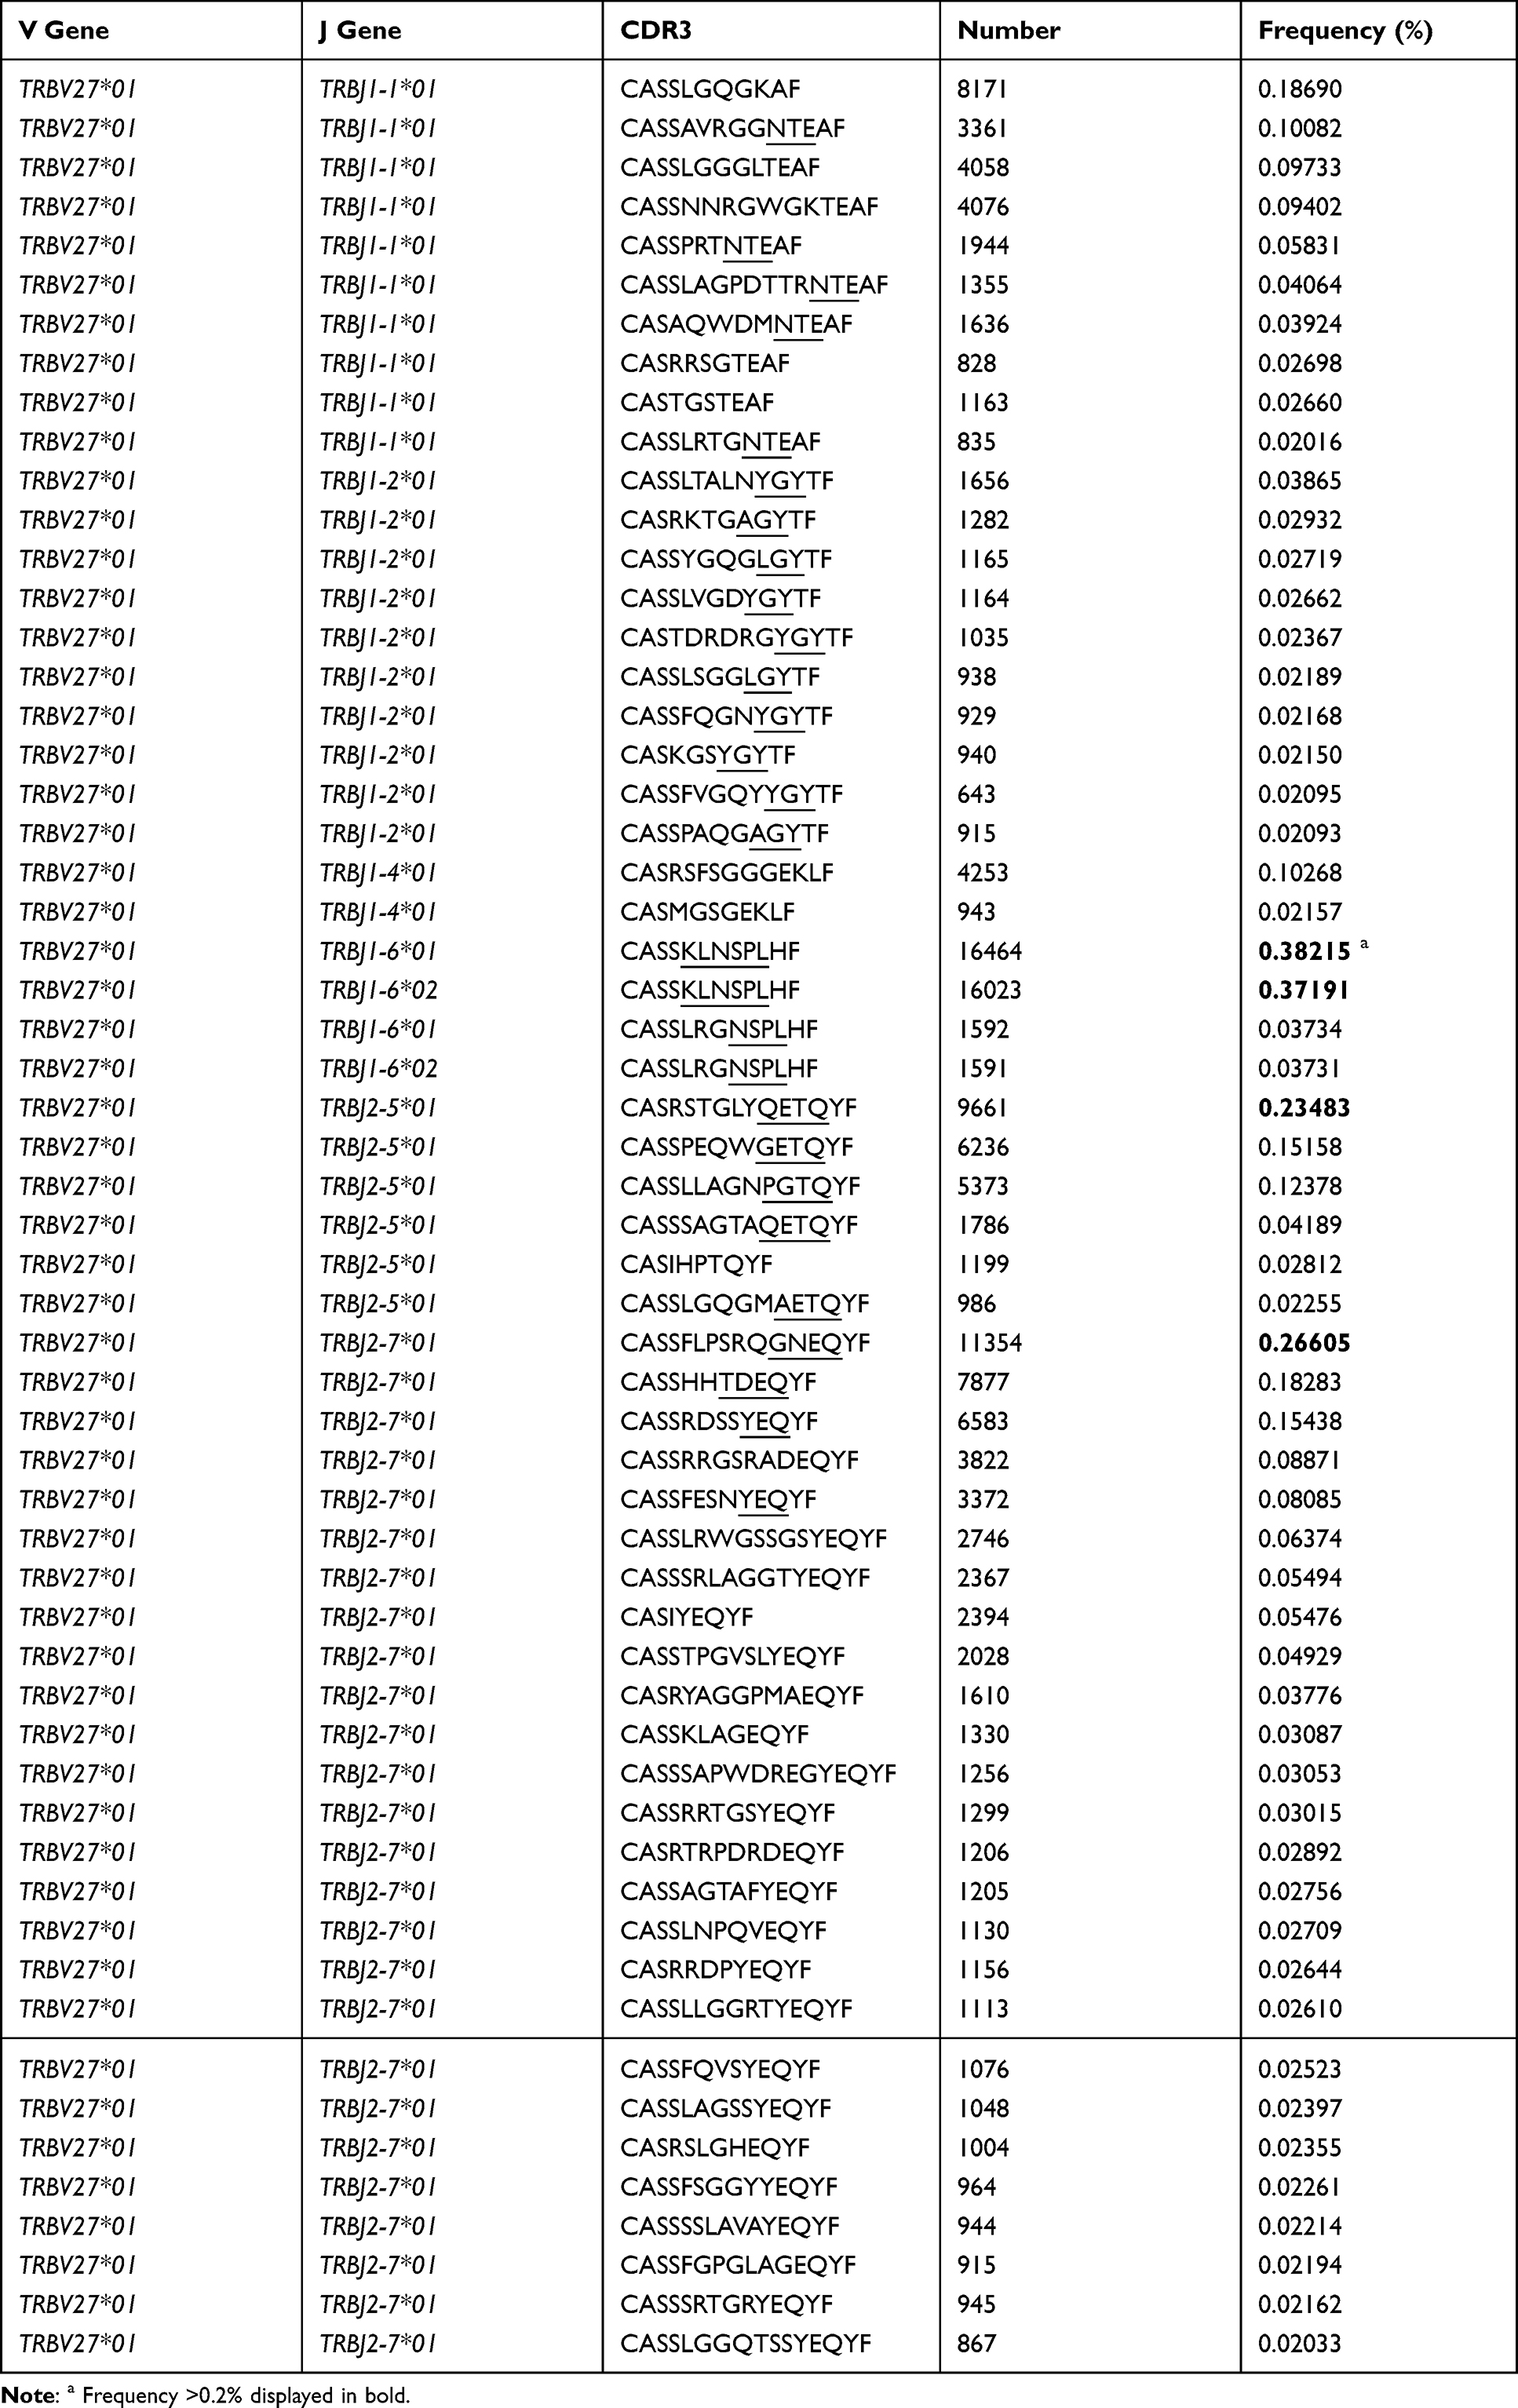 |
Table 2 CDR3 Motif of High Expression in TRBV27 Combined with BJ1-1/J1-2/J1-4/J1-6, and BJ2-5/J2-7 in Hepatitis B Vaccine Responders Compared with Those in Non-Responders (Frequency >0.02% Shown Only) |
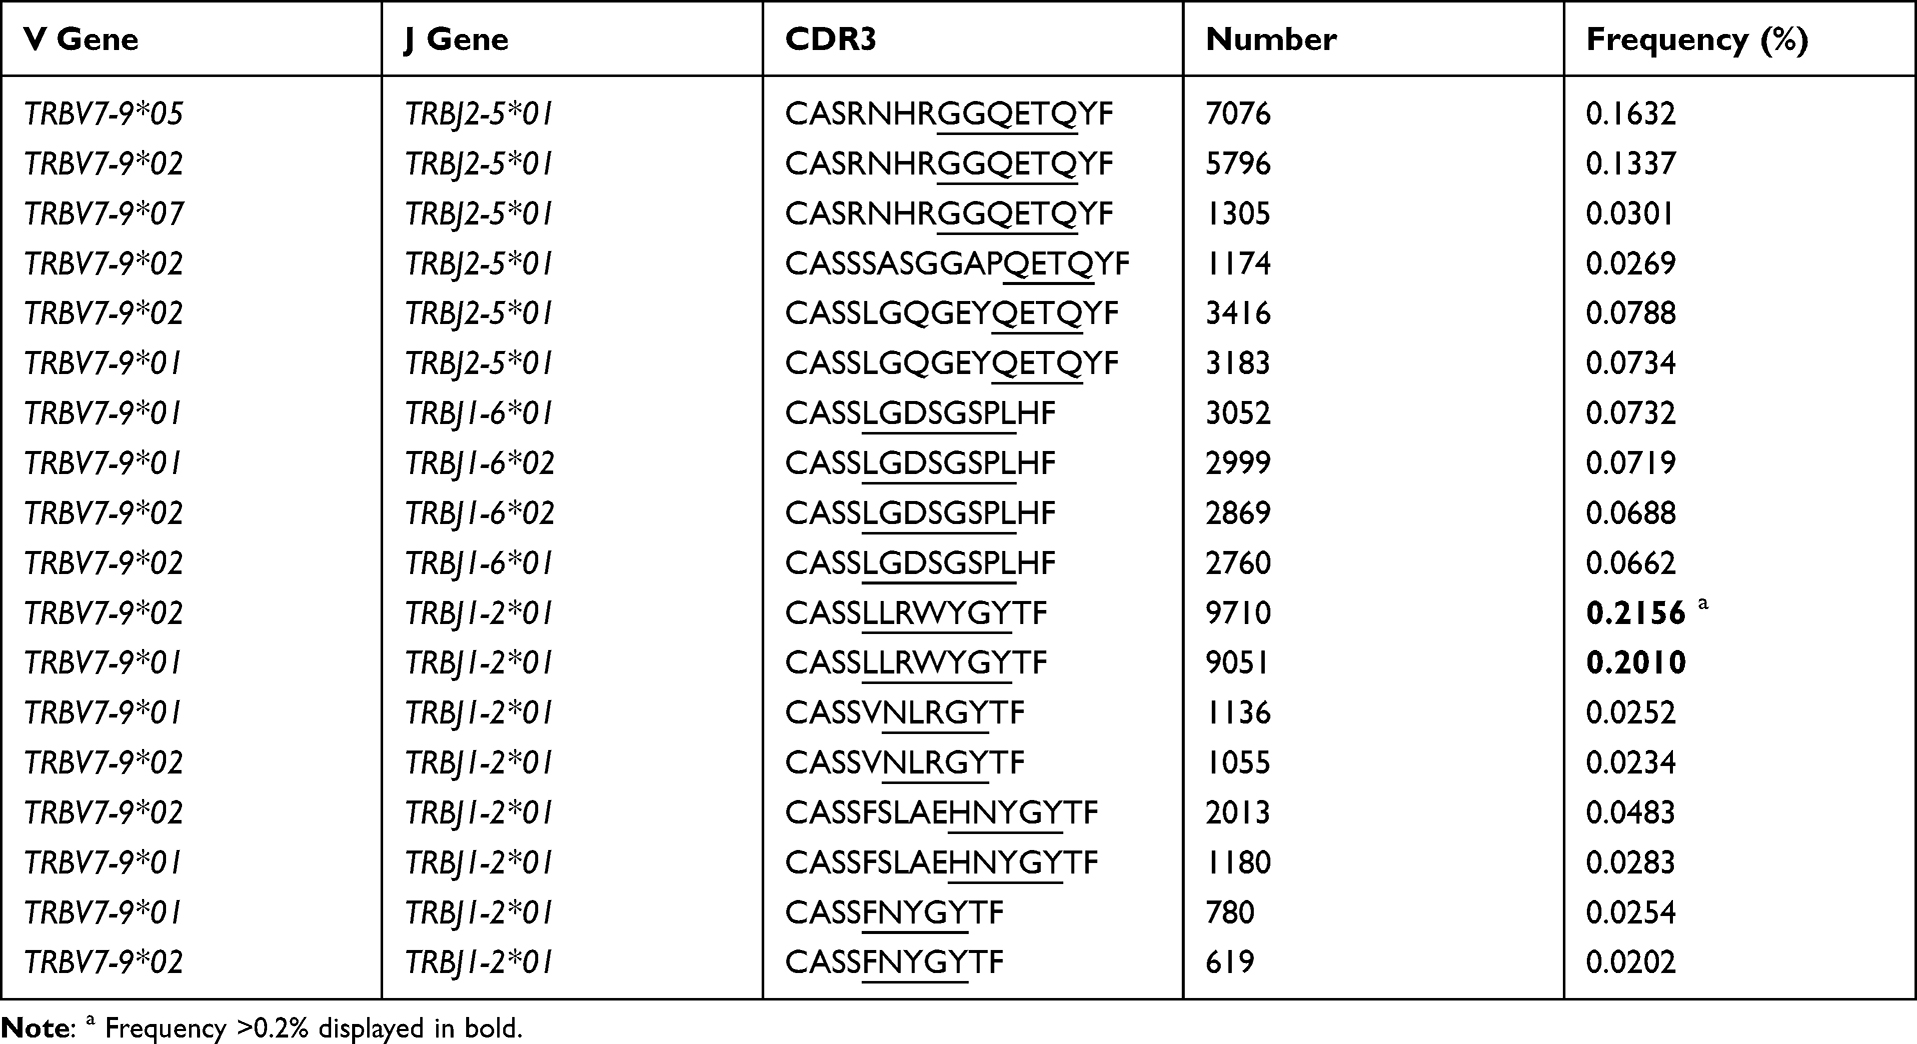 |
Table 3 CDR3 Motif of High Expression in TRBV7-9 Combined with BJ2-5/J1-6/J1-2 in Hepatitis B Vaccine Responders Compared with Those in Non-Responders (Frequency >0.02% Shown Only) |
PBMCs Isolated and RNA Extracted
The peripheral blood mononuclear cells (PBMCs) were isolated from 5 mL of PVB using Ficoll density gradient centrifugation. The total RNA was extracted from PBMC by using Trizol reagent (Invitrogen, MA, USA) in accordance with the manufacturer’s specifications. The RNA concentration was determined using spectrophotometry (Nano Drop 2000, Thermo, MA, USA), the RNA integrity was examined by visualization of the 28S and 18S RNA transcripts on a 1.2% agarose gel, and the quality of RNA was evaluated using an Agilent 2100 Bioanalyzer (Agilent Technologies, CA, USA).
cDNA Synthesis and Sequencing Library
In the present study, we used a 5’-RACE unbiased amplification protocol to synthesise cDNA. For the preparation of sequencing libraries of TRBV, two-round nested amplicon arm PCR was performed with a Multiplex PCR Assay Kit Ver. 2 (TaKaRa, Dalian, China) with specific primers against each variable and constant gene fragmentation. The first round of PCR was carried out using cDNA templates in a 50 μL reaction system with the following PCR parameters: first cycle of 94 °C for 60 seconds, 30 cycles of denaturation at 94 °C for 30 seconds and annealing at 60 °C for 60 seconds, and a final extension at 72 °C for 10 minutes, and the second round of PCR, the first round PCR product (5 μL) was used as a template, and the same PCR protocol was used, the more steps were shown.16
High-Throughput Sequencing
Using the Illumina Novaseq platform, the products established via the TRBV sequencing library were sequenced and analyzed. Subsequently, the raw sequence was screened, and the low quality sequences were deleted, the sequencing background was filtered17 and the international ImMunoGeneTics (IMGT) database (www.imgt.org) was used as standard reference sequences and the sequences obtained were compared with the IMGT database in the present study, please refer to our previous report for more detailed steps.18
Sequencing Results Analysis
Taking the nucleotide and amino acid (AA) sequences of TRBVs in the IMGT database as reference, the expression of V, J and D segments, V-J combination and V-D-J combination in each sample were investigated, and the diversity of CDR3AA clones and the similarity between samples were evaluated. The resulting nucleotide and AA sequences of TRB CDR3 were determined and the identified CDR3s were compared to that of another group’s report.19 The Shannon diversity index was calculated based on the clonal abundance of all productive TCR sequences, which could reflect both the relative number of clonotypes and the relative abundance of each clonotype.20 The formula of Shannon entropy (SE) is following:
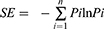
Where “Pi” is the frequency of the i-th clone in the TR repertoire with n clones. Additionally, the similarity was calculated based on the expression feature of CDR3 AA clones, such as, Morisita-Horn similarity index (MHSI) is used to determine similarities of TCR repertoires between samples.20 The MHSI ranged from 0 to 1, with 0 and 1 representing minimal and maximal similarity, respectively.21
Statistical Analysis
Statistical analyses were performed using Prism, version 8.0 Package (GraphPad Software Inc., San Diego, CA, USA). Data for the non-normal distribution were presented as the mean ±SEM (standard error of the mean) and a Mann–Whitney test was performed to compare the values. The difference between groups was determined using a t-test (two-tailed), if the data was normal distribution and equal variance. Regarding the counting data, a Chi-square test was used. Significance was accepted at p < 0.05.
Results
Gene Amplification and CDR3 Profile
The median of CDR3 reads, for each sample of responders and non-responders, as 4,296,707.5 and 4,387,580 and there was no significant difference between the reads (p = 0.0574, Supplementary Table S1). Additionally, there was no significant difference in other amplification indices, such as, QC-reads of CDR3, unique CDR3, and unique CDR3/CDR3 (Supplementary Table S1, Figure 1A and B). However, there were significant differences in the diversity indices, such as, Shannon index (Figure 1C)and clonality (Figure 1D), which were based on the CDR3 AA frequency. Moreover, the significantly low CF100 (cumulative frequency of top 100 CDR3s) was found in the responders compared to that in non-responders (Figure 2A), which suggests that the distribution of TRBV diversity presents deviation in the non-responders.
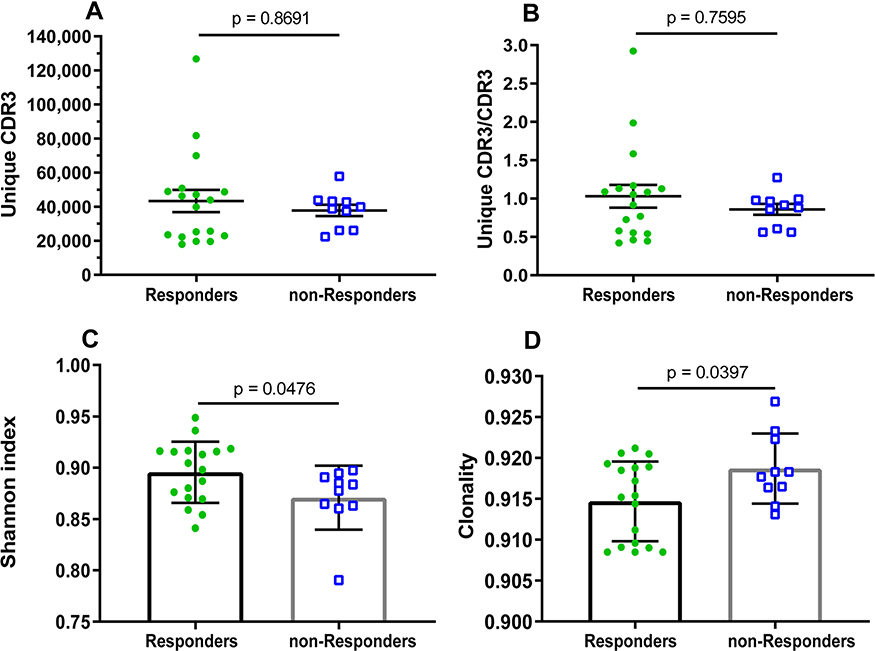 |
Figure 1 Clonal distribution and diversity of TRBV repertoires in HepB vaccine responders and non-responders. (A) The number of unique CDR3s. (B) Ratio of counts between unique CDR3 and total CDR3s identified in HepB vaccine responders and non-responders. Data points represent the counting ratio between unique CDR3 and total CDR3 in the TR repertoire of each individual. The bars depict the mean (±SEM) of the groups when data are non-normal distribution, and the differences compared using the Mann–Whitney test. (C) The distribution of TRBV frequencies are presented through the measurement of Shannon index (diversity) and (D) clonality. Each dot represents the diversity or clonality of each subject, and bars show the mean (±SD) of the groups. The differences are compared using two-tail unpaired t-test when data are normal distribution. Abbreviations: SEM, standard error of the mean; SD, standard deviation. |
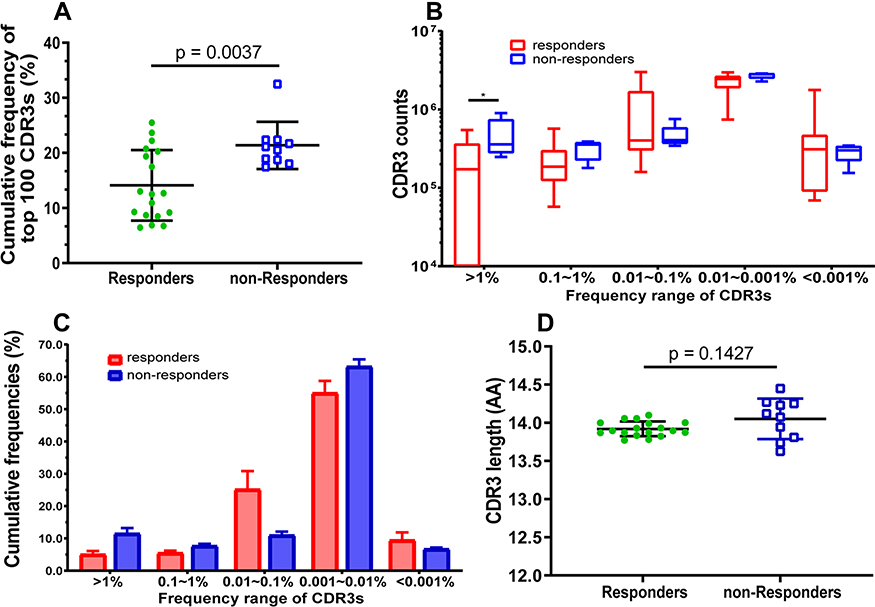 |
Figure 2 Comparison of the frequency, counts, and length distribution of TRB CDR3 between HepB vaccine responders and non-responders. (A) Cumulative frequency of top 100 CDR3s (CF100) in HepB vaccine responders and non-responders. Data points represent the CF100 in the total repertoire of each subject, and bars depict the mean (±SD) of the percentages of each subject. (B) The number of CDR3s with different frequency distribution range. Data are presented as Box and whiskers (5–95% percentile) of each subject, in which the middle solid line is the median count of CDR3s, the highest and lowest horizontal lines represent the 5th, and 95th percentiles. The p values of comparisons were calculated using the Mann–Whitney test, *p < 0.05. (C) Cumulative frequency of CDR3 distributions range. Data are presented as mean (±SD) of each subject using histogram. Normality of average value of cumulative frequency is detected by the Shapiro–Wilk test. (D) Comparison of the average of CDR3 length distribution between HepB vaccine responders and non-responders. Data points represent the CDR3 length average of each individual, and bars depict the mean (±SD) of subjects. |
Additionally, the number of CDR3 distributions with respect to the different frequency range were compared between responders and non-responders and the significant difference was only found in the range (>1%) (Figure 2B). Interestingly, the cumulative frequencies of CDR3 distribution with respect to the different range present as a Gaussian distribution for responders (p = 0.0836, by Shapiro–Wilk test), but not for non-responders (p = 0.0015, Figure 2C). Furthermore, the average of CDR3 length in each subject was 14 AA or so, and there was no significant difference between the two groups (Figure 2D). Simultaneously, the length distribution of CDR3 is almost a Normal distribution (Gaussian distribution) in both responders and non-responders, and there was no significant difference between them (Figure 3A), which demonstrated similar distribution with a dominant CDR3 of a length comprising 7~22 AA.
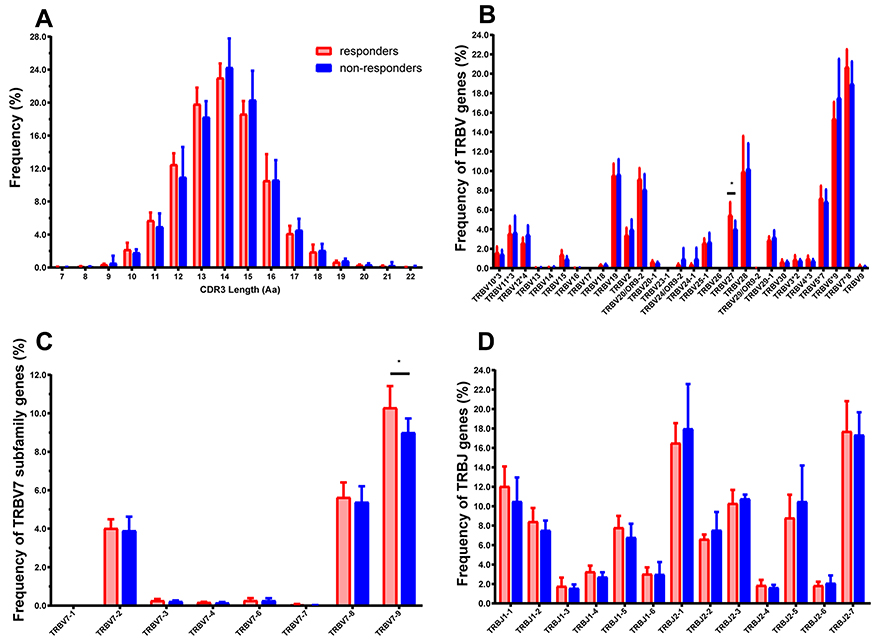 |
Figure 3 Distribution features of CDR3 length, TRBV, and BJ gene of the T cell clonotypes in HepB vaccine responders and non-responders. (A) The profile of CDR3 length distribution. (B) Percentage frequency of TRBV sub-families merged. The number after “*” represents the number of sub-families in this TRBV family, such as TRBV7*8 means the TRBV7 family including 8 sub-families. (C) The detail of 8 sub-families of the TRBV7. (D) Thirteen BJ families. Data show mean (± SEM) frequency of each subject. Data were compared using the Mann–Whitney test, *p < 0.05. Among all TRBV families, only the TRBV27 and BV7-9 have significantly different expression between the two groups (p = 0.0338, 0.0258), and the TRBV17, BV23-1, BV26 are low expressions or even undetectable in the most individuals. |
Frequency of BV, BJ Genes and Comparison
Regarding the TRBV families, sixty BV sub-families were classed into 26 BV families and the detail of 8 sub-families of BV7 was presented (Figure 3B, 3C). Among the 60 BV sub-families, TRBV27, BV7-9 demonstrated significantly higher expression frequencies in HepB vaccine responders compared to those in non-responders (Figure 3B and C). Furthermore, the CDR3 motifs in TRBV27/BJn, TRBV7-9/BJn from HepB vaccine responders and non-responders are presented in Tables 2 and 3. Additionally, there is no one out of 13 TRBJ families with significantly different frequency between the two groups (Figure 3D).
Profile of V-J Gene Combinations
We estimated the gene usage of BV and BJ combinations (60×13) in responders and non- responders, and a series of V-J combinations were identified for differential abundance in the two groups (Figure 4). In the heat map, there was an obvious difference for the TRBJ family cluster between responders and non-responders, in brief, there was no obvious classification of the 13 BJ families in responders (Figure 4A), however, the 13 BJ families were obviously divided into two clusters for non-responders (Figure 4B), the two BJ clusters (in detail), C1: BJ2-5, BJ2-2, BJ2-3, BJ1-2, BJ1-1, BJ2-1, BJ2-7; C2: BJ1-5, BJ1-6, BJ1-3, BJ1-4, BJ2-4; BJ2-6. Similarly, the 60 TRBV sub-families were obviously classified as four clusters for non-responders (Figure 4B), but not in responders (Figure 4A). Moreover, among 751 V-J combinations of the HepB vaccine responders and non-responders, there are 56 V-J combinations with higher frequency in responders than those in non-responders (all p < 0.05, Supplementary Table S2).
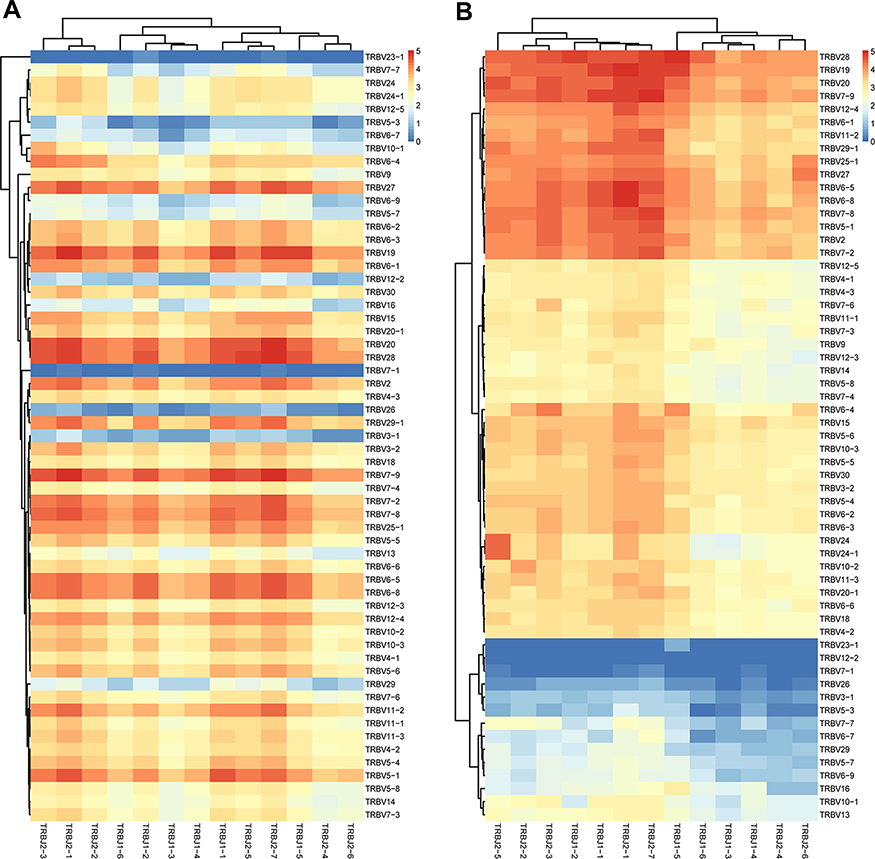 |
Figure 4 Profile of TRBV/BJ combination in HepB vaccine responders and non-responders. (A) Heat map of V-J gene combinations for the HepB vaccine responders, and (B) non-responders from IMGT/Stat clonotype analysis shows there are some different V-J gene combinations between the two groups. Such as, the 60 TRBV families are obviously clustered into four groups in non-responders, and the 13 TRBJ families are obviously divided into two groups, which both are not found in responders. |
Comparison of the Number of V/D/J Combinations
We also compared the number of V, D, J gene various combinations and demonstrated no significant difference of V-J combinations between HepB vaccine responders and non-responders (Figure 5A). Similarly, there was no significant difference of the number of V/D/J, V(CDR3)J combinations between the two groups (Figure 5B and C). Furthermore, we analyzed the number of different TRBV clonotypes of distribution with respect to the different frequency of V/D/J. The number of V/D/J combinations were divided into five groups (>1%, 0.1~1%, 0.01~0.1%, 0.001~0.01%, and <0.001%, respectively) and there was no remarkable difference between the two groups (Figure 5D).
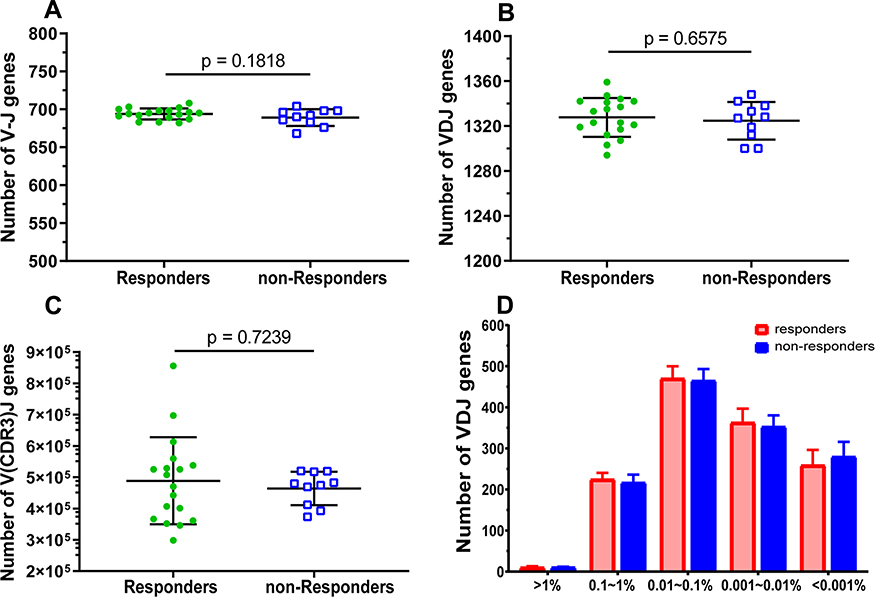 |
Figure 5 Comparison of the characteristics of TRBV V/D/J gene segment combinations between HepB vaccine responders and non-responders. The rearranged number of different gene segments (V/D/J) recombination of each subject for V-J genes (A), V/D/J genes (B), V(CDR3)J genes (C), and frequency distribution of V/D/J combinations (D). Each dot represents the number of each subject, and bars show the mean (±SEM). The differences are compared using the Mann–Whitney test. |
Special CDR3 Motif Also Reported by Others
The special CDR3 motifs of BV27/J1-1, /J2-5, and BV7-9/J2-5 were also identified in Deulofeut H’s report.19 In their report, the motifs were presented as “NTE”, “QETQ”, and “GG-Q (E)-ETQ”, although they used the first generation sequencing method (ABI 373) and the given V, J and CDR3 shown in Supplementary Table S3. These motifs were also determined in most CDR3s of identical V-J combinations in the present study (Table 2 and 3). Additionally, the motif “KLNSPL”, “GNEQ”, “LLRWYGY” were determined in the most CDR3s in BV27/J1-6, BV27/J2-7, and BV7-9/J1-2, respectively, for responders in the present study (Tables 2 and 3), to our knowledge, which is reported for the first time. Furthermore, we compared the similarity of CDR3 clonotypes, regarding the Morisita-Horn similarity index (MHSI), intra responder comparison was significantly higher than that of inter groups (responders vs non-responders) comparison (Figure S1A). Additionally, for BUB index, demonstrated no significant difference among them (Figure S1B).
Discussion
The present study provides a comprehensive profile of the IR (TRB) in PBMCs from HepB vaccine responders and non-responders, and reveals several preferential CDR3 motifs that may be related to HepB vaccine positive response, although it needs further confirmation that the dominant motifs of CDR3 are specific to the HepB vaccine. The results will contribute to interpreting the underlying immune mechanism of recipient positive responses to the HepB vaccine and the developing of an optimized HepB vaccine.
HepB vaccination can play an efficacious preventive and control effect on HBV infection and effectively reduce the infection rate of hepatitis B.22 HepB vaccine, like the common antigen, enters the host, activates and makes B cells to produce antibodies through a series of processes. In the series of immune response processes, CD4+ Th2 is required to assist in the normal activation of B cells, thus the B cells transform into plasma cells and production of antibody against HBV occurs.23 Moreover, the T cell demonstrates a special binding of the hydrated antigen presented by APCs using CDR1~3 (CDR3 mainly), which results in T cell activation and converts to antigen-specific T cell clones embodied by CDR3 on the cell membrane.24,25 Meanwhile, CD8+ T cells are also involved in the specific immune responses to the various antigens of HBV.9,26
HTS has the features of sensitivity, efficiency and accuracy, and is widely used to determine the IR of BCR and TCR in recent years.27,28 In the immune system, the higher the diversity of immune cells, the higher their stability, so the stronger their ability to resist the foreign antigen invasion of pathogens. On the contrary, if the diversity of immune systems is low, that is, the number of clonotype is less, which indicates that it is more susceptible to foreign pathogens and infections.29 In our previous study, we reported the diversity and distribution characteristics of the IR (TRB) based on the V(CDR3)J of TRBV with small cases, and there are no significant differences between the subjects with and without responding to HepB vaccination.18 However, the Shannon index based on CDR3 is significantly higher in the HepB vaccine responders compared to that in non-responders. Similarly, the CF100 is significantly lower in responders. These suggest that responder resistance to HBV infection is associated with higher TCR diversity. Moreover, the expression of V-J combinations are clustered in the non-responders, not in the responders, which confirms the greater the diversity of TRB present in the responders. Therefore, the changing CDR3 sequences can be used as biomarkers for promising clinical applications of diagnosis and vaccine development.30 Moreover, the diversified distribution of the V-J gene combinations could be associated with positively responding to HepB vaccine in recipients.
Under normal circumstances, the recipients will have an immune response to a vaccine and produce a specific antibody against vaccine segments with the help of T cells (binding to specific TCR).31 In the present study, high frequency usage of the TRBV28 family was found in the HepB vaccine responders and non-responders, and the percentage of the BV27 and BV7-9 gene families were significantly increased for responders, which suggested that the highly expressed TRB families are involved in the immune response to the HepB vaccine, although there is a lack of a non-vaccinated control group. Furthermore, the higher frequencies of CDR3s with “NTE”, “QETQ” and “GG-Q (E) -ETQ” motifs, respectively, were presented in BV27/J1-1, BV27/J2-5, and BV7-9/J2-5 for the responders after HepB vaccination, whereas those were lower in non-responders, indicating that the CDR3 motifs were related to vaccine immunity32,33. Furthermore, the three CDR3 motifs were also reported by another group, although the report had only two samples and used the first generation sequencing technique.19 It was speculated that the antigen segments of HepB vaccine stimulated and promoted the special proliferation of T cells with determined CDR3 motifs, although the specificity of T cells needs further be investigation in a future study.25
Additionally, there are several limitations to the study, we could not obtain the structure characteristics of the antigens targeted by the dominant CDR3 determined here, although we could use bioinformatics analysis tools to predict the antigens based on the motif of dominant CDR3.34 We did not investigate the role of the TRAV immune repertoire in responding to the HepB vaccine, which could be helpful in explaining the failure of the HepB vaccine. Moreover, it is significant to isolate subsets of T cells (such as the CD4+, CD8+ and CD45+ subsets) and perform a more detailed analysis, and the single cell sequencing technique may better solve this item at present.35 Additionally, we found that the relatively conservative motifs “KLNSPL”, “GNEQ”, “LLRWYGY” were separately determined in the most CDR3s of BV27/J1-6, BV27/J2-7, BV7-9/J1-2 combinations in HepB vaccine responders for the first time, which should be confirmed in a future study.
Conclusion
In the present study, the effect of HepB vaccination on the diversity and immunological characteristics of TRB CDR3 in the recipient can be effectively analyzed by HTS and bioinformatics analysis. Our results prove the feasibility of using TRBV IR for distinguishing the HepB vaccine responders from non-responders and suggest the high diversity and Gaussian distribution of components in the TRB CDR3 library be associated with a favorable response to the HepB vaccine and the specific CDR3 motifs determined could be potential novel targets with promising clinical and therapeutic applications, especially in the designing of HepB vaccines.
Data Sharing Statement
The datasets analyzed during the current study are available from the corresponding author on reasonable request.
Acknowledgment
The authors sincerely thank all of the subjects who participated in this study.
Funding
The work was supported by the National Key Research and Development Program of China (2021YFC2301804), Zhejiang Provincial Natural Science Foundation of China (LY19H190004), and National Natural Science Foundation of China (82072357).
Disclosure
The authors report no conflicts of interest for this work.
References
1. Nguyen MH, Wong G, Gane E, Kao JH, Dusheiko G. Hepatitis B virus: advances in prevention, diagnosis, and therapy. Clin Microbiol Rev. 2020;33(2):e00046-19. doi:10.1128/CMR.00046-19
2. Revill PA, Tu T, Netter HJ, Yuen LKW, Locarnini SA, Littlejohn M. The evolution and clinical impact of hepatitis B virus genome diversity. Nat Rev Gastroenterol Hepatol. 2020;17(10):618–634. doi:10.1038/s41575-020-0296-6
3. Filippelli M, Lionetti E, Gennaro A, et al. Hepatitis B vaccine by intradermal route in non responder patients: an update. World J Gastroenterol. 2014;20(30):10383–10394. doi:10.3748/wjg.v20.i30.10383
4. Zahn T, Akhras S, Spengler C, Murra RO, Holzhauser T, Hildt E. A new approach for therapeutic vaccination against chronic HBV infections. Vaccine. 2020;38(15):3105–3120. doi:10.1016/j.vaccine.2020.02.063
5. Yoshioka N, Deguchi M, Hagiya H, et al. Durability of immunity by hepatitis B vaccine in Japanese health care workers depends on primary response titers and durations. PLoS One. 2017;12(11):e0187661. doi:10.1371/journal.pone.0187661
6. Miyasaka A, Yoshida Y, Wang T, Takikawa Y. Next-generation sequencing analysis of the human T-cell and B-cell receptor repertoire diversity before and after hepatitis B vaccination. Hum Vaccin Immunother. 2019;15(11):2738–2753. doi:10.1080/21645515.2019.1600987
7. Zhao M, Li X, Xie S, et al. The dynamics and association of B and T cell receptor repertoires upon antibody response to hepatitis B vaccination in healthy adults. Hum Vaccin Immunother. 2021;17(9):3203–3213. doi:10.1080/21645515.2021.1913028
8. Meng Z, Chen Y, Lu M. Advances in targeting the innate and adaptive immune systems to cure chronic hepatitis B virus infection. Front Immunol. 2019;10:3127. doi:10.3389/fimmu.2019.03127
9. Iannacone M, Guidotti LG. Immunobiology and pathogenesis of hepatitis B virus infection. Nat Rev Immunol. 2021;22(1):19–32. doi:10.1038/s41577-021-00549-4
10. Ito H, Kanbe A, Hara A, Ishikawa T. Induction of humoral and cellular immune response to HBV vaccine can be up-regulated by STING ligand. Virology. 2019;531:233–239. doi:10.1016/j.virol.2019.03.013
11. Jiang Q, Zhao T, Zheng W, et al. Patient-shared TCRβ-CDR3 clonotypes correlate with favorable prognosis in chronic hepatitis B. Eur J Immunol. 2018;48(9):1539–1549. doi:10.1002/eji.201747327
12. Desombere I, Gijbels Y, Verwulgen A, Leroux-Roels G. Characterization of the T cell recognition of hepatitis B surface antigen (HBsAg) by good and poor responders to hepatitis B vaccines. Clin Exp Immunol. 2000;122(3):390–399. doi:10.1046/j.1365-2249.2000.01383.x
13. Zhang H, Liu L, Zhang J, et al. Investigation of antigen-specific T-cell receptor clusters in human cancers. Clin Cancer Res. 2020;26(6):1359–1371. doi:10.1158/1078-0432.CCR-19-3249
14. Izraelson M, Nakonechnaya TO, Moltedo B, et al. Comparative analysis of murine T-cell receptor repertoires. Immunology. 2018;153(2):133–144. doi:10.1111/imm.12857
15. Chaves SS, Fischer G, Groeger J, et al. Persistence of long-term immunity to hepatitis B among adolescents immunized at birth. Vaccine. 2012;30(9):1644–1649. doi:10.1016/j.vaccine.2011.12.106
16. Liang Q, Liu Z, Zhu C, et al. Intrahepatic T-cell receptor beta immune repertoire is essential for liver regeneration. Hepatology. 2018;68(5):1977–1990. doi:10.1002/hep.30067
17. Hou X, Guo Q, Wei W, Guo L, Guo D, Zhang L. Screening of genes related to early and late flowering in tree peony based on bulked segregant RNA sequencing and verification by quantitative real-time PCR. Molecules. 2018;23(3):689. doi:10.3390/molecules23030689
18. Yan D, Yang J, Ji Z, et al. Profiling T cell receptor β-chain in responders after immunization with recombinant hepatitis B vaccine. J Gene Med. 2021;23(9):e3367. doi:10.1002/jgm.3367
19. Deulofeut H, Robinson MA. The human T cell receptor repertoire utilized in response to HBsAg. Hum Immunol. 1997;57(1):54–61. doi:10.1016/S0198-8859(97)00181-X
20. Li N, Yuan J, Tian W, Meng L, Liu Y. T-cell receptor repertoire analysis for the diagnosis and treatment of solid tumor: a methodology and clinical applications. Cancer Commun. 2020;40(10):473–483. doi:10.1002/cac2.12074
21. Cha E, Klinger M, Hou Y, et al. Improved survival with T cell clonotype stability after anti-CTLA-4 treatment in cancer patients. Sci Transl Med. 2014;6(238):238ra270. doi:10.1126/scitranslmed.3008211
22. Yuen MF, Chen DS, Dusheiko GM, et al. Hepatitis B virus infection. Nat Rev Dis Prim. 2018;4(1):18035. doi:10.1038/nrdp.2018.35
23. Yin M, Xiong Y, Huang L, et al. Circulating follicular helper T cells and subsets are associated with immune response to hepatitis B vaccination. Hum Vaccin Immunother. 2021;17(2):566–574. doi:10.1080/21645515.2020.1775457
24. Jiang HY, Wang SY, Deng M, et al. Immune response to hepatitis B vaccination among people with inflammatory bowel diseases: a systematic review and meta-analysis. Vaccine. 2017;35(20):2633–2641. doi:10.1016/j.vaccine.2017.03.080
25. Zhan Q, Xu JH, Yu YY, Lo KE, El-Nezami H, Zeng Z. Human immune repertoire in hepatitis B virus infection. World J Gastroenterol. 2021;27(25):3790–3801. doi:10.3748/wjg.v27.i25.3790
26. Murata Y, Kawashima K, Sheikh K, Tanaka Y, Isogawa M. Intrahepatic cross-presentation and hepatocellular antigen presentation play distinct roles in the induction of hepatitis B virus-specific CD8(+) T cell responses. J Virol. 2018;92(21):e00920-18. doi:10.1128/JVI.00920-18
27. Georgiou G, Ippolito GC, Beausang J, Busse CE, Wardemann H, Quake SR. The promise and challenge of high-throughput sequencing of the antibody repertoire. Nat Biotechnol. 2014;32(2):158–168. doi:10.1038/nbt.2782
28. Shao L, Liu Y, Mei J, et al. High-throughput sequencing reveals the diversity of TCR β chain CDR3 repertoire in patients with severe acne. Mol Immunol. 2020;120:23–31. doi:10.1016/j.molimm.2020.01.024
29. Oliveira J, Mahony J, Hanemaaijer L, Kouwen T, van Sinderen D. Biodiversity of bacteriophages infecting Lactococcus lactis starter cultures. J Dairy Sci. 2018;101(1):96–105. doi:10.3168/jds.2017-13403
30. Ma J, Sun G, Zhu P, et al. Determination of the complexity and diversity of the TCR β-chain CDR3 repertoire in bladder cancer using high-throughput sequencing. Oncol Lett. 2019;17(4):3808–3816. doi:10.3892/ol.2019.10015
31. Das S, Ramakrishnan K, Behera SK, Ganesapandian M, Xavier AS, Selvarajan S. Hepatitis B vaccine and immunoglobulin: key concepts. J Clin Transl Hepatol. 2019;7(X):165–171. doi:10.14218/JCTH.2018.00037
32. Liaskou E, Klemsdal Henriksen EK, Holm K, et al. High-throughput T-cell receptor sequencing across chronic liver diseases reveals distinct disease-associated repertoires. Hepatology. 2016;63(5):1608–1619. doi:10.1002/hep.28116
33. Kagoya Y, Guo T, Yeung B, et al. Genetic ablation of HLA Class I, Class II, and the T-cell receptor enables allogeneic T cells to be used for adoptive T-cell therapy. Cancer Immunol Res. 2020;8(7):926–936. doi:10.1158/2326-6066.CIR-18-0508
34. Lin X, George JT, Schafer NP, et al. Rapid assessment of T-cell receptor specificity of the immune repertoire. Nat Comput Sci. 2021;1(5):362–373. doi:10.1038/s43588-021-00076-1
35. Pai JA, Satpathy AT. High-throughput and single-cell T cell receptor sequencing technologies. Nat Methods. 2021;18(8):881–892. doi:10.1038/s41592-021-01201-8
 © 2022 The Author(s). This work is published and licensed by Dove Medical Press Limited. The full terms of this license are available at https://www.dovepress.com/terms.php and incorporate the Creative Commons Attribution - Non Commercial (unported, v3.0) License.
By accessing the work you hereby accept the Terms. Non-commercial uses of the work are permitted without any further permission from Dove Medical Press Limited, provided the work is properly attributed. For permission for commercial use of this work, please see paragraphs 4.2 and 5 of our Terms.
© 2022 The Author(s). This work is published and licensed by Dove Medical Press Limited. The full terms of this license are available at https://www.dovepress.com/terms.php and incorporate the Creative Commons Attribution - Non Commercial (unported, v3.0) License.
By accessing the work you hereby accept the Terms. Non-commercial uses of the work are permitted without any further permission from Dove Medical Press Limited, provided the work is properly attributed. For permission for commercial use of this work, please see paragraphs 4.2 and 5 of our Terms.