")
Back to Journals » International Journal of General Medicine » Volume 14
Characterization of the GATA Transcription Factor Family and Exploration of Their Relevance to Immune Infiltration and Tumor Microenvironment in Pancreatic Cancer
Authors Xu J, Cheng K, Lin H, Han W, He T, Nie X, Sun Y, Qiuman S, Reheman Y, Chen Q
Received 21 October 2021
Accepted for publication 18 November 2021
Published 30 November 2021 Volume 2021:14 Pages 9083—9101
DOI https://doi.org/10.2147/IJGM.S342741
Checked for plagiarism Yes
Review by Single anonymous peer review
Peer reviewer comments 2
Editor who approved publication: Dr Scott Fraser
Jiaqi Xu, Kun Cheng, Hai Lin, Wei Han, Tieying He, Xiaohan Nie, Yonghui Sun, Sulidankazha Qiuman, Yilidan Reheman, Qilong Chen
Department of Pancreatic Surgery, Centre of Digestive and Vascular Surgery, First Affiliated Hospital of Xinjiang Medical University, Urumqi, 830054, People’s Republic of China
Correspondence: Qilong Chen Email [email protected]
Background: Pancreatic cancer (PC) presents a phenomenal disease burden worldwide. The GATA transcription factor family is associated with a variety of human malignancies. However, the relation between GATA family members (GATAs) and PC has not been elucidated.
Methods: This study integrates large-scale bioinformatics database resources to analyze the expression patterns of GATAs in PC patients and explore their underlying function mechanism and relevance to immune infiltration and other different cell types in the tumor microenvironment in pancreatic cancer. First, the expression pattern of GATAs in pancreatic cancer was detected by the Oncomine database and the Gene Expression Profile Interaction Analysis (GEPIA2) database and verified through other datasets in the R2 platform. Then, we used the cBioPortal database and the Human Protein Atlas to assess the correlation between GATAs and clinicopathological features of PC. Then, survival analyses were performed to identify candidate prognostic factors in the GATA family in PC patients. Further, we performed gene ontology (GO), Kyoto Encyclopedia of Genes and Genomes (KEGG) enrichment analysis, protein-protein interaction (PPI) network, immune-infiltration correlation analysis, and cell type analysis of the tumor microenvironment at the single-cell level to explain the function of GATAs in pancreatic cancer.
Results: We found that GATA3 and GATA6 were highly expressed in pancreatic cancer, and the expression levels of GATA4 and GATA6 correlated with the pathological stage, differentiation grade, and molecular subtype of pancreatic cancer. The survival analysis revealed that lower GATA4 of PC patients was associated with better outcomes, and higher GATA6 might be associated with longer OS. In addition, GATA3 was associated with immune cell infiltration of PC, and GATA6 was mainly distributed in the epithelial cells with ductal phenotype.
Conclusion: This work tentatively identified GATA3, GATA4, and GATA6 in the GATA family associated with pancreatic cancer. GATA4 may serve as a prognostic factor for PC patients, and GATA6 may act as a subtype marker for PC. In addition, GATA3 may reflect the immune-infiltration status of PC.
Keywords: pancreatic cancer, GATA transcriptional factor, prognosis, tumor microenvironment, bioinformatics analysis
Plain Language Summary
This study systematically analyzed the expression patterns of the GATA family members and explored their potential function in pancreatic cancer. The results demonstrate that GATA4, GATA6, GATA3 could be used as pancreatic cancer candidate biomarkers for prognosis, molecular subtype, and immune infiltration, respectively. These findings provided a reference for predicting clinical prognosis and a novel direction for exploring the pathogenesis of pancreatic cancer.
Introduction
Pancreatic cancer (PC) is a highly malignant disease with a 5-year overall survival rate of less than 10%,1 lower than all common solid malignancies. According to the American Cancer Society,1 there will be 57,600 new cases of pancreatic cancer in the United States in 2020, and 47,050 people will die of pancreatic cancer, which has been predicted to surpass breast cancer as the third leading cause of cancer death in the future. For the treatment of pancreatic cancer, surgical intervention is the only possible curative option today. However, since pancreatic cancer developed insidiously and progressed rapidly, 80–90% of patients had signs of local lymph node, vascular and nerve tissue invasion, or extensive distant metastases by the time of diagnosis, which led to a surgical resection rate of less than 20%.2 In recent years, with the diagnostic method, perioperative management, the progress of radiation treatment technologies and systems, multidisciplinary treatment mode gradually improve, limitations of early PC patients in survival rate, local control and no transfer of survival has improved obviously,3 approximately 70% of patients with localized IA stage PC survived for more than five years.2 However, the overall survival of advanced PC is less than one year, and the 5-year survival rate is less than 3%.3 Therefore, identifying high-risk patients for improving the rates of early diagnosis and the comprehensive, individualized precision treatment for patients is the key to improving the general outcome of pancreatic cancer.
The GATA transcription factor family is characterized by a DNA-binding domain containing one or two zinc finger structures that bind to the (A/T)GATA(A/G) sequence of genes, which participate in the mammalian embryonic development process with an indispensability role in cell fate specialization and organism morphogenesis.4 The members of this transcription factor family include six GATA binding proteins encoded by GATA1/2/3/4/5/6, respectively. Although initially divided into hematopoietic (GATA1/2/3) and cardiac (GATA4/5/6) GATA factors according to their functional characteristics, their functions and expression patterns far exceed these organizations, expressed in various tissues and organs.5 In addition, several studies have found the aberrant expression of GATA transcription factors in various human malignancies, such as breast cancer,6,7,8 urinary malignancy,9 lung cancer,10 pancreatic cancer.11–16 Chang et al13 found that GATA1 was highly expressed in pancreatic ductal adenocarcinoma and promoted pancreatic cancer gemcitabine resistance through the anti-apoptotic pathway. Martinelli et al12 found that GATA6 controlled the progression of pancreatic cancer by inhibiting the process of epithelial-mesenchymal transformation and proposed that high levels of GATA6 were a marker of good prognosis of PC. Accordingly, the GATA family members might be potential biomarker candidates for PC. However, the expression patterns of GATAs in pancreatic cancer and their potential functions have not been elucidated and need to be investigated thoroughly.
Herein, we used integrated large-scale bioinformatics databases to investigate the potential role of the GATA transcription factor family in pancreatic cancer. First, we explored the characteristics of GATA family genes, from expression patterns to prognostic value, and potential clinicopathological features, for a comprehensive understanding of the roles that the GATA family members play in pancreatic cancer. Furthermore, we explored the relationship between GATA family members and immune infiltration and their expression characteristics in various cell types of the tumor microenvironment to more comprehensively analyze their importance and value as markers of pancreatic cancer.
Materials and Methods
Data Source and Processing
We conducted expression profiling analyses of GATA family members using several bioinformatics webservers/tools. We validated the results in more than one public dataset for better reliability.
Oncomine Database
The Oncomine database (www.oncomine.org) was used in this study to perform a preliminary pan-cancer analysis of the GATA family. The mRNA expression levels of the GATA family members were compared between tumor with normal tissue by Student’s t-test from pan-cancer studies in Oncomine were selected. The cut-off of P-value and Fold change was set as 0.05 and 1.5, respectively.
GEPIA2
Gene Expression Profiling Interactive Analysis 2 17,18 (GEPIA2, http://gepia2.cancer-pku.cn/) with available RNA-seq data of the Cancer Genome Atlas (TCGA) database19 and the Genotype-Tissue Expression (GTEx) database,20,21 was used to analyze gene transcript levels of GATA family members in multiple cancer types and normal tissues by ANOVA. We performed GATA expression differential analysis using 179 PC samples and four healthy samples from the TCGA-PAAD (pancreatic adenocarcinoma) cohort and 167 human pancreas tissues from the GTEx database in GEPIA2. With the “Expression DIY” module in GEPIA2, we compared the expression of GATA family genes in different pathological stages and between different molecular subtypes of pancreatic cancer, respectively.
cBioPortal
cBioPortal (https://www.cbioportal.org/) provides a visual tool for research and analysis of cancer gene data and helps understand their genetics, epigenetics, gene expression, and proteomics.22,23 In this study, through the cBioPortal online visualization tool, we analyzed the correlation of tumor grade with mRNA profile data of GATA family members from the study of Pancreatic Adenocarcinoma (QCMG, Nature 2016).24
R2: Genomics Analysis and Visualization Platform
The R2: Genomics Analysis and Visualization Platform (R2, http://r2.amc.nl) is a genomics analysis and visualization platform that strives to provide a biologist-friendly interface to high throughput data. R2 was used to download the RNA-seq data of GSE71729 from the Gene Expression Omnibus (GEO) database.25
The Human Protein Atlas
The Human Protein Atlas (HPA, https://www.proteinatlas.org) was initiated in 2003, with tissue atlases, single-cell type atlases, pathology atlases, blood atlas, brain atlas, and cell atlas, all open to exploration of the human proteome.26,27 In this study, the images of immunohistochemistry staining for PAAD tumor tissues and normal pancreas were collected from HPA to compare the protein expression of GATAs.
Survival Analyses
The prognostic value of GATA family members was estimated by comparing the relationship between gene expression and survival outcomes in a wide range of published pancreatic cancer datasets. The survival analysis of the Pancreatic adenocarcinoma cohort of the TCGA Pan-cancer project, including the relationship between GATA family gene expression and overall survival (OS) and relapse-free survival (RFS), was performed by Kaplan-Meier plotter (KM-Plotter, http://kmplot.com).28 The SurvExpress database (http://bioinformatica.mty.itesm.mx/SurvExpress)29 was accessed to conduct the survival analysis of the GATA family members in the PACA-AU-ICGC cohort. The GATA family expression data and survival time of PC patients in the GSE21501 dataset were analyzed by the R2 platform.
Enrichment Analysis of Co-Expressed Genes
We used the cBioPortal online tool to screen out the top 200 genes co-expressed with GATA family members in two pancreatic adenocarcinoma cohorts from the TCGA Pan-Cancer study19 and the QCMG study,24 respectively. The intersecting genes from the above two lists of co-expressed genes were obtained by using Venn diagrams (http://bioinformatics.psb.ugent.be/webtools/Venn/). The intersecting genes co-expressed with each GATA family member enrolled for the gene ontology (GO) function analysis, Kyoto Encyclopedia of Genes and Genomes (KEGG) pathway enrichment analysis, and the protein-protein interaction (PPI) analysis. The “clusterProfiler” package30 was used for GO and KEGG enrichment analysis in the Hiplot platform (https://hiplot.com.cn/), with a significance threshold of p < 0.05. The PPI analysis and network construction of the list of co-expressed genes were performed using the Search Tool for The Retrieval of interaction Gene/Proteins (STRING) database31 (https://string-db.org/) with a medium confidence level.
Evaluation of Immune Infiltration
The TIMER2.0 database (http://timer.cistrome.org/) is a convenient and accurate online analysis tool that enables comprehensive and systematic analysis of the abundance of tumor-infiltrating immune cells.32–34 In this study, TIMER2.0 was used to evaluate the correlation between the expression levels of GATA family genes and the abundance of immune cell infiltration in pancreatic cancer, including B cells, CD4T cells, CD8+T cells, dendritic cells (DCs), macrophages, and neutrophils. Spearman correlation analysis was used to calculate the correlation between GATAs and the abundance of immune cells in pancreatic cancer; p < 0.05 was considered statistically significant.
Tumor Microenvironment Exploration
Tumor Immune Single-cell Hub (TISCH, http://tisch.comp-genomics.org/home/) is a single-cell RNA-seq database focused on the tumor microenvironment (TME). TISCH supports interactive single-cell transcriptome visualization of tumor microenvironment online.35 In this study, the human pancreatic carcinoma scRNA-seq dataset PAAD_CRA00116036 from the TISCH database was used to explore the expression pattern of GATA transcription factor family members in pancreatic cancer TME at the single-cell level.
Statistical Analysis
Statistical analyses were performed using online bioinformatics analysis platforms and GraphPad Prism version 8.0. The GATA family members’ expression levels were compared by t-test, ANOVA, and nonparametric tests according to the number of groups. The Kaplan-Meier curves were generated to show the correlation between differential gene expression and OS and RFS. In the single-gene prognostic analysis of KM-Plotter, an optimal cut-off was automatically generated, grouped by high and low expression. While the Kaplan-Meier survival curve of SurvExpress determined cut-off values based on the median prognostic index, grouped by high and low risk. The survival difference between groups was examined by Log rank test, and p < 0.05 was considered statistically significant.
Results
The mRNA Expression Levels of GATA Family Members in Pan-Cancer
The mRNA expression levels of the GATA family genes in different types of cancers and normal tissue samples were compared by the Oncomine database (Figure 1). The pan-cancer profiles analysis of the Oncomine database showed that GATA1/2/4/5/6 expressed at relatively lower levels in most kinds of cancers than in normal tissues. The expression of GATA3 was significantly up-regulated in some cancers, such as breast cancer and lymphoma, than in any other normal tissue or cancer types. The expression of GATA2 was down-regulated in six studies compared with none study increased. The mRNA of GATA4 was significantly lower in five studies and relatively increased in only one study. The mRNA expression of GATA3 was up-regulated in six studies and down-regulated in two studies.
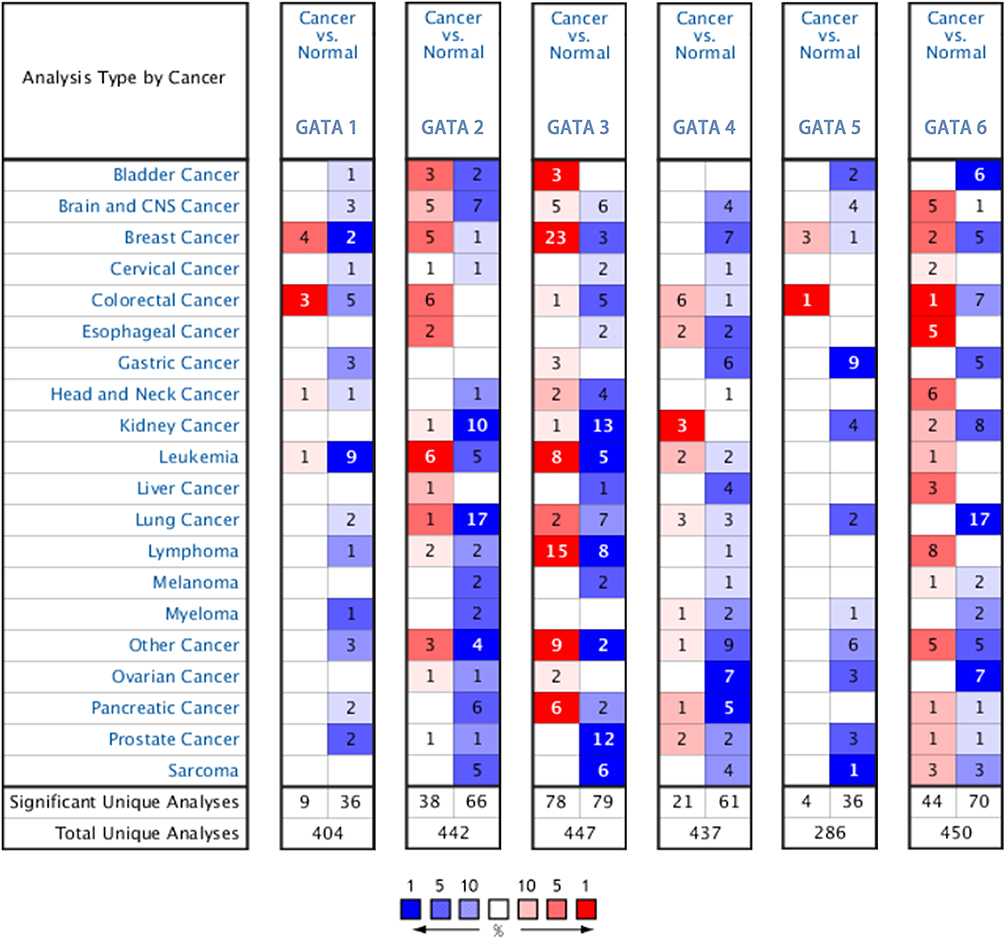 |
Figure 1 The mRNA expression levels of the GATA family genes in different types of cancers according to the Oncomine database. |
We visualized the gene expression profile from the TCGA pan-cancer project using the TIMER 2.0 database (Figure 2). The expression of GATAs was displayed in gray or white columns according to there are normal tissue data available or not in the TCGA pan-cancer project. The statistical significance was computed by the Wilcoxon test. GATA3 was highly expressed in tumor tissue more frequently in the TCGA pan-cancer project, compared to normal tissue, which was similar to former results of the Oncomine database. In addition, the GATA Family members were generally significantly lower expressed in kidney renal clear cell carcinoma, lung Squamous Cell Neoplasms and lung adenocarcinoma compared to normal tissue. However, no pattern of the GATA family members’ expression was found in the pancreatic adenocarcinoma data. A possible reason for this result was that the number size of normal controls of the PC cohort was too small, with only four normal pancreatic tissues, which might also make this result statistically unconvincing.
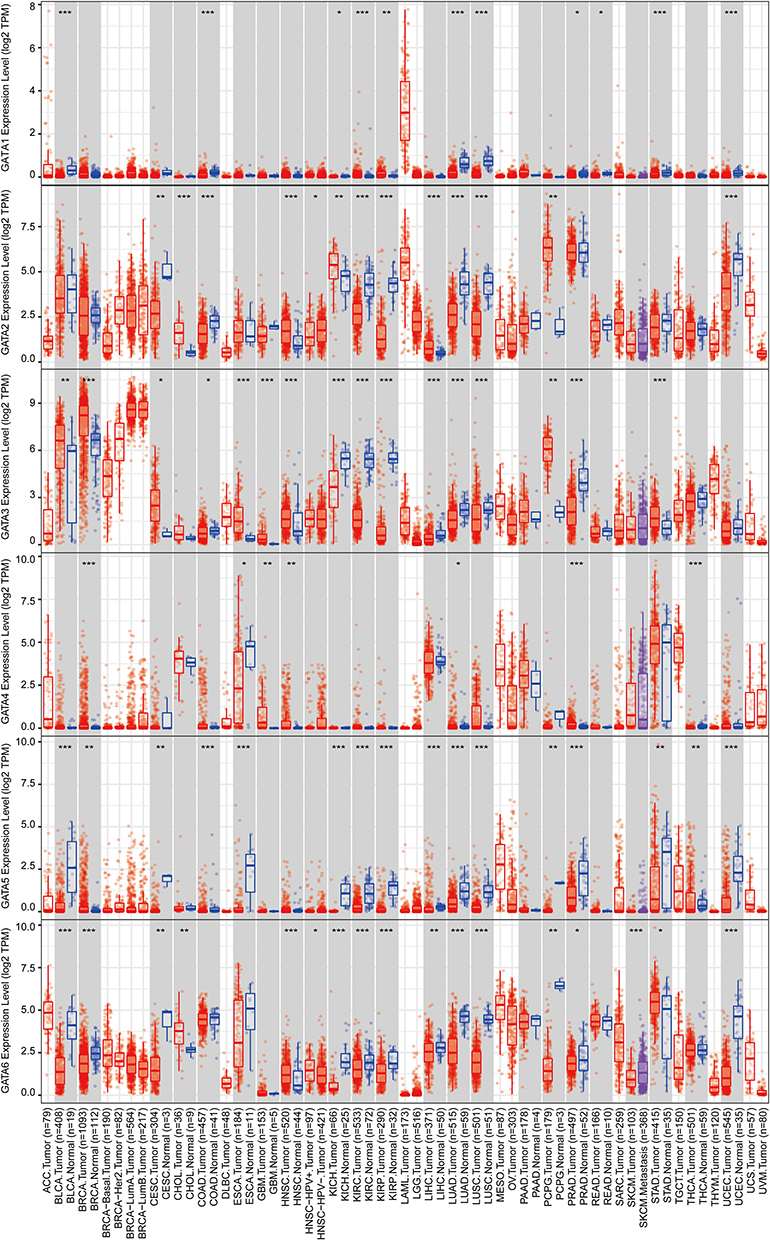 |
Figure 2 The mRNA expression levels of the GATA family genes in TCGA pan-cancer data according to the TIMER2.0 database. (“*” represents p-value < 0.05; “**” represents p-value <0.01; “***” represents p-value <0.001). |
Therefore, we used the GEPIA2 database to compare GATAs’ expression of PC samples from the TCGA-PAAD cohort and pancreas samples from TCGA and GTEx (Figure 3). Consistent with the results in the Oncomine database, GATA3 was significantly up-regulated in multiple cancer types. GATA2 was significantly down-regulated in multiple cancer types. Besides, GATA4 was differentially expressed in various cancers infrequently. GATA6 was differentially expressed in various cancers, which was down-regulated in 11 cancer types and up-regulated in Colon carcinoma, Esophageal carcinoma, Pancreatic carcinoma, and Rectal carcinoma. The results from the above pan-cancer analysis indicated that the GATA family had a certain non-specific expression pattern in pancreatic cancer, with high expression of GATA3 and low expression of GATA4. In contrast, the expression characteristics of other members were not significant.
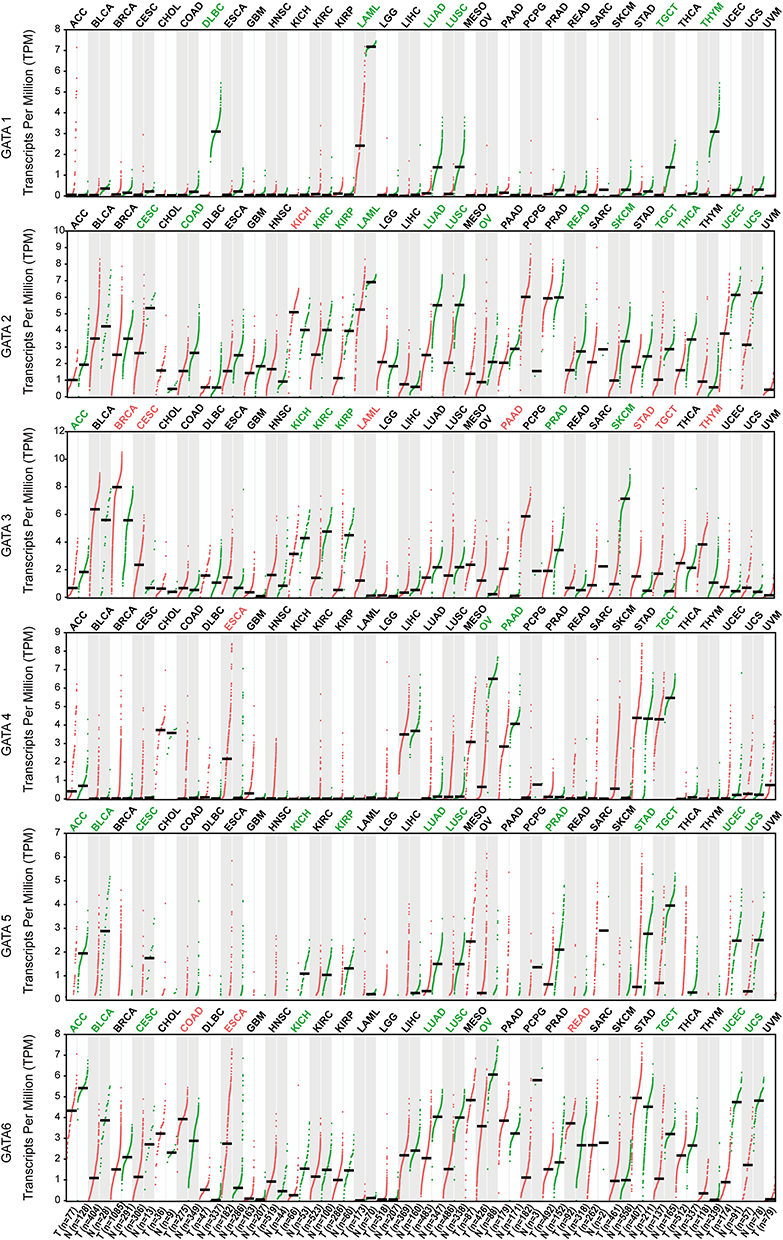 |
Figure 3 The mRNA expression levels of the GATA family members in TCGA pan-cancer data compared with GTEx normal tissue according to the GEPIA2 database. The red tumor type label represented significant up-regulation of mRNA expression, green represented down-regulation, and black represented no statistically significant differences. The p-value was defined as 0.05. |
The Expression of GATA Family Members in Pancreatic Cancer
To investigate the gene expression profile of each GATA transcription factor family member in pancreatic cancer, we collected two datasets (TCGA-PAAD and GSE71729) and compared the mRNA level of GATAs between PC tissues with normal pancreas. The RNA-seq data in TCGA-PAAD were analyzed online through the GEPIA2 database, including 179 PC samples and 171 normal pancreas tissue samples (Figure 4A). The results showed that GATA2 and GATA4 were expressed at lower levels in PC tissue, and GATA3 and GATA6 were expressed at higher levels, compared with normal pancreas. The gene expression microarray data from the GSE71729 dataset was downloaded from the R2 platform, analyzed by GraphPad Prism 8.0, including 145 PC primary site samples and 134 normal samples (Figure 4B). GATA1/2/5 were less expressed in tumor tissues, the expression level of GATA3 and GATA6 in tumor were higher than those in normal pancreas tissues. The differential expression of GATA2, GATA3, and GATA6 were consistent in the two groups: compared with normal tissues, the mRNA of GATA2 was down-regulated in PC tissues, and the expression of GATA3 was up-regulated in pancreatic carcinoma.
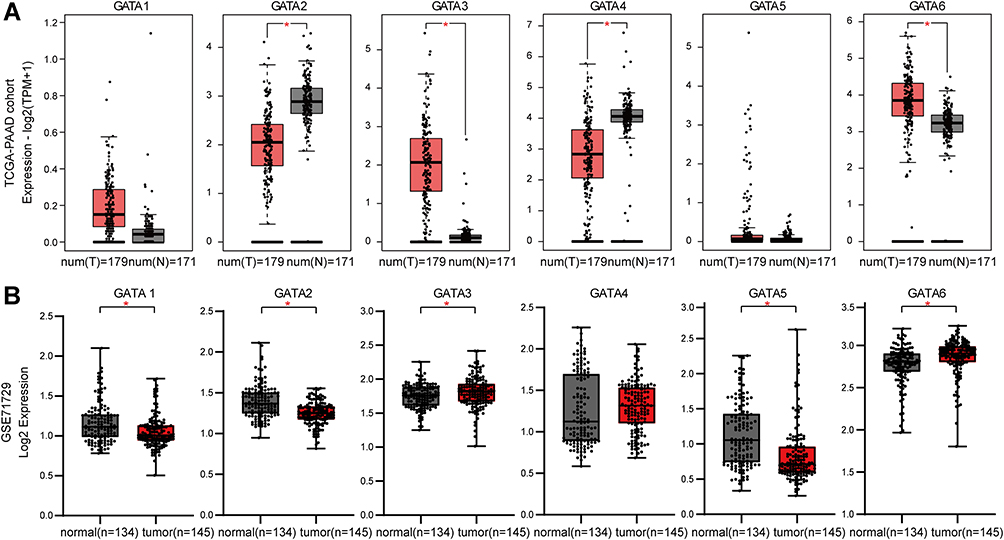 |
Figure 4 The GATA mRNA expression levels in pancreatic cancers with significant differential expression between tumor and normal tissues. (A) The mRNA expression levels of GATA2, GATA3, GATA4, and GATA6 were significant differential expressed in pancreatic cancer in the TCGA-PAAD dataset. (B) The mRNA expression levels of GATA1, GATA2, GATA3, GATA5, and GATA6 were significant differential expressed in pancreatic cancer in the GSE71729 dataset. (“*” represents p-value < 0.05). |
The protein expression levels of GATAs in PC were studied using the Human Protein Atlas (Figure 5). Aside from missing information for GATA5, the immunohistochemical staining results from HPA showed that GATA3 proteins were not detected in normal pancreas tissues, while medium expression was detected in PC tissues. Besides, in normal pancreatic tissues, GATA6 protein expression level was moderate, while PC samples had significantly higher protein expression of GATA6. However, the protein expression of GATA1, GATA2, and GATA4 has observed no difference in normal pancreas tissues and PC tissues.
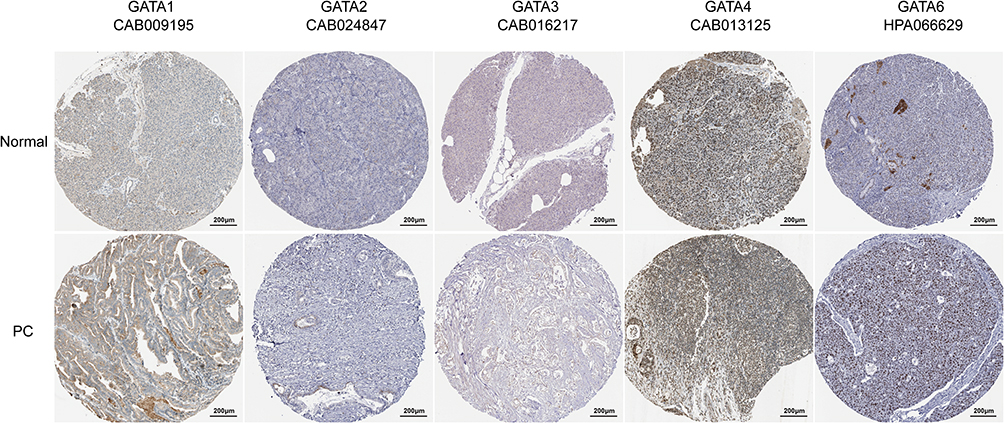 |
Figure 5 The protein levels of GATA family members were detected by Immunohistochemistry from the Human Protein Atlas database. |
The Relationship Between the GATA Family and the Clinical Features of PC Patients
We analyzed the association between GATA expression and tumor stage in the TCGA-PAAD cohort by the GEPIA2 database (Figure 6A). The results showed that the expression levels of GATA4 and GATA6 were significantly correlated with tumor stage in PAAD patients. In contrast, the other members’ correlation with tumor stage was not significant. We used the cBioportal database to explore the relationship between the GATA family member expression and the tumor differentiation grade of pancreatic cancer in the QCMG cohort (Figure 6B). The results showed that similar to the former results of tumor stage, GATA4 and GATA6 expressed significantly different among different differentiation grades (Figure 6C). The higher expression of GATA4 and GATA6 were more frequently in moderately differentiated PC than in other grades. Pancreatic cancer molecular subtypes were composed of tumor- and stromal-specific subtypes. The former included classical and basal-like subtypes, and the latter included normal and activated subtypes. To further explore the association between the GATA family member and different pancreatic cancer molecular subtypes, we compared the mRNA of GATAs in two datasets containing molecular subtypes information (Figure 7). In the TCGA-PAAD cohort, we found that GATA4 and GATA6 were lower in the basal-like subtypes, and the expression levels of GATA3 were higher in the basal-like subtypes, compared with the classical subtypes (Figure 7A). The relationship between GATA expression and molecular subtypes in the GSE71729 dataset (Figure 7B) was consistent with the TCGA-PAAD cohort. In addition, we found significant differences in the expression levels of GATA4 between different stroma subtypes, with higher expression levels in the activated stroma compared to the normal stroma.
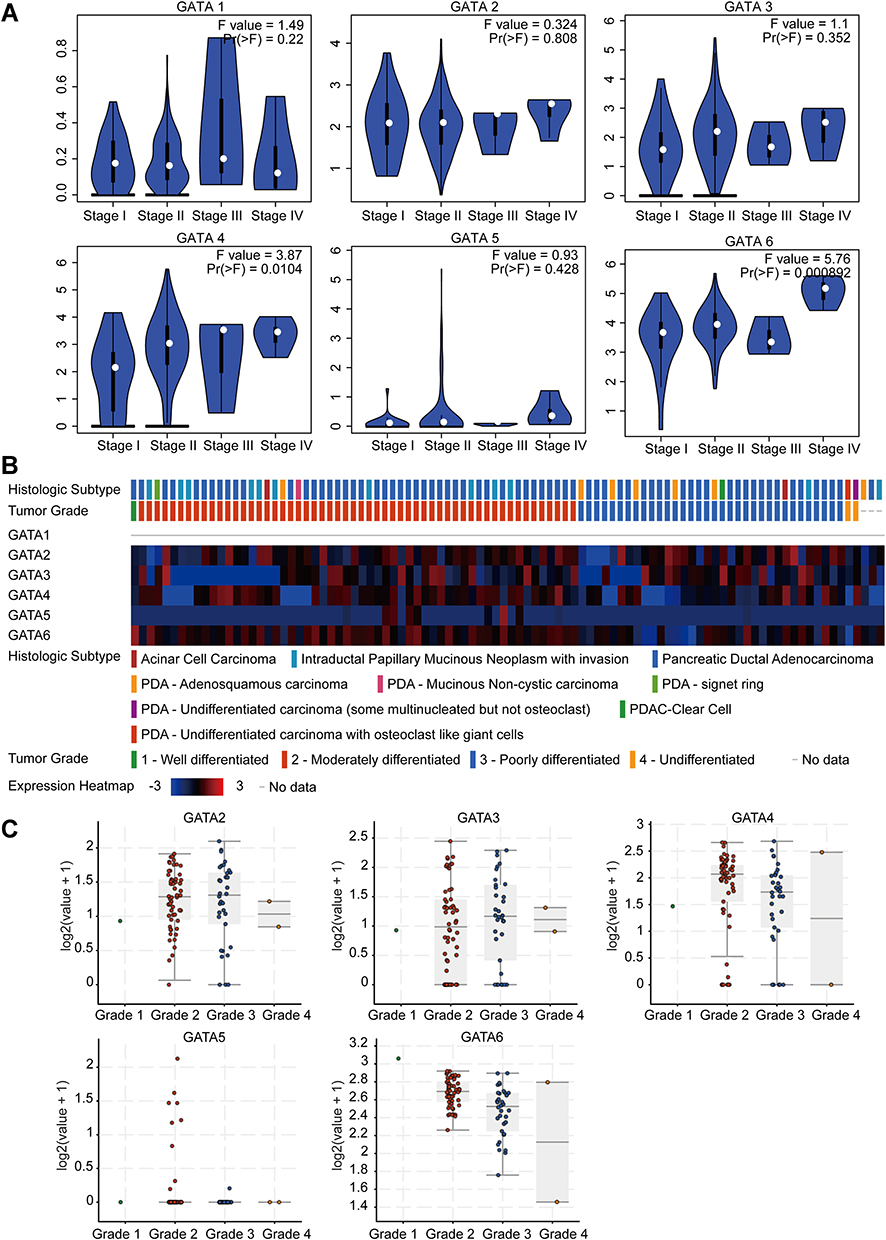 |
Figure 6 The correlation between GATA family members’ expression levels and clinicopathological features of PC patients. (A) The association between GATA mRNA expression levels and TNM stage of PC patients. (B and C) The association between GATA mRNA expression levels and histological grade of PC patients in the QCMG cohort. |
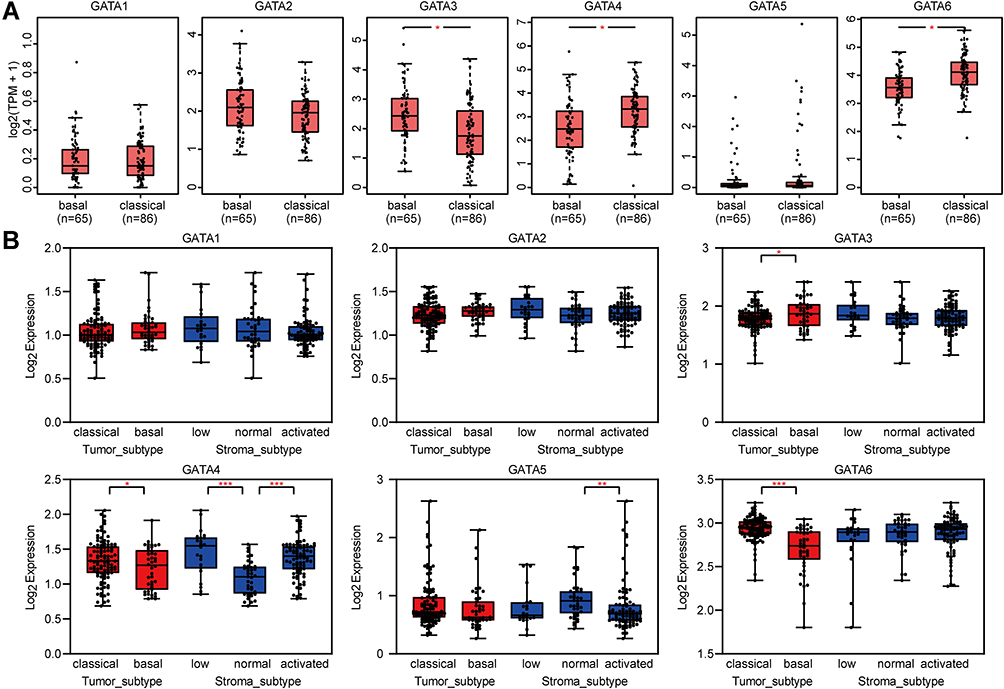 |
Figure 7 The correlations between GATA family members and the molecular subtypes of pancreatic cancer. The different mRNA levels of GATA family members in the basal and classical subtype are based on the TCGA-PAAD dataset (A) and the GSE71729 dataset (B). (“*” represents p < 0.05; “**” represents p < 0.01; “***” represents p < 0.001). |
The Prognostic Values of GATA Family Members in Pancreatic Cancer
We continue to analyze its relationship with the prognosis of PC patients by using the Kaplan-Meier plotter. The Kaplan-Meier curve and Log rank test revealed that the low expression level of GATA4 in pancreatic cancer was associated with better outcomes, including overall survival (p=0.052, Figure 8A) and regression-free survival (p=0.013, Figure 8B). In contrast, the expression level of other GATA members presented no statistically significant difference in survival outcome. We also analyzed the association between the GATA gene expression and prognosis in the other two independent pancreatic cancer cohorts, the PACA-AU-ICGC cohort and the Yeh cohort (the GSE21501 dataset), performed by the SurvExpress database and the R2 platform, respectively. The single gene survival analysis results from the ICGC-PACA-AU cohort based on SurvExpress showed that the high expression level of GATA6 was associated with longer OS in PC patients (p<0.01, Supplementary Figure 1A). The survival analysis of the Yeh cohort did not find a significant prognostic value for PC patients in GATA family members (Supplementary Figure 1B).
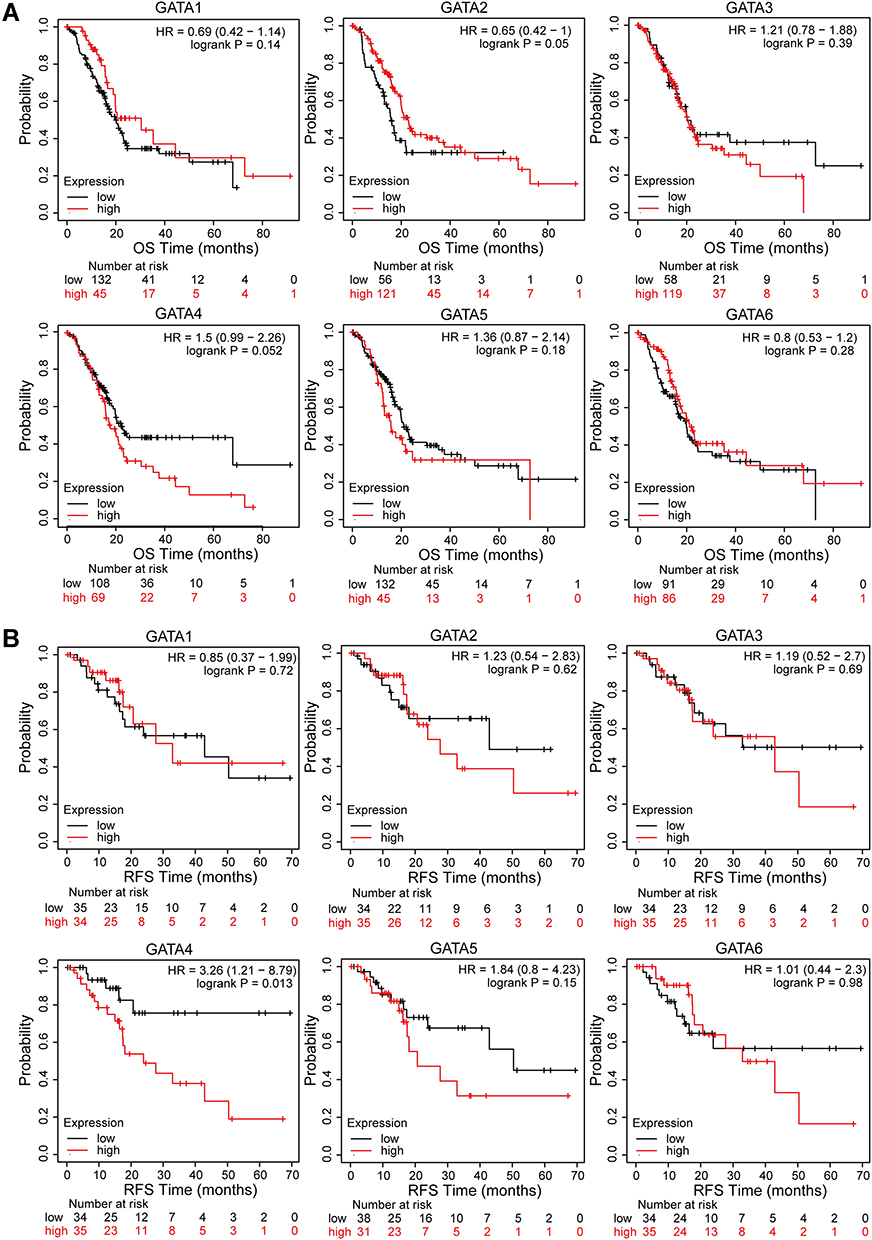 |
Figure 8 Survival analysis of GATA family members in the TCGA-PAAD cohort. (A) Kaplan-Meier curves for overall survival of PC patients based on the expression of GATA family members. (B) Kaplan-Meier curves for regression-free survival of PC patients based on the expression of GATA family members. |
Functional Enrichment Analysis of GATA 3/4/6 and Co-Expressed Genes in Pancreatic Cancer
We used the cBioPortal database to screen the top 200 genes with the strongest positive correlation to GATA2, GATA3, GATA4, and GATA6, respectively, from the TCGA Pan-Cancer dataset and the QCMG datasets. The four groups’ genes co-expressed with GATA2, GATA3, GATA4, and GATA6 in both datasets simultaneously were obtained using Venn diagrams (Supplementary Figure 2), containing 19, 42, 55, and 84 co-expressed genes, respectively. To explore the potential functions of GATA members in PC, we performed functional enrichment analysis on each of the four groups of co-expressed genes, which included GO annotation, KEGG pathway enrichment, and DO (disease ontology) enrichment analysis carried out by using the Hiplot platform. The GO enrichment analysis included a biological process (BP), cell component (CC), molecular function (MF). In the top 10 GO-BP terms of the genes co-expressed with GATA3, GATA3 was primarily involved in wound healing, positive regulation of epithelial cell migration, and positive regulation of leukocyte differentiation (Figure 9A). GO analysis revealed that GATA3 was associated with multiple biological processes, most frequently regarding the immune system, including but not limited to the regulation of lymphocyte activation, regulation of inflammatory response. The KEGG pathway enrichment analysis showed that the GATA3 co-expressed group was significantly correlated with the pathway of Cellular senescence and MicroRNAs in cancer. Moreover, GATA3, TGFB1, and TGFB2 were potentially involved in inflammatory bowel disease (Figure 9B). The results of PPI analysis revealed potential interactions between GATA3 and TGFB1and between GATA3 and IKZF2 (Figure 9C). The GO-BP analysis of GATA6 co-expressed genes found they were enriched in pancreas development, digestive tract development, digestive system development, and lung epithelium development (Figure 10A and B). KEGG pathway analysis indicated that FOXA3, PDX1, and HNF1B, in the GATA6 co-expression group, enriched in maturity-onset diabetes of the young (Supplementary Figure 3). The PPI network of the GATA6 co-expressed group also showed that GATA6 mainly interacted with SOX9, HNF1B, SHH, and other proteins. Moreover, they were involved in the process of digestive tract development, endocrine pancreas development (Supplementary Figure 4). We found that AKR1B10, CLDN18, ANXA10, AGR2, TFF1, SOX9, PDX1, GATA6, CTSE associated with pancreatic intraepithelial neoplasia in an additional DisGeNET enrichment analysis (Figure 10C).
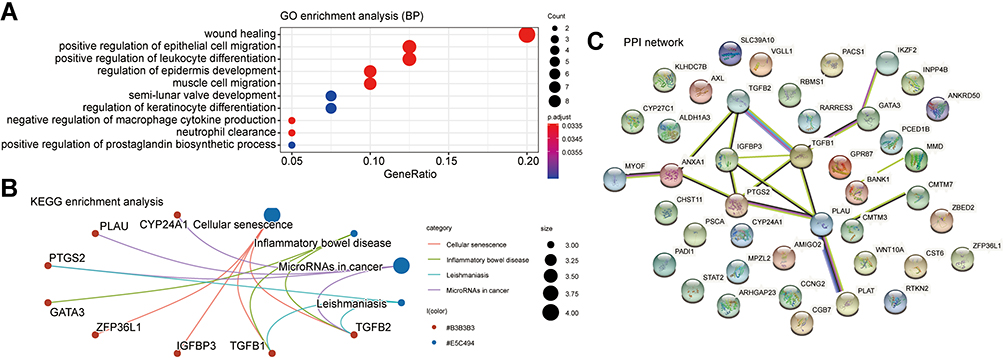 |
Figure 9 Function prediction of the group of genes co-expressed with GATA3 in pancreatic cancer. (A) GO function enrichment analysis in biological processes, (B) KEGG pathway enrichment analysis. (C) PPI network based on the STRING database. Abbreviations: GO, Gene Ontology; KEGG, Kyoto Encyclopedia of Genes and Genomes; PPI, protein-protein interaction. |
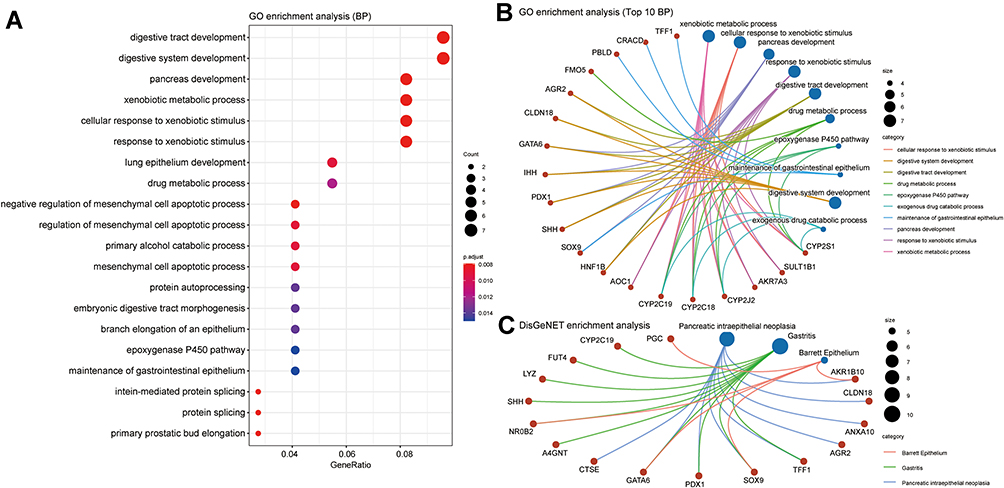 |
Figure 10 Function prediction of the group of genes co-expressed with GATA6 in pancreatic cancer. (A) The top 20 biological processes in GO functional enrichment analysis, (B) Three biological processes with the involvement of GATA6 in GO-BP analysis, (C) DisGeNET enrichment analysis. |
The Correlation Between GATA Gene Expression and Immune Infiltration
To better understand the role of GATA family members in the infiltration of immune cells in pancreatic cancer, we used the “gene” module of the TIMER2.0 database for rough correlation analysis. The analysis included the relationship between the expression of each member of the family and the infiltration of six kinds of immune cells (B cells, CD4+T cells, CD8+T cells, dendritic cells, macrophages, and neutrophils). The results were presented in the form of a scatter diagram (Figure 11). There was a positive correlation between GATA3 expression and the CD8+ T cells (Cor=0.315, p=2.69e−05), the dendritic cell (Cor=0.289, p=2.69e−05), neutrophils (Cor=0.246, p=1.09e−03), similar results were obtained for GATA1 and GATA2. However, GATA4 showed a negative correlation with the level of four kinds of immune cells infiltration, including CD8+T cells, DCs, and neutrophils. These correlations may suggest a potential mechanism by which the GATA family regulates the infiltration of immune cells within the pancreatic cancer microenvironment.
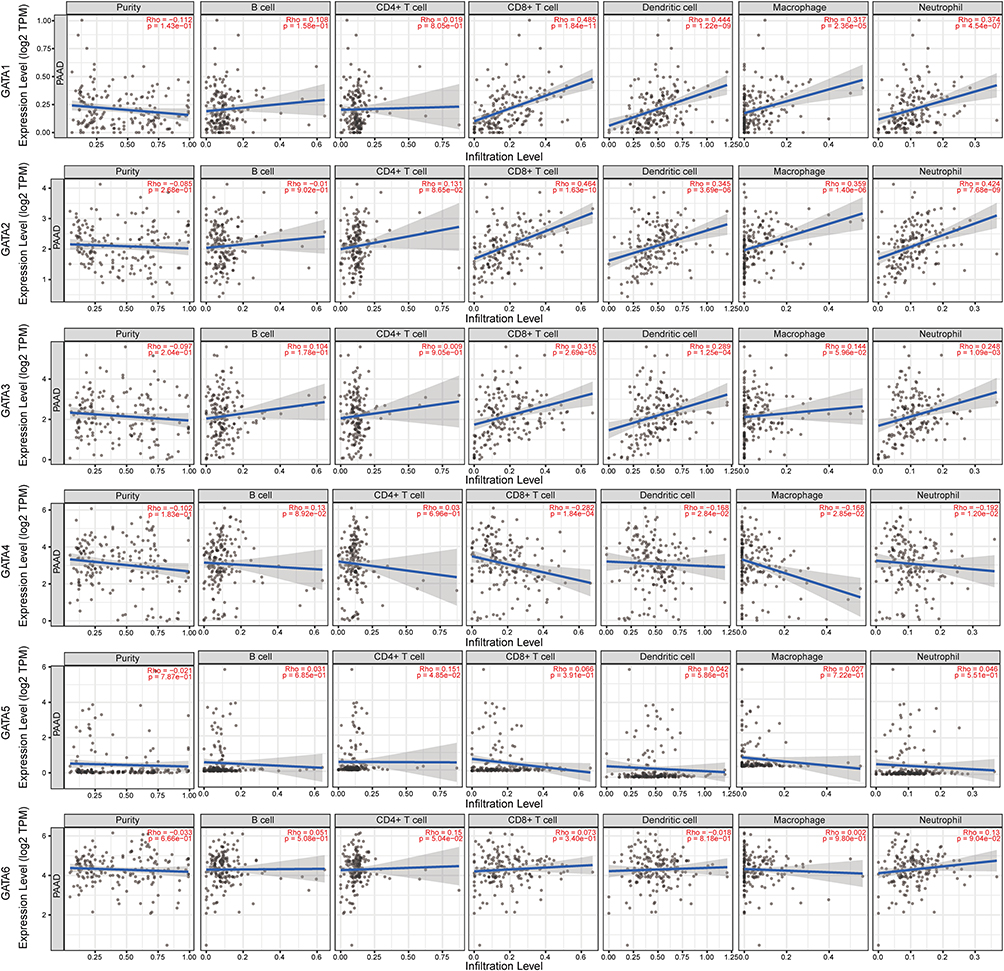 |
Figure 11 The relationships between GATA family genes mRNA expression and immune cell infiltration in pancreatic cancer based on Spearman correlation analysis. (“p < 0.05, Rho > 0” represents positive correlation; “p < 0.05, Rho < 0” represents negative correlation; “p > 0.05” represents not significant). |
The Relationship Between GATA Family Members and Pancreatic Adenocarcinoma TME at the Single-Cell Level
We used the single-cell RNA-seq dataset PAAD_CRA001160 from the TISCH database to predict the expression of GATA family members in the pancreatic cancer tumor microenvironment at the single-cell level. The UMAP displays that GATA3 expressed higher in exhausted CD8 T Cells in the pancreatic cancer TME, GATA4 was expressed in acinar cells and malignant cells, and GATA6 was mainly expressed in normal ductal cells and fibroblasts as well as in malignant cells (Figure 12A). The violin plot compares the GATAs’ expression between normal pancreas and pancreatic cancer samples across multiple cell types (Figure 12B). The expression of GATA3 was significantly higher in B cells, exhausted CD8 T Cells, and DCs in the pancreatic cancer microenvironment, compared with normal pancreas. The expression of GATA4 and GATA6 by acinar cells, ductal cells, and endocrine cells in pancreatic cancer TME was lower than that in the normal pancreas. These findings indicate that the GATA family genes are associated with the complex composition of the pancreatic cancer TME and deserve further investigation.
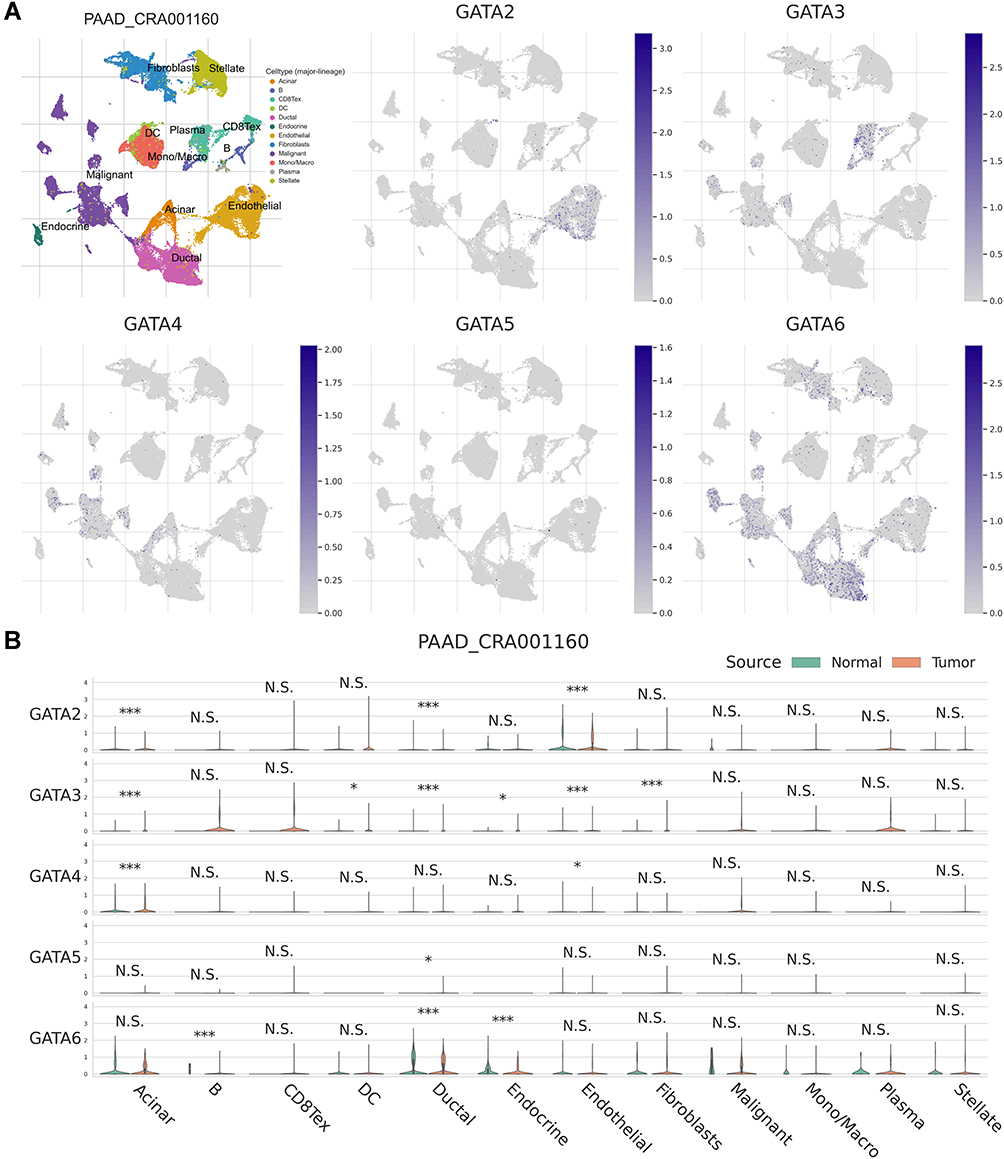 |
Figure 12 The expression of GATA family members in PAAD_CRA001160 at single-cell resolution. (A) The localization of GATA family members in the tumor microenvironment of pancreatic cancer. (B) The comparison of GATA family members’ expression between normal pancreas and pancreatic cancer samples across cell types. The significance of the difference between the two groups in each cell type is evaluated through the Mann–Whitney U-test and adjusted through Benjamini–Hochberg correction. “N.S.” represents q > 0.05; “*” represents 0.01 < q ≤ 0.05; “***” represents q ≤ 0.001. |
Discussion
Pancreatic cancer is an invasive and highly diffuse malignant tumor of the digestive system. Current clinical treatment options for patients with pancreatic cancer include radical surgical resection, which is also the primary one at present, in addition to adjuvant chemotherapy routinely performed after surgery, neoadjuvant chemotherapy, and first-line treatment for patients with advanced disease.3 Pancreatic cancer remains a refractory malignancy, and even a small group of patients diagnosed with early-stage of localized resectable tumor still have a poor survival outcome, with only 20% survival rate at five years after receiving standard treatment,2 while an even larger group of patients present with the advanced or terminal stage at initial diagnosis and cannot even undergo surgical procedures. Therefore, there is an urgent need to develop new approaches for the early diagnosis of pancreatic cancer and improving survival prognosis.
GATA transcription factor family includes six GATA binding proteins encoded by the genes GATA1/2/3/4/5/6 respectively, which engage in the embryonic development process of the mammalian and play an essential role in cell fate specialization and organizational morphogenesis.4 Among this family, GATA3, GATA4, and GATA6 have the largest capacity to substitute for Oct4 in the reprogramming process, which inhibits over-represented ectodermal lineage markers and boosts reprogramming success.37
In recent years, various studies have revealed that the GATA family members may contribute to the progression and development of malignancies. Peters et al38 found that, for those with low expression of GATA1 and GATA2 in patients with renal clear cell carcinoma, they presented a more aggressive tumor subtype and a worse prognosis, implying that GATA1 and GATA2 may be associated with the progression and aggressiveness of renal clear cell carcinoma. The transcription factor GATA2 is known to enhance androgen receptor (AR) binding and activity. Its over-expression in prostate cancer increased in cellular motility, proliferation, tumorigenicity, and resistance to standard therapy,39 which indicates that GATA2 has a crucial role in driving prostate cancer aggressiveness. However, the present study showed that the expression of GATA2 was decreased in pancreatic cancer compared to normal tissue. The survival analysis shows that low expression of GATA2 was significantly correlated with poorer OS in PC patients. This result implies that, in contrast to the previous findings on prostate cancer, GATA2 has not shown a role in driving the aggressiveness of pancreatic cancer. Comparison of gene expression across cell types at the single-cell level showed that GATA2 is predominantly located on endothelial cells. Its expression level could, to some extent, reflect the abundance of endothelial cells in TME of pancreatic cancer, which also supported the results that GATA2 might represent a protective factor for PC patients in this study.
Asselin-Labat et al40 reported that GATA3 acted as a key regulator in embryonic and adult mammary gland morphogenesis, with the potential to direct the differentiation of progenitor cells in the adult gland along the luminal-cell lineage. Furthermore, GATA3 regulates tumor cell differentiation, inhibits tumor metastasis, and is over-expressed in the “Luminal” subtype of breast cancer.6,7 Singer et al41 reported that GATA3 acts as a critical regulator driving the dysfunctional phenotype of CD8+ TILs, and this dysfunctional or “exhausted” CD8+ T cell constitutes a barrier to anti-tumor immunity. In this study, GATA3 was higher in human pancreatic cancer than in normal tissues by gene expression analysis, which was also confirmed by immunohistochemical staining from HPA. Though the expression of GATA3 in PC patients in this study analysis showed no significant correlation with tumor stage and prognosis, high levels of GATA3 was found to be associated with basal subtypes considered poor prognosis. Though the expression of GATA3 in PC patients in this study analysis showed no significant correlation with tumor stage and survival prognosis, high expression levels of GATA3 were found to be associated with basal subtypes in pancreatic cancer. GATA3 was positively correlated with exhausted CD8+ T cell infiltration in this study and significantly expressed in exhausted CD8+ T cells of pancreatic cancer TME. These findings were consistent with the report of Meromit Singer et al,41 indicated that GATA3 might be a candidate marker to guide immunotherapy for pancreatic cancer. It still requires more studies to confirm the role of GATA3 in the development of PAAD.
Previous studies42 reported that lower GATA4 and GATA5 in the colon, gastric, esophageal, and lung cancers might be associated with the hypermethylation of the gene promoter region. Through our analysis of gene expression in pancreatic cancer, we found that the gene GATA4 was also presented in a lower expression level in PC and correlated with the survival prognosis of patients. However, no significant alteration of GATA5 expression level in PC was found in our analysis.
The transcription factor GATA6 is known to regulate the differentiation of distal airway epithelial cells and cooperates with HOPX in modulating overlapping alveolar differentiation and invasive target genes, which restrict the metastatic competence of the lung adenocarcinoma cells.10 GATA6 is required for the maintenance of the acinar differentiation programme in the normal pancreas. Martinelli et al11 have found that, with the decrease of GATA6 expression in the pancreas, acinar cells became more sensitive to KrasG12V mutations, leading to extensive and persistent acinar-ductal metaplasia, which is the initial step in KrasG12V driven pancreatic carcinogenesis. In addition, GATA6 controls the process of epithelial-mesenchymal transition and thus contributes to the inhibition of pancreatic cancer progression.12 In the present study, we found that the expression level of GATA6 was increased in PC tissues compared with normal tissues. Moreover, GATA6 expression varied between the pathological stages, with a high expression more frequently seen in stage II pancreatic cancer. We compared GATA6 expression differences across molecular subtypes of pancreatic cancer in two independent cohorts. We found that compared with the basal-like subtype, GATA6 expressed at higher levels in the classical subtype. Patients with the classical subtype of pancreatic cancer showed a better response to mFOLFIRINOX, the current first-line therapy regimen, and a more promising prognosis than the basal subtype.14,25,43 In addition, in the univariate survival analysis from the ICGC cohort, we found that high GATA6 expression was associated with better OS. Although there were no significant results in the other two cohorts, we still included GATA6 as a potential prognostic factor in the subsequent exploration, considering the previous findings from Martinelli et al11,12 and the relationship between GATA6 and pancreatic cancer staging and staging in this study.
In the current study, we attempted to identify the correlation between GATAs and pancreatic cancer using online bioinformatics tools and explore their biological functions and prognostic value in pancreatic cancer, which will help us develop new diagnostic and therapeutic markers. First, the GATA family member with abnormal expression in pancreatic cancer was collected based on gene expression analysis in multiple pancreatic cancer datasets. Then, we analyzed the associations between the expression of GATA family members and clinicopathological parameters of PC patients and studied their prognostic value in multiple datasets containing follow-up data. We found that GATA3 and GATA6 expressed significantly up-regulated in PAAD tissues, while GATA2 and GATA4 expressed down-regulated. Moreover, GATA4 expressed at lower levels in early-stage patients compared to late-stage, the lower GATA4 correlated with better RFS, OS. In contrast, GATA6 expressed at a higher level in the early phase patients; a higher GATA6 correlates with the classical subtype of pancreatic cancer and a better survival prognosis. By far, GATA4 and GATA6 in the GATA family might be potential prognostic biomarkers for pancreatic cancer, and GATA6 might be a pivotal indicator to distinguish the molecular subtype of pancreatic cancer.
We further explored and analyzed the GATA family members differentially expressed in pancreatic cancer, GATA2, GATA3, GATA4, and GATA6, to understand their roles in the development of pancreatic cancer and their distribution in different cell types in the tumor microenvironment. GATA2 is a transcriptional activator that regulates the expression of the endothelin-1 gene in endothelial cells. Co-expressed with EPAS1, CD34, and TAL1, GATA2 might participate in multiple biological processes such as angiogenesis and vasculature system development. The single-cell level analysis also revealed that GATA2 enriched mainly in endothelial cells and significantly lower in pancreatic cancer than in normal pancreas. The protein encoded by GATA3 is a trans-acting T cell-specific transcription factor, GATA3, which can bind to enhancers of the T cell receptor α and δ genes and is necessary for the T-helper 2 (Th2) differentiation process following immune and inflammatory responses. GATA3 is mainly associated with immune cell infiltration in pancreatic cancer. The transcription factor GATA4 plays a crucial role in cardiac development and function as a transcriptional activator and participates in biological processes such as endocrine pancreas development, pancreatic development, liver development, and digestive tract morphogenesis with co-expression of SOX9 and HNF1B. The transcription factor GATA6 regulates the expression of SEMA3C and PLXNA2, which are engaged in the gene regulation of gastric epithelial cells specifically. GATA6 is co-expressed with SOX9 and HNF1B in pancreatic cancer. They are both involved in various biological processes such as endocrine pancreas development, pancreatic development, liver development, and digestive tract development.44 Single-cell level analysis revealed that GATA4 and GATA6 were distributed to epithelial cells in the tumor microenvironment, with GATA4 expressed mainly in acinar cells and malignant cells and GATA6 mainly in ductal epithelial cells and malignant cells. Despite the high specificity of the cell type of GATA4 distribution in pancreatic cancer, the low expression level of GATA4 was not conducive to analysis. In contrast, GATA6 expression levels were comparatively high so that GATA6 might reflect normal pancreatic and tumor cells’ abundance. These findings contribute to the interpretation of GATA6 as a pancreatic cancer subtype marker at the level of the tumor microenvironment.
Although we obtained several novel findings by combining multiple analysis methods and published datasets, this study has a few limitations. Firstly, our results were mainly based on bioinformatics analysis. The prognostic significance regarding GATA family members in pancreatic cancer needs to be validated in further large-scale prospective clinical research. Secondly, the lack of consistent clinical material across various datasets might be the reason for not obtaining significant results from this study’s analysis of clinicopathological data aspects. Finally, this study predicted the functions of GATA family members, co-expressed genes in pancreatic cancer, and potential correlation with the tumor microenvironment. However, the exact biological functions and mechanisms of GATA family members in pancreatic cancer remain to be further investigated through in vivo and in vitro experiments.
Conclusions
In conclusion, the current study found that the expression of GATA4 and GATA6 significantly associated with clinical survival outcome and molecular subtype of pancreatic cancer patients, GATA3 positively related with the state of immune infiltration, and GATA6 related with the abundance of different epithelial cells types in the tumor microenvironment of pancreatic cancer. These findings provided a reference for predicting clinical prognosis and a novel direction for exploring the research on the pancreatic cancer tumor microenvironment.
Abbreviations
PC, pancreatic cancer; GATAs, GATA family members; GEPIA, Gene Expression Profile Interaction Analysis; KM, the Kaplan-Meier analysis; GO, gene ontology; KEGG, Kyoto Encyclopedia of Genes and Genomes; PPI, protein-protein interaction; TCGA, The Cancer Genome Atlas; GTEx, Genotype-Tissue Expression; PAAD, pancreatic adenocarcinoma; R2, The R2: Genomics Analysis and Visualization Platform; GEO, Gene Expression Omnibus; HPA, The Human Protein Atlas; OS, overall survival; RFS, relapse-free survival; STRING, the Search Tool for The Retrieval of interaction Gene/Proteins; TISCH, Tumor Immune Single-cell Hub; TME, tumor microenvironment.
Data Sharing Statement
The datasets used to support the findings of this study are publicly and openly available, each of which can be found in web servers linked in the body of the text. Here, we list links to all data sources: www.oncomine.org, http://gepia2.cancer-pku.cn/, https://www.cbioportal.org/, http://r2.amc.nl, https://www.proteinatlas.org, http://kmplot.com, http://bioinformatica.mty.itesm.mx/SurvExpress, http://timer.cistrome.org/, http://tisch.comp-genomics.org/home/.
Ethics Statement
TCGA, GEO, cBioPortal, and TISCH belong to public databases. The patients involved in the database have obtained ethical approval. Users can download relevant data for free for research and publish relevant articles. Our study is based on open-source data, so there are no ethical issues and other conflicts of interest. Ethics approval was waived by the First Affiliated Hospital of Xinjiang Medical University Ethics Committee.
Acknowledgments
We would like to thank several reviewers for their valuable comments and suggestions to improve the quality of the paper. We would like to acknowledge the support of the First Affiliated Hospital of Xinjiang Medical University.
Disclosure
The authors declare that there is no conflict of interest regarding the publication of this paper.
References
1. Siegel RL, Miller KD, Jemal A. Cancer statistics, 2020. CA Cancer J Clin. 2020;70(1):7–30. doi:10.3322/caac.21590
2. Mizrahi JD, Surana R, Valle JW, Shroff RT. Pancreatic cancer. Lancet. 2020;395(10242):2008–2020. doi:10.1016/S0140-6736(20)30974-0
3. Grossberg AJ, Chu LC, Deig CR, et al. Multidisciplinary standards of care and recent progress in pancreatic ductal adenocarcinoma. CA Cancer J Clin. 2020;70(5):375–403. doi:10.3322/caac.21626
4. Shu J, Zhang K, Zhang M, et al. GATA family members as inducers for cellular reprogramming to pluripotency. Cell Res. 2015;25(2):169–180. doi:10.1038/cr.2015.6
5. Tremblay M, Sanchez-Ferras O, Bouchard M. GATA transcription factors in development and disease. Development. 2018;145(20). doi:10.1242/dev.164384
6. Kouros-Mehr H, Slorach EM, Sternlicht MD, Werb Z. GATA-3 maintains the differentiation of the luminal cell fate in the mammary gland. Cell. 2006;127(5):1041–1055. doi:10.1016/j.cell.2006.09.048
7. Kouros-Mehr H, Bechis SK, Slorach EM, et al. GATA-3 links tumor differentiation and dissemination in a luminal breast cancer model. Cancer Cell. 2008;13(2):141–152. doi:10.1016/j.ccr.2008.01.011
8. Chen JQ, Bao Y, Lee J, et al. Prognostic value of the trichorhinophalangeal syndrome-1 (TRPS-1), a GATA family transcription factor, in early-stage breast cancer. Ann Oncol. 2013;24(10):2534–2542. doi:10.1093/annonc/mdt190
9. Moriguchi T. Development and carcinogenesis: roles of GATA factors in the sympathoadrenal and urogenital systems. Biomedicines. 2021;9(3):299. doi:10.3390/biomedicines9030299
10. Cheung WK, Zhao M, Liu Z, et al. Control of alveolar differentiation by the lineage transcription factors GATA6 and HOPX inhibits lung adenocarcinoma metastasis. Cancer Cell. 2013;23(6):725–738. doi:10.1016/j.ccr.2013.04.009
11. Martinelli P, Madriles F, Canamero M, et al. The acinar regulator Gata6 suppresses KrasG12V-driven pancreatic tumorigenesis in mice. Gut. 2016;65(3):476–486. doi:10.1136/gutjnl-2014-308042
12. Martinelli P, Carrillo-de Santa Pau E, Cox T, et al. GATA6 regulates EMT and tumour dissemination, and is a marker of response to adjuvant chemotherapy in pancreatic cancer. Gut. 2017;66(9):1665–1676. doi:10.1136/gutjnl-2015-311256
13. Chang Z, Zhang Y, Liu J, et al. GATA1 promotes gemcitabine resistance in pancreatic cancer through antiapoptotic pathway. J Oncol. 2019;2019:9474273. doi:10.1155/2019/9474273
14. O’Kane GM, Grunwald BT, Jang GH, et al. GATA6 expression distinguishes classical and basal-like subtypes in advanced pancreatic cancer. Clin Cancer Res. 2020;26(18):4901–4910. doi:10.1158/1078-0432.CCR-19-3724
15. Patil S, Steuber B, Kopp W, et al. EZH2 regulates pancreatic cancer subtype identity and tumor progression via transcriptional repression of GATA6. Cancer Res. 2020;80(21):4620–4632. doi:10.1158/0008-5472.CAN-20-0672
16. Su W, Zhu S, Chen K, et al. Overexpressed WDR3 induces the activation of hippo pathway by interacting with GATA4 in pancreatic cancer. J Exp Clin Cancer Res. 2021;40(1):88. doi:10.1186/s13046-021-01879-w
17. Tang Z, Li C, Kang B, Gao G, Li C, Zhang Z. GEPIA: a web server for cancer and normal gene expression profiling and interactive analyses. Nucleic Acids Res. 2017;45(W1):W98–W102. doi:10.1093/nar/gkx247
18. Tang Z, Kang B, Li C, Chen T, Zhang Z. GEPIA2: an enhanced web server for large-scale expression profiling and interactive analysis. Nucleic Acids Res. 2019;47(W1):W556–W560. doi:10.1093/nar/gkz430
19. Weinstein JN, Collisson EA, Mills GB, et al; Cancer Genome Atlas Research N. The cancer genome atlas pan-cancer analysis project. Nat Genet. 2013;45(10):1113–1120. doi:10.1038/ng.2764
20. Lonsdale J, Thomas J, Salvatore M. The Genotype-Tissue Expression (GTEx) project. Nat Genet. 2013;45(6):580–585. doi:10.1038/ng.2653
21. Ardlie KG, Deluca DS, Segrè AV. Human genomics. The Genotype-Tissue Expression (GTEx) pilot analysis: multitissue gene regulation in humans. Science. 2015;348(6235):648–660. doi:10.1126/science.1262110
22. Cerami E, Gao J, Dogrusoz U, et al. The cBio cancer genomics portal: an open platform for exploring multidimensional cancer genomics data. Cancer Discov. 2012;2(5):401–404. doi:10.1158/2159-8290.CD-12-0095
23. Gao J, Aksoy BA, Dogrusoz U, et al. Integrative analysis of complex cancer genomics and clinical profiles using the cBioPortal. Sci Signal. 2013;6(269):pl1. doi:10.1126/scisignal.2004088
24. Bailey P, Chang DK, Nones K, et al. Genomic analyses identify molecular subtypes of pancreatic cancer. Nature. 2016;531(7592):47–52. doi:10.1038/nature16965
25. Moffitt RA, Marayati R, Flate EL, et al. Virtual microdissection identifies distinct tumor- and stroma-specific subtypes of pancreatic ductal adenocarcinoma. Nat Genet. 2015;47(10):1168–1178. doi:10.1038/ng.3398
26. Uhlen M, Fagerberg L, Hallstrom BM, et al. Proteomics. Tissue-based map of the human proteome. Science. 2015;347(6220):1260419. doi:10.1126/science.1260419
27. Uhlen M, Zhang C, Lee S, et al. A pathology atlas of the human cancer transcriptome. Science. 2017;357(6352). doi:10.1126/science.aan2507
28. Nagy A, Munkacsy G, Gyorffy B. Pancancer survival analysis of cancer hallmark genes. Sci Rep. 2021;11(1):6047. doi:10.1038/s41598-021-84787-5
29. Aguirre-Gamboa R, Gomez-Rueda H, Martinez-Ledesma E, et al. SurvExpress: an online biomarker validation tool and database for cancer gene expression data using survival analysis. PLoS One. 2013;8(9):e74250. doi:10.1371/journal.pone.0074250
30. Yu G, Wang LG, Han Y, He QY. clusterProfiler: an R package for comparing biological themes among gene clusters. OMICS. 2012;16(5):284–287. doi:10.1089/omi.2011.0118
31. Szklarczyk D, Gable AL, Lyon D, et al. STRING v11: protein-protein association networks with increased coverage, supporting functional discovery in genome-wide experimental datasets. Nucleic Acids Res. 2019;47(D1):D607–D613. doi:10.1093/nar/gky1131
32. Li T, Fu J, Zeng Z, et al. TIMER2.0 for analysis of tumor-infiltrating immune cells. Nucleic Acids Res. 2020;48(W1):W509–W514. doi:10.1093/nar/gkaa407
33. Li T, Fan J, Wang B, et al. TIMER: a web server for comprehensive analysis of tumor-infiltrating immune cells. Cancer Res. 2017;77(21):e108–e110. doi:10.1158/0008-5472.CAN-17-0307
34. Li B, Severson E, Pignon JC, et al. Comprehensive analyses of tumor immunity: implications for cancer immunotherapy. Genome Biol. 2016;17(1):174. doi:10.1186/s13059-016-1028-7
35. Sun D, Wang J, Han Y, et al. TISCH: a comprehensive web resource enabling interactive single-cell transcriptome visualization of tumor microenvironment. Nucleic Acids Res. 2021;49(D1):D1420–D1430. doi:10.1093/nar/gkaa1020
36. Peng J, Sun BF, Chen CY, et al. Single-cell RNA-seq highlights intra-tumoral heterogeneity and malignant progression in pancreatic ductal adenocarcinoma. Cell Res. 2019;29(9):725–738. doi:10.1038/s41422-019-0195-y
37. Shu J, Wu C, Wu Y, et al. Induction of pluripotency in mouse somatic cells with lineage specifiers. Cell. 2015;161(5):1229. doi:10.1016/j.cell.2015.05.020
38. Peters I, Dubrowinskaja N, Tezval H, et al. Decreased mRNA expression of GATA1 and GATA2 is associated with tumor aggressiveness and poor outcome in clear cell renal cell carcinoma. Target Oncol. 2015;10(2):267–275. doi:10.1007/s11523-014-0335-8
39. Rodriguez-Bravo V, Carceles-Cordon M, Hoshida Y, Cordon-Cardo C, Galsky MD, Domingo-Domenech J. The role of GATA2 in lethal prostate cancer aggressiveness. Nat Rev Urol. 2017;14(1):38–48. doi:10.1038/nrurol.2016.225
40. Asselin-Labat ML, Sutherland KD, Barker H, et al. Gata-3 is an essential regulator of mammary-gland morphogenesis and luminal-cell differentiation. Nat Cell Biol. 2007;9(2):201–209. doi:10.1038/ncb1530
41. Singer M, Wang C, Cong L, et al. A distinct gene module for dysfunction uncoupled from activation in tumor-infiltrating T cells. Cell. 2016;166(6):1500–1511 e1509. doi:10.1016/j.cell.2016.08.052
42. Guo M, House MG, Akiyama Y, et al. Hypermethylation of the GATA gene family in esophageal cancer. Int J Cancer. 2006;119(9):2078–2083. doi:10.1002/ijc.22092
43. Aung KL, Fischer SE, Denroche RE, et al. Genomics-driven precision medicine for advanced pancreatic cancer: early results from the COMPASS trial. Clin Cancer Res. 2018;24(6):1344–1354. doi:10.1158/1078-0432.CCR-17-2994
44. Tiyaboonchai A, Cardenas-Diaz FL, Ying L, et al. GATA6 plays an important role in the induction of human definitive endoderm, development of the pancreas, and functionality of pancreatic beta cells. Stem Cell Rep. 2017;8(3):589–604. doi:10.1016/j.stemcr.2016.12.026
 © 2021 The Author(s). This work is published and licensed by Dove Medical Press Limited. The full terms of this license are available at https://www.dovepress.com/terms.php and incorporate the Creative Commons Attribution - Non Commercial (unported, v3.0) License.
By accessing the work you hereby accept the Terms. Non-commercial uses of the work are permitted without any further permission from Dove Medical Press Limited, provided the work is properly attributed. For permission for commercial use of this work, please see paragraphs 4.2 and 5 of our Terms.
© 2021 The Author(s). This work is published and licensed by Dove Medical Press Limited. The full terms of this license are available at https://www.dovepress.com/terms.php and incorporate the Creative Commons Attribution - Non Commercial (unported, v3.0) License.
By accessing the work you hereby accept the Terms. Non-commercial uses of the work are permitted without any further permission from Dove Medical Press Limited, provided the work is properly attributed. For permission for commercial use of this work, please see paragraphs 4.2 and 5 of our Terms.