")
Back to Journals » International Journal of Nanomedicine » Volume 9 » Issue 1
Characterization of rice bran wax policosanol and its nanoemulsion formulation
Authors Ishaka A , Umar Imam M, Mahamud R, Zuki A, Maznah I
Received 2 November 2013
Accepted for publication 22 January 2014
Published 9 May 2014 Volume 2014:9(1) Pages 2261—2269
DOI https://doi.org/10.2147/IJN.S56999
Checked for plagiarism Yes
Review by Single anonymous peer review
Peer reviewer comments 3
Aminu Ishaka,1,2 Mustapha Umar Imam,1 Rozi Mahamud,3 Abu Bakar Zakaria Zuki,4 Ismail Maznah1
1Laboratory of Molecular Biomedicine, Institute of Bioscience, University Putra Malaysia, Serdang, Selangor, Malaysia; 2Department of Medical Biochemistry, College of Health Sciences, Usmanu Danfodiyo University, Sokoto, Nigeria; 3Faculty of Medicine and Health Sciences, 4Faculty of Veterinary Medicine, University Putra Malaysia, Serdang, Selangor, Malaysia
Abstract: Policosanol, a mixture of long-chain alcohols found in animal and plant waxes, has several biological effects; however, it has a bioavailability of less than 10%. Therefore, there is a need to improve its bioavailability, and one of the ways of doing this is by nanoemulsion formulation. Different droplet size distributions are usually achieved when emulsions are formed, which solely depends on the preparation method used. Mostly, emulsions are intended for better delivery with maintenance of the characteristics and properties of the leading components. In this study, policosanol was extracted from rice bran wax, its composition was determined by gas chromatography mass spectrophotometry, nanoemulsion was made, and the physical stability characteristics were determined. The results showed that policosanol nanoemulsion has a nanosize particle distribution below 100 nm (92.56–94.52 nm), with optimum charge distribution (-55.8 to -45.12 mV), pH (6.79–6.92) and refractive index (1.50); these were monitored and found to be stable for 8 weeks. The stability of policosanol nanoemulsion confers the potential to withstand long storage times.
Keywords: rice bran wax, policosanol, nanoemulsion, characterization
Introduction
Naturally occurring compounds in plants have received tremendous attention for many decades because of their therapeutic and risk-minimizing potential for many diseases, including chronic diseases such as cardiovascular diseases, diabetes, and neurodegenerative diseases.1–3 It is not just coincidence that rice, on which most of the world’s population depends for survival, contains several health-promoting bioactive compounds.4–7 Rice accounts for about 35%–80% of the calorie intake of most people in Asia, including Malaysia, and less than 20% of the calorie intake of a significant number of people among the African and Latin American population.8
One of the products of rice milling is rice bran, which contains several compounds that have nutritional and biological potential in its oily extract, rice bran oil (RBO). RBO contains oryzanol, a significant amount of tocopherols, tocotrienols, phytic acid, lecithin, inositol, and wax. In the wax, which was initially considered a waste product, wax esters and aliphatic alcohols (policosanols) are present. Supercritical fluid extraction9 is the best extraction method for RBO, but it can be extracted using other methods such as solvent extraction and ohmic heating.10,11 From RBO, a eutectic wax substance can be extracted using a number of available methods, such as winterization, and solvent and catalytic methods.12–14
Policosanol is a mixture of naturally occurring high molecular weight aliphatic primary alcohols present in a significant amount in rice bran wax. It was initially isolated from sugar cane wax by Cuban researchers and developed by Cuban Dalmer laboratories.15 Other sources of policosanol include beeswax, wheat, sorghum, maize, rice, broccoli, spinach, alfalfa, and other cereal grains. The major components of policosanol mixture are octacosanol (66%), triacontanol (12%), and hexacosanol (7%). The remaining 15% is made up of other alcohols, namely, tetracosanol, heptacosanol, docosanol, nonacosanol, and tetratriacontanol, which are the minor components.16 Several reports, including many clinical trials, have shown that policosanols have significant health-promoting activities such as the reduction of lipid levels,17–21 platelet aggregation reduction,22 antiviral activity,23 reduction of prostate enlargement, and relief of intermittent claudication.24 In contrast, there are conflicting findings about the efficacy of policosanol, particularly with regard to lowering lipid levels.25–30 However, direct comparisons of the two findings have been limited by differences in regional dietary patterns and by the unknown variability of the composition of the policosanol products that were tested.31 Despite the amazing number of reported biological activities of policosanol, its bioavailability was reported to be between 5% and 12%, with absorption after oral administration ranging from 10%–35%.32
There appears to be little literature on the nanoformulation of policosanol. Only two patents were found that described the formation of policosanol nanoparticles,33,34 and one of the patents described formation of policosanol nanoemulsion by continuous stirring and heating.33 Nanoemulsion is one of the emerging nanotechnologies, that confer the controlled delivery of pharmaceuticals and cosmetics.35 Nanoemulsions are oil-in-water (O/W) or water-in-oil (W/O) transparent liquid dispersions with a diameter of 20–200 nm.36,37 It is quite apparent that the smaller the droplet size, the more resistant the nanoemulsion is to destabilization because of gravitational separation, flocculation, and coalescence. To date, no known studies have used high-pressure homogenization to form rice bran wax (RBW) policosanol nanoemulsion. In the present study, policosanol was extracted from RBW, a nanoemulsion was prepared, and its stability characteristics were monitored. The policosanol nanoemulsion formation was performed in two steps: pre-emulsion formation and high-pressure homogenization.
Methodology
Materials
Rice bran was obtained from Bernas milling factory in Kuala Selangor, Selangor, Malaysia. RBO was extracted by supercritical fluid extraction (SFE), using carbon dioxide; RBW was separated from RBO; and policosanol was extracted from RBW. All the reagents and solvents used were either analytical grade or high-performance liquid chromatography grade.
Extraction of RBO
About 160 g of freshly obtained rice bran, stabilized using an automated microwave oven (2,450 MHz, 550 W, 110°C for 200 seconds), and stored at 4°C was extracted using an SFE machine (Thar 1000 F; Thar Technologies Inc., Pittsburgh, PA, USA) for 3 hours at 60°C, 600 bars pressure, with a carbon dioxide flow rate of 25 g/minute.38 The extracted oil was collected and percentage yield calculated with respect to the rice bran sample weight.
Extraction of RBW from RBO
The RBW in the SFE-extracted RBO sample was separated as acetone insoluble, according to the method proposed by Ramaswamy et al13 with slight modification. Acetone chilled to approximately 4°C was added to 5 mL RBO (1:1, volume/volume [v/v]), and the mixture was centrifuged at 4,000 rpm for 25 minutes. Supernatant oil was decanted carefully, and the insoluble portion was washed with 5 mL chilled acetone and centrifuged. The wax obtained was blown with nitrogen, using a nitrogen generator, and then dried in an oven at 60°C. The dried wax was then weighed and stored at 4°C until further analyzed.
Extraction of policosanol
Policosanol was extracted from RBW according to the method described by Cravotto39 with some modification. About 10 g RBW was placed into a 200 mL conical flask and hydrolyzed with 100 mL 0.2 M NaOH by sonication with a Power sonic 505 (Hwashin Technology Co., Seoul, Korea) ultrasonicator 50 Hz, 350 W, at 60°C for 90 minutes. The hydrolyzed mixture was then extracted with an equal volume of petroleum ether, cooled down to 2°C, and then divided into 50 mL centrifuge tubes and centrifuged at 4,000 rpm for 10 minutes. The upper petroleum ether layer and the lower NaOH layer were removed by carefully decanting; the middle yellowish layer (policosanol) was collected and freeze dried.
Determination of policosanol content
Policosanol contained in the RBW was determined by gas chromatography mass spectrophotometry (GC-MS). The GC-MS (TSQ series; Thermo Scientific, Waltham, MA, USA) determination of policosanol was according to the method described by Dunford et al40 with some modification. Policosanol standards docosanol, tetracosanol, hexacosanol, and octacosanol were purchased from Axon Scientific, Selangor, Malaysia. A 5 mM concentration mixture of these standards in chloroform was prepared, 0.5 mL of this mixture was derivatized with 0.2 mL N,O-Bis(trimethylsilyl)trifluoroacetamide by incubating at 60°C for 20 minutes, and then the volume was made up to 1 mL by adding more chloroform after cooling to room temperature. RBW policosanol extracts were derivatized the same way. Policosanol standards and RBW policosanol extracts were first injected into the GC-MS machine.
The GC oven temperature was programmed from 150°C to 300°C with a heating rate of 4°C/minute and maintained at this temperature for 15 minutes. Initial flow rate of the carrier gas, helium, was 1.0 mL/minute. Inlet temperature was 300°C. GC-MS parameters were as follows: the MS transfer line temperature was 280°C, the ion source was kept at 230°C, and the MS quadrupole temperature was kept at 150°C. The ionization energy was 70 eV with 2 scans/second and a mass range of 100–1,000 amu. The standards/samples (2 μL) were injected into GC-MS with a 1:10 split ratio. Data analysis was carried out using the machine’s software.
Formation of policosanol nanoemulsion
About 5 g of the extracted policosanol was weighed in a Scott bottle, and 3 g Tween 80 was added; then, 92 g deionized water was added slowly while continuously stirring. The mixture was homogenized at 13,000 rpm for 3 minutes, using an Ultra Turrax® (IKA, Staufen, Germany) to form the pre-emulsion. The pre-emulsion was then passed into a high-pressure homogenizer (Stansted Fluid Power, Ltd., Essex, UK) at 550–600 bars (55–60 MPa), room temperature, for 10 circles, with the emulsion cooled down to 30°C after every circle. The particle size and charge of the formed nanoemulsion was immediately measured using a zeta sizer (Nano-ZS; Malvern Instruments Ltd, Malvern, UK) and was subsequently monitored weekly for 8 weeks. The pH of the nanoemulsion was also monitored using a pH meter (Mettler Toledo, Selangor, Malaysia) throughout the period (8 weeks).
Determination of refractive index
The refractive index of policosanol nanoemulsion was measured using zeta sizer (Nano-ZS) taken at the same time as the particle size and charge measurements.
FTIR
The Fourier transform infrared spectroscopy (FTIR) of the policosanol nanoemulsion was performed according to the method described by Al-Qubaisi et al.41 The spectra of one drop each of policosanol nonoemulsion, RBO and Tween 80; RBW and policosanol powder were recorded over the range of 400–4,000 cm−1 on a Thermo Nicolet Nexus, Smart orbit spectrometer, on spectroscopic-grade potassium bromide (KBr) with 10 tons of pressure.
TEM morphology of the policosanol nanoemulsion
Transmission electron microscopy (TEM) was performed by first premixing the sample using a sonicator and then placing a Formvar-coated copper grid on top of a drop of the sample before allowing it to stand for 20 seconds. The copper grid was then removed and placed on top of a drop of 2% uranyl acetate and allowed to stand for 10 seconds; this was then removed with filter paper, allowed to dry on a Petri dish, and after drying, mounted on TEM (CM12; Phillips, Eindhoven, the Netherlands) with an acceleration of 120 kV and a maximum magnification limit of crystal lattice at 660 k times.
Statistical analysis
All analyses were done in triplicate unless otherwise indicated. The data were analyzed using SPSS version 20 statistical package (IBM Corporation, Armonk, NY, USA) by one-way analysis of variance and presented as means and standard deviation (SD). The significance of the difference between comparisons was determined by Duncan’s multiple range tests. The significant difference was taken to be a value of P<0.05 at a 95% confidence interval.
Results and discussion
RBW policosanol yield
The yield of RBW policosanol, together with that of RBW and RBO, is as depicted in Table 1. The RBO wax content is variable, depending on many factors such as the rice cultivar, extraction method, and processing conditions.42 The highest RBW yield reported ranged from 8.3%–13.7%43 compared with the 1%–3%, 3%–4%, and 5%–7% yields obtained by Reddi et al,44 Cousins et al,45 and Saunders,46 respectively. However, in all of the studies, RBO and RBW were extracted by solvent extraction. In this study, the RBO was extracted by SFE at 600 bars pressure and a temperature of 60°C, which may account for the high yield in the crude RBW. However, when the RBO was fractionated at 30°C and a pressure of 300 bars, RBW yield fell to 11.60 (0.156) (data not shown).
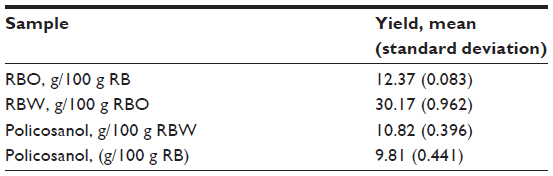 | Table 1 Yields of RBO, RBW, and policosanol |
The yield of policosanol is also variable depending on the extraction method and source. The yield of policosanol from RBW by the high-intensity ultrasound extraction method was 8%.39 In the present study, following the method of Cravotto et al39 with some modification, a higher yield of policosanol was obtained (Table 1). Liu et al47 reported that ultrasonic power is more important in the hydrolysis of RBW than ultrasonic frequency. This explains why good policosanol yield was achievable in this study even though low ultrasound frequency was used (50 Hz). However, a study by Wang et al48 reported a maximum policosanol yield of up to 28% by saponification of RBW via the water (neutralized) extraction method. In the study, Wang et al compared different methods of extraction of policosanol, but all the methods appeared cumbersome and time-consuming.
GC-MS policosanol content analysis
The GC-MS chromatograms of standards and extracts were as shown in Figure 1. The policosanol contents concentrations (Table 2) were calculated on the basis of the peak area of the calibration curve of each of the 4 standards used (Figure 2). Each of the components was identified according to recognition of the mass fragment pattern of its trimethylsilyl derivative as the target ion in m/z. The target ions used were m/z 383 (qualifier ions, m/z 103, 384, 385), m/z 411 (qualifier ions, m/z 103, 412, 413), m/z 439 (qualifier ions, m/z 103, 440, 441), and m/z 467 (qualifier ions, m/z 103, 468, 469) for docosanol, tetracosanol, hexacosanol, and octacosanol, respectively.49
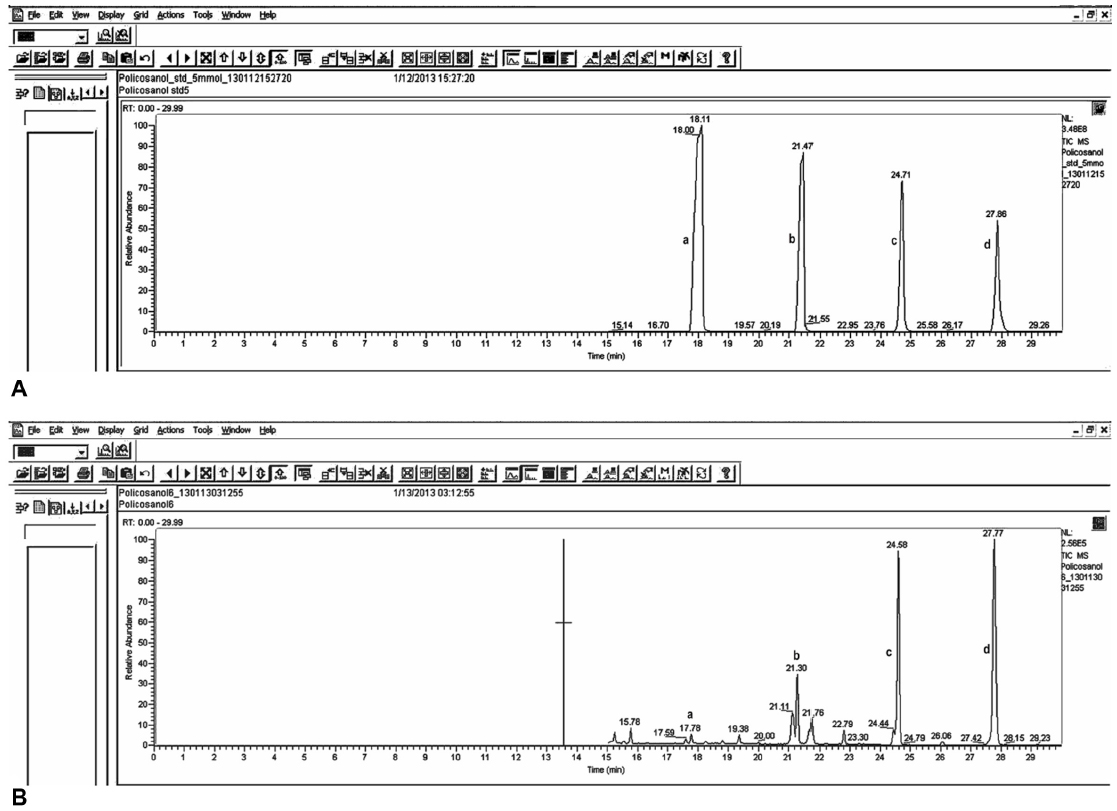 | Figure 1 Chromatogram for policosanol standards (A), rice bran wax policosanol extract (B). |
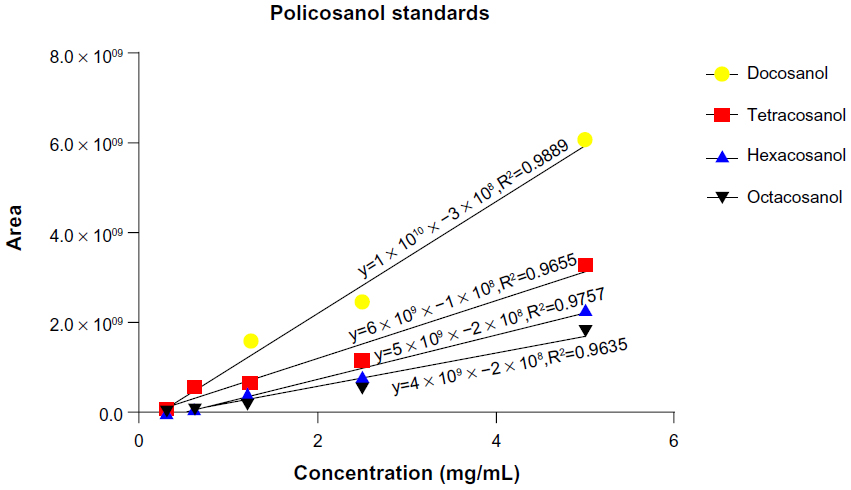 | Figure 2 Standard curves for docosanol, tetracosanol, hexacosanol, and octacosanol. |
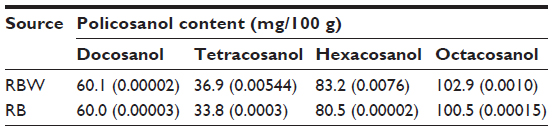 | Table 2 Policosanol composition from gas chromatography mass spectrophotometry analysis of RBW and RB extracts |
The composition of policosanol, based on the chosen standards, showed a significant variation with those obtained in previous studies. For example, octacosanol content was greater than the highest value of 10.53%±0.72% obtained by dry saponification extraction of RBW.48 Hexacosanol (29.4%) and tetracosanol (13.0%) were at higher levels than those reported by Cravotto et al,39 whereas the level of octacosanol was lower (36%) than the 46% reported in their study. All of the policosanol components in this study, docosanol, tetracosanol, hexacosanol, and octacosanol, were higher than those obtained by Asikin et al49 for all of the sugarcane cultivars in their study.
Stability study of policosanol nanoemulsion
The particle size distribution profile of policosanol nanoemulsion was monodisperse with a unimodal peak; most of the particles fell below the size of 100 nm (Figure 3). Droplet size is a good indicator of nanoemulsion stability. Hence, changes, especially an increase in particle size, are suggestive of low-stability emulsions. The droplet size of the policosanol nanoemulsion was stable during the 8 week monitoring period (Table 3).
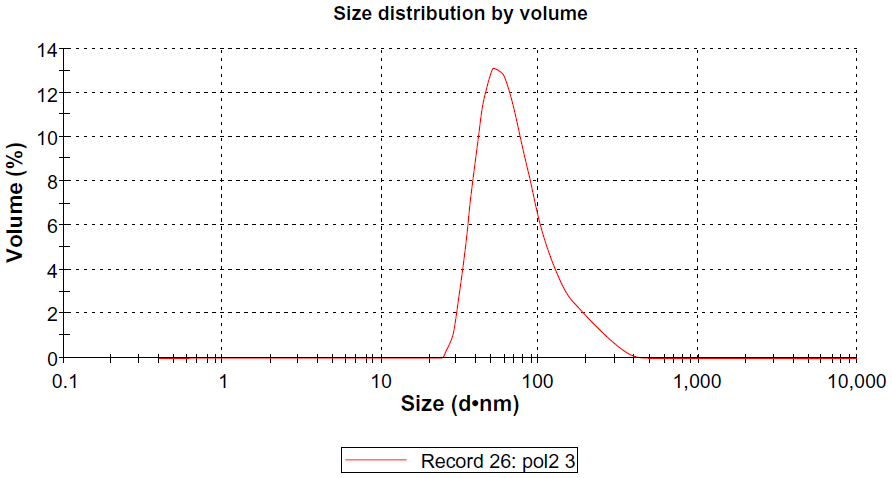 | Figure 3 Particle size distribution profile by volume of policosanol nanoemulsion. |
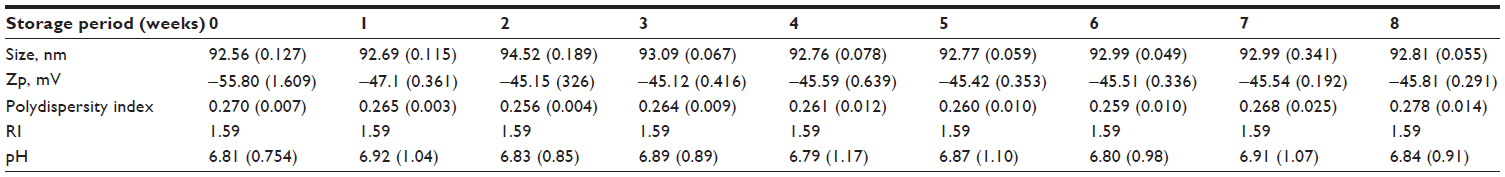 | Table 3 Policosanol nanoemulsion charge and size distribution over 8 weeks of storage |
The zeta potential recorded for the nanoemulsion throughout the 8 week period ranged from −55.8 to −45.12 mV (Table 3) and is within the acceptable range of −60 to −30 mV. This is a good sign because nanoemulsions tend to be more stable at large zeta potential, as the charged particles repel one another, preventing aggregate formation.50 The initial change in zeta potential after 24 hours (Table 3) could be attributed to the change in pH, as an increase in ambient pH was associated with an increase in zeta potential.51 However, the zeta potential remained relatively unchanged despite the slight changes in pH that occurred at certain times throughout the monitoring period.
The polydispersity index of the policosanol nanoemulsion was below 0.3 throughout the 8 week period (Table 3). This clearly indicates the high fidelity of the policosanol nanoemulsion and, hence, reflects its overall stability.
The refractive index of an emulsion measures the strength of multiple lights scattered by the emulsion’s particles. It gives the idea about the isotropicity of the formulation.37,52 Therefore, from the constant value of the refractive index throughout the period of the study (Table 3), it could be concluded that policosanol nanoemulsion was chemically stable in addition to its physical stability.
The pH value of an emulsion is an important determinant of its stability, as changes in pH suggest ongoing chemical reactions that could affect the quality of the system. The policosanol nanoemulsion had a stable pH (6.79–6.92) throughout the period of monitoring, and this pH value falls within the range of pH that is nonirritant to skin and membranes such as mucous membranes.
FTIR of policosanol nanoemulsion
The FTIR spectra of policosanol nanoemulsion, policosanol, RBO, RBW, and Tween 80 are shown in Figure 4. The absorption peak at 3,497 cm−1 on Tween 80 spectra is characteristic stretching vibrations of O-H (O-H group) on the Tween 80 molecule,53 whereas the peak at 3,321 cm−1 on policosanol nanoemulsion spectra is a characteristic stretching of the O-H of primary aliphatic alcohols and water.54–57 The absorption peaks at 2,916 and 2,846 cm−1 on policosanol nanoemulsion, policosanol, RBO, and RBW spectra are attributable to the stretch of C-H aliphatic (group CH3) on the policosanol primary alcohol skeleton.54,55 These were different from the peaks at 2,931 and 2,860 on the Tween 80 spectra, which are attributable to asymmetric and symmetric stretching vibrations of methylene (−CH2).53 The peak at 1,732 cm−1 on policosanol nanoemulsion, policosanol, RBO, and RBW spectra is a result of C=O stretching (C=O of ester group) and appeared at 1,753 cm−1 on Tween 80 spectra.54,55,58,59 The peaks at 1,638 and 1,461 cm−1 appeared only on Tween 80 and policosanol nanoemulsion spectra, and C=C stretching on Tween 80 could be responsible for the 1,638 cm−1 peak, whereas the 1,461 cm−1 peak could be associated with C-H (−CH2 group) bending.55,59 The peaks at 1,421 and 1,170 cm−1 are attributes of H-C-H bending (−CH2 group rocking) on the policosanol structure.59
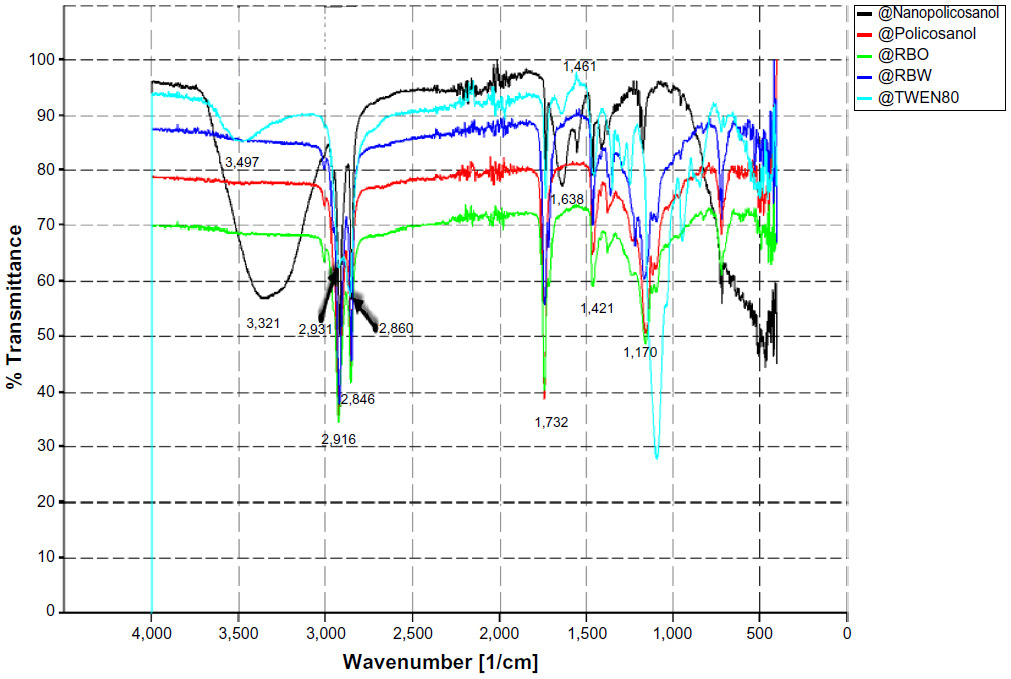 | Figure 4 Fourier transform infrared spectra of policosanol nanoemulsion, policosanol, rice bran oil (RBO), rice bran wax (RBW), and Tween 80 (TWEEN80). |
TEM morphology of the policosanol nanoemulsion
The TEM image of policosanol nanoemulsions is shown in Figure 5. It is apparent that the nanoparticles are spherical in shape with diameters smaller than 100 nm, which supported the zeta sizer particle size results. Moreover, most of the particles are solitary, which is suggestive of the repulsion between the particles preventing aggregation, with the exception of a few noticeable agglomerations.
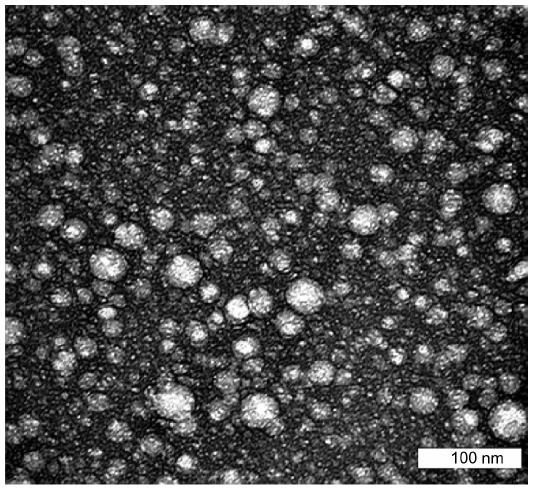 | Figure 5 Transmission electron micrograph of policosanol nanoemulsion. |
Conclusion
This study confirmed that policosanol can be extracted at low-intensity ultrasound, and high-pressure homogenization is a relatively simple and effective technique for producing policosanol nanoemulsions. The particle size and size distribution of the nanoemulsion was stable for a period of 8 weeks and remained relatively unchanged afterward in a predetermined monthly check. The policosanol nanoemulsion had good physical stability with no chemically significant changes that occurred during the storage period. Other forms of policosanol nanoparticles are worth exploring; it is possible that formulations with lower particle sizes and higher stability could be achieved. Studies are underway to determine the bioavailability and bioactivity of the formulated policosanol nanoemulsion to ascertain its application and effectiveness in comparison with policosanol in the management of ailments such as hypercholesterolemia.
Disclosure
The authors of this study report no conflicts of interest in the work.
References
Temple NJ. Antioxidants and disease: more questions than answers. Nutr Res. 2000;20(3):449–459. | |
Stevinson C, Pittler MH, Ernst E. Garlic for treating hypercholesterolemia. A meta-analysis of randomized clinical trials. Ann Intern Med. 2000;133(6):420–429. | |
Frank N, Andrews FM, Elliott SB, Lew J, Boston RC. Effects of rice bran oil on plasma lipid concentrations, lipoprotein composition, and glucose dynamics in mares. J Anim Sci. 2005;83(11):2509–2518. | |
Tai-Sun S, Godber JS. Isolation of four tocopherols and four tocotrienols from a variety of natural sources by semi-preparative high-performance liquid chromatography. J Chromatography A. 1994;678(1):49–58. | |
Akihisa T, Yasukawa K, Yamaura M, et al. Triterpene alcohol and sterol ferulates from rice bran and their anti-inflammatory effects. J Agric Food Chem. 2000;48(6):2313–2319. | |
Xu Z, Godber JS. Purification and identification of components of gamma-oryzanol in rice bran Oil. J Agric Food Chem. 1999;47(7):2724–2728. | |
Hu W, Wells JH, Shin T-S, Godber JS. Comparison of isopropanol and hexane for extraction of vitamin E and oryzanols from stabilized rice bran. J Am Oil Chemists’ Soc. 1996;73(12):1653–1656. | |
Consultative Group on International Agricultural Research Secretariat. Consultative Group on International Agricultural Research Annual Report 2007: Research Within Reach. Available from: http://library.cgiar.org/bitstream/handle/10947/5258/cgiar_AR07_wb_text.pdf?sequence=1. Accessed October 3, 2013. | |
Vági E, Simándi B, Daood HG, Deák A, Sawinsky J. Recovery of pigments from Origanum majorana L. by extraction with supercritical carbon dioxide. J Agric Food Chem. 2002;50(8):2297–2301. | |
Johnson LA, Lusas E. Comparison of alternative solvents for oils extraction. J Am Oil Chemists’ Soc. 1983;60(2):229–242. | |
Lakkakula NR, Lima M, Walker T. Rice bran stabilization and rice bran oil extraction using ohmic heating. Bioresour Technol. 2004;92(2):157–161. | |
Leibovitz Z, Ruckenstein C. Winterization of sunflower oil. J Am Oil Chemists’ Soc. 1984;61(5):870–872. | |
Ramaswamy KG, Gopalakrishna AG, Sen DP. Refining of rice bran oil. J Oil Technologists Assoc India. 1980;12(1):16–19. | |
Taylor RJ, McCormack AJ. Study of solvent and catalytic lube oil dewaxing by analysis of feedstocks and products. Ind Eng Chem Res. 1992;31(7):1731–1738. | |
Scharnagl H, März W. New lipid-lowering agents acting on LDL receptors. Curr Top Med Chem. 2005(3):233–242. | |
Arruzazabala ML, Noa M, Menéndez R, et al. Protective effect of policosanol on atherosclerotic lesions in rabbits with exogenous hypercholesterolemia. Braz J Med Biol Res. 2000;33(7):835–840. | |
Arruzazabala ML, Carbajal D, Mas R, Molina V, Valdes S, Laguna A. Cholesterol-lowering effects of policosanol in rabbits. Biol Res. 1993;27(3–4):205–208. | |
Kato S, Karino K, Hasegawa S, et al. Octacosanol affects lipid metabolism in rats fed on a high-fat diet. Br J Nutr. 1995;73(3):433–441. | |
Zardoya R, Tula L, Castaño G, et al. Effects of policosanol on hypercholesterolemic patients with abnormal serum biochemical indicators of hepatic function. Curr Ther Res. 1996;57(7):568–577. | |
Gouni-Berthold I, Berthold HK. Policosanol: clinical pharmacology and therapeutic significance of a new lipid-lowering agent. Am Heart J. 2002;143(2):356–365. | |
Reiner Z, Tedeschi-Reiner E, Romic´ Z. Effects of rice policosanol on serum lipoproteins, homocysteine, fibrinogen and C-reactive protein in hypercholesterolaemic patients. Clin Drug Investig. 2005;25(11):701–707. | |
Arruzazabala ML, Valdés S, Más R, Fernández L, Carbajal D. Effect of policosanol successive dose increases on platelet aggregation in healthy volunteers. Pharmacol Res. 1996;34(5–6):181–185. | |
Pope LE, Marcelletti JF, Katz LR, et al. The anti-herpes simplex virus activity of n-docosanol includes inhibition of the viral entry process. Antiviral Res. 1998;40(1–2):85–94. | |
Castaño G, Más R, Gámez R, Fernández L, Illnait J. Effects of policosanol and ticlopidine in patients with intermittent claudication: a double-blinded pilot comparative study. Angiology. 2004;55(4):361–371. | |
Backes JM, Gibson CA, Ruisinger JF, Moriarty PM. Modified-policosanol does not reduce plasma lipoproteins in hyperlipidemic patients when used alone or in combination with statin therapy. Lipids. 2011;46(10):923–929. | |
Berthold HK, Unverdorben S, Degenhardt R, Bulitta M, Gouni- Berthold I. Effect of policosanol on lipid levels among patients with hypercholesterolemia or combined hyperlipidemia: a randomized controlled trial. JAMA. 2006;295(19):2262–2269. | |
Cubeddu LX, Cubeddu RJ, Heimowitz T, Restrepo B, Lamas GA, Weinberg GB. Comparative lipid-lowering effects of policosanol and atorvastatin: a randomized, parallel, double-blind, placebo-controlled trial. Am Heart J. 2006;152(5):982. e1–e5. | |
Dulin MF, Hatcher LF, Sasser HC, Barringer TA. Policosanol is ineffective in the treatment of hypercholesterolemia: a randomized controlled trial. Am J Clin Nutr. 2006;84(6):1543–1548. | |
Greyling A, De Witt C, Oosthuizen W, Jerling JC. Effects of a policosanol supplement on serum lipid concentrations in hypercholesterolaemic and heterozygous familial hypercholesterolaemic subjects. Br J Nutr. 2006;95(5):968–975. | |
Swanson B, Keithley JK, Sha BE, et al. Policosanol for managing human immunodeficiency virus-related dyslipidemia in a medically underserved population: a randomized, controlled clinical trial. Altern Ther Health Med. 2011;17(2):30–35. | |
Swanson B, Keithley J. Policosanol to manage dyslipidemia in older adults. In: Watson R, editor. Complementary and Alternative Therapies and the Aging Population: An Evidence-Based Approach. Waltham, MA: Academic Press; 2011:117. | |
Kabir Y, Kimura S. Biodistribution and metabolism of orally administered octacosanol in rats. Ann Nutr Metab. 1993;37(1):33–38. | |
Raghavan PR, inventor. Policosanol nanoparticles. United States patent application EP20100744101. September 11, 2013. | |
Cooper E, Kline L, Liversidge G, Ryde NP inventors. Nanoparticulate polycosanol formulations and novel polycosanol combinations. World patent application WO2003103632 A1. December 18, 2003. | |
Guglielmini G. Nanostructured novel carrier for topical application. Clin Dermatol. 2008;26(4):341–346. | |
Solans C, Izquierdo P, Nolla J, Azemar N, Garcia-Celma MJ. Nano-emulsions. Curr Opin Colloid Interface Sci. 2005;10(3):102–110. | |
Mason TG, Wilking JN, Meleson K, Chang CB, Graves SM. Nanoemulsions: formation, structure, and physical properties. J Physics Condensed Matter. 2006;18(41):R635–R666. | |
Ismail M, Al-Naqeeb G, Mamat WA, Ahmad Z. Gamma-oryzanol rich fraction regulates the expression of antioxidant and oxidative stress related genes in stressed rat’s liver. Nutr Metab (Lond). 2010;7:23. | |
Cravotto G, Binello A, Merizzi G, Avogadro M. Improving solvent-free extraction of policosanol from rice bran by high-intensity ultrasound treatment. Eur J Lipid Sci Technol. 2004;106(3):147–151. | |
Dunford NT, Irmak S, Jonnala R. Pressurised solvent extraction of policosanol from wheat straw, germ and bran. Food Chemistry. 2010;119(3):1246–1249. | |
Al-Qubaisi MS, Rasedee A, Flaifel MH, et al. Cytotoxicity of nickel zinc ferrite nanoparticles on cancer cells of epithelial origin. Int J Nanomedicine. 2013:2497–2508. | |
Belavadi VK, Bhowmick DN. An investigation of rice bran oil tank settling. J Am Oil Chemists’ Soc. 1988;65(2):241–245. | |
Yoon SH, Rhee JS. Composition of waxes from crude rice bran oil. J Am Oil Chemists’ Soc. 1982;59(12):561–563. | |
Reddi PBV, Murti KS, Feuge RO. Rice brain oil. I. Oil obtained by solvent extraction. J Am Oil Chemists’ Soc. 1948;25(6):206–211. | |
Cousins ER, Fore SP, Janssen HJ, Feuge RO. Rice bran oil. VIII. Tank settlings from crude rice bran oil as a source of wax. J Am Oil Chemists’ Soc. 1953;30(1):9–14. | |
Saunders R. Rice bran: composition and potential food uses. Food Rev Intern. 1985;1(3):465–495. | |
Liu Y, Yu J, Wang X. Extraction of policosanols from hydrolysed rice bran wax by high-intensity ultrasound. Intern J Food Sci Technol. 2008;43(5):763–769. | |
Wang M-F, Lian H-Z, Mao L, et al. Comparison of various extraction methods for policosanol from rice bran wax and establishment of chromatographic fingerprint of policosanol. J Agric Food Chem. 2007;55(14):5552–5558. | |
Asikin Y, Takahashi M, Hirose N, Hou DX, Takara K, Wada K. Wax, policosanol, and long-chain aldehydes of different sugarcane (Saccharum officinarum L.) cultivars. Eur J Lipid Sci Technol. 2012;114(5):583–591. | |
Tagne JB, Kakumanu S, Nicolosi RJ. Nanoemulsion preparations of the anticancer drug dacarbazine significantly increase its efficacy in a xenograft mouse melanoma model. Mol Pharm. 2008;5(6):1055–1063. | |
Kong M, Park HJ. Stability investigation of hyaluronic acid based nanoemulsion and its potential as transdermal carrier. Carbohyd Polym. 2011;83(3):1303–1310. | |
Lovelyn C, Attama AA. Current state of nanoemulsions in drug delivery. J Biomater Nanobiotechnol. 2011;2(5A):626–639. | |
Ren W, Tian G, Jian S, et al. TWEEN coated NaYF4:Yb, Er/NaYF4 core/shell upconversion nanoparticles for bioimaging and drug delivery. RSC Adv. 2012;2(18):7037–7041. | |
Lin-Vien D, Colthup NB, Fateley WG, Grasselli JG. The Handbook of Infrared and Raman Characteristic Frequencies of Organic Molecules. San Diego, CA: Academic Press; 1991. | |
Coates J. Interpretation of infrared spectra, a practical approach. Encyclopedia Analyt Chem. Epub September 15, 2006. | |
Carolei L, Gutz IG. Simultaneous determination of three surfactants and water in shampoo and liquid soap by ATR-FTIR. Talanta. 2005;66(1):118–124. | |
Lindner J, Cringus D, Pshenichnikov MS, Vöhringer P. Anharmonic bend–stretch coupling in neat liquid water. Chem Phys. 2007;341(1):326–335. | |
Smith BC. Infrared Spectral Interpretation: A Systematic Approach. Boca Raton, FL: CRC Press; 1998. | |
Socrates G. Infrared and Raman Characteristic Group Frequencies: Tables and Charts. Chichester: Wiley; 2001. |
 © 2014 The Author(s). This work is published and licensed by Dove Medical Press Limited. The full terms of this license are available at https://www.dovepress.com/terms.php and incorporate the Creative Commons Attribution - Non Commercial (unported, v3.0) License.
By accessing the work you hereby accept the Terms. Non-commercial uses of the work are permitted without any further permission from Dove Medical Press Limited, provided the work is properly attributed. For permission for commercial use of this work, please see paragraphs 4.2 and 5 of our Terms.
© 2014 The Author(s). This work is published and licensed by Dove Medical Press Limited. The full terms of this license are available at https://www.dovepress.com/terms.php and incorporate the Creative Commons Attribution - Non Commercial (unported, v3.0) License.
By accessing the work you hereby accept the Terms. Non-commercial uses of the work are permitted without any further permission from Dove Medical Press Limited, provided the work is properly attributed. For permission for commercial use of this work, please see paragraphs 4.2 and 5 of our Terms.