")
Back to Journals » Stem Cells and Cloning: Advances and Applications » Volume 9
Characterization of neural stemness status through the neurogenesis process for bone marrow mesenchymal stem cells
Authors Mohammad M, Al-Shammari A , Al-Juboory A, Yaseen N
Received 16 August 2015
Accepted for publication 13 November 2015
Published 18 April 2016 Volume 2016:9 Pages 1—15
DOI https://doi.org/10.2147/SCCAA.S94545
Checked for plagiarism Yes
Review by Single anonymous peer review
Peer reviewer comments 2
Editor who approved publication: Dr Bernard Binetruy
Video abstract presented Ahmed M Al-Shammari.
Views: 345
Maeda H Mohammad,1 Ahmed M Al-Shammari,1 Ahmad Adnan Al-Juboory,2 Nahi Y Yaseen1
1Experimental Therapy Department, Iraqi Center of Cancer and Medical Genetic Research, Al-Mustansiriyah University, 2Department of Surgery, Neuroscience Hospital, Baghdad, Iraq
Abstract: The in vitro isolation, identification, differentiation, and neurogenesis characterization of the sources of mesenchymal stem cells (MSCs) were investigated to produce two types of cells in culture: neural cells and neural stem cells (NSCs). These types of stem cells were used as successful sources for the further treatment of central nervous system defects and injuries. The mouse bone marrow MSCs were used as the source of the stem cells in this study. β-Mercaptoethanol (BME) was used as the main inducer of the neurogenesis pathway to induce neural cells and to identify NSCs. Three types of neural markers were used: nestin as the immaturation stage marker, neurofilament light chain as the early neural marker, and microtubule-associated protein 2 as the maturation marker through different time intervals in the neurogenesis process starting from the MSCs, (as undifferentiated cells), NSCs, production stages, and toward neuron cells (as differentiated cells). The results of different exposure times to BME of the neural markers analysis done by immunocytochemistry and real time-polymerase chain reaction helped us to identify the exact timing for the neural stemness state. The results showed that the best exposure time that may be used for the production of NSCs was 6 hours. The best maintenance media for NSCs were also identified. Furthermore, we optimized exposure to BME with different times and concentrations, which could be an interesting way to modulate specific neuronal differentiation and obtain autologous neuronal phenotypes. This study was able to characterize NSCs in culture under differentiation for neurogenesis in the pathway of the neural differentiation process by studying the expressed neural genes and the ability to maintain these NSCs in culture for further differentiation in thousands of functional neurons for the treatment of brain and spinal cord injuries and defects.
Keywords: mesenchymal stem cells, neural stem cells, NES, NF-L, MAP-2
Introduction
Mesenchymal stem cells (MSCs) are a heterogeneous population of cells, which have initially been defined by their potential to differentiate diverse somatic lineages. MSCs were described as adherent cells with a fibroblast-like appearance, which were capable of differentiating different types of cells.1–3 MSCs have unique characteristics, making them attractive modalities in treating different types of human neural diseases with their ability to differentiate many neural cell types.4
Neural stem cells (NSCs) in general are the multipotent self-renewal cells that proliferate without limit to produce progeny cells that terminally differentiate into neurons, astrocytes, and oligodendrocytes. Neural progenitor cells are undifferentiated cells that are (not in themselves stem cells) with limited proliferative ability and do not exhibit self-renewal.5
Several markers of NSCs were used for identification during the generation of neural rosettes in neurosphere culture. These markers included nestin (NES), which was among the intermediate filaments protein (IMFs).6–8 It was detected in different stages of central nervous system (CNS) development.9,10 NSCs also expressed neurofilament light (NF-L), neurofilament medium (NF-M), and neurofilament heavy (NF-H) chains as other IMF markers that can be expressed during neural development and differentiation.11 They also expressed each of the GFAP and microtubule-associated protein 2 (MAP-2) as maturing neural markers in postneural induction.8
NSCs have been isolated either from nearly all areas of the embryonic brain and along the ventricular neuraxis in the adult nervous system or from embryonic stem cells, culture. They induce the NSCs from the neurosphere cells formation.6 The most frequently used method to isolate, propagate, and study the embryonic and adult neural stem and progenitor cells is the neurospheres assay.12–14 However, some answers remain unknown, and the precise phenotype and location of the NSCs remain controversial. Clearly, new culture conditions are needed or new assays should be designed to preclude the motility of spheres, to resolve the clonal question, and to distinguish between stem and progenitor cells derived from either the embryonic or adult CNS.15 The CNS cells have one of the most difficult tissue regenerations incapable of mitotic divisions to generate new brain cells. They lack the ability to repair damaged tissue for many diseases (eg, neurodegenerative disease, Parkinson’s disease, and multiple sclerosis) or injuries (eg, spinal cord and brain ischemic injury).5
This study was carried out to produce NSCs through the isolation and identification of NSCs from the neurogenesis of adult stem cells’ source. The results of this study can be used as an alternative source of NSCs (from CNS cells, or embryonic stem cells, source) for using it as an easily source from bone marrow MSCs.
Materials and methods
This study was carried out in the Iraqi Center of Cancer and Medical Genetic Research (ICCMGR) during 2012–2014.
Isolation of MSCs from mouse bone marrow
The bone marrow culture was prepared by killing the donor male mice (Swiss Albino Mice) by cervical dislocation (3–6 weeks old) as described by Freshney.16 The mice were provided by the ICCMGR Animal House Unit (all work related to the study were approved by the ICCMGR Animal Care and Use Committee), and three mice were used for each tissue culture flask. Under sterilized conditions, the fur was washed with 70% alcohol, and femurs and tibias were removed and collected in a petri dish containing the transport media minimum essential medium (MEM) (United States Biological, Salem, MA, USA). The media were supplemented with fivefold antibiotics streptomycin (Capricorn Scientific GmbH, Ebsdorfergrund, Germany) and ampicillin (Capricorn Scientific GmbH, Ebsdorfergrund, Germany) as 500 mg/mL. In the laboratory and under sterilized conditions, the femurs and tibias were cleaned off from the remaining muscle tissues with sterile surgical tools and washed few times with normal saline solution (phosphate-buffered saline [PBS] prepared in the laboratory). The femurs were held off with forceps, and the knee ends were cut off. The 27G needle, which contained MEM media supplemented with 20% fetal bovine serum (FBS; Celgro, USA) and 100 mg/mL for each ampicillin and streptomycin as culturing media, should fit into the bone cavity. The end of the femur was cut off as close as possible to the end. The tip of the bone was inserted into a test tube (15 mL), and the bone marrow was flushed out of the femur and tibias. The marrow was dispersed to a suspension by pipetting the large marrow cores. Finally, the 10 mL aliquots of the cell suspension were dispensed into 25 cm2 tissue culture flasks and counting, and the cultures were maintained at 37°C in humidified 95% air and 5% CO2 incubator.
Culturing and propagation of MSCs
According to Freshney,16 8.33×10⁶ cells were allowed to adhere overnight (24 hours), and nonadherent cells were washed out with medium changes in MEM media with 20% FBS. The remaining nonadherent cells were removed by exchanging the culture medium within 2–3 days until the cultures get hold of the developing colonies of adherent cells (~5–7 days) to form monolayer cells. Cells were subcultured after being monolayered using 0.25% trypsin-ethylenediaminetetraacetic acid (EDTA) (United States Biological). The passage one (P1) cells began to proliferate and form a monolayer of cells in 3–5 days (with 2.50×10⁶).
Immunophenotypic analysis of MSCs
The MSCs were recultured (P1) in an eight-well tissue culture chamber slide (IWKA, Okinawa, Japan) in MEM media supplemented with 20% FBS. The cells were allowed to develop a monolayer of adherent cells within 3–5 days. Then, the medium was aspirated, and the multiwell plates were washed two times with PBS, fixed with 4% paraformaldehyde (diluted in PBS) for 10 minutes, washed with PBS, and left to dry. These slides were used in triplicate. Four specific stem cell markers were used: CD90, CD105, CD44, and CD34 (United States Biological).
After fixation, slides were incubated in a humidified chamber with 1% hydrogen peroxide (H2O2) for 10 minutes, washed two to three times with PBS, and incubated with 1.5% blocking serum for 30–40 minutes at room temperature. Then, the primary antibody of the CD markers was incubated overnight at 4ºC in a humidified chamber. Afterward, it was stained by ImmunoCruz™ mouse ABC Staining System (Santa Cruz Biotechnology Inc., Dallas, TX, USA). The biotinylated secondary antibody was incubated for 30 minutes and then washed. Avidin horse radish peroxidase was then added and incubated for another 30 minutes and then washed. Liquid DAB chromogen solution formula was added for each slide for 20 minutes at room temperature, washed extensively with PBS, and counterstained with hematoxylin stain for 30–60 seconds. The slides were mounted with DPX, inspected using light microscope, and photographed using a digital camera.
Neural differentiation induction of MSCs
Subconfluent cultures of P1 MSCs (2.50×10⁶) were used to induce neurogenesis. This was done by using β-mercaptoethanol (BME; Santa Cruz Biotechnology Inc.) as a differentiation factor. The induction process followed these steps: first, the cells were exposed to MEM media supplemented with 20% FBS and 1 mM BME as preinduction media for 24 hours. Second, the cells were exposed to neural differentiation induction (as postinduction media) by using MEM media without FBS (serum-free media), and 5 mM BME for 10 hours, for a total of 34 hours exposure time as modified by Lei et al.17
Detection of neural proteins expression through the neurogenesis process
The cells were fixed at different periods (after 24, 25, 27, and 29 hours) for the immunocytochemistry assay for each NES, NF-L, and MAP-2 markers. This helped to detect neural stemness state from the protein level. The cells were fixed and stained using the Immuno-Cruz mouse ABC Staining System (Santa Cruz Biotechnology Inc.) at all times. Staining was done using specific antibodies with NES as a neural stemness marker, NF-L as an early neural cells marker, and MAP-2 as a mature neural marker. The immunocytochemistry assay was carried out according to the manufacturer’s instructions.
Detection of neural genes expression through the neurogenesis process
The neural genes were induced through the neural differentiation process. We conducted an mRNA gene expression study during the neural differentiation for NES, NF-L, and MAP-2. The cells were collected through the induction process for specified periods (1, 6, 12, 18, 24, 25, 27, 29, and 34 hours) to identify the neural stemness state through the neurogenesis process. These samples were sent for RNA extraction and mRNA expression levels through real time-polymerase chain reaction (RT-PCR) assay.
Proof of neural stemness
After stemness state identification that allowed for neural stem cells production, we need to prove the ability of the induced NSCs to self-renew to prove stemness state. To achieve this, we further cultured the hypothesized NSCs from the specified periods and passaged them in two subsequent passages. We observed their morphology and ability to grow and replicate. Likewise, we observed the expression of the stemness state genes. To do this, cells were washed with PBS and were cultured with different media formulas to maintain the NSCs in culture (as adherent cells). There were four different formulas: 1) MEM media with 5% FBS alone, 2) MEM supplemented with 50 ng/mL epidermal growth factors (EGFs; United States Biological, MA, USA; E3374-11), 3) MEM supplemented with 50 ng/mL basic fibroblast growth factors (b-FGFs) (United States Biological; F4210-20M1), and 4) MEM with 50 ng/mL for each b-FGF and EGF. After maintaining the induced NSCs for the two passages, the cells were prepared to measure the mRNA expression levels using RT-PCR for both the 6 and 24 hours to check for stemness stability.
RNA isolation
Total RNAs were collected using the Absolutely RNA Miniprep Kit (Agilent Co., Germany; 400800) of each cells before (MSCs) and after differentiation (for neural cells and NSCs) from different exposure times as follows: 1, 6, 12, 18, 24, 25, 27, 29, and 34 hours, and the NSCs for each four culturing formula (5% FBS, b-FGF, EGF, b-FGF + EGF). The cells were collected by trypsinization of the adherent cells as described in the manufacturer’s protocol. The quality and quantity of total extracted RNA samples were then examined using minidrop spectrophotometer measurements. Then, the extracted RNAs were stored at −80°C in deep freezer (Nüve, Ankara, Turkey) until used.
Real time-polymerase chain reaction
The isolated RNAs were reversed transcribed to produce double-stranded cDNA using reverse transcriptase polymerase enzyme by KAPA SYBR FAST One-Step qRT-PCR Kit universal kit (Kapa Biosystems, Cape Town, South Africa) to quantify the expression of three specific genes, namely, NES (forward: 5′-GCACT GGGAAGAGTAGAAGATG-3′, length 22 and the reverse:5′-GGAGTAG AGTCAGGGAGAGTTT-3′, length 22) with fragment size 131bp, NF-L (forward:5′-TGATGTCTGCTCGCTCTTTC-3′, length 20 and the reverse: 5′-CTCAGCTTTCGTAGCCTCAAT-3′, length 21) with fragment size 95 bp, and MAP-2 (forward: 5′-CACAGGGCACCTATTCAGATAC-3′, length 22 and the reverse: 5′-CAGATACCTCCTCTGCTG TTTC-3′, length 22) with fragment size 87 bp, normalized with GAPDH (forward: 5′-GGAGAGT GTTTCCTCGTCCC-3′, length 20 and the reverse: 5′-TTTGCCGTGAGTGGAGTCAT-3′, length 20) with fragment size 188 bp as reference gene. These primers were optimized for use with the SYBR green and for normalization with the housekeeping gene GAPDH with 50 ng/μL concentration. The RT-PCR was done according to the manufacturer’s protocol with annealing temperature at 62°C and 40°C cycle. All primers were designed in-house with the National Center for Biotechnology Information (NCBI) Designer software (http://www.ncbi.nlm.nihgov/) and synthesized by Bio-Synthesis (Lewisville, TX, USA) for all three primers. Once suitable reference genes (GAPDH) were identified, the mean CT values of the three candidate genes were calculated for each individual sample (as duplicate replication for each sample) and used to normalize expression levels using the ΔΔCT method described previously.18–20
Statistical analysis
All data of each immunocytochemistry (ICC) assays (as average percentage means) and RT-PCR data (as average means after finding the ΔΔCT values) were statistically analyzed using one-way analysis of variance and least significant difference test in IBM SPSS Statistics Software (version 20). The difference of means with standard errors was considered significant at P<0.05.
Results
Culturing and propagation of MSCs
The MSCs from the mouse bone marrow were cultured in tissue culture flasks for 24 hours. Only few cells attached and formed adherent cells. The nonadherent cells were discarded by the first medium change, usually after 24 or 48 hours (Figure 1A and B).
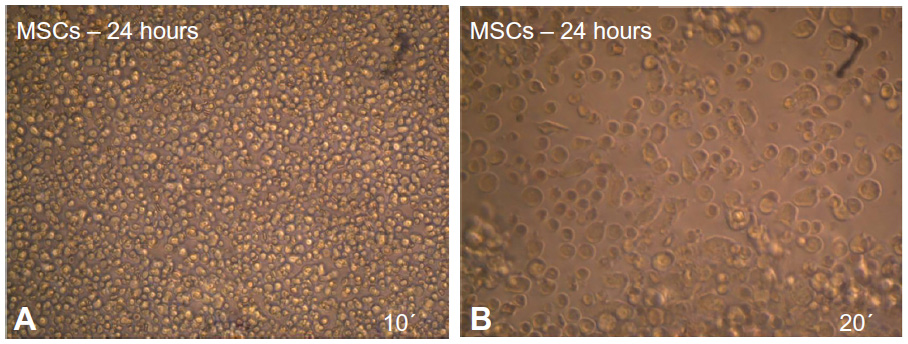 | Figure 1 Morphology characteristics of mouse MSCs cultured in MEM +20% FBS after 24 hours as revealed under inverted microscope. |
The adherent cells began to proliferate 2−3 days after the cultivation of numerous fibroblast-like cells could be observed. The cells gradually grew to form small individual colonies displaying fibroblast-like morphology with short and long processes (Figure 2A and B). MSCs were characterized by their ability to form colonies comprising spindle-shaped cells derived from a single cell. The number of cellular colonies with different sizes has obviously increased.
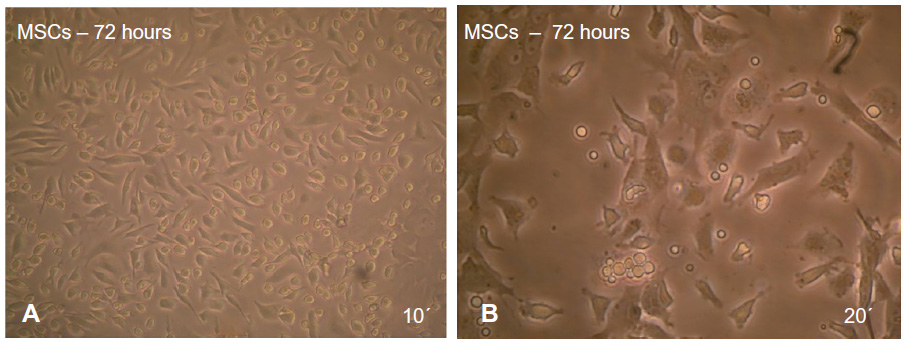 | Figure 2 After 72 hours of culturing mouse MSCs in MEM +20% FBS, note that some of the cells became adherent and began to elongate as revealed under inverted microscope. |
In large colonies, cells were more densely distributed, and they showed a spindle-like shape. Cell growth continued and colonies gradually expanded in size to connect with adjacent colonies. Cells grew to 80% confluency after 5−6 days and became ready to be passaged (Figure 3A and B). In passage one, the MSCs began to grow and a homogeneous layer of fibroblastoid-like cells occupied the whole plastic surface (Figure 3C and D). The cells were reseeded in the same conditions for the second passage culture. These adherent cells could be seeded and cultured every 5−7 days without visible morphologic alteration.
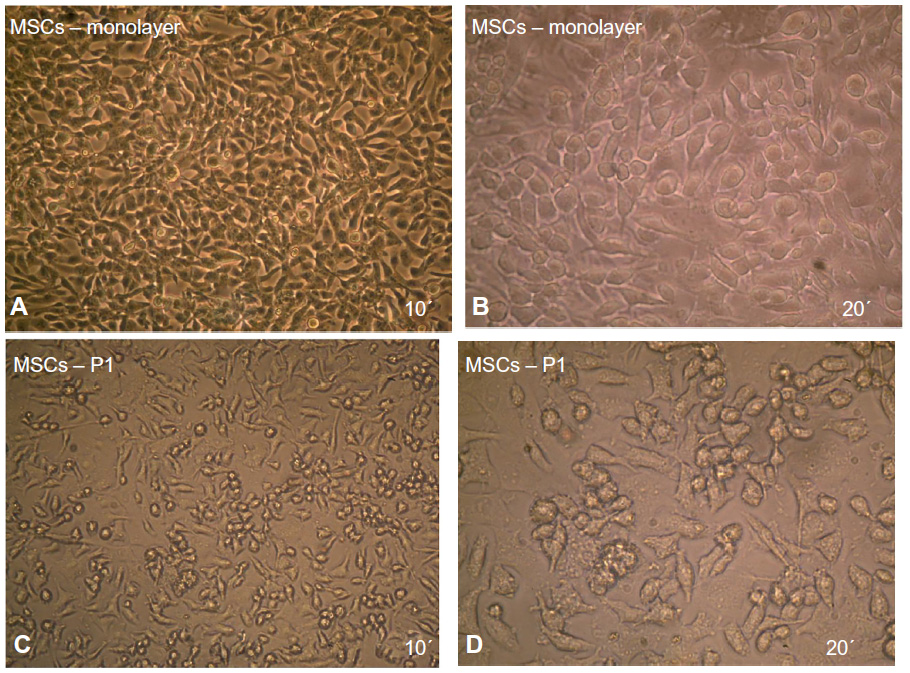 | Figure 3 Maintenance of MSCs in culture. |
Immunophenotypic characterization of MSCs
To verify the nature of the fibroblast-like cells, the MSCs were seeded in an eight-well tissue culture chamber slide. After the cells expanded and formed a homogeneous layer, the cells were fixed and tested against MSCs-related surface antigens: CD105, CD90, CD44, and CD34.
The immunophenotypic characterization of the cultured MSCs’ expanded adherent cells revealed that the cells were stained negative for CD34 (Figure 4A and B), indicating that these cells are not from hematopoietic origin. However, they were positive for each of the CD44, CD90, and CD105 (Figure 5A–F). This indicates that the cells retain the phenotype of MSCs.
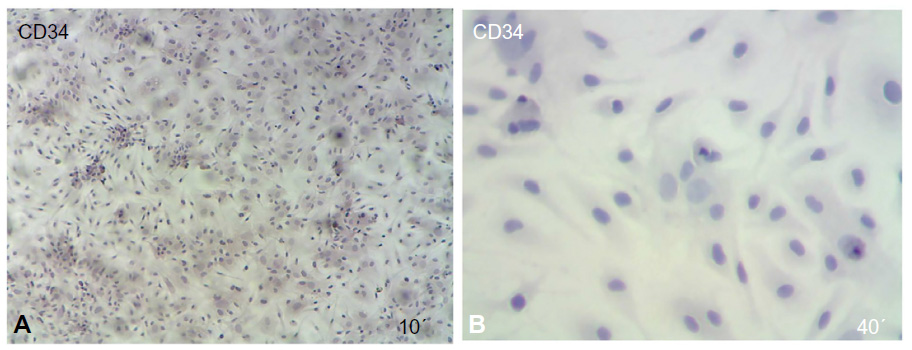 | Figure 4 Immunophenotypic analysis of MSCs at the first passage revealed under light microscope show that the MSCs were negative by cell stained with blue color. |
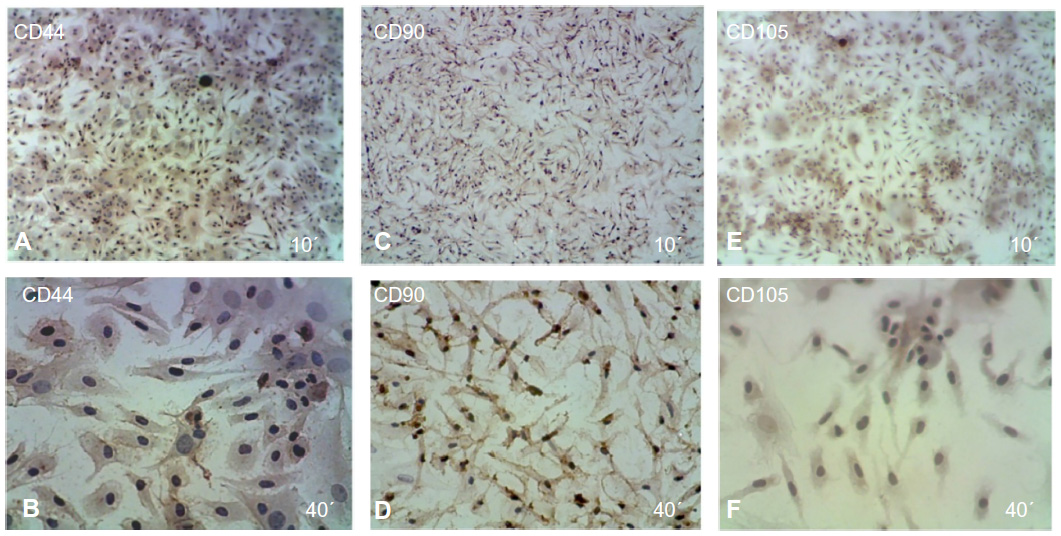 | Figure 5 Immunophenotypic analysis of MSCs at the first passage revealed under light microscope show that the MSCs were positive cells stained with brown color. |
Neural differentiation induction of MSCs
The first passage of MSCs was used to induce neural cells. The results showed that MSCs, morphology in the preinduction media (after 24 hours exposure) was spherical or polygonal (Figure 6A). At the postinduction media (25, 27, 29, and 34 hours), the MSCs started to be more spherical and more polygonal, and they increased in size. Finally, they formed cell branches similar to the neural cells (Figure 6B–E).
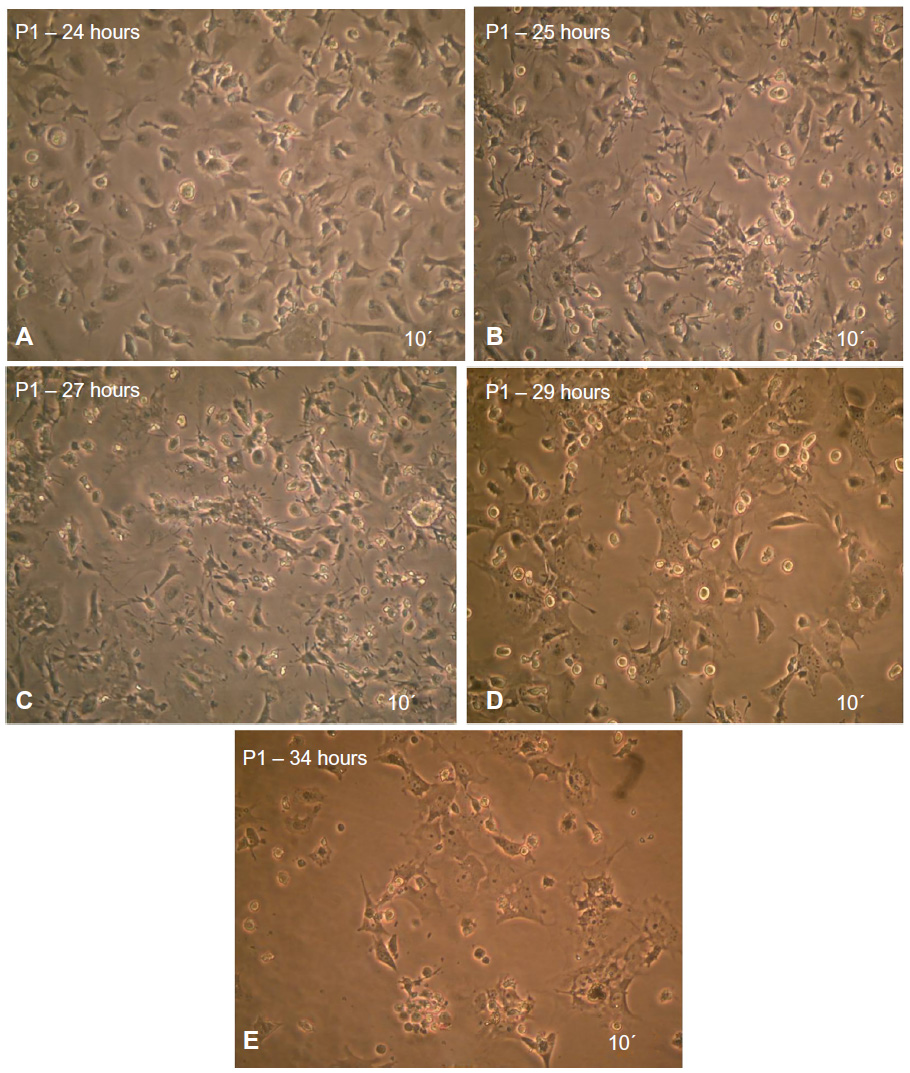 | Figure 6 MSCs after induced differentiation by BME, which showed the spherical shape of cells and their branched form toward the neural cells as revealed under inverted microscope. |
Detection of neural protein expression through the neurogenesis process
The ICC results showed increased protein expression levels for each NES and NF-L protein started from 24 hours (61% for NES and 32.2% for NF-L) and increased through the 25, 27, and 29 hours exposures (Figure 7A–E for each marker), with significant difference level at P<0.05. With the higher protein expressions in the 27 hours (86.3% and 80.8% for each NES and NF-L, respectively), exposure was compared with undifferentiating MSCs (as negative control), with 10.5% for NES and 15.1% for NF-L. The MAP-2 proteins showed no protein expression with the preinduction media (24 hours) and less protein expression levels in the postinduction media (25, 27, and 29 hours), the increase of which started from 27 and 29 hours, with 12% and 29.7% of protein level percentages, respectively, and with a significant difference at level P< 0.05 compared with undifferentiating MSCs (as negative control) with 0.5% (as shown in Figure 8).
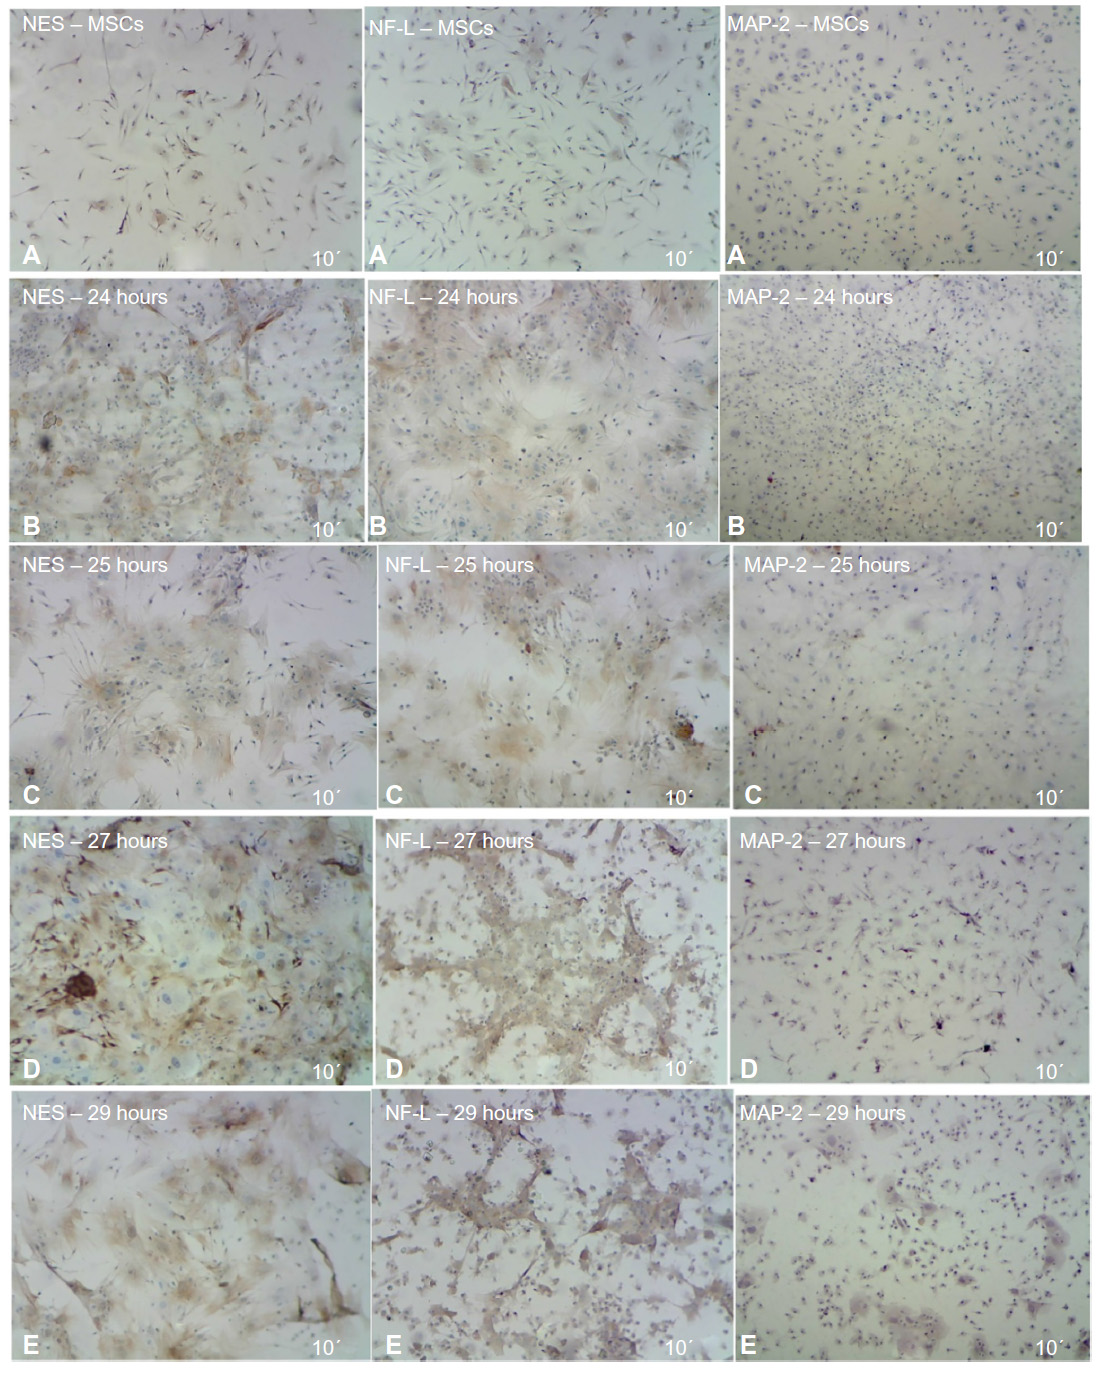 | Figure 7 ICC detection results of MSCs after induced differentiation by BME, which showed the increase of NES and NF-L protein through the different exposure times, compared with no increase of MAP-2 protein as revealed under light microscope. |
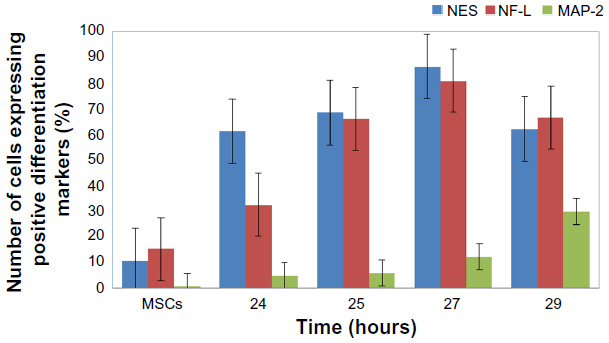 | Figure 8 The protein expression levels of ICC assay for NES, NF-L, and MAP-2 antibodies of neural cells after being induced by BME. |
These results indicated the activity of BME in the neurogenesis stages of MSCs toward the neural differentiation of cells after the 27 and 29 hours exposure times, which recorded increases in the NF-L and MAP-2 (as an early and mature neural markers, respectively). Results also indicated that these cells could continue to differentiate toward the neural cells. In addition, these results indicated that the cells before the 24 hours exposure time may be passing to the NSCs, formation stage through the increase of the NES protein levels combined with the decrease of each NF-L and MAP-2 levels, indicating the immaturation stage of neural differentiation. These data proved the possibility of finding the NSCs formation stage at before the 24 hours exposure time (hypnotized for 1, 6, 12, and, 18 hours exposure).
Detection of neural genes expression through the neurogenesis process
Gene expression was studied during the exposure time of neural differentiation – 1, 6, 12, 18, 24, 25, 27, 29, and 34 hours − by conventional and RT-PCR. The results of RT-PCR revealed that the expression of the NES gene (as NSCs and immature differentiation gene) was increased and overexpressed within the 1, 6, 12, and 18 hours exposure times, reaching up to 24 hours exposure, the highest expression level with a significant difference level at P<0.05. After that, NES expression was declined at the 25, 27, 29, and 34 hours periods, as compared with undifferentiated MSCs, which were recorded to have low expression levels.
The NF-L gene (as an early neural differentiation gene) showed low expression at 1 and 6 hours exposure times. At 6 hours, the expression of this gene started to increase. It continued to increase through the 12, 18, and 24 hours exposure times, reaching up to 27 hours as the highest expression level, with significant difference level at P<0.05. Expression was decreased at 27, 29, and 34 hours exposure time, as compared with control cells undifferentiating MSCs that had low expression levels.
On the contrary, the MAP-2 gene (as postmaturation gene) showed lower expression levels in all times tested, except at the 24 hours exposure time, as compared with very low expression in the control (MSCs), with statistically significant difference level at P<0.05 (as shown in Figure 9).
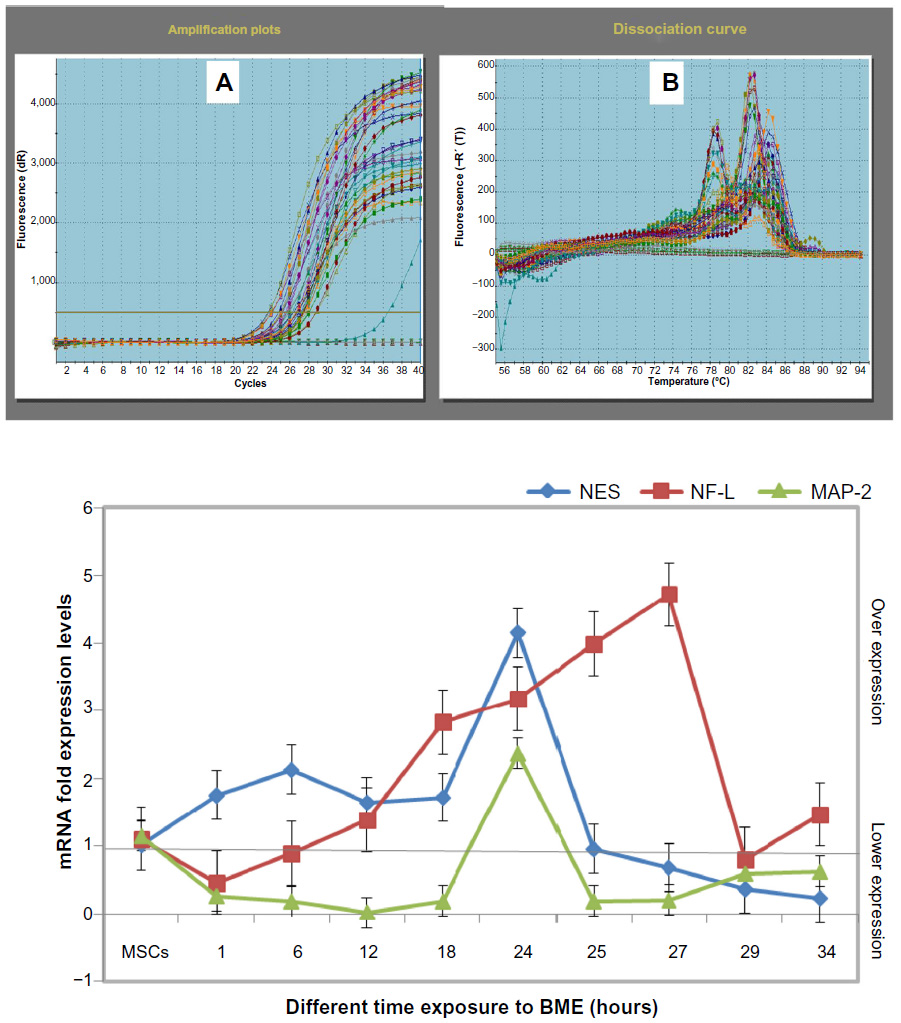 | Figure 9 mRNA expression levels of the real time-PCR analysis of NES, NF-L, and MAP-2 genes in MSCs treated with BME. |
To summarize all the results, the expression of the NES gene (as NSCs marker) increased through the differentiation process with a low expression of the NF-L gene (as an early neural marker). At the same time, there was low expression of the MAP-2 gene (as mature neural marker) in each of the 1, 6, 12, and 24 hours exposure times. However, the significant higher expression of NES was at 6 and 24 hours. From that, we can identify the stemness state in one of these times of exposure through the in vitro neurogenesis process.
Proof of neural stemness
Stemness state was identified to be at either the 6 or 24 hours of exposure to the differentiation media based on the previous gene expression study. To prove the ability of the induced NSCs to self-renew, we further cultured the NSCs from the 6 and 24 hours periods in four different media and passaged them in two subsequent passages. We observed their morphology and ability to grow and replicate, along with the expression of the stemness state genes.
The results showed that the differentiated cells after 6 hours of exposure time have no morphological changes and that they have a similarity to the MSCs, morphological features. At the 24 hours exposure time, there were a few changes in neural morphology (Figure 10).
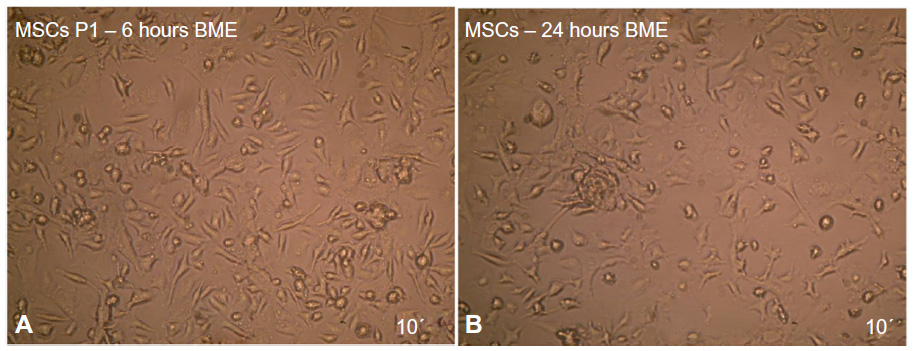 | Figure 10 Neural stem cells induction by (A) 6 and (B) 24 hours exposure to BME as revealed under inverted microscope. |
In addition, the results showed that these produced cells (NSCs), after 6 and 24 hours exposure to BME, have the ability to proliferate efficiently in culture after being transported into different culturing media formulas, but with different cell morphological characteristics as follows:
- Formula 1 (5% FBS): At 6 hours of exposure, NSCs showed homogeneity of cell population in culture with no changes in cell morphology similar to MSCs. This compared with a few percentage of morphological changes that started at 24 hours exposure time and continued reaching to the P1 and P2 of the NSCs, culture (Figure 11A–C).
- Formula 2 (5% FBS with 50 ng/μL EGF): The results showed that in each 6 and 24 hours exposure times, there were increases in the proliferation rate. Furthermore, there were few changes in the morphological characteristics, such as in cell rounding and the formation of small and long branches in some of the cells. These cells increased in number at the 24 hours exposure time compared with the 6 hours exposure time. These cellular changes started at the 24 hours exposure time in media formula 2, reaching to P2 with a high proliferation rate (Figure 11A–C).
- Formula 3 (5% FBS with 50 ng/μL FGF): The results showed that there were increases in the proliferation rate of cultured cells in both the 6 and 24 hours exposure times. In addition, there were morphological changes, characterized by cell elongation (NSCs) toward mature neuron cells for the 6 hours exposure time and increased the proliferation rate at 24 hours exposure time for each 24 hours, P1, and P2 of cultured NSCs (Figure 11A–C).
- Formula 4 (5% FBS, 50 ng/μL EGF, and 50 ng/μL FGF): The results showed the highest percentage of the cellular proliferation of the NSCs cultured for both the 6 and 24 hours exposure times, as compared with the other three media formulas used. There were limited changes of cell morphology toward the elongation or branching of cells in the culture, as compared with media formula 2 and media formula 3 for each 24 hours, P1, and P2 of the NSCs (Figure 11A–C).
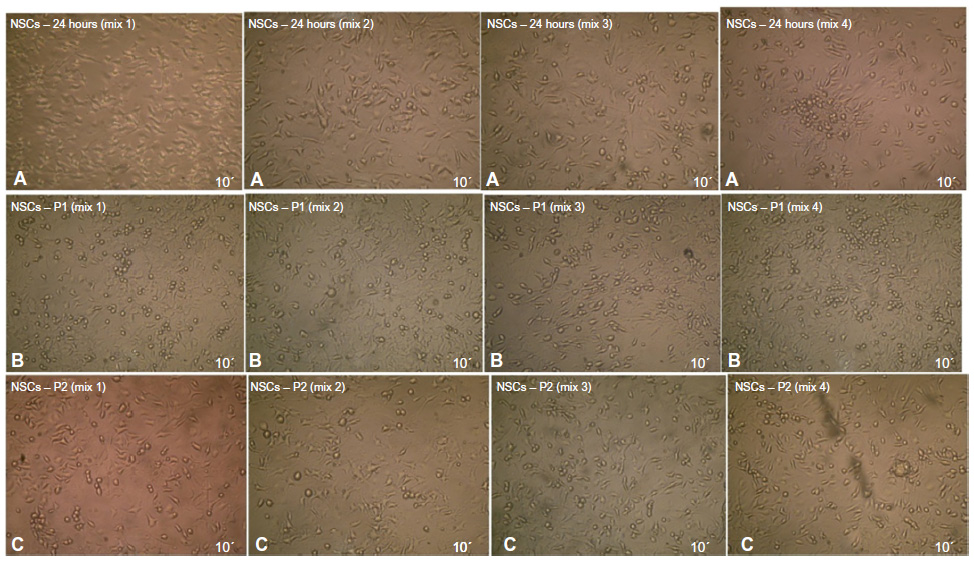 | Figure 11 Neural stem cells induction after 24 hours exposure to BME using four different culturing media formula. |
In general, the results of the microscopic examination indicated that the produced cells in all four media formulas have the ability to proliferate and produce continuous NSCs in culture. Results also indicated that the produced cells have the ability to pass two successful passages in culture, indicating that these cells still have the ability to self-renew and therefore proved the neural stemness in culture.
Gene expression was studied for the 6 and 24 hours exposure times for all four maintenance media formulas and for GAPDH, NES, NF-L, and MAP-2 genes to choose the best maintenance formula for NSCs. The media should keep the NES gene in a steady expression without reaching full neural differentiation. Testing was done using RT-PCR. At 6 hours exposure time, the results of RT-PCR showed that formula 3 (5% FBS with 50 ng/μL FGF) and formula 4 (5% FBS with 50 ng/μL EGF and FGF) were the best maintenance media of the NSCs, as they maintained the same stemness gene levels through all passages, increasing the expression levels of the NES gene with no expression changes in each NF-L and MAP-2 genes (Figure 12). At 24 hours exposure time, the results of RT-PCR showed that the cells matured through the increase of the expression of both the NF-L and MAP-2 genes. From all the aforementioned results, the study of the expression levels for both the 6 and 24 hours exposure times and for all the four maintenance media formulas showed that the best exposure time that may be used in the production of NSCs was 6 hours and that the best maintenance medium formulas were MEM media with 5% FBS, with FGF, and with EGF and FGF for 6 hours exposure time.
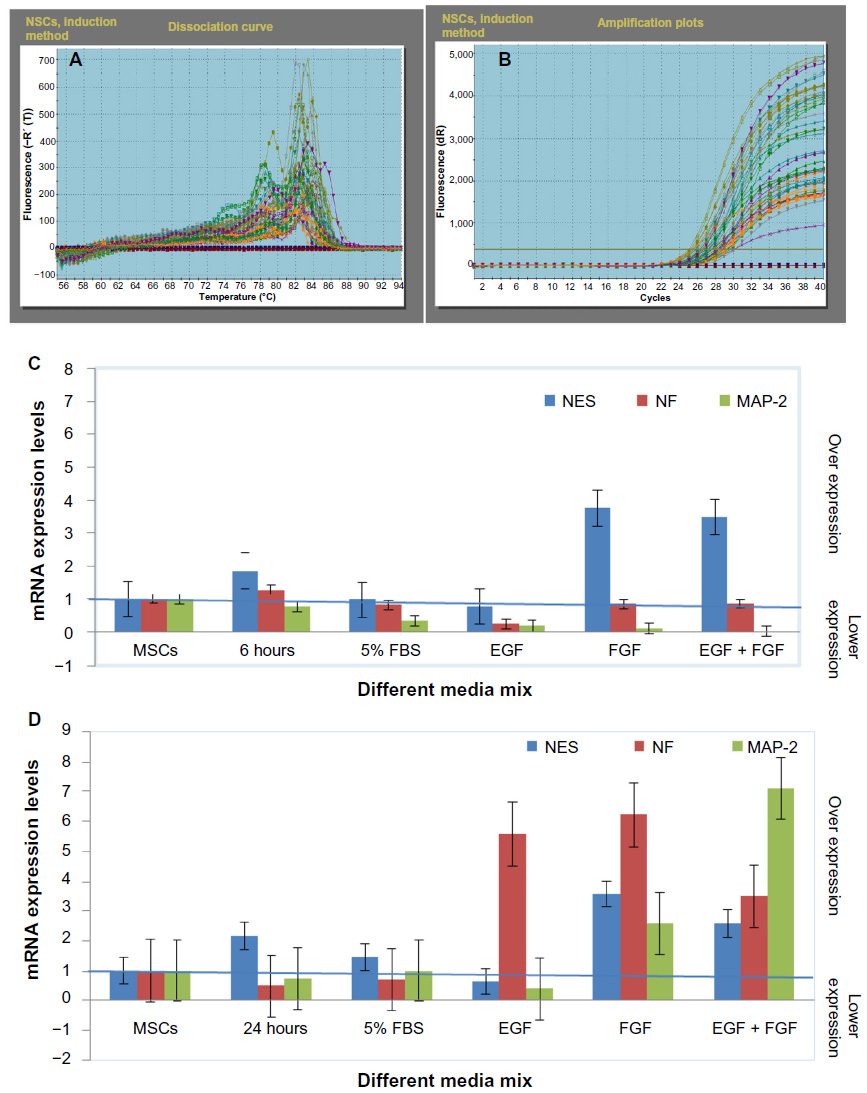 | Figure 12 RT-PCR analysis of NES, NF-L, and MAP-2 genes in NSCs using BME, which indicated the stability of the NES gene in all the different culturing media formulas and the instability of each NF-L and MAP-2 genes compared with the 24 hours exposure (the production stage of NSCs). |
According to the RT-PCR results, we were able to divide the neurogenesis process during differentiation into three stages as shown in Figure 13. In the first stage (immaturation or stemness stage), the NES gene expression was high with low expressions of both the NF-L and MAP-2 at the first 6 hours of differentiation. The stage was occurred between the MSCs, 12 hours; therefore, the NSCs can be produced from this exposure time (NSCs, production stage). The second stage is the commitment stage, where all the three genes peaked with no significant differences between their expressions. They reached the highest expression levels at 24 hours of exposure. This stage occurred between 12 and 25 hours of exposure times during differentiation because NES gene expression dropped at 25 hours. The third stage is the maturation stage, where the neural stemness gene (NES) was at the lowest expression levels. There was an increase in the expression of NF-L, which indicated that these cells committed to the maturation stage and were no longer considered NSCs. MAP-2 expression started to increase at the end of this stage.
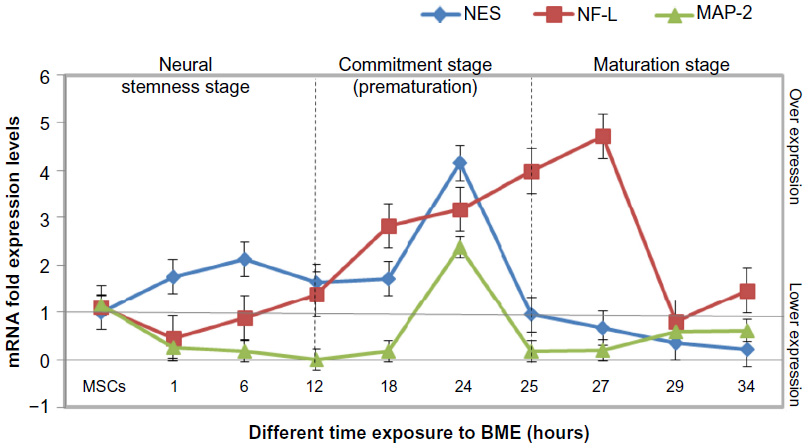 | Figure 13 Showing the neurogenesis pathway that MSCs induced toward neurons, where we can indicate the neural stemness state by following gene expression of the neurogenesis markers (NES, NF-L, and MAP-2) after prove of stemness at 6 hours of exposure to BME. |
Discussion
There were changes in the expression levels brought about by the up- and downregulation occurring during the differentiation process of the stem cells.21 The molecular studies can be used to study the production of the various types of cells investigated in this study. BME, which was used as a preinduction or induction reagent in many protocols,22–24 was used and investigated as a successful formula for the production of continuous NSCs in culture in this study. Also, the results of this study were matched with Mareschi et al who used BME as an inducer and showed that there were protein and gene expression in NES, NF, MAP-2, and many other neural markers during differentiation process,25 and matched with Khang et al who indicated that the NF gene expression was increased after induced differentiation by BME.26 Therefore, all these data indicated that this study was successful to choose the neural inducer (BME) and the three specific genes to understand the neurogenesis process of MSCs toward neural cells, and finally, these results could be eventually helpful in the preclinical studies and prospectively for the application to the neurodegenerative diseases.
Commonly used markers for NSCs include NES, which is described as a gene whose expression distinguishes the stem cells from the more differentiated cells, such as specific NSCs and neural markers.27,28 This gene was named NES because it is specifically expressed in the neuroepithelial stem cells. The predicted amino acid sequence of the NES gene product shows that NES defines a distinct sixth class of intermediate filament protein. These observations extend a model where transitions in intermediate filament gene expression reflect major steps in the pathway of neural differentiation.29 The expression in NES occurs at key steps in the differentiation of cell types in the mammalian CNS. Its expression is absent from nearly all mature CNS cells. Stem cells express NES and downregulate it sharply at the transition from the proliferating stem cell to the postmitotic neuron.30 NES is also expressed in cell precursors, but not in mature cells.31 NES was increased in our molecular study until 24 hours, then started to decrease after neural differentiation occurred, indicating the presence of neural progenerators.
Neurofilaments (NFs) are other intermediate filament proteins found specifically in neurons. During axonal growth, new NF subunits are incorporated along the axon in a dynamic process that involves the addition of subunits along the filament length, as well as the addition of subunits at the filament ends. After an axon has grown and connected with its target cell, the diameter of the axon may increase in as much as fivefold. NFs are excellent markers for adult and developing neurons, including neural progenitors. They are also useful in the diagnostics of NF accumulations seen in many neurological diseases, such as Lou Gehrig’s disease or Alzheimer’s disease.32 The expression of NFs was increased, especially NF-L, in many or most neurons of the developing brain and in the developmental stage of the neural cells.33,34 Another study indicated that the NFs (NF-L and NF-M) with alpha-internexin play an important role in the expression of PC12 cells during neuronal differentiation.11 Marei et al indicated that common markers of neural cell function, such as NFs: NEFL, MAP2, and NCAM1, were upregulated through the differentiation process, increasing their fold expressions after differentiation.28
Analysis on the expression of other specific neuron markers, such as MAP-2,35,36 has been used for neural confirmation. These mature-specific markers played a role in the stability of axons and neuronal cell bodies through the differentiation process;37 they were absent or had low expressions in the early stage of neural differentiation. In general, the MAP-2 gene expression is naturally weak in neural precursors, but increases during the neuron development process. Its expression is confined to neurons and reactive astrocytes.38
Our results showed that the NF-L gene was involved in the NSCs’ induction and full neural differentiation. Increased NF-L levels in all the neural differentiation passed the NSCs, induction, as compared with the MAP-2 gene (as postmaturation gene), which showed low expression levels in all different exposure times, even in the NSCs’ induction stage. Similarly, our results showed that there was a relationship between NES and the NF-L gene, which explains the interrelation of both genes in the ICC and RT-PCR results in our study by showing that the human NES gene, as well as the rat gene, has two of the three intron positions in common with the three NF genes. In contrast, none of the intron positions are identical to the intron positions found in classes I, II, and III of the IMFs’ group. This places NES in the same evolutionary branch as the NFs. Given that the degree of similarity in the α-helical region is ~50% among the NF genes and only 20% compared with NES, it is reasonable to assume that NES branched off before the split into the three NF genes. However, after the original intron, less postretrotransposition ancestors had acquired the common two introns. The branching was most likely the result of gene duplication at this stage to form NES and the ancestor of the three NF genes. Later, further duplications probably gave rise to the individual NF genes.39
Comparing the results of immunocytochemistry for markers expressions and their mRNA level of expression showing some level of correlation, however, it showed another level of differences especially for NES and MAP-2 markers; to understand this difference, we should know that synthesis of most protein molecules takes between 20 seconds and several minutes.40 Furthermore, it is not necessarily that mRNA expression should exactly match the protein expression but it will be convincing to have degree of correlation as stated by several studies.41,42 Moreover, the presence of mRNA is during the synthesis of the certain protein and that protein will last longer than the mRNA; for that reason, we depended on the mRNA level more than the number of cells expressing the proteins in determination of the NSCs at the early stages (1, 6, 12, and 18 hours).
Based on all the explanations regarding the mechanism of NES and NF-L in the neural cell in general and in NSCs in particular, our result indicated the possibility of the NSCs’ induction using adult stem cell (mouse bone marrow MSCs) and its possibility for use in the neurological disease as an easy way for treatment. It also indicated the ability to perform autologous transplantation from this source.
Acknowledgments
This work was supported by the Iraqi Center of Cancer and Medical Genetic Research (ICCMGR) and by the Biology Department/College of Science for Women, University of Baghdad.
Disclosure
The authors report no conflicts of interest in this work.
References
Taran R, Mamidi MK, Singh G, et al. In vitro and in vivo neurogenic potential of mesenchymal stem cells isolated from different sources. J Biosci. 2014;39(1):157–169. | |
Al-Shammari AM, Al-Joboury AA, Yaseen NY. Isolation and culture of neuronal stem cells which directed into Purkinje cells to be used for brain damage and epilepsy treatment in mice. Mol Ther. 2012;20(suppl 1):201–202. | |
Alshammari AM, Salman MI, Umran MA, Chondrogenesis markers “COL1A1, COL2A1 and CRTAC1”expression during differentiation of mice bone marrow mesenchymal stem cells. IJRSB. 2015;3(4):45–56. | |
Rastegar F, Deana S, Jiayi H, et al. Mesenchymal stem cells: molecular characteristics and clinical applications. World J Stem Cells. 2010;2(4):67–80. | |
Zhang J, Jiao J. Molecular biomarkers for embryonic and adult neural stem cell and neurogenesis. Biomed Res Int. 2015;2015:727542. | |
Conti L, Cattaneo E. Neural stem cell systems: physiological players or in vitro entities? Nat Rev Neurosci. 2010;11:176–187. | |
Uchida N, David WB, Dongping H, et al. Direct isolation of human central nervous system stem cells. Proc Natl Acad Sci U S A. 2000;97:14720–14725. | |
Yuan SH, Jody M, Jeanne E, et al. Cell surface marker signatures for the isolation of neural stem cells, glia and neurons derived from human pluripotent stem cells. PLoS One. 2011;6(3):e17540. | |
Reynolds BA, Rietze RL. Neural stem cells and neurospheres – re-evaluating the relationship. Nat Methods. 2005;2:333–336. | |
Louis SA, Sharon AL, Rodney LR, et al. Enumeration of neural stem and progenitor cells in the neural colony-forming cell assay. Stem Cells. 2008;26(4):988–996. | |
Chien CL, Liu TC, Ho CL, Lu KS. Overexpression of neuronal intermediate filament protein alpha-internexin in PC12 cells. J Neurosci Res. 2005;80(5):693–706. | |
Gross CG. Neurogenesis in the adult brain: death of a dogma. Nat Rev Neurosci. 2000;1:67–73. | |
Aguirre AA, Chittajallu R, Belachew S, Gallo V. NG2-expressing cells in the subventricular zone are type Clike cells and contribute to interneuron generation in the postnatal hippocampus. J Cell Biol. 2004;165:575–589. | |
Doetsch F, Petreanu L, Caille I, Garcia-Verdugo JM, Alvarez-Buylla A. EGF converts transit-amplifying neurogenic precursors in the adult brain into multipotent stem cells. Neuron. 2002;36:1021–1034. | |
Deleyrolle LP, Rietze RL, Reynolds BA. The neurosphere assay, a method under scrutiny. Acta Neuropsychiatr. 2008;20:2–8. doi: 10.1111/j.1601-5215.2007.00251.x. | |
Freshney RI. Culture of Animal Cells. A Manual for Basic Technique. 5th ed. New York, NY: John Wiley & Sons; 2005. | |
Lei Z, Lin Y, Ma J, et al. Culture and neural differentiation of rat bone marrow mesenchymal stem cells in vitro. Cell Biol Int. 2007;31:916–923. | |
Vandesompele J, De Preter K, Pattyn F, et al. Accurate normalization of real-time quantitative RT-PCR data by geometric averaging of multiple internal control genes. Genome Biol. 2002;3:RESEARCH0034. | |
Livak KJ, Schmittgen TD. Analysis of relative gene expression data using real-time quantitative PCR and the 2 (-Delta DeltaC(T)). Methods. 2001;25:402–408. | |
Schmittgen TD, Livak KJ. Analyzing real-time PCR data by the comparative C(T) method. Nat Protoc. 2008;3:1101–1108. | |
Salti A, Nat R, Neto S, Puschban Z, Wenning G, Dechant G. Expression of early developmental markers predicts the efficiency of embryonic stem cell differentiation into midbrain dopaminergic neurons. Stem Cells Dev. 2013;22(3):397–411. doi: 10.1089/scd.2012.0238. | |
Divya MS, George ER, Thulasi SD, et al. Umbilical cord blood-derived mesenchymal stem cells consist of a unique population of progenitors co-expressing mesenchymal stem cell and neuronal markers capable of instantaneous neuronal differentiation. Stem Cell Res Ther. 2012;3:57. | |
Darabi S, Tiraihi T, Delshad A, Sadeghizadeh M. A New multistep induction protocol for the transdifferentiation of bone marrow stromal stem cells into GABAergic neuron-like cells. Iran Biomed J. 2013;17(1):8–14. | |
Cui P, Xiaohong H, Yabin P, et al. Biological characterization and pluripotent identification of sheep dermis-derived mesenchymal stem/progenitor cells. Bio Med Res Int. 2014;2014:14. | |
Mareschi K, Novara M, Rustichelli D, et al. Neural differentiation of human mesenchymal stem cells: evidence for expression of neural markers and eag K+ channel types. Exp Hematol. 2006;34(11):1563–1572. | |
Khang G, Kim HL, Hong M, Lee D. Neurogenesis of bone marrow-derived mesenchymal stem cells onto β-mercaptoethanol-loaded PLGA film. Cell Tissue Res. 2012;347(3):713–724. | |
Ariffin SHZ, Shabnam K, Intan Z, et al. Differentiation of dental pulp stem cells into neuron-like cells in serum-free medium. Stem Cells Int. 2013;2013:10. | |
Marei HES, Asma A, Nahla A, et al. Gene expression profiling of embryonic human neural stem cells and dopaminergic neurons from adult human substantia nigra. PLoS One. 2011;6(12):e28420. | |
Lendahl U, Zimmerman LB, McKay RD. CNS stem cells express a new class of intermediate filament protein. Cell. 1990;60(4):585–595. | |
Park D, Andy PX, Frank FM, et al. Nestin is required for the proper self-renewal of neural stem cells. Stem Cells. 2010;28:2162–2171. | |
Zimmerman L, Parr B, Lendahl U, et al. Independent regulatory elements in the nestin gene direct transgene expression to neural stem cells or muscle precursors. Neuron. 1994;12(1):11–24. | |
Duprey P, Paulin D. What can be learned from intermediate filament gene regulation in the mouse embryo. Int J Dev Biol. 1995;39(3):443–457. | |
Lee WC, Chen YY, Kan D, Chien CL. A neuronal death model: overexpression of neuronal intermediate filament protein peripherin in PC12 cells. J Biomed Sci. 2012;19:8. | |
Kaplan MP, Chin SS, Fliegner KH, Liem RK. Alpha-internexin, a novel neuronal intermediate filament protein, precedes the low molecular weight neurofilament protein (NF-L) in the developing rat brain. J Neurosci. 1990;10(8):2735–2748. | |
Kalcheva N, Albala J, O’Guin K, Rubino H, Garner C, Shafit-Zagardo B. Genomic structure of human microtubule-associated protein 2 (MAP-2) and characterization of additional MAP-2 isoforms. Proc Natl Acad Sci U S A. 1995;92(24):10894–10898. | |
Kermani S, Karbalaie K, Madani SH, et al. Effect of lead on proliferation and neural differentiation of mouse bone marrowmesenchymal stem cells. Toxicol In Vitro. 2008;22(4):995–1001. | |
Janke C, Kneussel M. Tubulin post-translational modifications: encoding functions on the neuronal microtubule cytoskeleton. Trends Neurosci. 2010;33(8):362–372. | |
Patima T. Neuronal cell markers. Mater Methods. 2013;3:196. | |
Dahlstrand J, Zimmerman LB, McKay RD, Lendahl U. Characterization of the human nestin gene reveals a close evolutionary relationship to neurofilaments. J Cell Sci. 1992;103:589–597. | |
Alberts B, Johnson A, Lewis J. Molecular Biology of the Cell. From RNA to Protein. 4th ed. New York, NY: Garland Science; 2002. | |
Gry M, Rebecca R, Sara S, et al. Correlations between RNA and protein expression profiles in 23 human cell lines. BMC Genomics. 2009;10:365. | |
Schwanhausser B, Busse D, Li N, et al. Global quantification of mammalian gene expression control. Nature. 2011;473(7347):337–342. |
 © 2016 The Author(s). This work is published and licensed by Dove Medical Press Limited. The full terms of this license are available at https://www.dovepress.com/terms.php and incorporate the Creative Commons Attribution - Non Commercial (unported, v3.0) License.
By accessing the work you hereby accept the Terms. Non-commercial uses of the work are permitted without any further permission from Dove Medical Press Limited, provided the work is properly attributed. For permission for commercial use of this work, please see paragraphs 4.2 and 5 of our Terms.
© 2016 The Author(s). This work is published and licensed by Dove Medical Press Limited. The full terms of this license are available at https://www.dovepress.com/terms.php and incorporate the Creative Commons Attribution - Non Commercial (unported, v3.0) License.
By accessing the work you hereby accept the Terms. Non-commercial uses of the work are permitted without any further permission from Dove Medical Press Limited, provided the work is properly attributed. For permission for commercial use of this work, please see paragraphs 4.2 and 5 of our Terms.