")
Back to Journals » Journal of Inflammation Research » Volume 15
Characterization of Immune-Related Genes and Immune Infiltration Features in Epilepsy by Multi-Transcriptome Data
Authors Hou Y, Chen Z , Wang L, Deng Y, Liu G , Zhou Y, Shi H, Shi X, Jiang Q
Received 1 February 2022
Accepted for publication 14 April 2022
Published 5 May 2022 Volume 2022:15 Pages 2855—2876
DOI https://doi.org/10.2147/JIR.S360743
Checked for plagiarism Yes
Review by Single anonymous peer review
Peer reviewer comments 2
Editor who approved publication: Professor Ning Quan
Yunqi Hou,1,* Zhen Chen,2,* Liping Wang,3 Yingxin Deng,1 Genglong Liu,4 Yongfen Zhou,1 Haiqin Shi,1 Xiangqun Shi,1 Qianhua Jiang2
1Department of Neurology, Shunde Hospital, Southern Medical University (The First People’s Hospital of Shunde), Foshan, Guangdong Province, 528308, People’s Republic of China; 2Department of Intensive Care Unit, Shunde Hospital, Southern Medical University (The First People’s Hospital of Shunde), Foshan, Guangdong Province, 528308, People’s Republic of China; 3Department of Otorhinolaryngology Head and Neck Surgery, The First Affiliated Hospital of Hainan Medical University, Haikou, Hainan Province, 570102, People’s Republic of China; 4Department of Pathology, Affiliated Cancer Hospital & Institute of Guangzhou Medical University, Guangzhou, Guangdong Province, 510095, People’s Republic of China
*These authors contributed equally to this work
Correspondence: Yunqi Hou, Department of Neurology, Shunde Hospital, Southern Medical University (The First People’s Hospital of Shunde), Foshan, Guangdong Province, 528308, People’s Republic of China, Email [email protected]
Background: Epilepsy encompasses a group of heterogeneous brain diseases that afflict about 1% of the world’s population. Accumulating evidence shows that the immune system plays a key role in epileptogenesis. Nevertheless, the immune-related mechanisms remain not been precisely understood.
Methods: Three epilepsy datasets (GSE16969, GSE32534 and GSE143272) were screened to obtain differentially expressed immune-related genes (DEIRGs). Random forest (RF) and protein–protein interaction (PPI) network were constructed to identify core genes. Another dataset (GSE31718) and 60 clinical samples via quantitative real-time polymerase chain reaction (qRT-PCR) were utilized to validate core genes. Immune cell infiltration score was performed with CIBERSORTx tools and single-sample gene set enrichment analysis (ssGSEA). Gene set variation analysis (GSVA) and ssGSEA were conducted to determine the pathways that are significantly enriched during normal and epilepsy. The correlation between hub genes, immune cells, and enriched molecular pathways was evaluated by Pearson correlation analysis.
Results: Based on RF and PPI, 4 DEIRGs (CSF1R, IL6R, TLR2, and TNFRSF1A) were identified as hub genes. Results of qRT-PCR validated that higher expression levels of CSF1R, IL6R, TLR2, and TNFRSF1A in epilepsy samples compared to control sample. Immune infiltration analysis by CIBERSORTx displayed immune signatures that are significantly richer in epilepsy, T cell subsets in particular. Notably, ssGSEA found that Th1 signatures were more abundant in normal tissues; yet Th2 signatures were more abundant in epilepsy tissues. Cytokine cytokine receptor interaction (CCR) was significantly enriched in epilepsy based on multi-transcriptome data. Additionally, hub genes were significantly correlated with score of Th1/Th2 signatures and enrichment score of CCR in multi-transcriptome data.
Conclusion: Four IRGs (CSF1R, IL6R, TLR2, and TNFRSF1A) were closely correlated pathogenesis of epilepsy, which may be by impacting CCR and the balance of Th1/Th2 signatures involved in the occurrence of epilepsy. Our data offer compelling insights into the pathogenesis and promising therapeutic targets for epilepsy.
Keywords: epilepsy, immune-related genes, immune infiltration, Th1/Th2 signatures, CCR
Introduction
Epilepsy, is a highly heterogeneous neurological disease in nature, is characterized by recurrent unprovoked epileptic seizures on account of abnormal excessive or highly synchronous discharge of brain neurons, which are connected with varying degrees of change in the cellular and/or gene translation levels.1,2 The main clinical manifestations are recurrent convulsions, which seriously afflict the work, daily activities, and physical and mental health.3 According to estimates from the WHO, nearly 50 million people worldwide have active epilepsy with continuing seizures that need treatment.4 So far dozens of antiepileptic drugs (AEDs) have been exploited, which all share mechanisms of action rooted in the modulation of function of neurotransmitters and/or of ion channels, exert excellent efficacy on epileptic seizures.5 However, approximately one-third of clinic-based patients remain untreated and often suffer from drug-resistant epilepsy (DRE).1 Hence, it is of vital importance to investigate the molecular characteristics and mechanism of occurrence and development of epilepsy to provide new strategies for the diagnosis and treatment of epilepsy.
In 2017, ILAE (the International League Against Epilepsy) divided epilepsy into six categories, to provide a framework to circumvent such constraints for basic research as well as clinical practice, based on the following etiologies: 1) structural etiology; 2) genetic etiology; 3) infectious etiology; 4) metabolic etiology; 5) immune etiology, and 6) unknown etiology.6 At present, the pathogenesis of epilepsy has been widely explored, which mostly focuses on neurotransmission and ion channels (structural etiology). The imbalance of excitatory and inhibitory neural transmission and the formation of aberrant epileptic networks are considered to be the common mechanisms of various epileptic seizures. With the investigation of the pathogenesis of epilepsy, substantial evidence implicates that immune response and inflammatory mediators contribute to the process of epileptogenesis and decrease the threshold for individual seizures.7,8 Research confirmed that inflammatory cell infiltration and molecular regulation mechanisms in damaged neuronal tissues are the key factors for epileptogenesis. Inflammatory factors as interleukins, prostaglandins, platelet-activating factor, CD40 and CD44, matrix metalloproteinase-9, Toll-like receptors, and chemokines may create a microenvironment conducive to seizures through different mechanisms, thus increasing the susceptibility of epilepsy to seizures.9 Nevertheless, the underlying molecular mechanisms were still not been systematically understood, particularly regarding the effects of immunogenomic and immune cell in epilepsy. With the advent of public, large-scale high throughput genomic assays in recent years, a large number of pieces of evidence have identified biomarkers (immune-related genes) for disease surveillance and treatment with great accuracy and speed.10,11 Analyzing related characteristics in epilepsy patients may aid the exploration of epilepsy pathogenesis and treatment.
A study by Boer et al12 found that changes in gene expression (CCL2 and serpinA3) yield insights into new candidate genes that may contribute to seizure onset, representing new targets for potential therapeutic development. Niesen et al13 work firstly revealed that A deeper characterization on the dysregulated genes (C1QB and CALCRL) involved in brain tumor-induced epilepsy may shed some light on the management of epilepsy due to brain tumors. Rawat et al14 provides insight into the relevance of altered blood gene expression patterns in understanding epilepsy and its etiologic classes. Recently, Thrupp et al15 uncovered that single-nucleus RNA sequencing (snRNA-seq) is not suited for detecting cellular activation in microglia in human disease due to the low sensitivity of snRNA-seq to detect many activation genes. However, they only investigated several genes or single transcriptome data to uncover epileptogenesis. Importantly, almost all studies did not explore the correlation between hub genes, immune cells, and enriched molecular pathways (immune-related pathways). Our current study is the first to comprehensively characterize the immune landscape based on an integrated multi-transcriptome expression profile in epilepsy, in order to the discovery of novel biomarkers, thus uncovering underlying pathogenesis and prospective therapeutic targets. In the present study, we analyzed three epilepsy datasets (GSE16969,12 GSE3253413 and GSE14327214) from GEO to acquire DEIRGs between epilepsy and normal samples. RF and protein–protein interaction network were constructed to screen core genes, then which was validated in another dataset (GSE31718) and 60 clinical samples via quantitative real-time polymerase chain reaction (qRT-PCR). Subsequently, CIBERSORTx and ssGSEA were performed to reflect immune cell infiltration and to identify the discrepant immune cell subtypes. GSVA and ssGSEA were conducted to determine the pathways that are significantly enriched during normal and epilepsy. Pearson correlation analysis is used to reveal the correlation between hub genes, immune cells, and enriched molecular pathways, thus shedding light on the underlying molecular mechanisms. Finally, The Connectivity Map database (CMap) was utilized to screen candidate small molecules for alleviating epileptic seizures or treating epilepsy.
Materials and Methods
Sample Selection, Data Acquisition and Processing
The GEO (http://www.ncbi.nlm.nih.gov/geo) database was used to collect the gene expression profiles of epilepsy. The inclusion criteria were the following: expression profiling by array; epilepsy; organism: Homo sapiens; samples include normal and epilepsy samples. According to the above inclusion criteria, a comprehensive search was conducted in GEO databases from inception to August 10, 2021, resulting in four GEO datasets, GSE16969,12 GSE32534,13 GSE14327214 and GSE31718, being included in the analysis. The GSE16969 and GSE32534 series on the same platform GPL570 were merged as the discovery cohort, named GSEM datasets, in our study with removing the batch effect by “sva” packages, and GSE143272 series on the GPL10558 platform (Illumina HumanHT-12 V4.0 expression beadchip) was also used as discovery cohort. The GSE31718 with clinical information (pre-surgery epileptic frequency) on the GPL6254 platform (Phalanx Human OneArray) was used as validation cohort. The basic information of these microarray datasets are listed in Table 1. Additionally, ImmPort (The Immunology Database and Analysis Portal database) was utilized to select immune-related genes (IRGs) set in immunology research, containing 2489 IRGs. All data were normalized with the edgeR package or Limma package in the R computing environment.
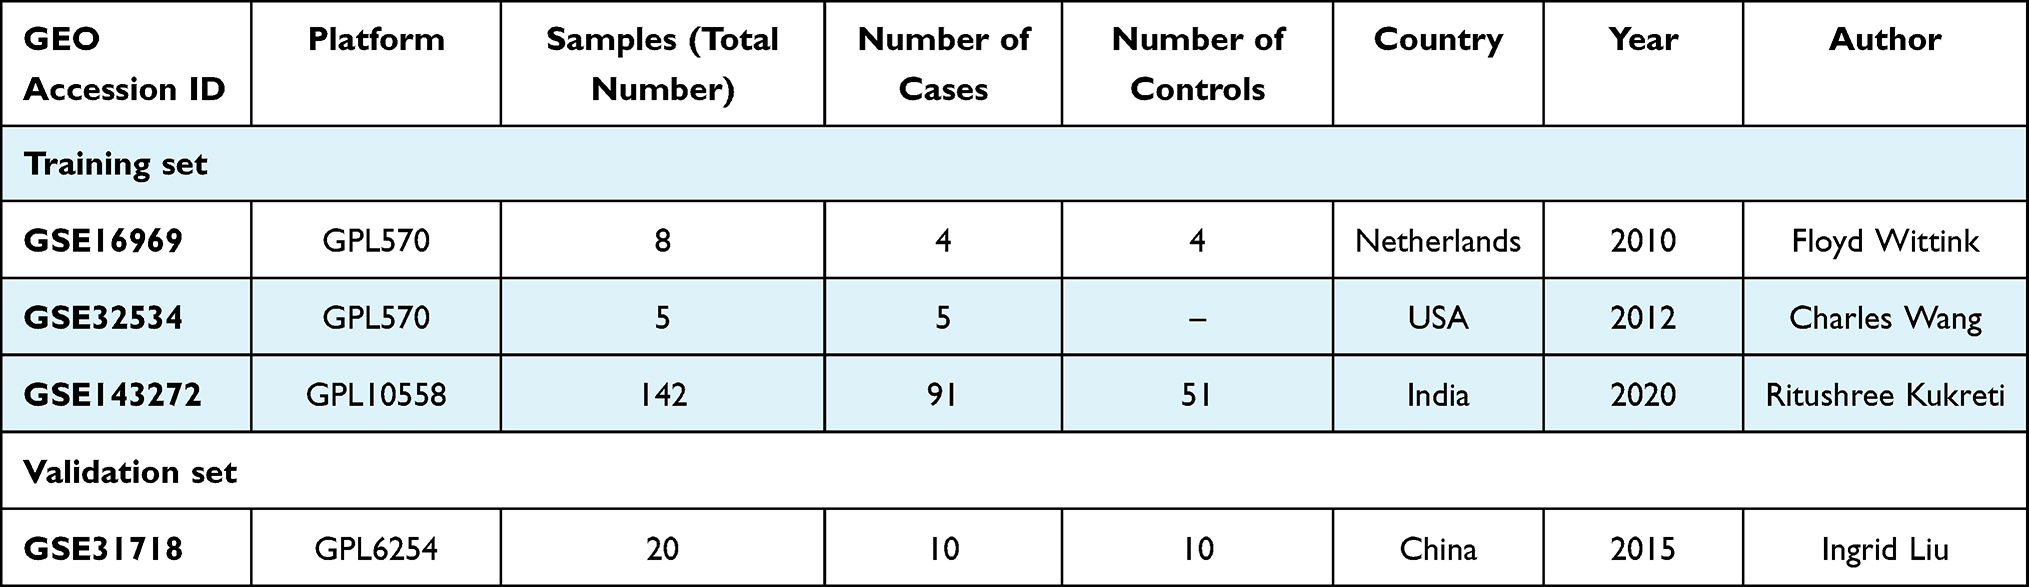 |
Table 1 Basic Information of Gene Expression Profiling |
Clinical Specimens
Peripheral blood mononuclear cell (PBMC) were collected from 60 clinical samples, including 30 epilepsy samples and 30 healthy controls. The study was reviewed and approved by the institutional review board (Ethics Committee) of the Shunde Hospital, Southern Medical University (the First people’s hospital of Shunde).
Evaluation of Immune Status
Microenvironment score, including immune score and stromal score, was calculated by ESTIMATE algorithm using the estimateR package on GSEM datasets and GSE16969 between normal and epilepsy tissues. The definition of immune scores is degree of immune cell infiltration. The definition of stromal scores is degree of stromal cell infiltration.
DEIRGs and Functional Enrichment Analysis
A variance analysis by NetworkAnalyst online-Gene Expression Table (https://www.networkanalyst.ca/) was performed on standardized data, GSEM datasets and GSE143272 datasets between normal and epilepsy tissues, respectively. p-values were adjusted with the Benjamini–Hochberg method. An adjusted p < 0.05 and |log2 FC (fold-change)| >1 between two groups were set as the thresholds for screening differentially expressed genes (DEGs). The overlapping DEIRGs were retained from the intersection of three data sets, DEGs of GSEM datasets, DEGs of GSE143272 datasets and IRGs set, with the UpSetR package. The location of DEIRGs on 23 chromosomes was analyzed using the RCircos package. Subsequently, DEIRGs were subject to gene ontology (GO), including the cellular component (CC), molecular function (MF), and biological process (BP) and Kyoto Encyclopedia of Genes and Genomes (KEGG) enrichment Analysis using R package “clusterProfiler”. And we used cnetplot R package to visualize these results.
Quantitative Real-Time PCR (qRT-PCR)
Following the manufacturer’s protocol, Trizol (Invitrogen) was used to extract total RNA from Peripheral blood mononuclear cell (PBMC). Reverse transcription of RNA using RevertAid RT Reverse Transcription Kit (Thermo Scientific). Quantitative PCR was performed using PowerUp™ SYBR™ Green Master Mix (Thermo Scientific). The results are standardized with GAPDH. Quantitative reverse transcription-PCR was conducted using the ABI 7500 real-time PCR system (Applied Biosystems, Foster City, CA, USA). Fold change was determined as 2-ΔΔCt in gene expression. Gene-specific PCR primers are listed in Supplementary Table 1.
Identification and Validation of Hub Genes
RF (Random forest), a tree-based ensemble comprised of tree-structured classifiers, was established to select feature variables via package “randomForest” with minimum error regression trees. The importance of variables was ranked using IncNodePurity. A PPI (protein–protein interaction) network of concordant DEIRGs was built by the STRING (Search Tool for the Retrieval of Interacting Genes/Proteins) online database (http://string-db.org/; version 11.5),16 and the nodes number of DEIRGs were counted. Then, we used Cytoscape software v.3.7.1 to visualize the PPI network based on STRING analysis result and screen core genes by the CytoHubba plugin.17 The real hub genes were obtained from the intersection of the result of Betweenness (top 15), Degree (top 15), MCC (top 15), PPICount (top 20), DiffGs (top 20), and RF (top 20). Then, another epilepsy dataset (GSE31718) was utilized to validate the hub genes. In addition, we compute risk score, which was generated through a linear combination of coefficients from logistic regression and the expression levels, based on hub genes in the GSE31718 database. ROC analysis with the pROC package was carried out to evaluate diagnostic performance and correlation analysis is applied to elucidate the relationship between risk score of hub genes and epileptic frequency.
Evaluation of Immune Cell Infiltration by CIBERSORTx and ssGSEA
To evaluate the relative abundance of immune infiltrates, CIBERSORTx (https://cibersort.stanford.edu/),18 which transformed the normalized gene expression matrix into the composition of infiltrating immune cells, is a kind of deconvolution algorithm with a 1000 permutation count. We filtered out samples with CIBERSORTx output of p-value > 0.05 for the accurate forecast of immune cell composition. Then, a bar graph was drawn with the package “ggplot2” to visualize the content of 22 types of infiltrating immune cells in each sample and a correlation heatmap was drawn with the “corrplot” package to visualize the correlation of immune cell subtypes. Importantly, variance analysis of immune cells between normal and epilepsy tissues was visualized by drawing violin diagrams. On the basis of the expression of metagenes that are representative of specific immune cells, the ssGSEA, using R package “GSVA”, was introduced to quantify the relative infiltration of immune cell types. We focused on the metagene set of 16 immune cell subtypes, including tumor-infiltrating lymphocyte (TIL), regulatory T cells (Treg), T helper cells, CD8+ T cells, type-2 T helper cells (Th2 cells), type-1 T helper cells (Th1 cells), natural killer cells (NK cells), macrophages, follicular helper T cells (Tfh), plasmacytoid dendritic cells (pDCs), dendritic cells, activated dendritic cells (aDCs), immature dendritic cells (iDCs), B cells, mast cells, and neutrophils, which were widely researched and accepted.19 Supplementary Table 2 will provide the metagene set. To determine differential immune cell subtypes between the two groups (p-value < 0.05), the Wilcoxon test with two-tailed was utilized to analyze the immunoscores. And we adopt vioplotR package to visualize the result.
GSVA and ssGSEA
GSVA, which converts genes from a sample matrix into predefined gene sets without a priori knowledge of experiment design, is a non-parametric unsupervised approach. The KEGG gene sets (c2.cp.kegg.v7.4.symbols.gmt), which was downloaded from the Molecular Signatures Database (MSigDB) (http://softwarebroadinstitute.org/gsea/index.jsp),20 were used to estimate the variation of pathway activity in each sample. The significantly enriched pathways in KEGG gene sets were set at p-value < 0.05 and enrichment score change > 1.0. Additionally, ssGSEA, generate an enrichment score to signify the levels of absolute enrichment of a metagene set within a given dataset in each sample, was applied to evaluate the enrichment degree of immune-related pathways (cytolytic activity, T cell co-inhibition, checkpoint, T cell co-stimulation, antigen-presenting cell (APC) co-stimulation, antigen-presenting cell (APC) co-inhibition, major histocompatibility complex (MHC) class-1, type-1 IFN response, inflammation-promoting, para-inflammation, human leukocyte antigen (HLA), type-2 IFN response, and cytokine cytokine receptor interaction (CCR)19) in current immunology research. Supplementary Table 2 will provide the metagene set.
Pearson Correlation Analysis
To elucidate the potential molecular mechanism of occurrence and progression of epilepsy, Spearman correlation analyses were performed to reveal the correlation between hub genes, immune cells, and pivotal molecular pathways. A p<0.05 would be considered statistically significant.
Identification of Candidate Small Molecules Drugs
To identify potential agents for epilepsy treatment, we uploaded 51 DEIRGs, which were divided into down-modulated and up-modulated groups, into the CMap database (http://www.broadinstitute.org/cmap/). Then, the connectivity score and enrichment scores were computed, which represent similarity range from −1 to 1. A negative enrichment score (closer to −1) demonstrates that a compound can alleviate or even reverse the disease status. Whereas, a positive enrichment score (closer to +1) indicates that a compound can cause or exacerbate the disease status.
Statistical Analysis
R software (R version 3.6.1) was utilized to conduct the statistical analysis. Statistical significance was set at a two-sided p<0.05 except for where a certain p-value has been given.
Results
Evaluation of Immune Status
Whether in GSEM datasets or in GSE16969 datasets, compared with normal samples, immune score and stromal score were all higher in epilepsy samples (Figure 1), which implied that immune elements play an important role in the occurrence of epilepsy.
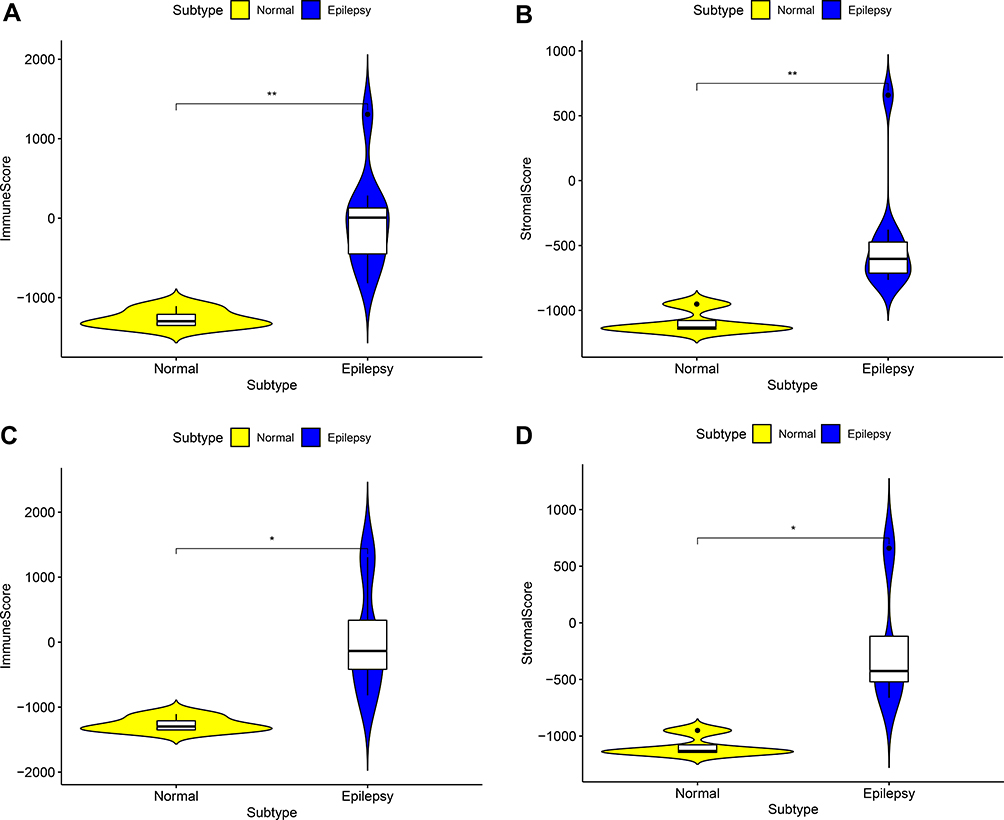 |
Figure 1 The comparison of the microenvironment score in normal samples and epilepsy samples. (A) Immune score in GESM sets. (B) Stromal score in GESM sets. (C) Immune score in GSE16969 sets. (D) Stromal score in GSE16969 sets. *p < 0.05, and **p ≤ 0.01. |
DEIRGs and Functional Enrichment Analysis
After pre-processing, the distribution of expression data is consistent among all data sets. Thus, samples from each dataset are comparable. In GSEM series, we identified 1936 DEGs (Supplementary Table 3), in GSE143272 series, we identified 1410 DEGs (Supplementary Table 4). As shown in the UpSet plot, 51 DEIRGs overlapped in the three datasets (GSEM series, GSE143272 series, and IRGs set) (Figure 2A). Figure 2B displays 51 DEIRGs on the location of chromosomes was shown. The GO term enrichment analysis for DEIRGs shows the top 10 significant clusters of enriched sets (Figure 3A), such as positive regulation of chemokine production, positive regulation of T cell activation, regulation of chemokine production, chemokine production, regulation of T cell activation, and positive regulation of lymphocyte activation and so on. As for the (KEGG) biological pathway enrichment analysis of DEIRGs, they were mainly involved in T cell receptor signaling pathway, Th17 cell differentiation, Natural killer cell mediated cytotoxicity, B cell receptor signaling pathway and PD-L1 expression and PD-1 checkpoint pathway, etc (Figure 3B). The detailed results of GO and KEGG enrichment analysis were listed in Supplementary Tables 5 and 6.
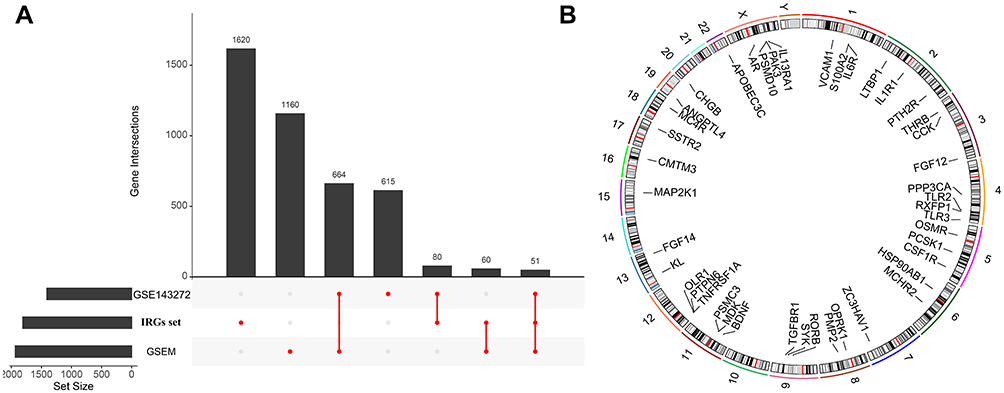 |
Figure 2 (A) UpSet plot presents the intersection of three datasets. (B) The location of differentially expressed immune-related genes (DEIRGs) on 23 chromosomes. |
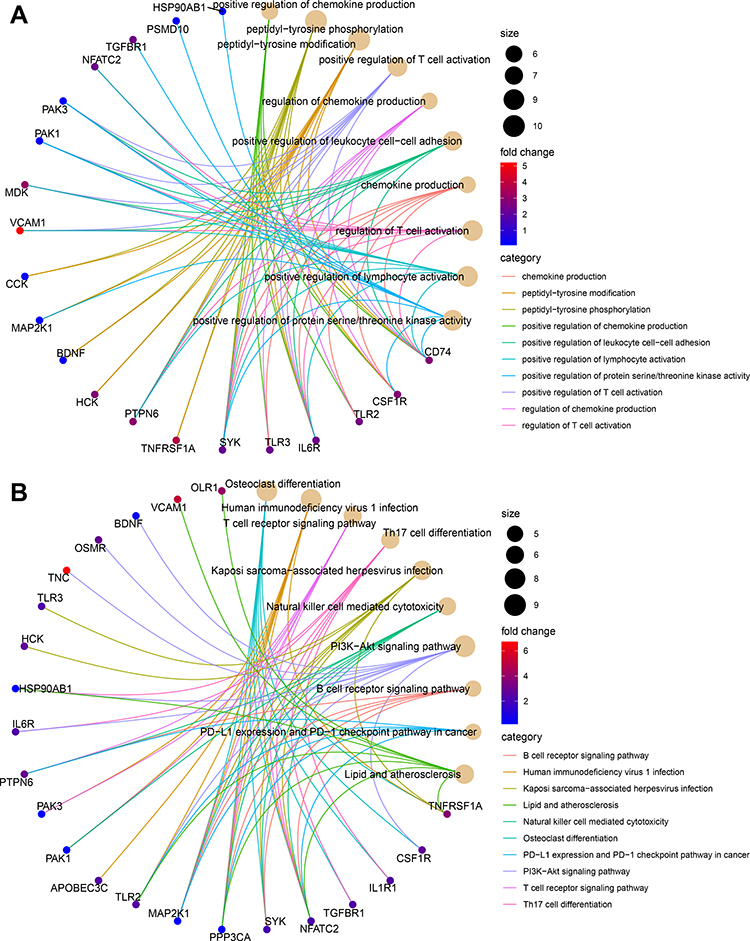 |
Figure 3 Functional enrichment analysis of differentially expressed immune related genes (DEIRGs) in GSEM + GSE143272 datasets. (A) Gene ontology (GO) analysis on biological process (BP), cellular component (CC), and molecular function (MF). (B) Kyoto Encyclopedia of Genes and Genomes (KEGG) pathways. |
Identification and Validation of Hub Genes
To select out convincing core genes, random forest was built for feature selection and precisely calculate the importance of each feature. As shown in Figure 4A, when regression tree =52, the model error is minimum, thereby the corresponding model is constructed with sorting diagram that shows the importance of variables-DEIRGs (Figure 4B). Based on the STRING online database, we obtained the linkage between genes and calculated the number of nodes for each gene (PPICount) (Figure 5A). The PPI network was constructed by Cytoscape software and Cytoscape’s cytoHubba plugin was utilized to identify hub genes. The detailed results of cytoHubba are shown in Supplementary Table 7. According to 3 commonly used classification methods (Betweenness (top 15), Degree (top 15), MCC (top 15)) in cytoHubba, PPICount (top 20), DiffGs (top 20), and RF (top 20), which represent aspects of biological function and machine learning algorithm, we take the intersection of six methods to acquire four hub genes (CSF1R, IL6R, TLR2, and TNFRSF1A). Similar results in the GSE31718 dataset were seen by comparing the mRNA levels of the hub genes between normal and epilepsy groups (Figure S1). Additionally, the diagnostic ability of the four hub genes combined yielded an AUC of 0.92 (95% CI 0.8–1.0) (Figure 6A), indicating that combined hub genes had a high diagnostic ability. Importantly, combined hub genes were significantly positively correlated with epileptic frequency (R=0.77, p =0.0097) (Figure 6B), hinting that hub genes maybe correlated progression of epilepsy.
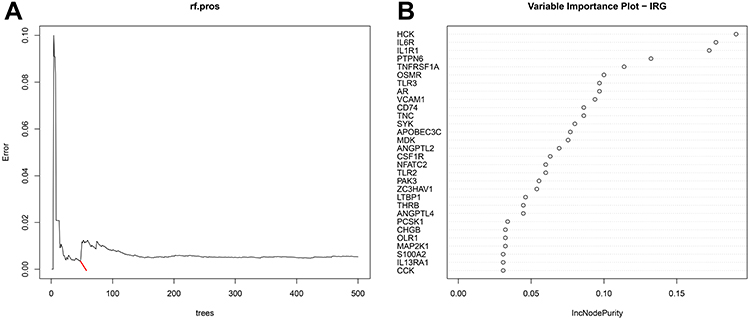 |
Figure 4 Random forest (RF) algorithm to screen hub genes in GSEM + GSE143272 datasets. (A) Distribution diagram of regression tree and error. (B) The top 30 most important variables ranked by IncNodePurity. |
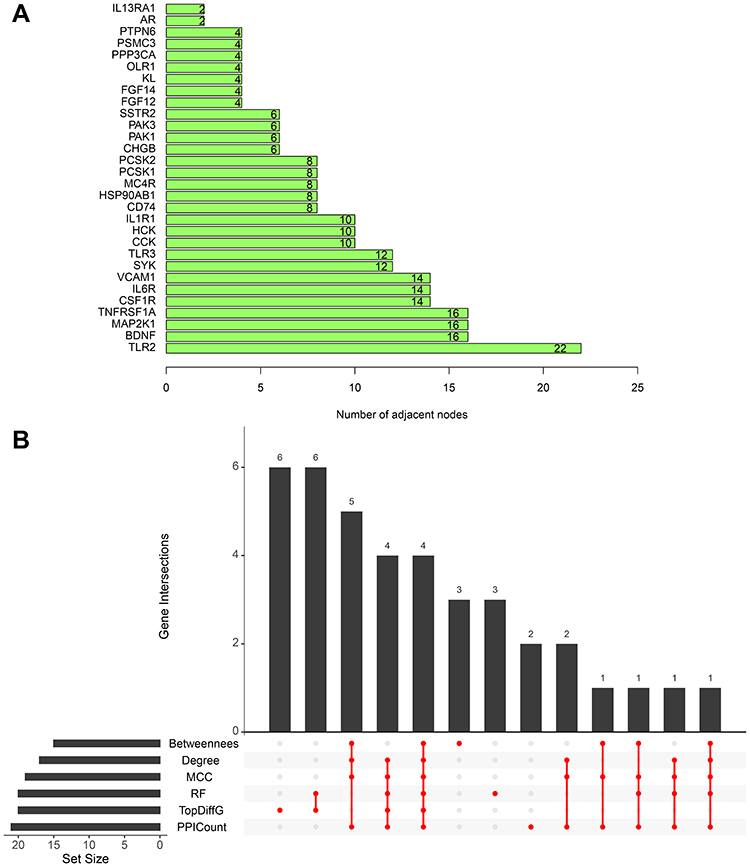 |
Figure 5 (A) The top 30 DEIRGs ranked by the number of nodes based on the PPI network. (B) UpSet plot present the intersection of six methods (Betweenness (top 15), Degree (top 15), MCC (top 15), PPICount (top 20), DiffGs (top 20), and RF (top 20)). |
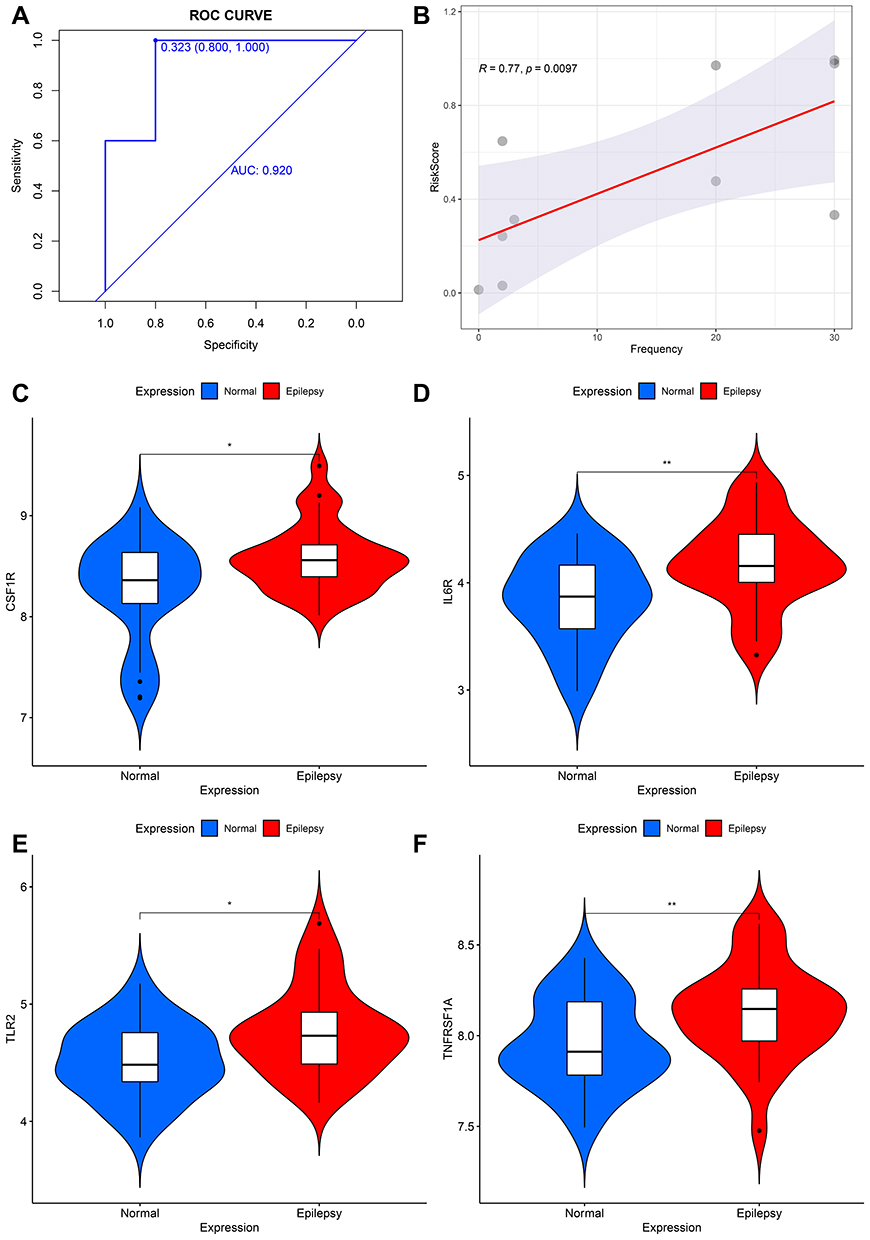 |
Figure 6 (A) The receiver operating characteristic (ROC) curves of the diagnostic efficacy from combined hub genes in GSE31718 dataset. (B) Correlation between combined hub genes and epileptic frequency. (C–F) Verification of hub genes via qRT-PCR on blood PBMCs - Comparison of gene expression levels of 4 hub genes between controls and epilepsy samples. *p < 0.05, and **p ≤ 0.01. |
qRT-PCR
To further validate the expression of the 4 hub genes, we performed qRT-PCR in 60 clinical specimens. Compared with healthy controls, CSF1R, IL6R, TLR2, and TNFRSF1A was significantly up-regulated in epilepsy samples (Figure 6C–F). The detailed expression levels of 8 hub genes and clinical information are provided in Supplementary Table 8.
Immune Cell Infiltration Analysis
To investigate the differential immune landscape in normal and epilepsy tissues, microarray data from the GSE143271 dataset was subject to CIBERSORTx to estimate the fraction of 22 types of immune cells. Figure S3 displays the distribution of 22 types of immune cells in each sample and Figure S4 shown the correlation of immune cell subtypes. Compared with normal tissues, activated CD4 memory T cells (p =0.001), resting CD4 memory T cells (p =0.043), T cells gamma delta (p =0.033) and activated mast cells (p =0.025) were more abundant in epilepsy tissues (Figure 7A). This finding indicates that T cells were significantly richer in epilepsy patients. In addition, we adopt ssGSEA, another cell-type quantification method, to quantify the enrichment score of immune cell types. In GSE143271 dataset, dendritic cells (p =0.001), iDCs (p =0.001), macrophages (p<0.001), and mast cells (p =0.01) were significantly higher in epilepsy samples than in normal sample, whereas NK cells (p =0.003) and Th1 cells (p =0.004) were relatively lower (Figure 7B). In GSEM dataset, compared with normal samples, B cells (p =0.003), dendritic cells (p =0.02), neutrophils (p =0.003), pDCs (p =0.003), T helper cells (p =0.011), Th2 cells (p =0.003), TIL (p =0.003), and Treg (p =0.02) were more abundant in epilepsy samples, whereas CD8+ T cells (p =0.05), iDCs (p =0.02) and Th1 cells (p =0.006) were relatively lower (Figure 7C). Notably, ssGSEA found that Th1 cells was more abundant in normal tissues in two different datasets; yet, Th2 cells was more abundant in epilepsy tissues (one dataset shows statistical significance, another shows tendency).
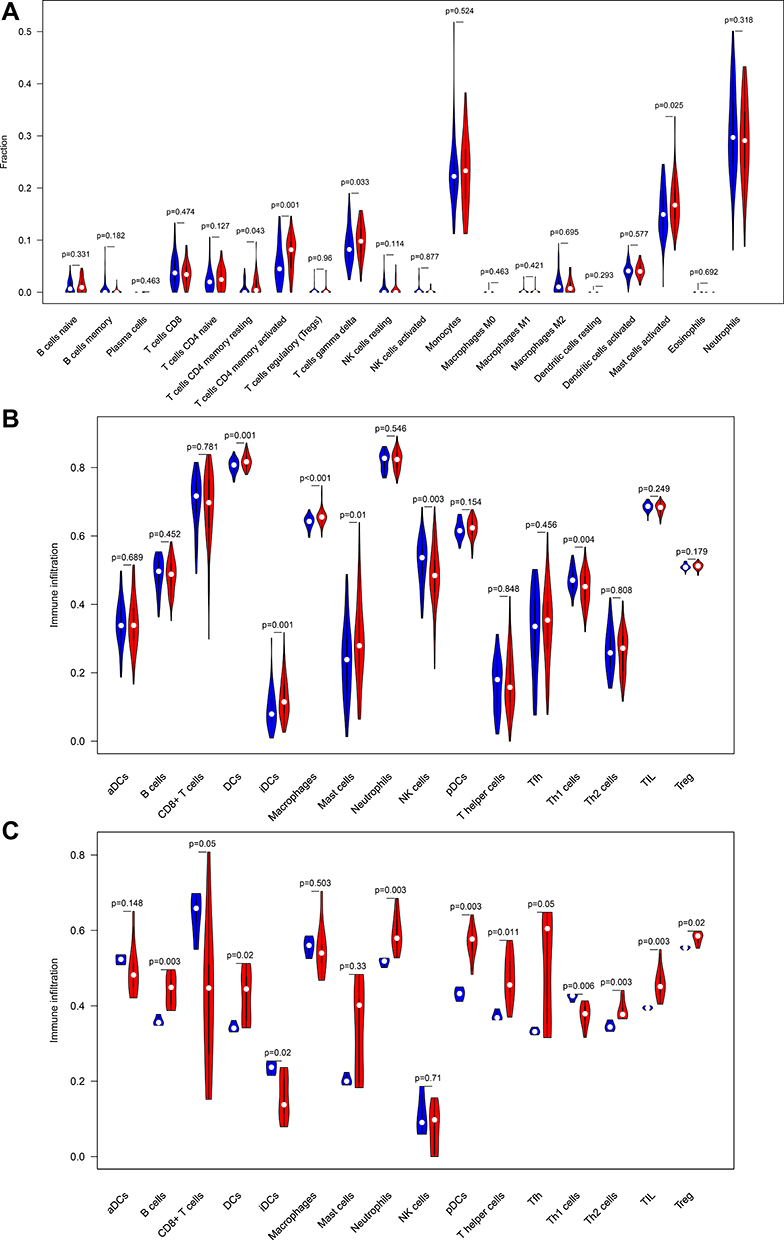 |
Figure 7 Comparison of infiltrating immune cells between normal samples and epilepsy samples. (A) GSE143272 sets based on CIBERSORTx. (B) GSE143272 sets based on ssGSEA. (C) GESM sets based on ssGSEA. |
Correlation Between Hub Genes and Immune Cells
To explore whether our hub genes were related to immune infiltration in epilepsy, Spearman correlation analyses were carried out. In GSE143271 dataset, hub genes were significantly related to B cells, CD8+ T cells, NK cells, Th1 cells, and TIL (Figure 8A). In GSEM dataset, hub genes were significantly related to B cells, neutrophils, pDCs, T helper cells, Th1 cells, Th2 cells, TIL, and Treg (Figure 8B). Based on the above results, we focused on the relational between hub genes and Th1 cell, Th2 cells. In GSE143271 dataset, IL6R (R=−0.4, p<0.001), TLR2 (R=−0.46, p<0.001), and TNFRSF1A (R=−0.44, p<0.001) were significantly negatively correlated with Th1 cell (Figure 9). In GSEM dataset, CSF1R (R=−0.87, p<0.001), IL6R (R=−0.66, p =0.016), TLR2 (R=−0.82, p =0.0011), and TNFRSF1A (R=−0.66, p =0.0016) were significantly negatively correlated with Th1 cell (Figure 9). Encouragingly, In GSE143271 dataset, CSF1R (R=−0.17, p =0.042), IL6R (R=−0.22, p =0.0097), TLR2 (R=−0.33, p<0.001), and TNFRSF1A (R=−0.31, p<0.001) were significantly negatively correlated with Th1/Th2 signatures (Figure 10). Similar results in the GSEM dataset were seen, CSF1R (R=−0.79, p =0.0023), IL6R (R=−0.88, p<0.001), TLR2 (R=−0.83, p<0.001), and TNFRSF1A (R=−0.71, p =0.0088) (Figure 10). Figure S5 visualize the relational between hub genes and Th2 cells.
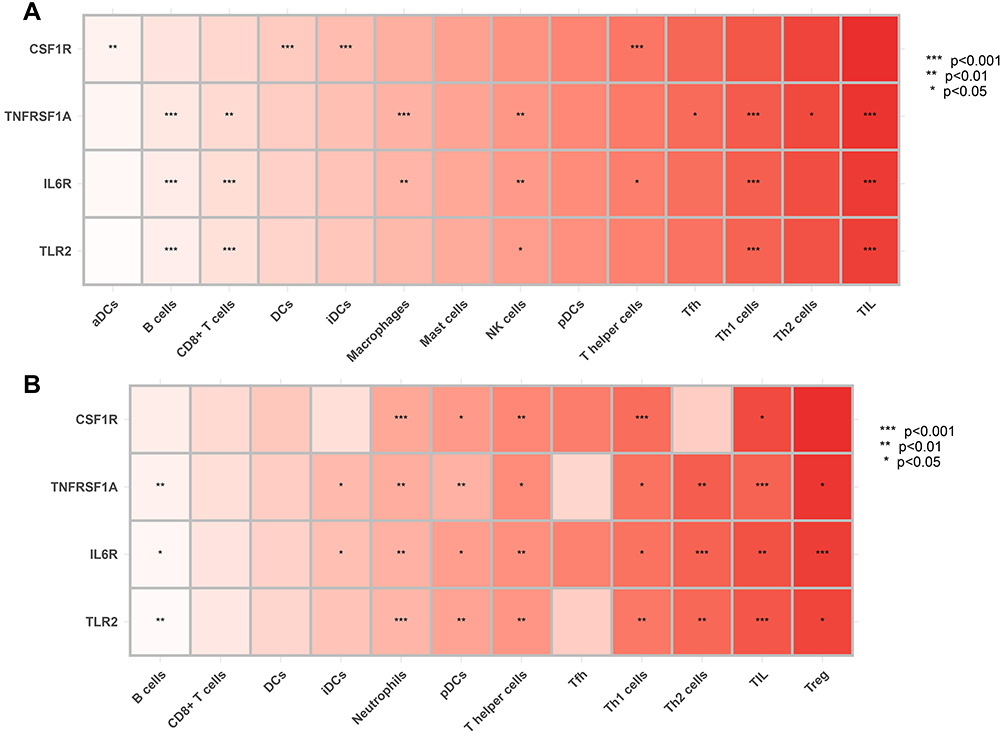 |
Figure 8 Correlation between hub genes and infiltrating immune cells. (A) GSE143272 sets. (B) GESM sets. Yellow represents common between GESM and GSE143272. *p < 0.05, **p ≤ 0.01, and ***p ≤ 0.001. |
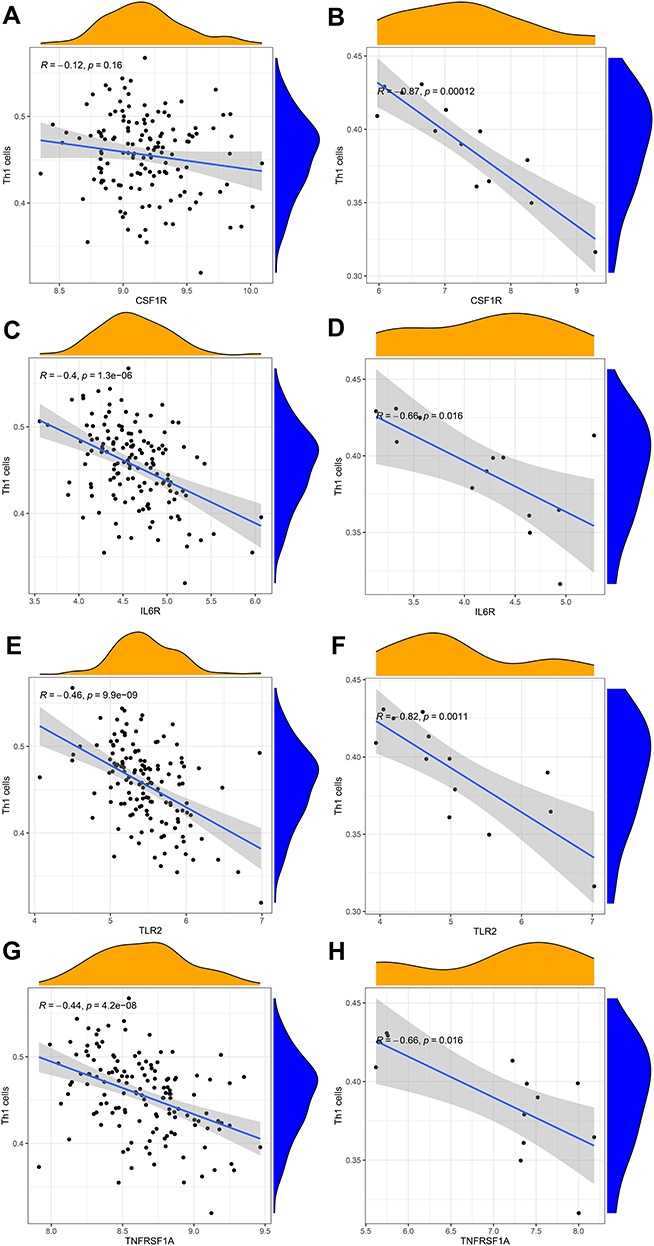 |
Figure 9 Correlation between hub genes and Th1 cells in GSE143272 sets and GESM sets. (A) Association between CSF1R and Th1 cells in GSE143272 sets. (B) Association between CSF1R and Th1 cells in GESM sets. (C) Association between IL6R and Th1 cells in GSE143272 sets. (D) Association between IL6R and Th1 cells in GESM sets. (E) Association between TLR2 and Th1 cells in GSE143272 sets. (F) Association between TLR2 and Th1 cells in GESM sets. (G) Association between TNFRSF1A and Th1 cells in GSE143272 sets. (H) Association between TNFRSF1A and Th1 cells in GESM sets. |
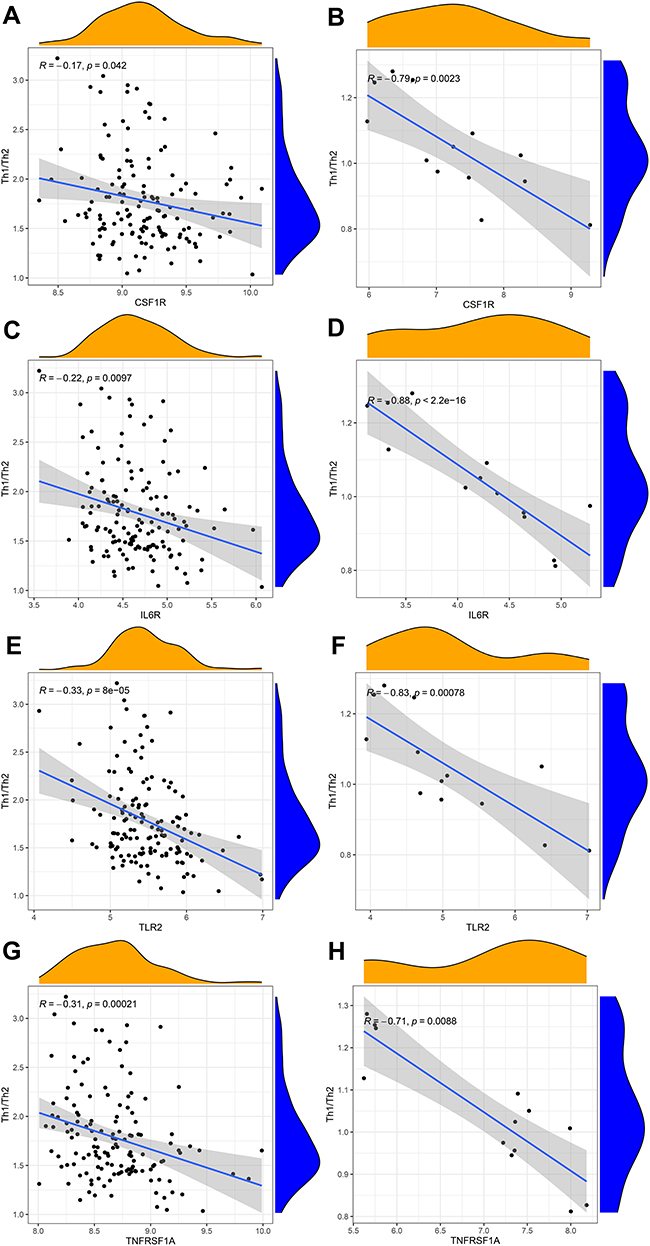 |
Figure 10 Correlation between hub genes and Th1/Th2 cells in GSE143272 sets and GESM sets. (A) Association between CSF1R and Th1/Th2 cells in GSE143272 sets. (B) Association between CSF1R and Th1/Th2 cells in GESM sets. (C) Association between IL6R and Th1/Th2 cells in GSE143272 sets. (D) Association between IL6R and Th1/Th2 cells in GESM sets. (E) Association between TLR2 and Th1/Th2 cells in GSE143272 sets. (F) Association between TLR2 and Th1/Th2 cells in GESM sets. (G) Association between TNFRSF1A and Th1/Th2 cells in GSE143272 sets. (H) Association between TNFRSF1A and Th1/Th2 cells in GESM sets. |
GSVA and ssGSEA
To screen biological differences between normal tissues and epilepsy, GSVA was performed in GSEM databases. The results showed that CCR, apoptosis, Fc gamma R-mediated phagocytosis, gap junction, JAK−STAT signaling pathway, leukocyte transendothelial migration, and Toll−Like receptor signaling pathway were enriched in the epileptic samples (Figure 11). In addition, ssGSEA was utilized to explore the predefine immune-related pathway in epileptogenesis. In GSEM databases, the ssGSEA results showed that CCR, checkpoint, MHC class I, T cell co-inhibition, T cell co-stimulation, and type II IFN response were involved in the mechanism of epilepsy (Figure 12A). In GSE143271, the ssGSEA results showed that APC co-inhibition, APC co-stimulation, CCR, para-inflammation, and type I IFN were mainly enriched in epilepsy (Figure 12B).
 |
Figure 11 Heatmap displays differences in pathway activities between normal samples and epilepsy samples in GESM datasets. Red indicates epilepsy samples, while blue indicates normal samples. |
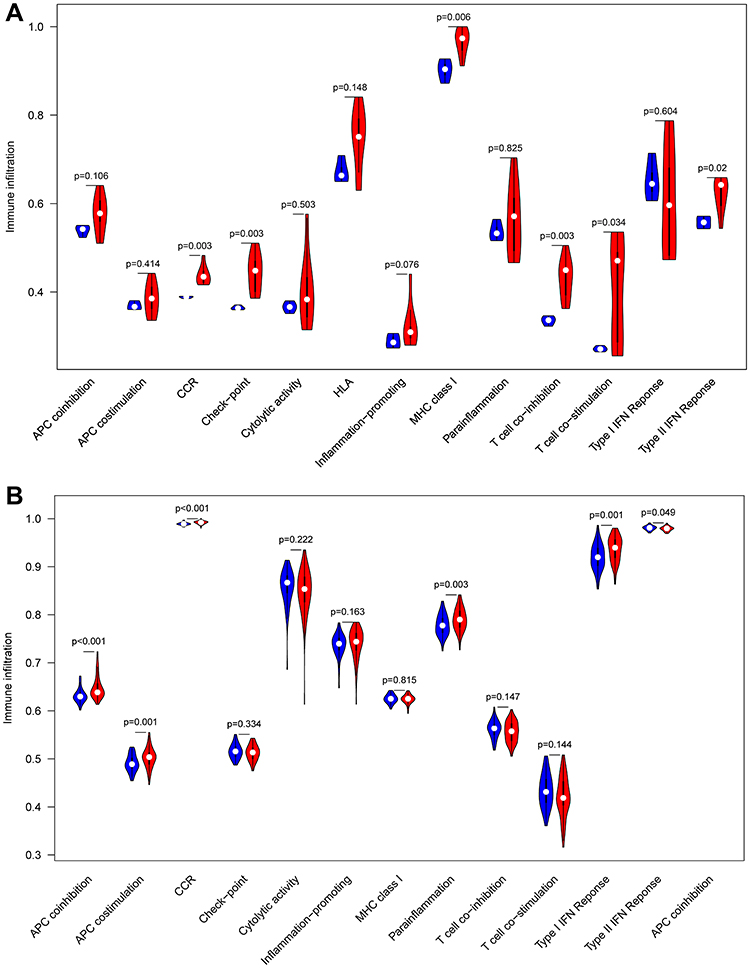 |
Figure 12 Comparison of the immune-related pathway between normal samples and epilepsy samples. (A) GESM sets. (B) GSE143272 sets. |
Correlation Between Hub Genes and Pivotal Molecular Pathways
To determine the molecular pathways potentially involved in epileptogenesis, Pearson correlation analysis was performed to uncover the correlation between hub genes and enriched molecular pathways. In GSEM databases, based on enrichment score of GSVA, hub genes were significantly related to CCR, apoptosis, Fc gamma R-mediated phagocytosis, focal adhesion, JAK−STAT signaling pathway, and leukocyte transendothelial migration (Figure 13A), according to enrichment score of ssGSEA, hub genes were significantly related to CCR, checkpoint, MHC class I, T cell co-inhibition, and type II IFN response (Figure 13B). In GSE143271 databases, based on the enrichment score of ssGSEA, hub genes were significantly correlated with CCR, checkpoint, APC co-inhibition, APC co-stimulation, para-inflammation, T cell co-stimulation, T cell co-inhibition, and type I IFN response (Figure 13C).
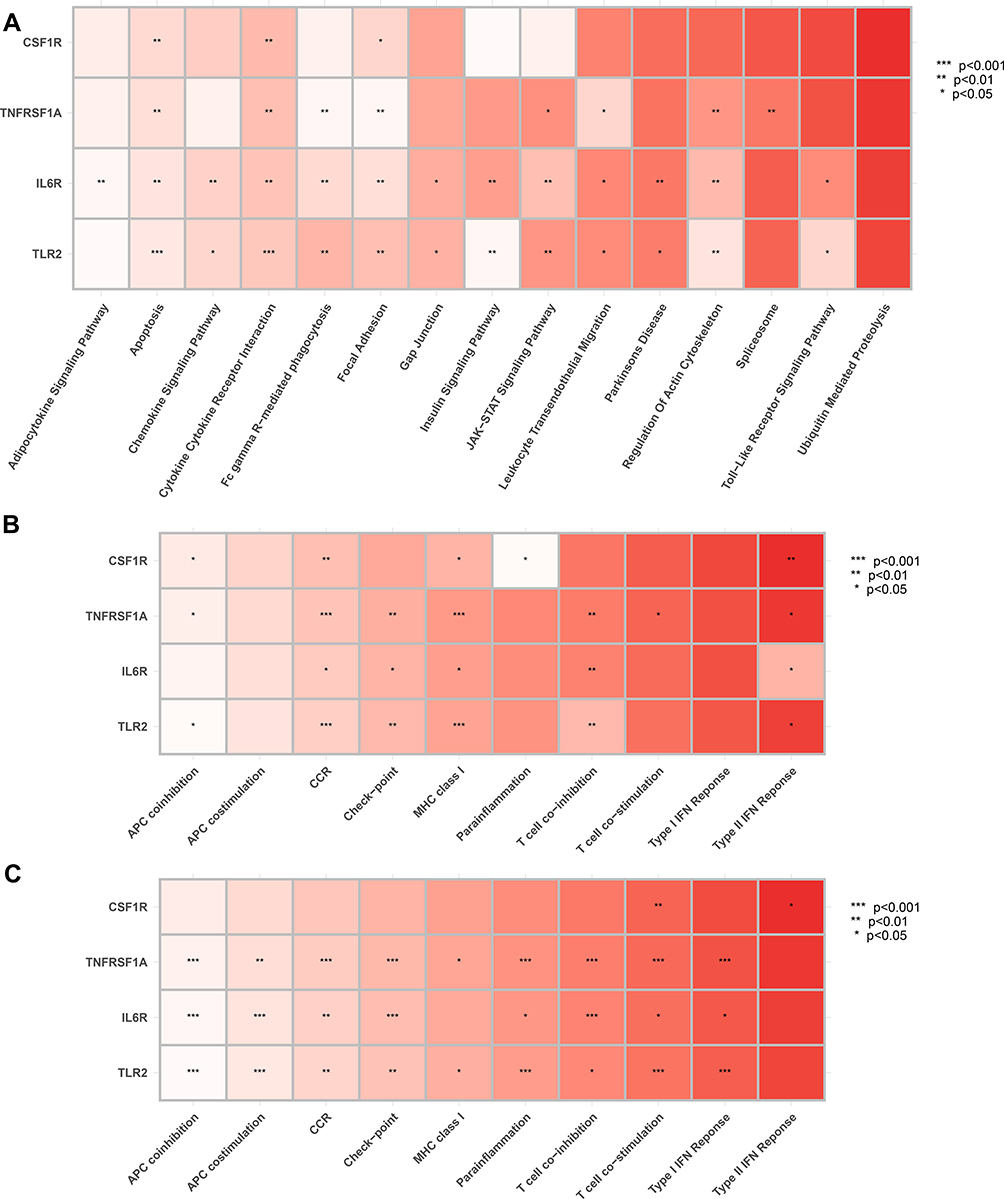 |
Figure 13 Correlation between hub genes and pivotal molecular pathways. (A) GESM sets based on GSVA. (B) GESM sets based on ssGSEA. (C) GSE143272 sets based on ssGSEA. *p < 0.05, **p ≤ 0.01, and ***p ≤ 0.001. |
Identification of Related Active Small Molecules
10 most significant small molecules agents mitigating epileptic seizures are listed in Table 2. Among these small molecules drugs, wortmannin (enrichment score = −0.981), securinine (enrichment score = −0.897) and parthenolide (enrichment score = −0.867) were correlated with a highly significant negative fraction and possess the potential to alleviate or even reverse epileptic seizures.
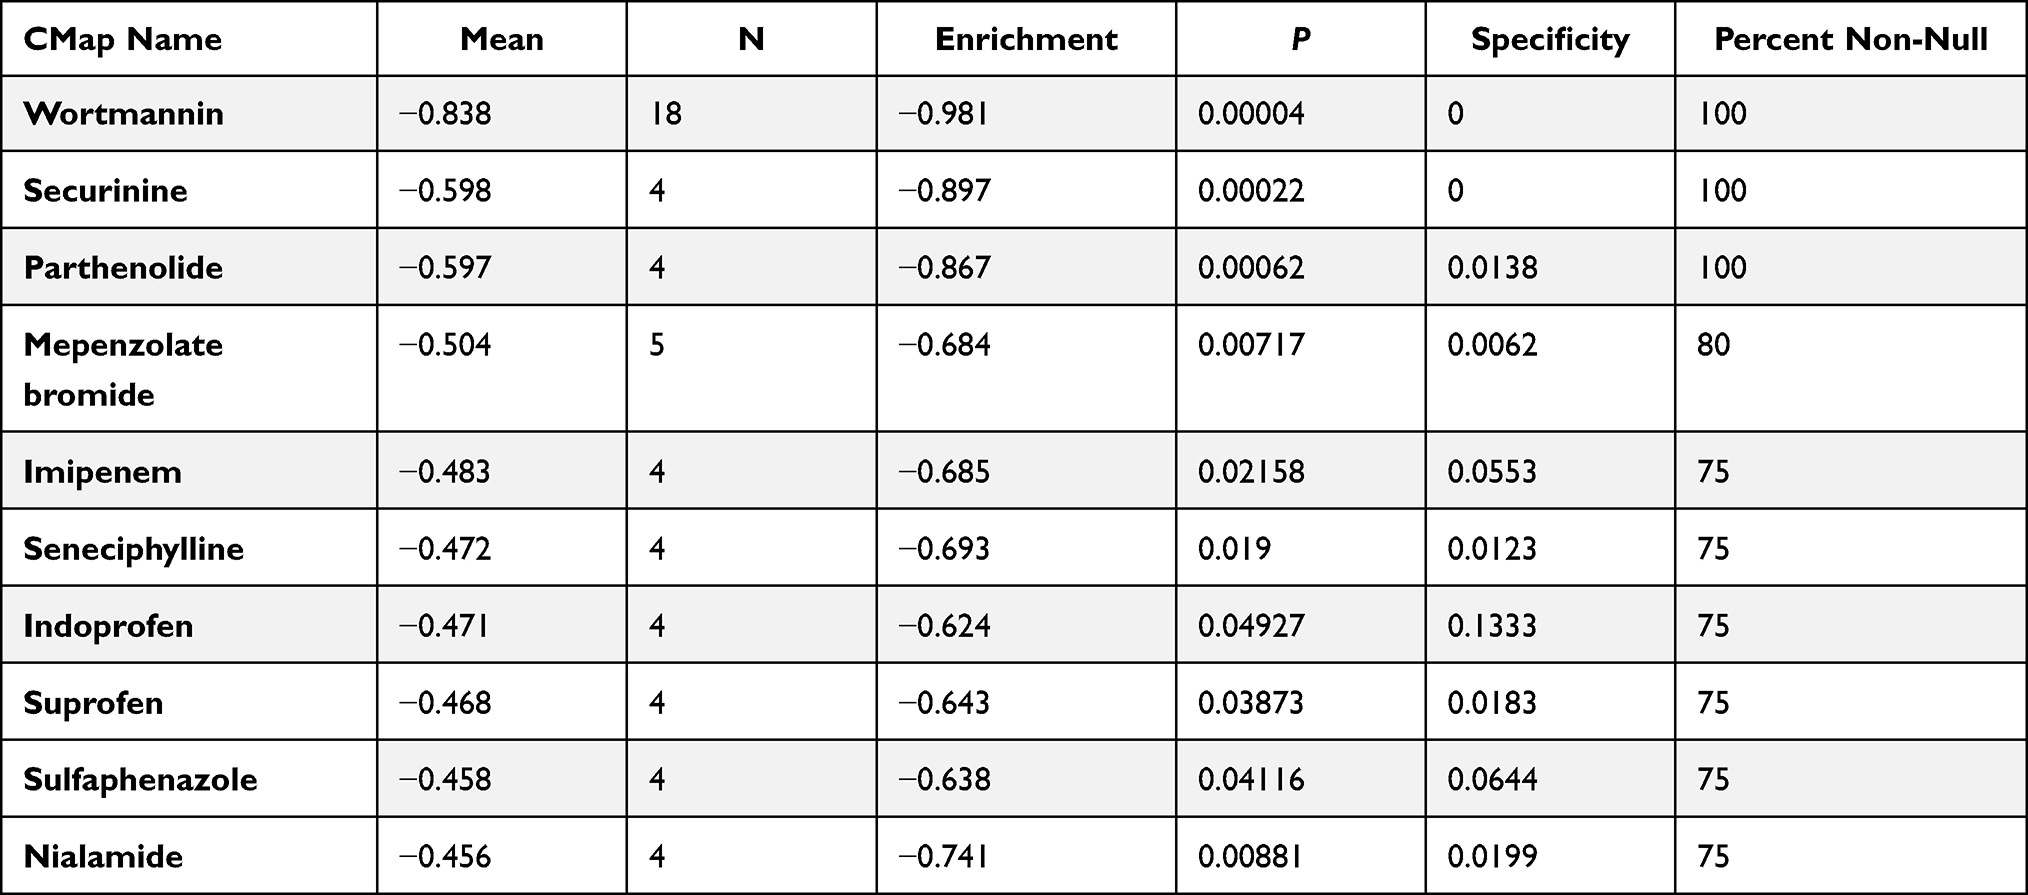 |
Table 2 List of the 10 Most Significant Small Molecule Drugs That Can Reverse Epilepsy |
Discussion
Integrating multi-transcriptome datasets, we identified 51 DEIRGs. Based on RF and PPI network, 4 DEIRGs (CSF1R, IL6R, TLR2, and TNFRSF1A) were identified as hub genes. Results of qRT-PCR validated that higher expression levels of CSF1R, IL6R, TLR2, and TNFRSF1A in epilepsy compared to control sample. Immune infiltration analysis by CIBERSORTx displayed immune cells that are significantly richer in epilepsy, including activated CD4 memory T cells, resting CD4 memory T cells, T cells gamma delta and activated mast cells. Noteworthily, ssGSEA found that Th1 signatures was more abundant in normal tissues; yet, Th2 signatures was signatures was more abundant in epilepsy tissues. According to GSVA and ssGSEA, in spite of combined GEO or GSE143272, CCR were all significantly enriched in epilepsy. Additionally, hub genes were significantly correlated with infiltration score of Th1/Th2 signatures and enrichment score of CCR in multi-transcriptome data. Finally, CMap matched the 10 most important candidate molecules as potential therapeutic drugs to reverse epilepsy.
An increasing body of evidence indicates that several components of the immune system, including alteration of the function or number of immune cells, the release of pro-inflammatory cytokines and chemokines, and the expression of inhibitory receptors or their ligands, are key players in epilepsy occurrence and progression.21–23 A study by Tang et al found that PD-1 levels in cerebrospinal fluid (CSF) and serum were more pronounced in subjects with intractable status epilepticus, which can serve as a potential clinical diagnostic biomarker for intractable epilepsy.21 Gnatek et al work firstly revealed that acetylcholine (ACh) acts directly as a modulator of the brain to suppresses brain innate immune response, and that upregulation of acetylcholinesterase (AChE) following status epilepticus (SE) is related to enhanced immune response, facilitating the epileptogenic process.22
Gales et al observed that there was a mixture of both B (CD20 +) and T (CD3+) lymphocytes distributed around the blood vessels and dispersed in the brain parenchyma in hippocampal sclerosis-related temporal lobe epilepsy.23 Interestingly, CD4 positive T cells were more dominant than CD8 positive cells. The phenomenon exerts neurotoxicity and cause neuroglial injury. These studies support the involvement of immune and inflammatory processes in epilepsy. However, the underlying molecular mechanisms remain not been systematically understood, especially with regard to the immunogenomic and immune infiltration effects of epilepsy. A meta-analysis of microarray data sets from animal studies implicating immune system-related genes in all phases of epileptogenesis.24 Hence, it is reasonable to characterize immune-related genes and immune infiltration characteristics in epilepsy to aid the exploration of epileptogenesis.
To our knowledge, this is the first comprehensive study to characterize the immune landscape based on an integrated multi-transcriptome expression profile in epilepsy, leading to the discovery of novel biomarkers, thus uncovering underlying pathogenesis and prospective therapeutic targets. Before diving into immunology etiology, we explore the differential immune score in normal and epilepsy tissues.
Compared to normal subjects, immune scores and stromal scores were all higher in epilepsy samples in different datasets. It was a hint that immune elements were involved in the occurrence of epilepsy. On the basis of DERs of multiple transcriptome data and IRGs set, we acquired 51 DEIRGs. GO term and KEGG enrichment analysis indicate that T cell and chemokine production are the most likely immune components involved in pathological processes and immunoregulatory mechanisms of epilepsy. To select out convincing key genes, RF, represent machine learning algorithm, and PPI network (cytoHubba), signify biological function, were incorporated to identify four hub genes (CSF1R, IL6R, TLR2, and TNFRSF1A). Importantly, Results of qRT-PCR validated that expression level of CSF1R, IL6R, TLR2, and TNFRSF1A were significantly up-regulated in epilepsy compared with control sample in clinical specimens, which in line with the results of bioinformatics analyses derived from the GEO datasets. Interestingly, four hub genes combined yielded a superior diagnostic capacity and were closely related to epileptic frequency. It implied that hub genes may be involved in the initiation, maintenance, and progression of epilepsy.
4 IRGs (CSF1R, IL6R, TLR2, and TNFRSF1A), are belongs to cytokines receptor, which are mediators of the immune system and via binding to corresponding ligands coordinate activities of the acquired and innate immunity. CSF1R, is a class III receptor tyrosine kinase family, which plays a key role in signal transduction through binding ligands CSF-1 and interleukin (IL)-34 to modulate monocyte/macrophage lineage cells.25 CSF-1/CSF-1R axis overactivation may result in aberrant expression of proinflammatory cytokines including interleukin-6 (IL-6) and tumor necrosis factor-α (TNF-α), among others, which can promote the pathogenesis of inflammatory diseases. There is recent evidence that the elimination of microglia by CSF-1R inhibition could curtail plaque formation in an in vivo model of Alzheimer’s disease.26 IL6R, which is an inflammatory cytokine receptor, is only expressed on specific cells including some leukocytes, some epithelial cells and hepatocytes, which are therefore IL-6 target cells.27 The complex of IL-6R and IL-6 bind to a second receptor subunit, gp130, which thereupon dimerizes resulting in the activation of SHP2/Ras/MAPK, YAP, JAK/STAT signaling pathways. The process has been named IL-6 trans-signaling, whose disruption plays a prominent role in inflammation diseases. Currently, IL-6R inhibition, tocilizumab, is approved for the treatment of juvenile idiopathic arthritis, giant cell arteritis and rheumatoid arthritis. Moreover, recent research reveals that an open-label, randomised, multicentre, phase two trial, tocilizumab significantly reduced the risk of neuromyelitis optica spectrum disorder (NMOSD) relapse, and is a safe and effective treatment for NMOSD.28 TLR2, as a member of the Toll-like receptors (TLRs) family, binds the cellular components of the host, thus participated in innate immunity and serves as a bridge between innate and acquired immunity.29 It transmits extracellular signals to activate transcription factors, such as AP-1 and nuclear factor-κB, which contributes to the production of proinflammatory cytokines and chemotactic cytokines, thus regulating the balance between Th1 cells and Th2 cells. Research finding that TLR 2, is activated and up-modulated by high mobility group box-1 (HMGB1), results in surgery-induced neuro-inflammation and impairment of memory and learning.30 TNFRSF1A, is a tumor necrosis factor receptor superfamily member, act as one of the primary transmembrane signal transduction receptors for tumor necrosis factor-α (TNF-α) that is a specific pro-inflammatory cytokine, and plays a critical role in cell fates, induction of cytokines and chemokines.31 Its binding with TNF-α, named TNF-α signaling pathway, can activate MAPK/NF-κB signaling pathways and involved in inflammatory diseases. It has been reported that stimulation of cerebellar fastigial nucleus can down-modulate the expression of TNFRSF1A in the rat model, thus slightly reducing neuronal apoptosis.32
Immune infiltration analysis via CIBERSORTx found immune cells that are more abundant in epilepsy, such as activated CD4 memory T cells, resting CD4 memory T cells, and T cells gamma delta. Recently, Ouédraogo et al observed that compared to healthy controls, CD4 T-cell populations were more abundant in the peripheral blood of focal onset epilepsy subjects, in line with our results.33 Author data support that epilepsy is linked to an expansion of the CD4 T cell subset, which is skewed toward a proinflammatory Th17/Th1 phenotype. Additionally, Xu et al for the first time demonstrate that proinflammatory IL-17-producing T cells gamma delta are concentrated in the epileptogenic zone, and their populations positively related to seizure severity,34 which are corroborated by animal experiments in the brains of a mouse model of SE induced by the kainic acid displaying similar activation of adaptive and innate immune responses, in accordance with our analysis data. Remarkably, ssGSEA found that Th1 signatures was more abundant in normal subjects in different datasets; yet, Th2 signatures was signatures was more abundant in epilepsy subjects. Hence, a hypothesis is deduced that the imbalance of Th1/Th2 signatures is associated with epileptogenesis. Encouragingly, hub genes were significantly correlated with infiltration score of Th1/Th2 signatures, which indirectly support that Th1/Th2 imbalance plays a crucial role in the pathogenesis of epilepsy. Under normal circumstances, there is cross-regulation between Th1 and Th2 cells by cytokines, that is, Th1 cells via secreting IL2 or FIN inhibit Th2 cells, while Th2 cells through secreting IL-4, IL-6, or IL-10 inhibit Th1, which plays a role in maintaining the normal immune function. Whereas, when the function is abnormal, Th1/Th2 balance often appears a bias toward one side, which is called “Th1/Th2 shift”, that may disrupt the dynamic balance of human cytokines network and contribute to the occurrence and progression of diseases, such as rheumatoid arthritis, tumors, asthma and recurrent respiratory infections.35 In our current immunology research of epilepsy, Th1/Th2 balance may shift from Th1 to Th2, namely Th1-type signatures relatively decreased while Th2-type signatures relatively increased, which hints that humoral immune maybe plays a dominant role in the etiology of epilepsy. To sum up, Immune cell infiltration, T cell subsets, in particular, may be compactly linked to the pathogenesis of epilepsy and need further experiments to prove those phenomena. Additionally, regulators of T cell subsets,36 or microglia/macrophages with biologic agents after epilepsy has become a focus of attention in recent years, and the discovery of new drugs related to T cell subsets or microglia/macrophages polarization may make the realization of immunotherapy for epilepsy possible.
GSVA results showed that CCR, apoptosis, chemokine signaling pathway, JAK−STAT signaling pathway, Toll−Like receptor signaling pathway, and so on were involved in the epileptic subjects, in accord with the results of GO term and KEGG enrichment analysis. They are common and classic signaling pathways that modulate immune responses and inflammatory mediators, and their overactivation leads to the onset and development of disease. ssGSEA results demonstrate CCR was significantly involved in epilepsy and enrichment score of it was significantly correlated with hub genes in multi-transcriptome data, which indirectly confirm that Th1/Th2 shift is likely to contribute to the occurrence of epilepsy. The research found that chemokines (CCL3 and CCL4) were highly up-modulated in chronic temporal lobe epilepsy (TLE), which was observed in the early stages of epileptogenesis in animal models. The underlying mechanisms may be directly or directly affect neuronal excitability to prolonged seizures and enhance immune response, facilitating the epileptogenic process.37 There is growing evidence that inflammatory processes in the brain may be critical for both the development of epileptic foci and the continuation of epileptic relapse.38,39 Ion channels and Neurotransmitter receptors are regulated by immune mediators,40 and during seizures, autonomic discharges alter the distribution of circulatory peripheral immune cell populations.41 Seizures destabilize the (BBB) (blood–brain barrier) and activate microglia, which in turn promote elevated levels of pro-inflammatory cytokines, IL-1 and TNF in the central nervous system.9,42 In addition, changes in peripheral blood luminal TNF, IL-6, and IL-1 levels have been reported in epilepsy and are related to recent seizure activity.9 Taken together, CCR is probably one of the main immune signaling pathways that contributes to the onset of epilepsy and need further experiments to explore the specific mechanism.
In spite of the remarkable sense, it is inevitable that limitations also existed in our research. First, study patients varied widely from GEO data, including patients with tuberous sclerosis complex (TSC), patients with primary brain tumors, patients with refractory epilepsy. However, our results (hub genes, immune infiltration cells and pivotal molecular pathways) take the intersection of different GEO databases. Additional high-quality studies with single type of epilepsy need to validate our results. Second, though we integrated different epileptic microarray datasets, the sample size remained limited, in part because not all epileptic patients underwent brain surgery or peripheral blood whole blood sequencing. Large sample size can improve the statistical power to detect robust immune-related genes and immune infiltration characteristics in epileptogenesis. Third, patients with epilepsy included in our analysis were not guaranteed to be free of other diseases. Whereas, the influence of other diseases on our results cannot be fully resolved because the original data set did not offer complete details of other comorbidities/diseases. Fourth, Based on bulk RNA-Seq data, CIBERSORTx deconvolution algorithm and ssGSEA with metagenes may not accurately identify immune cell subpopulations although different methods and different data sets validate each other. It is necessary to use single-cell RNA-Seq methods or fluorescence-activated cell sorting to verify our results.
Fifth, no further in vivo experiments to validate these results (hub genes, immune infiltration cells and pivotal molecular pathways). Loss of function and overexpression studies in vitro, as well as in animal models, will help to further identify the exact role of hub genes in the regulation of the inflammatory response and related pathogenic signaling in epilepsy.
Conclusion
4 IRGs (CSF1R, IL6R, TLR2, and TNFRSF1A) were closely associated with the pathogenesis of epilepsy, which maybe by afflicting Th1/Th2 signatures balance and CCR pathway involved in the onset of epilepsy. Our data may provide a new basis for understanding the role of the immune landscape in the treatment of epilepsy.
Abbreviation
GEO, Gene Expression Omnibus; DEIRGs, differentially expressed immune-related genes; RF, random forest; ssGSEA, single-sample gene set enrichment analysis; GSVA, Gene set variation analysis; CMap, Connectivity Map database; CCR, cytokine cytokine receptor interaction; AEDs, antiepileptic drugs; DRE, drug-resistant epilepsy; ILAE, the International League Against Epilepsy; IRGs, immune-related genes; DEGs, differentially expressed genes; GO, Gene ontology; MF, molecular function, BP, biological process; CC, cellular component; KEGG, Kyoto Encyclopedia of Genes and Genomes; PPI, protein–protein interaction; CSF, cerebrospinal fluid; ACh, acetylcholine; AChE, acetylcholinesterase; SE, status epilepticus; TNF-α, tumor necrosis factor-α; IL-6, interleukin-6; NMOSD, neuromyelitis optica spectrum disorder; TLRs, Toll-like receptors; HMGB1, high mobility group box-1.
Highlights
1. Accumulating evidence shows that the immune system plays a key role in epileptogenesis. Nevertheless, the underlying molecular mechanisms were still not been systematically understood, particularly regarding the effects of immunogenomic and immune cell in epilepsy.
2. To our knowledge, this is the first comprehensive study to characterize the immune landscape based on an integrated multi-transcriptome expression profile in epilepsy, leading to the discovery of novel biomarkers, thus uncovering underlying pathogenesis and prospective therapeutic targets.
3. 4 IRGs (CSF1R, IL6R, TLR2, and TNFRSF1A) were closely correlated pathogenesis and progression of epilepsy.
4. Results of qRT-PCR validated that higher expression level of CSF1R, IL6R, TLR2, and TNFRSF1A in epilepsy compared to control sample, which in line with the results of bioinformatics analyses derived from the GEO datasets.
5. Immune cell infiltration, T cell subsets in particular, may be compactly linked to the pathogenesis of epilepsy.
6. Cytokine cytokine receptor interaction (CCR) is probably one of the main immune signaling pathways that contributes to the onset of epilepsy.
Data Sharing Statement
The data that support the findings of this study are provided in supplementary materials and are also made available in the GEO (https://www.ncbi.nlm.nih.gov/geo/).
Ethics Approval and Consent to Participate
All the data was obtained from GEO, and the informed consent had been attained from the patients before our study. The studies involving human tissues samples were reviewed and approved by the Research Ethics Committee of Shunde Hospital, Southern Medical University (The First people’s hospital of Shunde), and complied with the Declaration of Helsinki.
Author Contributions
All authors made a significant contribution to the work reported, whether that is in the conception, study design, execution, acquisition of data, analysis and interpretation, or in all these areas; took part in drafting, revising or critically reviewing the article; gave final approval of the version to be published; have agreed on the journal to which the article has been submitted; and agree to be accountable for all aspects of the work.
Funding
Scientific Research Start Plan of Shunde Hospital, Southern Medical University (grant no. SRSP2021010).
Disclosure
The authors declare that they have no competing interests in this work.
References
1. Thijs RD, Surges R, O’Brien TJ, Sander JW. Epilepsy in adults. Lancet. 2019;393(10172):689–701. doi:10.1016/S0140-6736(18)32596-0
2. Legnani M, Bertinat A, Decima R, et al. Applicability and contribution of the new ILAE 2017 classification of epileptic seizures and epilepsies. Epileptic Disord. 2019;21(6):549–554. doi:10.1684/epd.2019.1108
3. Henshall DC. MicroRNA and epilepsy: profiling, functions and potential clinical applications. Curr Opin Neurol. 2014;27(2):199–205. doi:10.1097/WCO.0000000000000079
4. World Health Organization. Epilepsy Factsheet. WHO Webpage; 2020. Available from: https://www.who.int/news-room/fact-sheets/detail/epilepsy.
5. Rogawski MA, Löscher W, Rho JM. Mechanisms of action of antiseizure drugs and the ketogenic diet. Cold Spring Harb Perspect Med. 2016;6(5):a022780. doi:10.1101/cshperspect.a022780
6. Scheffer IE, Berkovic S, Capovilla G, et al. ILAE classification of the epilepsies: position paper of the ILAE commission for classification and terminology. Epilepsia. 2017;58(4):512–521. doi:10.1111/epi.13709
7. Vezzani A, French J, Bartfai T, Baram TZ. The role of inflammation in epilepsy. Nat Rev Neurol. 2011;7(1):31–40. doi:10.1038/nrneurol.2010.178
8. Rijkers K, Majoie HJ, Hoogland G, Kenis G, De Baets M, Vles JS. The role of interleukin-1 in seizures and epilepsy: a critical review. Exp Neurol. 2009;216(2):258–271. doi:10.1016/j.expneurol.2008.12.014
9. Bauer J, Becker AJ, Elyaman W, et al. Innate and adaptive immunity in human epilepsies. Epilepsia. 2017;58(Suppl 3):57–68. doi:10.1111/epi.13784
10. Li Z, Cui Y, Feng J, Guo Y. Identifying the pattern of immune related cells and genes in the peripheral blood of ischemic stroke. J Transl Med. 2020;18(1):296. doi:10.1186/s12967-020-02463-0
11. Zhao X, Zhang L, Wang J, et al. Identification of key biomarkers and immune infiltration in systemic lupus erythematosus by integrated bioinformatics analysis. J Transl Med. 2021;19(1):35. doi:10.1186/s12967-020-02698-x
12. Boer K, Crino PB, Gorter JA, et al. Gene expression analysis of tuberous sclerosis complex cortical tubers reveals increased expression of adhesion and inflammatory factors. Brain Pathol. 2010;20(4):704–719. doi:10.1111/j.1750-3639.2009.00341.x
13. Niesen CE, Xu J, Fan X, et al. Transcriptomic profiling of human peritumoral neocortex tissues revealed genes possibly involved in tumor-induced epilepsy. PLoS One. 2013;8(2):e56077. doi:10.1371/journal.pone.0056077
14. Rawat C, Kushwaha S, Srivastava AK, Kukreti R. Peripheral blood gene expression signatures associated with epilepsy and its etiologic classification. Genomics. 2020;112(1):218–224. doi:10.1016/j.ygeno.2019.01.017
15. Thrupp N, Sala Frigerio C, Wolfs L, et al. Single-nucleus RNA-seq is not suitable for detection of microglial activation genes in humans. Cell Rep. 2020;32(13):108189. doi:10.1016/j.celrep.2020.108189
16. Franceschini A, Szklarczyk D, Frankild S, et al. STRING v9.1: protein-protein interaction networks, with increased coverage and integration. Nucleic Acids Res. 2013;41(Database issue):D808–15. doi:10.1093/nar/gks1094
17. Bader GD, Hogue CW. An automated method for finding molecular complexes in large protein interaction networks. BMC Bioinform. 2003;4(1):2. doi:10.1186/1471-2105-4-2
18. Newman AM, Liu CL, Green MR, et al. Robust enumeration of cell subsets from tissue expression profiles. Nat Methods. 2015;12(5):453–457. doi:10.1038/nmeth.3337
19. Bindea G, Mlecnik B, Tosolini M, et al. Spatiotemporal dynamics of intratumoral immune cells reveal the immune landscape in human cancer. Immunity. 2013;39(4):782–795.
20. Hänzelmann S, Castelo R, Guinney J. GSVA: gene set variation analysis for microarray and RNA-seq data. BMC Bioinform. 2013;14(1):7. doi:10.1186/1471-2105-14-7
21. Tang H, Wang X. PD-1 is an immune-inflammatory potential biomarker in cerebrospinal fluid and serum of intractable epilepsy. Biomed Res Int. 2021;2021:7973123. doi:10.1155/2021/7973123
22. Gnatek Y, Zimmerman G, Goll Y, Najami N, Soreq H, Friedman A. Acetylcholinesterase loosens the brain’s cholinergic anti-inflammatory response and promotes epileptogenesis. Front Mol Neurosci. 2012;5:66. doi:10.3389/fnmol.2012.00066
23. Gales JM, Prayson RA. Chronic inflammation in refractory hippocampal sclerosis-related temporal lobe epilepsy. Ann Diagn Pathol. 2017;30:12–16. doi:10.1016/j.anndiagpath.2017.05.009
24. Lukasiuk K, Dabrowski M, Adach A, Pitkänen A. Epileptogenesis-related genes revisited. Prog Brain Res. 2006;158:223–241.
25. Xie Z, Wu B, Liu Y, et al. Novel class of colony-stimulating factor 1 receptor kinase inhibitors based on an o-aminopyridyl alkynyl scaffold as potential treatment for inflammatory disorders. J Med Chem. 2020;63(3):1397–1414. doi:10.1021/acs.jmedchem.9b01912
26. Spangenberg E, Severson PL, Hohsfield LA, et al. Sustained microglial depletion with CSF1R inhibitor impairs parenchymal plaque development in an Alzheimer’s disease model. Nat Commun. 2019;10(1):3758. doi:10.1038/s41467-019-11674-z
27. Rose-John S. Blocking only the bad side of IL-6 in inflammation and cancer. Cytokine. 2021;148:155690. doi:10.1016/j.cyto.2021.155690
28. Zhang C, Zhang M, Qiu W, et al.; TANGO Study Investigators. Safety and efficacy of tocilizumab versus azathioprine in highly relapsing neuromyelitis optica spectrum disorder (TANGO): an open-label, multicentre, randomised, Phase 2 trial. Lancet Neurol. 2020;19(5):391–401. doi:10.1016/S1474-4422(20)30070-3
29. Marks KE, Cho K, Stickling C, Reynolds JM. Toll-like receptor 2 in autoimmune inflammation. Immune Netw. 2021;21(3):e18. doi:10.4110/in.2021.21.e18
30. Lin F, Shan W, Zheng Y, Pan L, Zuo Z. Toll-like receptor 2 activation and up-regulation by high mobility group box-1 contribute to post-operative neuroinflammation and cognitive dysfunction in mice. J Neurochem. 2021;158(2):328–341. doi:10.1111/jnc.15368
31. Jing X, Luan Z, Liu B. miR-558 reduces the damage of HBE cells exposed to cigarette smoke extract by targeting TNFRSF1A and inactivating TAK1/MAPK/NF-κB pathway. Immunol Invest. 2021;1–15. doi:10.1080/08820139.2021.1874977
32. Wang M, Guo J, Dong LN, Wang JP. Cerebellar fastigial nucleus stimulation in a chronic unpredictable mild stress rat model reduces post-stroke depression by suppressing brain inflammation via the microRNA-29c/TNFRSF1A signaling pathway. Med Sci Monit. 2019;25:5594–5605. doi:10.12659/MSM.911835
33. Ouédraogo O, Rébillard RM, Jamann H, et al. Increased frequency of proinflammatory CD4 T cells and pathological levels of serum neurofilament light chain in adult drug-resistant epilepsy. Epilepsia. 2021;62(1):176–189. doi:10.1111/epi.16742
34. Xu D, Robinson AP, Ishii T, et al. Peripherally derived T regulatory and γδ T cells have opposing roles in the pathogenesis of intractable pediatric epilepsy. J Exp Med. 2018;215(4):1169–1186. doi:10.1084/jem.20171285
35. Kidd P. Th1/Th2 balance: the hypothesis, its limitations, and implications for health and disease. Altern Med Rev. 2003;8(3):223–246.
36. Lan TJ, Luo X, Mo MY, et al. Hydrolyzed seawater pearl tablet modulates the immunity via attenuating Th1/Th2 imbalance in an immunosuppressed mouse model. J Tradit Chin Med. 2021;41(3):397–405. doi:10.19852/j.cnki.jtcm.20210319.001
37. van Gassen KL, de Wit M, Koerkamp MJ, et al. Possible role of the innate immunity in temporal lobe epilepsy. Epilepsia. 2008;49(6):1055–1065. doi:10.1111/j.1528-1167.2007.01470.x
38. Aronica E, Bauer S, Bozzi Y, et al. Neuroinflammatory targets and treatments for epilepsy validated in experimental models. Epilepsia. 2017;58(Suppl 3):27–38. doi:10.1111/epi.13783
39. French JA, Koepp M, Naegelin Y, et al. Clinical studies and anti-inflammatory mechanisms of treatments. Epilepsia. 2017;58(Suppl 3):69–82. doi:10.1111/epi.13779
40. Wilcox KS, Vezzani A. Does brain inflammation mediate pathological outcomes in epilepsy? Adv Exp Med Biol. 2014;813:169–183.
41. Bauer S, Köller M, Cepok S, et al. NK and CD4+ T cell changes in blood after seizures in temporal lobe epilepsy. Exp Neurol. 2008;211(2):370–377. doi:10.1016/j.expneurol.2008.01.017
42. Patel DC, Tewari BP, Chaunsali L, Sontheimer H. Neuron-glia interactions in the pathophysiology of epilepsy. Nat Rev Neurosci. 2019;20(5):282–297. doi:10.1038/s41583-019-0126-4
 © 2022 The Author(s). This work is published and licensed by Dove Medical Press Limited. The full terms of this license are available at https://www.dovepress.com/terms.php and incorporate the Creative Commons Attribution - Non Commercial (unported, v3.0) License.
By accessing the work you hereby accept the Terms. Non-commercial uses of the work are permitted without any further permission from Dove Medical Press Limited, provided the work is properly attributed. For permission for commercial use of this work, please see paragraphs 4.2 and 5 of our Terms.
© 2022 The Author(s). This work is published and licensed by Dove Medical Press Limited. The full terms of this license are available at https://www.dovepress.com/terms.php and incorporate the Creative Commons Attribution - Non Commercial (unported, v3.0) License.
By accessing the work you hereby accept the Terms. Non-commercial uses of the work are permitted without any further permission from Dove Medical Press Limited, provided the work is properly attributed. For permission for commercial use of this work, please see paragraphs 4.2 and 5 of our Terms.