")
Back to Journals » Cancer Management and Research » Volume 14
Characterization of an Autophagy-Immune Related Genes Score Signature and Prognostic Model and its Correlation with Immune Response for Bladder Cancer
Authors Yu J , Mao W, Sun S, Hu Q, Wang C, Xu Z, Liu R, Chen S, Xu B, Chen M
Received 3 November 2021
Accepted for publication 22 December 2021
Published 5 January 2022 Volume 2022:14 Pages 67—88
DOI https://doi.org/10.2147/CMAR.S346240
Checked for plagiarism Yes
Review by Single anonymous peer review
Peer reviewer comments 3
Editor who approved publication: Dr Xueqiong Zhu
JunJie Yu1 *, WeiPu Mao1 *, Si Sun,1 Qiang Hu,1 Can Wang,1 ZhiPeng Xu,1 RuiJi Liu,1 SaiSai Chen,1 Bin Xu,2,3 Ming Chen2,4
1Medical College, Southeast University, Nanjing, 210009, People’s Republic of China; 2Department of Urology, Affiliated Zhongda Hospital of Southeast University, Nanjing, 210009, People’s Republic of China; 3Institute of Urology, Southeastern University, Nanjing, People’s Republic of China; 4Department of Urology, Affiliated Lishui People’s Hospital of Southeast University, Nanjing, People’s Republic of China
*These authors contributed equally to this work
Correspondence: Bin Xu; Ming Chen
Department of Urology, Affiliated Zhongda Hospital of Southeast University, No. 87 Dingjiaqiao, Hunan Road, Gulou District, Nanjing, 210009, Jiangsu, People’s Republic of China
Tel/Fax +86 13913009977
Email [email protected]; [email protected]
Purpose: The study aimed to identify an autophagy-related molecular subtype and characterize a novel defined autophagy-immune related genes score (AI-score) signature and prognosis model in bladder cancer (BLCA) patients using public databases.
Methods: The transcriptome cohorts downloaded from TCGA and GEO database were carried out with genomic analysis and unsupervised methods to obtain autophagy-related molecular subtypes. The single-sample gene-set enrichment analysis (ssGSEA) was utilized to perform immune subtype clustering. We defined a novel autophagy subtype and evaluated the role in TME cell infiltration. Then, the principal-component analysis (PCA) was applied to construct an AI-score signature. Subsequently, two immunotherapeutic cohorts were used to evaluate the predictive value in immunotherapeutic benefits and immune response. Finally, univariate, Lasso and multivariate Cox regression algorithm were used to construct and evaluate an autophagy-immune-related genes prognosis model. Also, qRT-PCR and IHC was applied to validate the expression of the 6 genes in the model.
Results: Three distinct autophagy clusters and immune-related clusters were identified, and a novel autophagy-related molecular subtypes were defined. Furthermore, the roles in TME cell infiltration and clinical traits for the autophagy subtypes were characterized. Meanwhile, we constructed an AI-score signature and demonstrated it could predict genetic mutation, clinicopathological traits, prognosis, and TME stromal activity. We found that it could accurately predict the clinicopathological characteristics and immune response of individual BLCA patients and provide guidance for selecting immunotherapy. Ultimately, we constructed and verified an autophagy-immune-related prognostic model of BLCA patients and established a prognostic nomogram with a good prediction accuracy.
Conclusion: We constructed AI-score signatures and prognosis risk model to characterize their role in clinical features and TME immune cell infiltration. It revealed that the AI-score signature and prognosis model could be a valid predictive tool, which could accurately predict the prognosis of BLCA patients and contribute to choosing effective personalized immunotherapy strategies.
Keywords: bladder cancer, The Cancer Genome Atlas, Gene Expression Omnibus, tumor microenvironment, immunotherapy, mutation burden
Introduction
Urothelial bladder cancer (BLCA) was the ninth most common malignant tumor worldwide,1,2 with a large number of new cases and deaths among men,3 most of which would eventually progress to muscle-invasive bladder cancer (MIBC).4 Immunotherapy has become one of the essential treatment options for advanced BLCA.5 Despite systematic treatment, including radical surgery, radiotherapy, chemotherapy, and immunotherapy, the prognosis of MIBC remained unsatisfactory.6,7 It has been reported that molecular pathology classified MIBC into distinct subgroups, guiding the selection of ACT, targeted therapy,8,9 or immune blockade therapy.10,11 However, the strategies to predict bladder cancer prognosis and aid clinical decision-making were lacking and unsatisfactory.12,13 Therefore, it was well worth exploring new prognostic and therapeutic targets for patients with BLCA.
Immunotherapy activated the body’s natural defense system, which identified and removed invading bacteria, viruses, and tumor cells, and has become an effective treatment for many types of tumors.14 The tumor microenvironment (TME) was an essential cornerstone of tumor survival and progression.15,16 Intensive studies of the TME have revealed the critical role of tumor-infiltrating immune cells in tumorigenesis, recurrence, metastasis, and clinical response to immunotherapy.17,18 Immunotherapy, especially immune checkpoint blockade represented by anti-PD-L1, has shown favorable efficacy in some patients with BLCA.19 Meng et al20 developed a novel immunophenotype that could provide insight into immunotherapy for patients with BLCA. Kamoun et al21 used a consensus hierarchical clustering algorithm to classify BLCA into distinct molecular subtypes, including luminal-papillary, luminal-infiltrated, luminal, basal/squamous, and neuronal subtypes that could stratify response to different immune treatments. However, most molecular classifiers focused inadequately on the TME.
Autophagy was a fundamental cellular metabolic process in all eukaryotes, which had a crucial role in tumorigenesis, maintenance immune, and tumor progression.21,22 For example, Huang et al23 reported miR-93 regulated tumorigenicity and therapy response of glioblastoma via autophagy. Lin et al24 reported that synergistic effects of TME and autophagy increased the sensitivity of radiation to BLCA. Recently, much literature reported the role of autophagy classification in different tumors. For instance, Cao et al25 constructed an autophagy-associated signature for BLCA that exhibited prognostic value and contributed to facilitating personalized selection of immunotherapy and chemotherapy. Zhu et al26 constructed an autophagy-related molecular subtype for colon cancer that could link to TME immune cell infiltration heterogeneity to guide personalized immunotherapy. Furthermore, Gerada et al27 explained the correlation between autophagy and the innate immune response on tumorigenesis and clarified the interaction between the pathways in TME.
The Cancer Genome Atlas (TCGA) was a public database that included 33 different types of cancer.28 It provided genome sequencing and comprehensive multidimensional analysis aimed at developing an “atlas” of cancer genomic profiles, including genome sequence, expression, methylation, copy number variation, and clinicopathological data.29 The Gene Expression Omnibus was an international public repository of high-throughput microarrays and next-generation sequence functional genomic datasets.30 It could be used to analyze gene expression, clinical, methylation, chromatin structure and genome-protein interactions, including raw data, processed data and descriptive metadata.
Given the previous findings, we learned that autophagy and immunity played an essential role in the development, progression, and metastasis of BLCA. The TCGA and GEO database for BLCA has also been studied in some literature. However, the clinical value of autophagy-related genes (ARGs) clusters combined with the immune-related molecular clusters in BLCA were still uncommon. In this study, the patients with BLCA were divided into three immune clusters according to the ssGSEA method. A novel autophagy subtype was constructed and defined based on 43 prognosis-associated ARGs. Also, we explored the prognostic value of autophagy-related subtypes and investigated the correlation between autophagy and the tumor immune microenvironment. Then, we developed an autophagy-immune score (AI-score) signature to evaluate the autophagy-related subtypes in individual patients with BLCA comprehensively. Besides, we characterized the predictive role of the AI-score signature in predicting immunotherapy benefit and immune response in patients with BLCA. Furthermore, we constructed an autophagy-immune related prognostic risk model and a nomogram to predict OS precisely.
Methods
Sample Collection and Preparation for Patients with BLCA
As the flow chart of this work displayed in Figure 1, we screened the available public transcriptome data for BLCA from The Cancer Genome Atlas (TCGA) database (https://portal.gdc.cancer.gov/) and Gene Expression Omnibus (GEO) database (https://www.ncbi.nlm.nih.gov/geo/) based on the inclusion criteria as follows: (1) survival time>30 days (2) complete clinical information including age, sex, AJCC TNM stage, Grade (3) Complete expression information of transcriptome data. Those samples with incomplete survival and clinical information, including no survival information and survival time, and unknown Grade and stages, were excluded. Ultimately, TCGA-BLCA and GSE13507 cohorts contained a total of 557 samples were included in the study. Transcriptome profiling data (Fragments Per Kilobase Million [FPKM] value) and corresponding clinical information, as well as somatic mutation data (masked somatic mutation) of TCGA-BLCA dataset, were downloaded from the Genomic Data Commons (GDC). The FPKM values were then converted to transcripts per kilobase (TPM) values. Series matrix files of GSE13507 were downloaded from the GEO database. The two datasets were integrated as the training cohorts, and the “ComBat” algorithm was utilized to remove batch effects from non-biological technical biases using the “SVA” package. Somatic mutation data, downloaded from TCGA database and analyzed by the VarScan2 algorithm, were applied to calculate the tumor mutation burden (TMB). In addition, Copy Number Variation (CNV) data were obtained from the UCSC database (http://xena.ucsc.edu/) and pre-processed with the Perl program. Two BLCA cohorts (GSE31864 and GSE32894) were used as testing cohorts. The whole transcriptome expression matrix files and complete clinical information were also downloaded and annotated, then integrated and eliminated the batch effects using the “SVA” package.
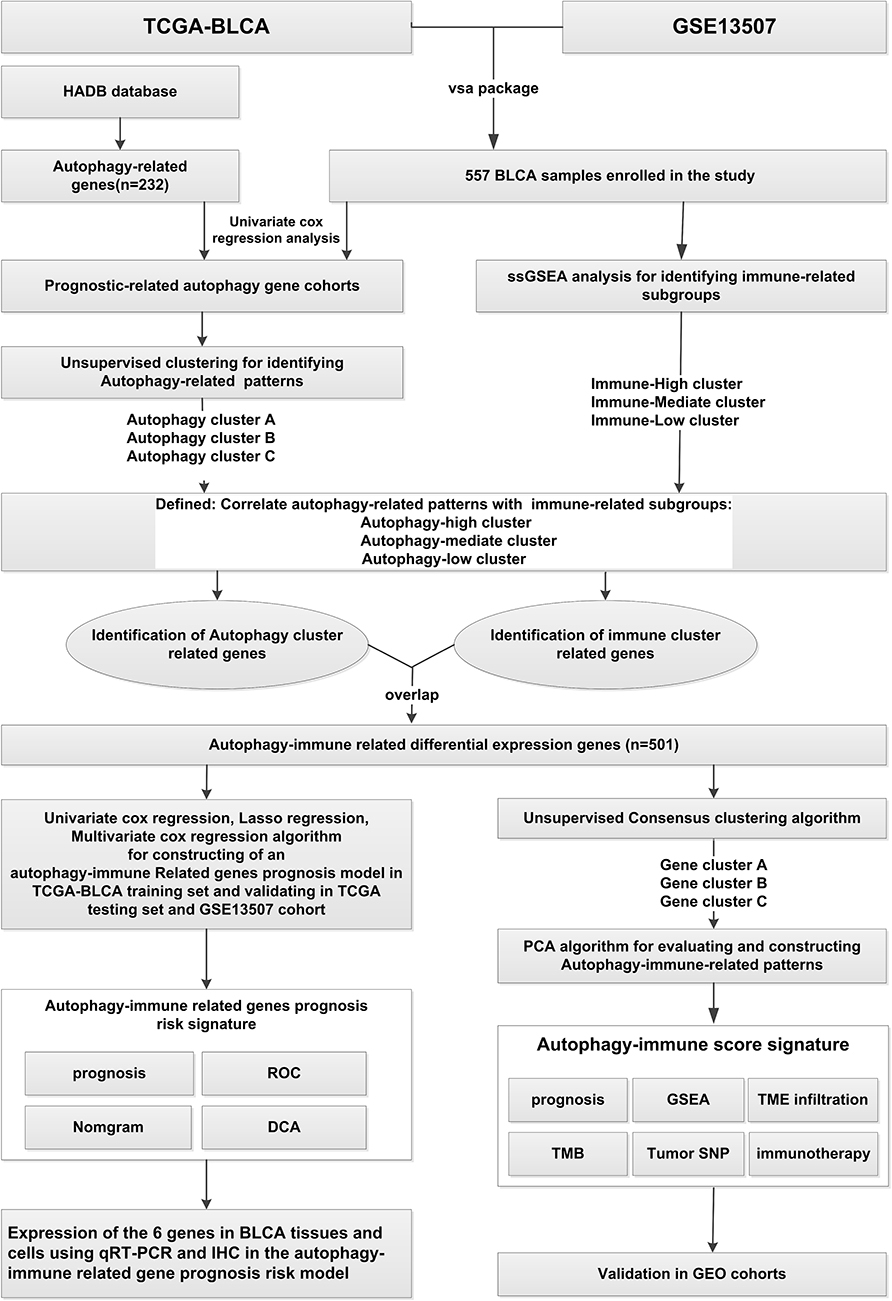 |
Figure 1 The overview of the work. |
Unsupervised Consensus Clustering for 43 Prognosis-Associated ARGs to Identify Autophagy Clusters
A total of 232 ARGs were downloaded from the Human Autophagy Database (HADb) (http://autophagy.lu/clustering/index.html).31,32 Subsequently, univariate Cox proportional hazards regression analysis was performed to identify prognosis-associated ARGs. Subsequently, unsupervised clustering algorithm was performed to identify different autophagy clusters based on these prognosis-associated ARGs using the ConsensuClusterPlus package.33 The optimal number of clusters was established based on 1000 times repetitions and consensus-Score. Moreover, the training cohort was divided into several autophagy clusters with distinct biological functions.
The Single-Sample Gene Sets Enrichment Analysis (ssGSEA) for Samples with BLCA and Hierarchical Clustering Analysis to Identify Immune Clusters
The ssGSEA algorithm, which was based on 29 immune-related cells and types,34 was employed to systematically elaborate the immunological infiltration degrees of each sample with BLCA in the training cohort, including immune cell type, immune-related functions, and pathways using “GSVA, Limma, GSEABase” package. Next, unsupervised hierarchical clustering algorithm was performed to divide the training cohorts into three clusters based on immunological infiltration degrees. In addition, based on the “sparcl” package, these three clusters were defined as immune-high infiltration subgroup, immune-mediate infiltration subgroup, and immune-low infiltration subgroup.
Gene Set Variation Analysis (GSVA) and Clinicopathological Expression Analysis for Autophagy Clusters
To explore the differences of biological functions and the expressions of clinicopathological characteristics between different autophagy clusters, the GSVA enrichment analysis, a non-parametric and unsupervised algorithm commonly used to investigate variation in pathways and biological processes, was performed using “GSVA” R packages.34 The “c2.cp.kegg.v6.2.symbols” gene set, used to run the GSVA analysis, was obtained from the MSigDB database.35 The expression of clinicopathological features in different autophagy clusters was demonstrated using the “heatmap” R package.
Defined a Novel Autophagy-Related Molecular Subtype and Evaluated Tumor Microenvironment (TME) Cell Infiltration
To synthetically evaluate autophagy characteristics in BLCA, we redefined a novel autophagy-related molecular subtype based on expression levels of the prognosis-related autophagy gene set in different clusters. Highly expressed cluster B was defined as autophagy-high subgroup; Mediate expressed cluster C was defined as autophagy-mediate subgroup; Low expressed cluster A was defined as autophagy-low subgroup.
The anti-cancer immune response was a cancer-immune cycle that utilized RNA-seq or microarray data to track, analyze and visualize the anti-cancer immune status and the proportion of tumor-infiltrating immune cells in each procedure.36 Then, the ssGSEA algorithm was applied to quantify the relative abundance of each immune-related cell and type in BLCA TME and tumor-immune cycle in distinct autophagy subgroups. The ESTIMATE (estimation of stromal and Immune cells in malignant Tumor tissues using Expression data) algorithm was employed to calculate immune scores and tumor purity for each sample in distinct autophagy subgroups.37
Identification of Differentially Expressed Genes (DEGs) Between Immune and Autophagy Subgroups, and Function Annotation
To identify differentially expressed autophagy-immune related genes, we divided samples in training cohorts into immune clusters and autophagy clusters based on different algorithms. Then, we utilized the Bayesian algorithm of the “limma” package to screen DEGs between different immune clusters and autophagy clusters. Finally, we overlapped the DEGs in these two subgroups using Venn plots as autophagy-immune related genes. The significance criterion for screening DEGs were defined as adjusted P-value < 0.001. Subsequently, the functional annotation of the autophagy-immune associated genes was performed with the “clusterProfiler” package based on the cut-off value of FDR< 0.05.
Construction and Validation of an Autophagy-Immune Gene Signature and Generation of Autophagy-Immune Score (AI-Score)
To characterize and quantify in-depth the significance and correlation with the immunology of autophagy subgroups in individual tumors, we constructed an autophagy-immune gene signature to comprehensively assess the autophagy-related subtypes in individual patients with BLCA. Firstly, we applied univariate COX regression analysis to identify prognosis-associated autophagy-immune genes. Subsequently, unsupervised clustering algorithm was performed to define the number of gene clusters based on the prognostic-related autophagy-immune genes. Ultimately, principal component analysis (PCA) was utilized to construct autophagy-immune relevant gene signature. As used in previous studies, principal components 1 and 2 were calculated for these prognostic genes employed for AI-score generation. The specific calculation method was as follows: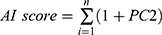 (where i was the expression of prognosis-related autophagy-immune genes). In addition, to validate the reliability and stability of the AI-score signature, we validated the prognostic value of the AI-score and its correlation with immunological characteristics of TME in the testing cohorts.
Collection of Immunotherapeutic Cohorts and Evaluation of the Predictive Value of AI-Score in Immunotherapeutic Benefits and Immune Response
To further evaluate the predictive value of AI-score in immunotherapeutic benefits and immune response, we collected two immunotherapeutic cohorts, including complete clinical information and transcriptomic data. The GSE78220 cohort that conducted a clinical trial of an anti-PD-1 antibody for metastatic melanoma was downloaded from the GEO database. After excluding those samples containing incomplete clinical information and duplicates, 27 samples were included to validate immunotherapy efficacy further. Likewise, another immunotherapy cohort of BLCA (IMvigor210) that conducted a clinical trial of an anti-PD-L1 antibody for BLCA was obtained from http://research-pub.gene.com/IMvigor210CoreBiologies/. Under the Creative Commons 3.0 License, a total of 348 BLCA patients were enrolled. The data were also normalized and transformed into TPM format. The prognostic value of AI-score and its immune response for distinct immune checkpoint genes was displayed and used to estimate the relationship between clinical benefits and immune.
Construction a of a Prognostic Model Based on Autophagy-Immune Associated Differential Genes
The prognostic model was constructed according to the previously described protocol.38 In short, the univariate Cox regression analysis was applied to identify prognosis-related autophagy-immune associated differential genes. Then, Lasso and multivariate Cox regression analysis were performed determine independent prognostic factors.
Cell Lines, Clinical Samples, RNA Extraction, Quantitative Real-Time Polymerase Chain Reaction (qRT-PCR) and Immunohistochemistry (IHC)
The human BLCA cell lines (UMUC3, T24, EJ) and human bladder cell (SV-HUC-1) were originally purchased from the cell bank of Shanghai Institute of Life Sciences, Chinese Academy of Sciences. RPMI 1640 medium and F12k medium, supplemented with 10% fetal bovine serum (FBS), penicillin (25 U/mL) and streptomycin (25 mg/mL), was applied to culture BLCA cell lines and human bladder cell at 37°C in a humidified 5% CO2 environment, respectively. Besides, a total of 22 fresh samples from patients undergoing laparoscopic radical cystectomy for BLCA were collected from 2019 to 2020 in Southeast University Zhongda hospital, including tumor tissue and matched adjacent normal kidney tissue and stored at-80◦C. The research followed the criteria stated in the Declaration of Helsinki (revised 2013) and was authorized by the Medical Ethics Committee of the Southeast University Zhongda hospital. All patients gave informed consent. Total RNA was isolated from cells and clinical tissues using Total RNA Kit I (50) (OMEGA Biotech, China) according to the manufacturer’s instructions. Then, reverse transcription was performed using the HiScript II Q RT SuperMix (R223-01) reagent kit (vazyme, Nanjing, China). CT values were measured by qRT-PCR using the SYBR Green PCR kit (Vazyme, Nanjing, China). 2-ΔΔCT calculation method was used to calculate the relative expression levels of the target genes.39 The primer sequences used in the present study are listed in Table S1. According to the previously described method,40 the clinical specimens were fixed in 4% paraformaldehyde, dehydrated in ethanol solution and embedded in paraffin. Subsequently, the sections were incubated with the primary antibody overnight at 4°C and then with biotinylated goat anti-rabbit antibody IgG for 20 minutes at room temperature. We recorded images with microscopic photography (Leica Microsystems, Germany).
Statistical Analysis
The R software (version 4.0.2) and GraphPad prism 7 were applied for statistical analysis. The Perl programming language (Version 5.30.2) was utilized for data processing. The Kaplan–Meier survival curve analysis with Log rank test was performed to analyze the survival outcomes. Univariate Cox regression analyses were used to access prognostic significance. The value p < 0.05 was considered statistically significant for all the two-sided statistical P values.
Results
Expression and Genetic Mutation Analysis of Prognostic-Associated ARGs in Patients with BLCA in TCGA Dataset
We performed PCA analysis on the training cohort consisting of TCGA-BLCA and GSE13507 datasets for showing the distribution of the integrated data. The results revealed that the two cohorts were coherent groups by reducing the dimensionality (Figure S1A). A total of 195 ARGs were extracted from the training cohorts. Subsequently, we performed Univariate Cox proportional hazards regression analysis of the expression of the ARGs in the training set. We found that the expression of 43 ARGs was significantly linked with the prognosis of BLCA patients (p< 0.05). Besides, we discovered that APOL1, CAPN10, IFNG, KLHL24, PRKCD, WDR45 were favorable factors with HR<1, whereas the other 37 genes were risk factors for HR>1 (Figure S1B).
Meanwhile, we investigated mutations in the 43 prognostic-associated ARGs in TCGA-BLCA dataset. Firstly, we performed CNV analysis. The result revealed widespread CNV alterations in 43 prognostic-associated ARGs, and most of them were concentrated in copy number amplification, while a few had extensive CNV deletions, such as ATIC, ATG9A, PRKCD, CAPN10 (Figure S1C). Chromosomal localization of CNV alteration in TCGA-BLCA dataset was also presented in Figure S1D. Furthermore, genetic mutations in ARGs were observed in 123 of 412 BLCA samples, with a frequency of 29.85%. Furthermore, the results indicated that the prognostic-associated ARGs with the highest mutation frequency was EIF4G1, followed by HSPA8, NPC1, NRG1, ARNT, EIF2AK2, HSP90AB1, PRKCO. While ATIC, BIPC5 did not show any mutation in TCGA-BLCA samples (Figure S1E).
To further determine whether gene mutations affect the expression of ARGs in BLCA, we investigated the expression levels of ARGs in normal and tumor tissues in TCGA-BLCA patients. The result revealed significant differences in the expression levels of prognosis-associated ARGs with high mutation frequency in BLCA samples compared to normal samples (Figure S1F). It suggested that abnormal expression of ARGs was associated with gene mutations, which affected the development and progression of BLCA.
Unsupervised Clustering Analysis to Identify Autophagy Clusters in Patients with BLCA
Unsupervised clustering analysis was utilized to divide BLCA patients in the training cohorts into distinct autophagy clusters based on the expression levels of 43 prognostic-associated ARGs. And eventually, three autophagy clusters were identified, including cluster-A, with 99 samples; cluster-B, with 183 samples; cluster-C, with 275 samples, respectively (Figure S2A–F). PCA analysis was performed and showed significant distinction differences between these three clusters (Figure S3A). Prognostic analysis revealed that the three autophagy clusters had remarkably different survival probabilities, with cluster-B having the worst overall survival probability, followed by cluster-C (Figure S3B). To obtain the clinical value of the autophagy clusters, we integrated the relevant clinical features, including age, gender, TNM stage. As depicted in Figure S3C, the heatmap showed associations between the expression profiles of the 43 prognostic-associated ARGs and clinicopathological features in the three autophagy clusters. Next, we implemented GSVA enrichment analysis to exploit further the biological behaviors of the three distinct autophagy clusters. As shown in Figure S3D–F, autophagy cluster-A was mainly enriched in metabolism-related pathways, including retinol metabolism, drug metabolism cytochrome p450, linoleic acid metabolism, and alpha-linolenic acid metabolism. Autophagic cluster-B exhibited enrichment pathways associated with cellular and tumor signaling pathways, such as renal cell carcinoma, prostate cancer, cytosolic DNA sensing pathway, prion disease, NOD-like receptor signaling pathway. In contrast, Autophagic cluster-C was markedly enriched in infection and endocytosis process as well as metabolism. According to the above analysis, these three autophagy clusters based on autophagy genes could distinguish different biological behaviors of BLCA samples well.
The ssGSEA Method Identified Three Immune Subtypes for Patients with BLCA
Meanwhile, to systematically assess the immunological characteristics of BLCA, the ssGSEA method and hierarchical clustering algorithm were applied for the BLCA patients in the training cohorts to assign into three immune subgroups based on 29 immune gene sets: Immunity_H(high) subgroup (n=114), Immunity_M(mediate) subgroup (n=217) and Immunity_L(Low) subgroup (n=226) (Figure S4). Subsequently, we comprehensively characterized these immune subgroups. Prognostic analysis showed no statistically significant difference between the three immunophenotypes in overall survival (Figure 2A). The ESTIMATE algorithm was used to further calculate the immune and stromal score to investigate the TME infiltration in the three immune clusters. As is shown in Figure 2B, the heatmap showed associations between the expression profiles of 29 immune-associated infiltration cells and TME characteristics in the three immune subgroups. We found that Stromal Score, Immune Score, and ESTIMATE Score were higher in the Immunity_H subgroup than in the other two subgroups, but the Tumor Purity was the opposite (Figure 2C and D). In addition, we investigated the differential expression of immune checkpoint genes (PD-L1, PD-1, CTLA4) in the three immune subgroups. The result revealed that the expression level of PD-L1, PD-1, and CTLA4 were gradually higher in immune-low, -mediate, -high subgroup (p<0.05) (Figure 2E–G). Clearly, these results demonstrated that immune clusters could well represent the biological characteristics of BLCA.
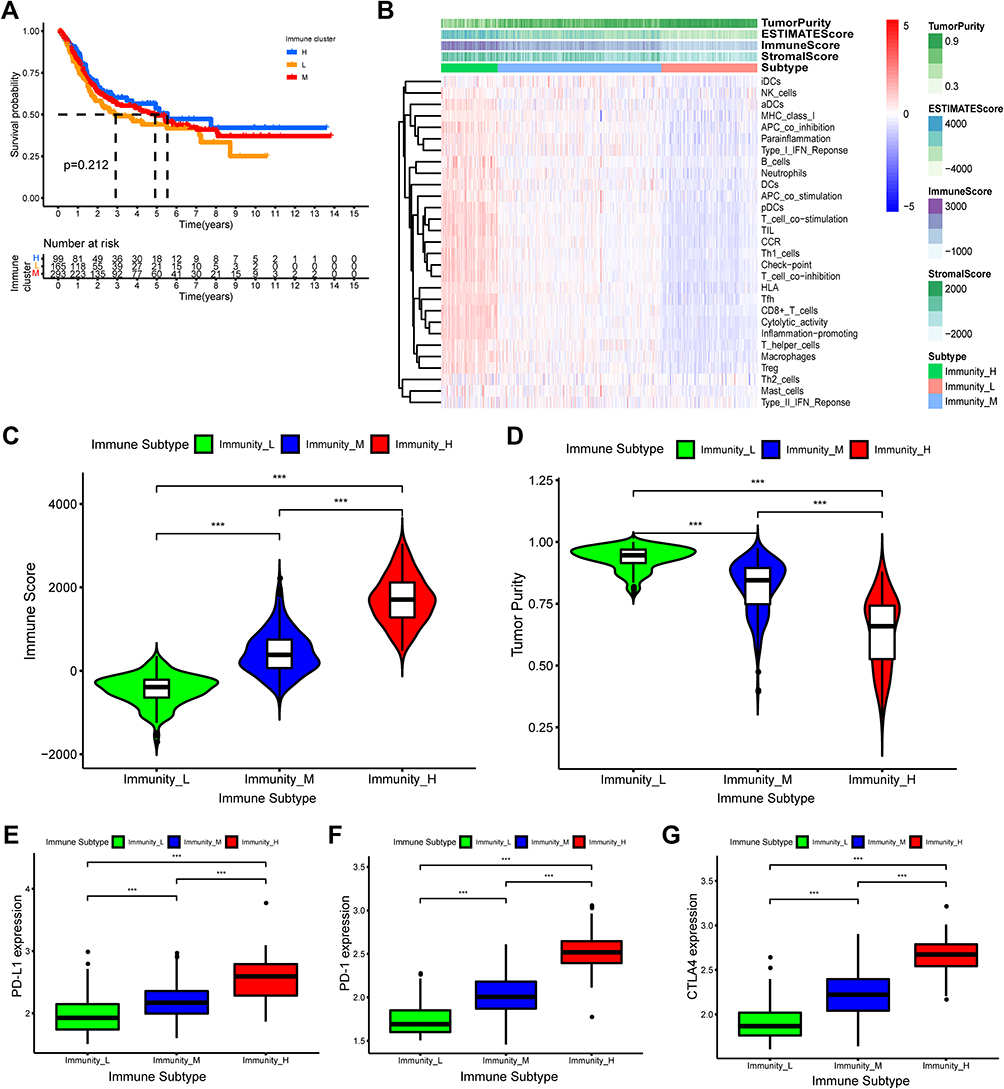 |
Figure 2 Hierarchical clustering of bladder cancer patients uncovered three immunophenotypes based on ssGSEA analysis. (A) The Kaplan–Meier survival curves of the three immunophenotypes (High, Mediate, Low) showed there were statistically insignificant differences among these three immune subtypes. (B) The heatmap showed the enrichment levels of 29 immune-associated infiltration cells in the three immune subtypes and immune infiltration characteristics obtained by ESTAMATE algorithm (including Stromal-Score, Immune-Score, Estimate-Score and Tumor-Purity). (C and D) The violin plot displayed the differences in Immune Score and Tumor Purity among the three immune clusters. (E–G) The boxplot showed the differential expression levels of immune checkpoint gene, including PD-L1 (E), PD-1 (F), CTLA4 (G) in the three immune subgroups, which showed that the expression of immune checkpoint genes in immune-High subgroup was significantly higher than the other subgroups. ***p < 0.001. |
Defined a Novel Autophagy-Related Subtype and Characterized Its Role in TME Immune Cell Infiltration and Clinical Trait
Although the consensus-clustering algorithm classified BLCA patients into three autophagy clusters based on the expression of prognosis-associated ARGs, the clusters failed to represent the level of ARGs expression specifically. To investigate the biological behaviors of autophagy clusters in-depth, we redefined the three autophagy clusters as novel subtypes with reference to the characteristics of immunophenotyping of BLCA samples. Autophagy cluster-B subgroup, with high expression levels of ARGs, was defined as autophagy-high subtype; Autophagy cluster-C subgroup, with middle expression levels of ARGs, was defined as autophagy-middle subtype; Autophagy cluster-A subgroup, with low expression of ARGs, was defined as autophagy-low subtype.
Then, we further characterized the roles in TME cell infiltration and clinical traits for the autophagy subtypes in the training cohorts. We comprehensively examined the fraction of 23 tumor immune infiltrating cells in distinct autophagy subtypes using the ssGSEA method. We found that the infiltration level of most immune infiltrating cells increased gradually in the autophagy-low, -medium and -high subtypes, such as activated B cell, activated CD4 T cell, activated CD8 T cell, Natural killer cell. Nevertheless, the abundance of some of the tumor immune infiltration cells was gradually decreasing, including CD56 dim natural killer cell, Eosinophil and Monocyte (Figure 3A). In addition, the activities of the anti-cancer immune cycle had similar results in the three autophagy subtypes. As expected, the abundance of most antitumor immune cells was gradually increasing in the autophagy-low, -medium and-high subtypes, such as release of cancer cell antigens, priming and activation, Macrophage recruiting, while the activities of Th2 cell recruiting and Treg cell recruiting were no significant difference among the three autophagy subtypes (Figure 3B). Subsequently, the ESTIMATE algorithm was performed for exploring the TME characteristics in the three autophagy subtypes. The result revealed that Immune Score was higher in the autophagy-high subgroup than in the other two autophagy subtypes, while the Tumor Purity presented the opposite result (P<0.001) (Figure 3C and D). Finally, the differential expression of immune checkpoint genes (PD-L1, PD-1, CTLA4) in the three autophagy subtypes were investigated. We observed that the expression level of PD-L1, PD-1 and CTLA4 was gradually higher in autophagy-low, -mediate, -high subtype (p<0.05), which were comparable to the expression levels in the immune subtypes (Figure 3E–G). To summarize, these results suggested that autophagy subtypes also could well represent the biological characteristics of BLCA.
 |
Figure 3 Differences in tumor microenvironment (TME) infiltration cell characteristics between autophagy clusters. (A)The boxplot showed the fraction of tumor immune infiltrating cells in the autophagy clusters. (B) The activities of anti-cancer immune response among the three autophagy clusters. (C and D) The violin plot displayed Immune Score and Tumor Purity among the three immune clusters were analyzed and visualized. (E–G) The violin plot showed the differential expressions of immune checkpoint gene, including PD-L1 (E), PD-1 (F), CTLA4 (G) in the three autophagy clusters, which showed that the expression of immune checkpoint genes in autophagy-High subgroup was significantly higher than the autophagy-Mediate and -low subgroups. *P<0.05, ***p < 0.001. Abbreviation: ns, not significant. |
Construction and Validation of an Autophagy-Immune Gene Signature and Generation of AI-Score, and Functional Enrichment Analysis
To investigate in-depth the significance and their correlation with the immunity of autophagic subtypes in individual tumors, we constructed an autophagy-immune gene signature and calculated the AI-score to assess individual BLCAs patients quantitatively. We identified 2626 autophagy subtypes-related differentially expressed genes (DEGs) and 1031 immune clusters-related DEGs. By overlapping, a total of 501 autophagy-immune genes was identified (Figure 4A). Then, using the “clusterProfile” package, Gene Ontology (GO) enrichment analysis was performed to summarize the molecular functions (MF), cellular components (CC), and biological processes (BP) associated with autophagy-immune DEGs. As shown in Figure S5A, we found that the top 5 GO terms for BP were T cell activation, regulation of cell adhesion, positive regulation of cytokine production, leukocyte cell adhesion and positive regulation of cell activation; the top 5 GO terms for CC were external side of plasma membrane, secretory granule membrane, endocytic vesicle, endocytic vesicle membrane and specific granule; The top 5 GO terms for MF were amide binding, peptide binding, cytokine receptor binding, immune receptor activity and cytokine activity. We also observed that the top 5 signaling pathways based on Kyoto Encyclopedia of Genes and Genomes (KEGG) analysis were cytokine-cytokine receptor interaction, tuberculosis, phagosome, Epstein-Barr virus infection and chemokine signaling pathway (Figure S5B). These demonstrated that autophagy-immune gene signature played an essential role in TME of BLCA.
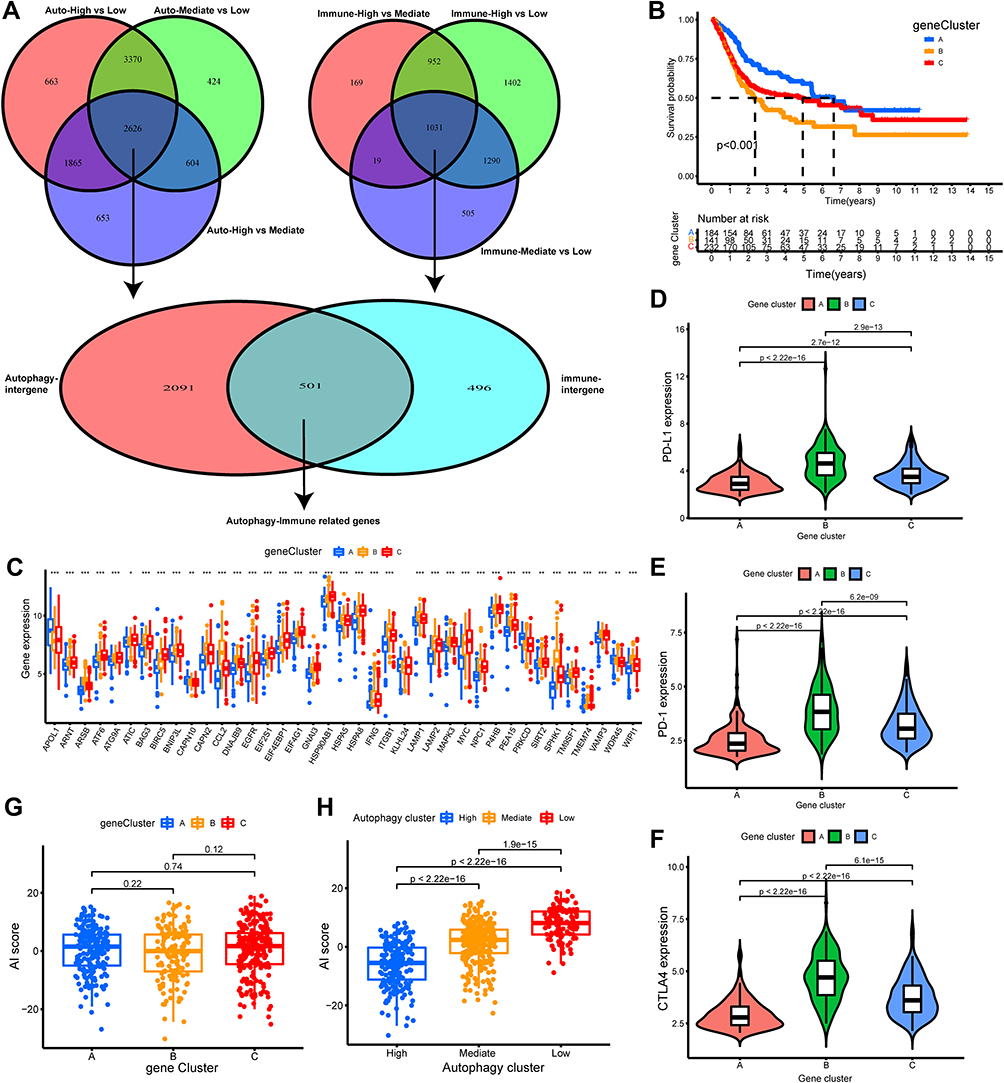 |
Figure 4 Construction and evaluation of differential expression of autophagy immune gene signatures. (A) The Venn diagrams showed 535 autophagy-immune related differentially expressed genes (DEGs) were overlapped from autophagy-related DEGs and immune-related DEGs. (B) The autophagy-immune related genes were utilized to construct gene cluster and then the K-M survival curves of the gene cluster were performed, which showed there were statistically significant differences among these three gene subtypes. (C) The boxplot was performed to visualize the expression levels of 43 prognostic-related gene among different gene clusters in merger dataset. (*p < 0.05; **p < 0.01; ***p < 0.001) (D–F) The violin plot showed the differential expressions of immune checkpoint gene, including PD-L1 (D), PD-1 (E), CTLA4 (F) in the three gene clusters, which showed that the expression of immune checkpoint genes in gene cluster B subgroup was significantly higher than the other subgroups. (G) Comparison of Autophagy-Immune (AI) score across gene clusters showed no significant differences between the three clusters. (H) Comparison of AI score across autophagy clusters showed autophagy-High cluster with the lowest AI score. |
Subsequently, Univariate COX regression analysis for these 501 autophagy-immune related genes was utilized to obtain 133 prognosis-related genes. Then, unsupervised clustering analysis was applied to classify patients into three genomic subtypes base on the 133 prognosis-related DEGs and was named as gene cluster A-C, respectively (Figure S2G–L). Moreover, we found that the three gene clusters had significantly different overall survival, with patients in gene cluster-C (139 patients) having the poorest overall survival probability, followed by gene cluster-B (231 patients) (Figure 4B). Therefore, we further evaluated the gene clusters comprehensively. Firstly, the differential expression of 43 prognosis-related ARGs in gene clusters is presented in Figure 4C. We found that most prognosis genes were significantly different in gene clusters (p<0.05). In addition, it was found that the expression of immune checkpoint genes was particularly significant in gene cluster-B, which was consistent with the expression results in the autophagy subgroup (Figure 4D–F).
To quantitatively evaluate the role of autophagy-immune gene signature in TME in individual BLCA patients, the PCA method was applied to calculate the scoring system, named AI-score. Surprisingly, we uncovered a significant difference in the distribution of AI-score among autophagy subtypes rather than gene clusters (Figure 4G and H). Therefore, we decided to characterize further the role of AI-score in TME cell infiltration and clinicopathological features in autophagy-related subtypes.
Characterization of AI-Score in Autophagy-Related Subtypes and Tumor Somatic Mutation
The BLCA patients in the training cohorts were divided into high AI-score subgroups and low AI-score subgroups based on the optional cut-off value obtained by the “survminer” package in R software. Then, the role of AI-score in TME cell infiltration was evaluated in training set and validated comprehensively in testing set. Firstly, the fraction of 23 tumor immune infiltrating cells in distinct AI-score subgroups was examined, and the result demonstrated that the infiltration level of most immune infiltrating cells was higher in the low AI-score subgroup than in the high subgroup (p<0.001) (Figure 5A). Besides, the Kaplan–Meier survival curves showed that the prognostic value of the low AI-score subgroup was linked to poorer survival outcomes (Figure 5B). A similar yield was observed in the validation cohort (Figure 5C and D). Moreover, a significant negative correlation existed between the AI-score and the majority of the immune infiltrating cells (Figure 5E). Sankey diagram was also used to present the correlation among autophagy subtypes, gene clusters, AI-score and survival outcomes, which showed the attribute changes of individual patients with BLCA (Figure 5F). In addition, we observed a remarkable difference in the percent weight of survival status in BLCA patients in the high and low AI-score subgroups (Figure 5G and H).
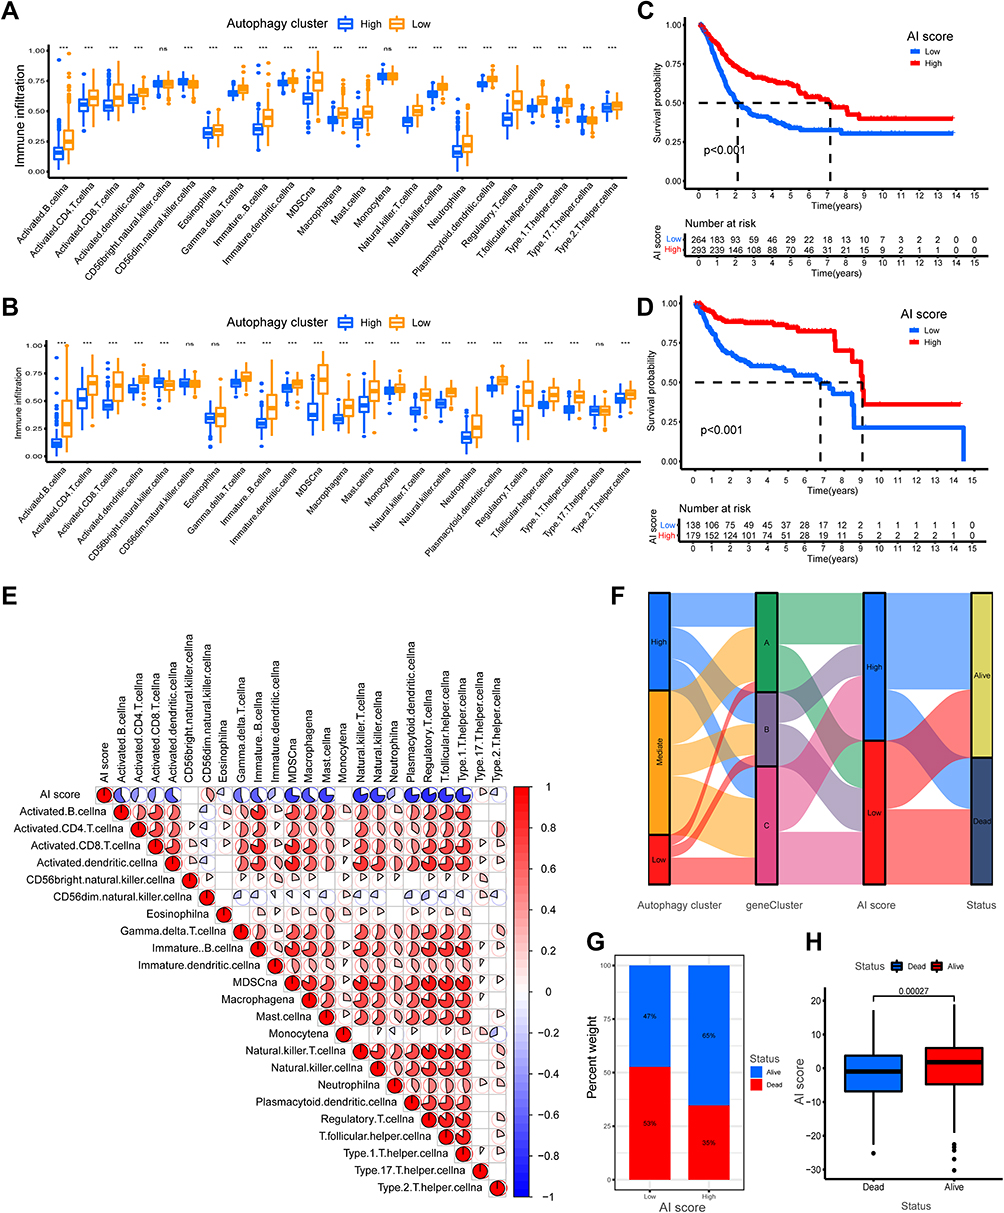 |
Figure 5 Construction and validation of autophagy-immune score (AI-score) for bladder cancer patients. (A and B) The boxplot showed the fraction of tumor immune infiltrating cells in high- and low AI-score subgroup in the autophagy clusters in training set (A) and testing set (B). (C and D) Kaplan–Meier survival curves showed that the Low AI-score subgroup had worse overall survival (OS) than the high AI-score subgroup in training set (C) and testing set (D). (E) Spearman analysis showed the correlation between AI-score and tumor immune infiltrating cells. Red represented positive correlation and blue represented negative correlation. (F) Sankey diagram showed the relationship among autophagy clusters, gene cluster, AI-score and survival status (Alive or Dead). (G) The proportion of bladder cancer patients with survival status in high and low AI-score subgroup. (H) The boxplot showed remarkable differences in AI-score across survival status. ***p < 0.001. Abbreviation: ns, no statistically significant. |
Tumor mutational burden (TMB) played an irreplaceable role in tumorigenesis and progression.41 We, therefore, further characterized the role of TMB in AI-score. The patients with BLCA in TCGA dataset were divided into high- and low-TMB subgroups based on the median value of TMB. The Kaplan–Meier survival analysis revealed that the high-TMB subgroup had a better survival probability than the low-TMB subgroup (Figure 6A). Also, we found that AI-score could more accurately predict the survival probability of BLCA patients in high- and low-TMB subgroups (Figure 6B). Therefore, we further evaluated the distribution differences of somatic mutations in the AI-score signature. The top 20 somatic mutation genes with the highest genetic alteration frequency in TCGA-BLCA cohorts were further analyzed, and we observed significant differences in TMB and mutation types between the high and low AI-score subgroups. The most common mutation gene was TP53, followed by TTN, and the most common mutation type was missense_mutation (Figure 6C and D). However, we observed no significant correlation between TMB and AI-score across autophagy subgroups and no significant difference in the distribution of TMB between high and low AI-score subgroups (Figure S6A and B). Subsequently, we explored the roles of AI-score signature in clinicopathological traits for predicting the overall survival in patients with BLCA in training cohorts. The result showed that the prognosis of patients with MIBC was higher in the high AI-score subgroup than in the low AI-score subgroup, whereas there was no significant difference in NMIBC (Figure 6E and F). Meanwhile, GSEA revealed significant differences in the essential biological processes and pathways linked to molecular heterogeneity between the high- and low AI-score subgroups of the training cohorts, suggesting that it could help predict prognosis accurately. The top 5 are displayed in Figure 6G and H. These results confirmed that the AI-score could be used as a valid predictive tool for exploring potential mechanisms in TMB and TME in BLCA.
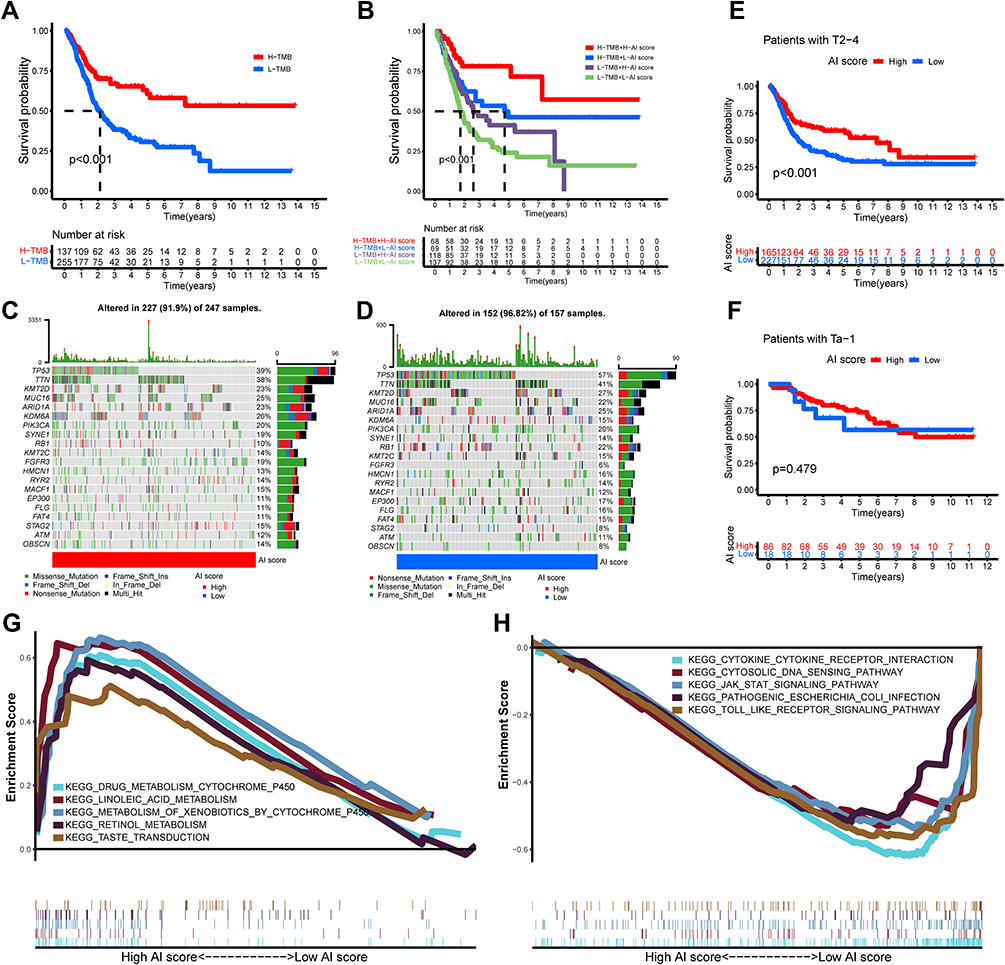 |
Figure 6 Characteristics of autophagy-immune score (AI-score) in autophagy subtypes and tumor somatic mutation. (A) Kaplan–Meier curves showed that high tumor mutation burden (H-TMB) subgroup had better survival probability than Low-TMB (L-TMB) subgroup in the training set. (B) Survival analysis of H-TMB (137 cases) and L-TMB (255 cases) subgroup stratified by high and low AI-score using Kaplan–Meier curves (P < 0.001, Log rank test). (C and D) Waterfall charts of tumor somatic mutations were established with high AI scores (C) and low AI scores (D). Each column indicates an individual sample. (E and F) Kaplan–Meier survival curves showed the survival outcomes of high- and low-AI-score in bladder cancer patients stratified by AJCC T stage (T2-4 vs Ta-1), respectively. (G and H) Gene set enrichment analysis (GSEA) showed the top 5 KEGG signaling pathways in high AI-score bladder cancer patients (G) and low AI-score bladder cancer patients (H). |
The Role of AI-Score Based on Autophagy-Related Subtypes in Predicting Immunotherapeutic Benefits and Immune Response
We further explored the predictive role of AI-score in predicting immunotherapy benefit and immune response in BLCA patients. Firstly, we obtained some immunotherapy data from https://tcia.at and compared the clinical benefit of immunotherapy targeting CTLA4 and/or PD-1 in high- or low AI-score subgroups. We found remarkable differences in the clinical benefit of targeting PD-1 and/or CTLA4 in immunotherapy in high- and low AI-score subgroups. Except for patients presenting positive for both targeting PD-1 and CTLA4 who showed significant clinical benefit in the high AI-score subgroup, other patients showed more benefit in the low AI-score subgroup than in the high AI-score subgroup (Figure 7A–D).
 |
Figure 7 The role of AI-score based on autophagy clusters in predicting immunotherapeutic benefits and immune response. (A–D) Comparison of the clinical benefit of targeting CTLA4(-) + PD-1(-) (A), CTLA4(-) + PD-1(+) (B), CTLA4(+) + PD-1(-) (C), CTLA4(+) + PD-1(+) (D) on immunotherapy in high or low AI-score subgroups. (E) The percent weight of clinical response (CR/PR and PD) to anti-PD-1 immunotherapy in high or low AI-score subgroups in the GSE78220 cohort. (F) Distribution of AI-score in different anti-PD-1 clinical response status (CR/PR/PD) to immunotherapy in the GSE78220 cohort. (G) The boxplot illustrated no significant difference in AI-score among different anti-PD-1 clinical response groups in the GSE78220 cohort. (H) Kaplan–Meier curves showed high AI-score subgroup had better survival probability than low AI-score subgroup in GSE78220 cohort (Log rank test, p = 0.009). (I) The percent weight of clinical response (CR/PR and SD/PD) to anti-PD-L1 immunotherapy in high or low AI-score subgroups in the IMvigor210 cohort. (J) Distribution of AI-score in different anti-PD-L1 clinical response status (CR/PR/SD/PD) to immunotherapy in the IMvigor210 cohort. (K) The boxplot illustrated significant differences in AI-score among different anti-PD-L1 clinical response groups in the IMvigor210 cohort. (L) Kaplan–Meier curves showed high AI-score subgroup had better survival probability than low AI-score subgroup in IMvigor210 cohort (Log rank test, p = 0.044). Abbreviations: CR, complete response; PR, partial response; SD, stable disease; PD, progressive disease; ns, no statistically significant. |
In addition, we also investigated the predictive value of the AI-score signature in the immune response to the anti-PD-1/PD-L1 based on two immunotherapy cohorts. In the anti-PD-1 immunotherapy cohort (GSE78220), patients with high AI-score presented higher immune response than those with low AI-score (67% vs 14%, Figure 7E). Furthermore, we found a significantly prolonged survival probability in the high AI-score subgroup compared to the low AI-score subgroup (Figure 7H). Likewise, we observed the same result in the IMvigor210 cohort (an anti-PD-L1 immunotherapy cohort) (Figure 7I and L). However, immune responses to anti-PD-1/L1 immunotherapy in BLCA patients with distinct AI-score were not identical in the two cohorts. We found significant differences in AI-score among immune responses only in the IMvigor210 cohort (Figure 7F, G, J and K). Thus, these results confirmed the predictive role of AI-score in immunotherapy benefit and immune response for patients with BLCA.
Construction and Evaluation of an Autophagy-Immune Related Gene Prognostic Model
Univariate, Lasso, multivariate Cox proportional hazards regression analysis were performed on the expression of 501 autophagy-immune associated differential genes to construct a prognostic prediction model in TCGA-BLCA training set (Figure 1, Table 1). As shown in Figure 8A, it generated a prognostic prediction model that contained 6 autophagy-immune related genes and coefficient of each. The ROC curve and its AUC value demonstrated that the prognosis risk-related model had promising predictive ability for overall survival (OS) in the training set (Figure 8B). Moreover, Kaplan–Meier curves showed that the OS of BLCA patients with low-risk subgroup were significantly better than those with high-risk subgroup in training set (p<0.001) (Figure 8C). The same results could be observed in validation group (Figure 8D and E). Besides, we constructed a prognosis-associated nomogram based on risk score and prognosis-associated clinicopathological parameters including age, gender, stage, grade, AJCC T, N, and M, to predict 1-, 3-, and 5-year OS of BLCA patients. ROC curves and calibration curves of the nomogram displayed the concordance between predicted and observed 1-, 3- and 5-year OS (Figure 8H–J). In addition, The DCA curve and multivariate ROC curve were performed, and showed that the predictive accuracy risk score and nomogram were higher than other clinicopathological features including age, gender, grade, stage (Figure 8F and G). Also, univariate and multivariate Cox regression analysis confirmed that risk score, age, stage were independent prognostic factors (p<0.01) (Table 2).
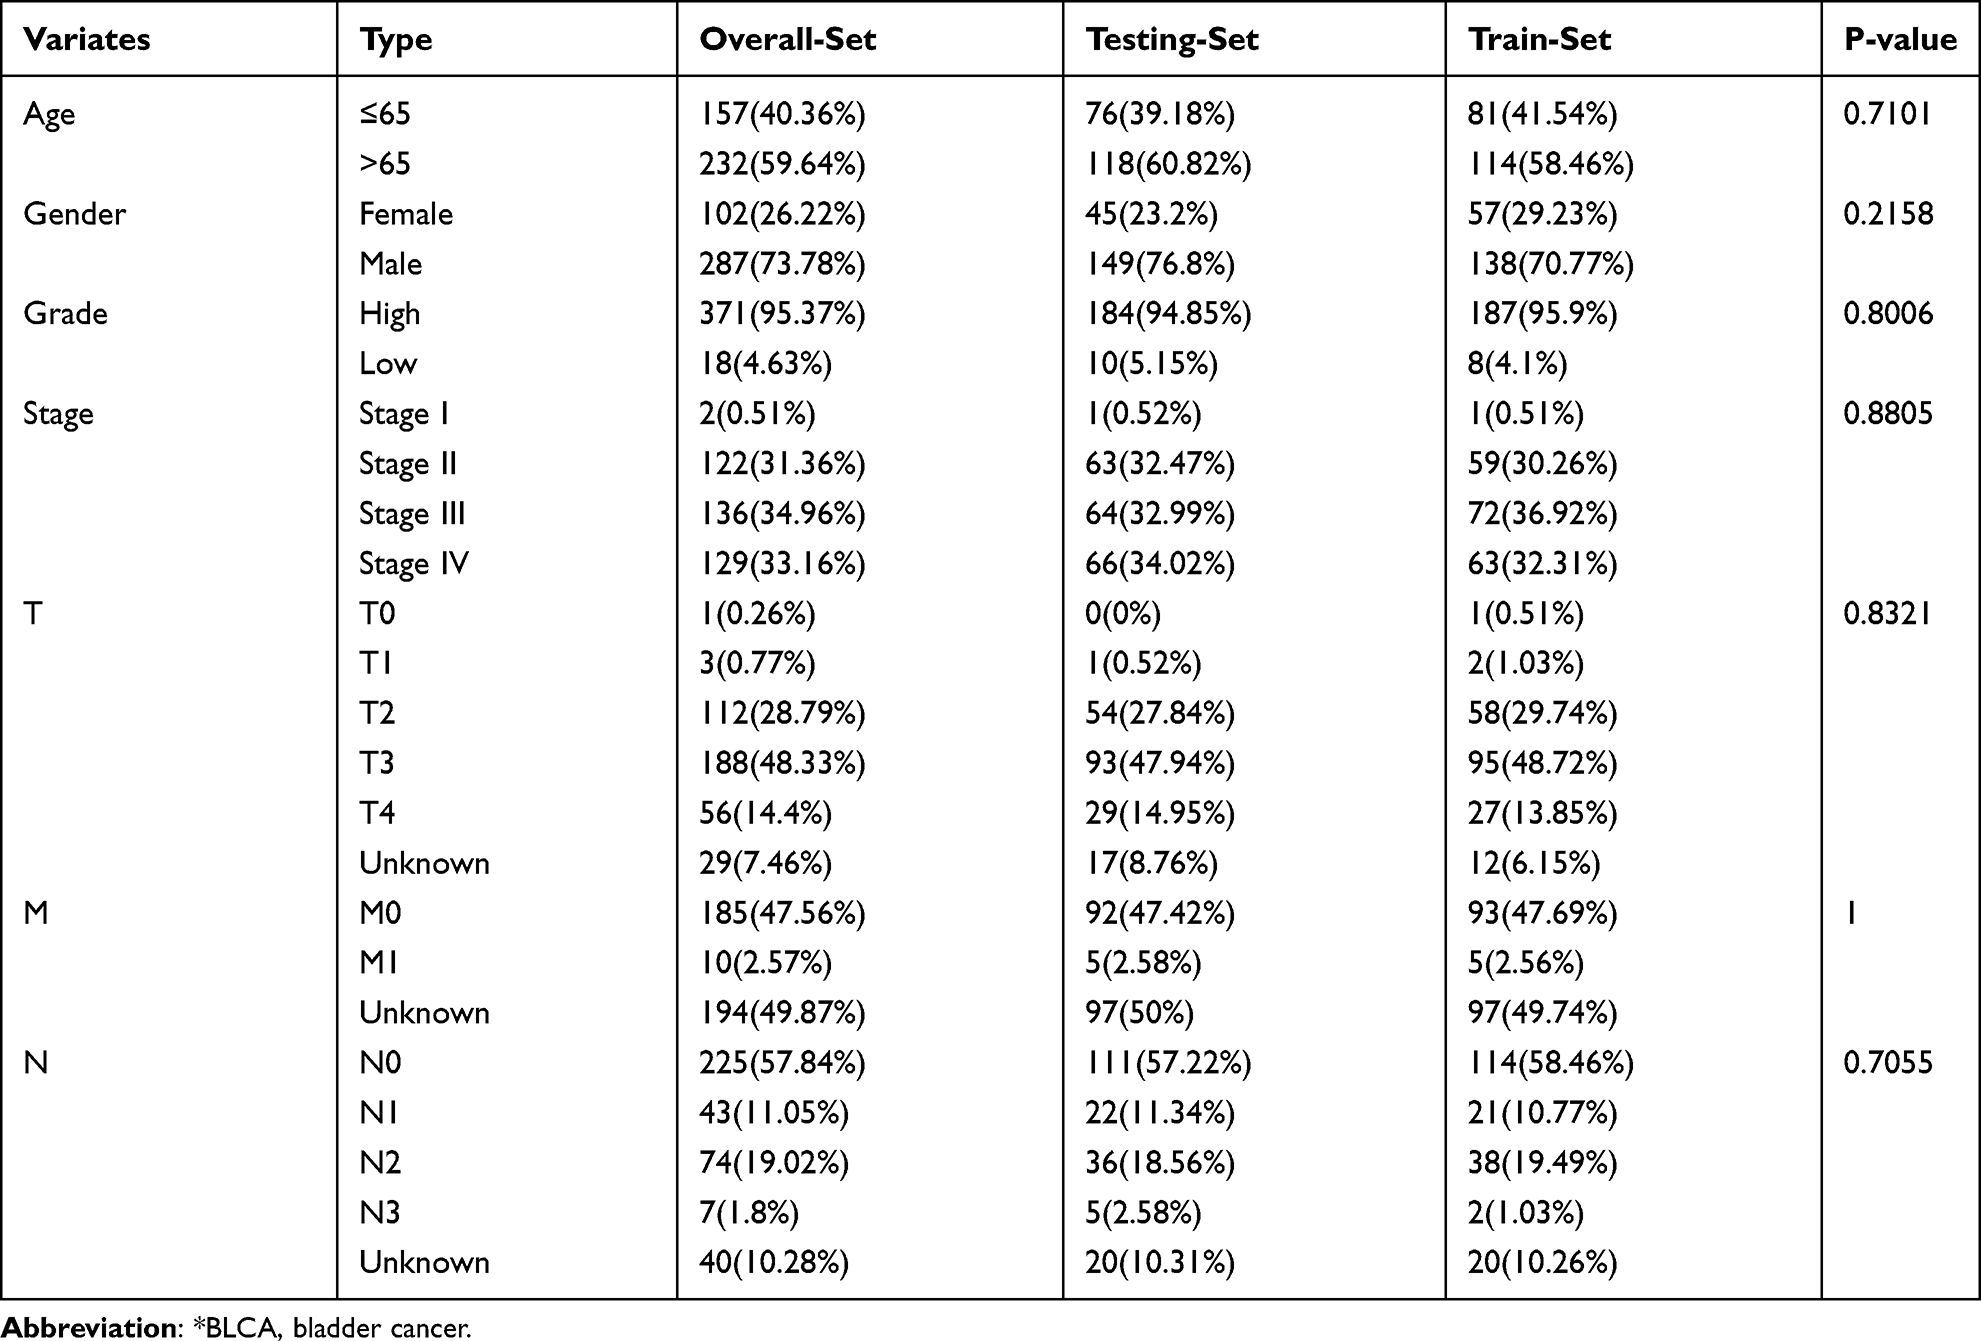 |
Table 1 Comparison of Clinical Characteristics of BLCA* Patients in Training Set, Testing Set and Overall Set |
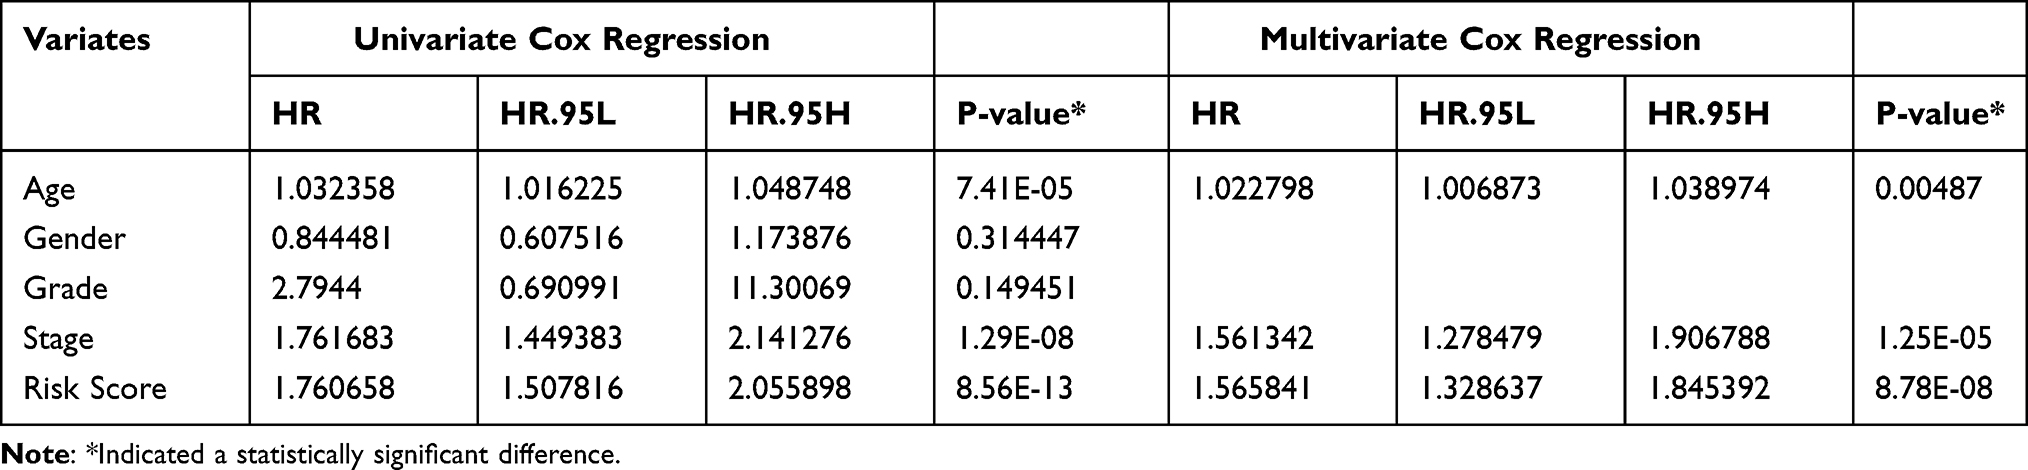 |
Table 2 Univariate and Multivariate Cox Regression Showed Age, Stage, Risk Score Were Independent Prognostic Factors (P<0.05) |
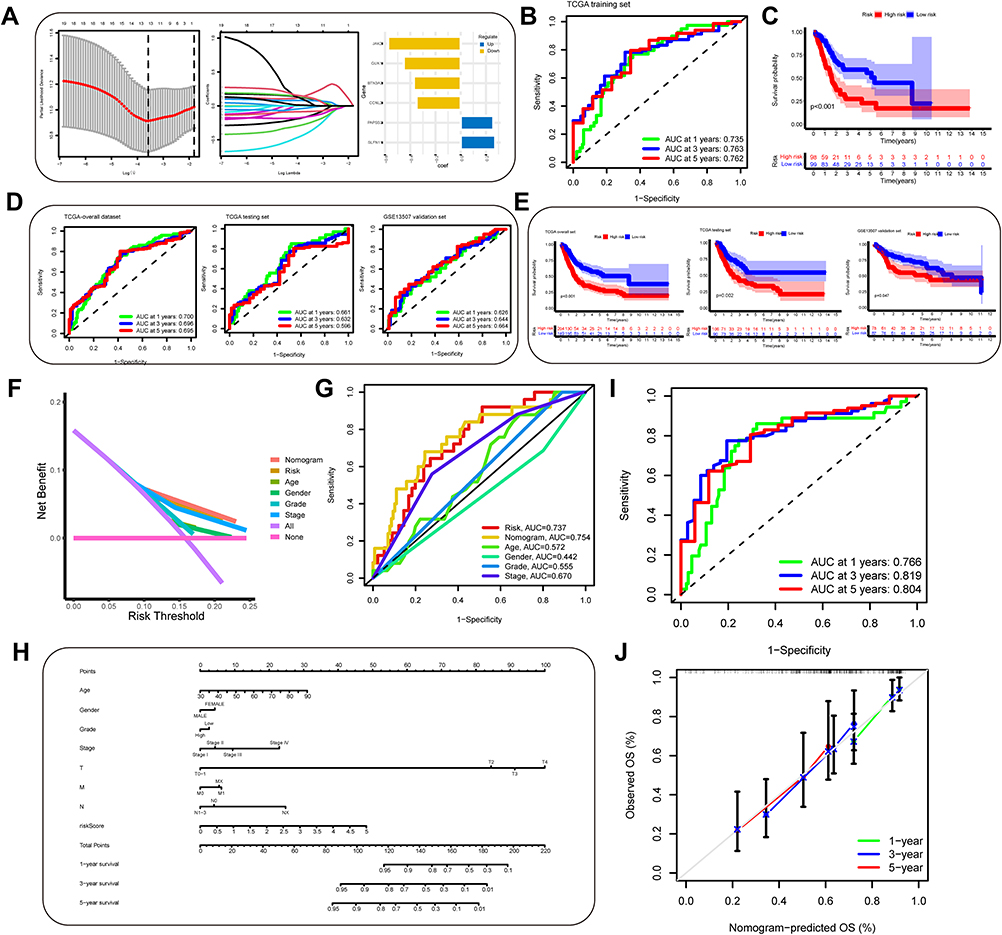 |
Figure 8 Construction and evaluation of an autophagy-immune-related genes prognosis model. (A) The least absolute shrinkage and selection operator (LASSO) Cox regression analysis was applied to calculate Lasso coefficient values and vertical dashed lines at the best log (lambda) value in the training set. Lasso coefficient profiles of the prognosis-related genes were demonstrated. (B) Receiver operating characteristic (ROC) curves for the prognosis signature and their AUC value were represented 1-, 3-, and 5-year predictions in training set. (C) Kaplan–Meier survival curves displayed that the high-risk subgroup had worse overall survival (OS) than the low-risk subgroup in training set (p<0.001). (D and E) ROC curves and Kaplan–Meier survival curves were used to validate the prognosis signature in overall set, testing set and GSE13507 dataset. (F and G) The DCA curve and multivariate ROC curve were performed to evaluate predictive accuracy of risk score and nomogram. The results showed that the predictive accuracy risk score and nomogram were higher than other clinicopathological features including age, gender, grade, stage. (H) Prognosis-related nomogram was constructed based on risk score in the model and prognosis-associated clinicopathological parameters including age, gender, stage, grade, AJCC T, N, and M, to predict 1-, 3-, and 5-year OS of BLCA patients. (I and J) ROC curves and calibration curves of the nomogram displayed the concordance between predicted and observed 1-, 3- and 5-year OS. |
To validate the robustness of the prognosis model in-depth, we performed qRT-PCR and IHC assays to verify the relative expression levels of 6 autophagy-immune related genes in the prognosis risk signature. Relative expression levels of the 6 autophagy-immune-related genes in the prognosis model in 22 paired BLCA tissues and matched adjacent normal bladder tissues were examined by qRT-PCR. The results indicated that the expression level of SLFN11, GUK1, CCNL2 AND BTN3A3 were significantly increased in BLCA tissues compared with matched adjacent normal bladder tissues, whereas PAPSS2 was downregulated in BLCA tissues, while JAK2 was not significantly different (Figure 9A). Similar results were also confirmed in the TCGA and GTEx database (Figure S7A). Moreover, these 6 genes were found to be associated with OS (Figure S7B). Furthermore, the same results were detected in BLCA cell lines compared to normal bladder cell (Figure 9B). In addition, IHC assays also robustly demonstrated the expression levels of the 6 genes in tumor tissue compared with matched adjacent normal bladder tissues (Figure 9C). Overall, these findings provide further validation of the stability and reliability of the autophagy-immune related genes prognosis model.
 |
Figure 9 (A)Relative expression levels of the 6 autophagy-immune-related genes in the prognosis model in 22 paired BLCA and matched adjacent normal bladder tissues were examined by qRT-PCR. (B) Relative expression levels of 6 autophagy-immune-related genes in the prognosis model in normal bladder cell (SV-HUC-1) and bladder cancer cells (UMUC3, T24, EJ). (C) Representative images of immunohistochemistry of 6 autophagy-immune-related genes in BLCA tissues compared to adjacent normal bladder tissues. *p < 0.05; **p < 0.01; ***p < 0.001. Abbreviation: ns, not significant. |
Discussions
Urothelial bladder cancer was the second most common malignant tumor in the urinary system worldwide.2 Approximately 25% of patients are diagnosed with MIBC or metastatic bladder cancer (MBC) with an unfavorable prognosis.1,42 Previous clinical studies have confirmed the effectiveness of immunotherapy in inhibiting tumor growth, prolonging survival, and improving quality of life in MIBC.43,44 Also, TME played an imperative role in BLCA.15,43 Therefore, it was urgent to understand better the molecular mechanisms of infiltrating immune cells in the TME, which could improve the efficacy of immune checkpoint inhibitors in patients with BLCA. In this study, we classified the BLCA patients into autophagy clusters and immune clusters, then defined a novel autophagy subtype. In addition, we constructed an AI-score signature that was validated as a reliable and stable predictive tool for exploring potential mechanisms in TMB and TME as well as for predicting immunotherapy benefit and immune response in BLCA patients. Firstly, we screened and integrated transcriptome data obtained from TCGA and/or GEO databases and named the training and testing cohorts. Expression and genetic mutation analysis confirmed that the abnormal expression of 43 prognosis-associated ARGs was associated with gene mutations, which affected the development and progression of BLCA. Then, we classified the training cohort into three immune clusters based on the expression levels of 29 immune gene sets. We found that the three immune clusters had distinct ESTIMATE Score and association with immune checkpoint genes, while exhibiting the TME characteristics of BLCA. Similarly, we identified three autophagy-related clusters for patients with BLCA based on the expression levels of prognosis-associated ARGs. We observed that autophagy clusters were correlated with clinicopathological features and linked to different signaling pathways, demonstrating different biological behaviors of BLCA samples. Subsequently, we defined a novel autophagy subtype, named autophagy-high subtype, autophagy-mediate subtype and autophagy-low subtype. We found that the autophagy subtype also could accurately characterize the role of prognosis and TME immune cell infiltration and proved to be significantly linked to the immune checkpoint genes. Finally, to quantitatively assess the significance of autophagy subtypes and their correlation with immunity, we constructed an autophagy-immune gene signature, calculated the AI-score, and then characterized the predictive value in genetic mutation and immune response. Collectively, our results indicated that the autophagy subtypes and AI-score were robust and stable predictive tools.
It was reported that autophagy-related prognostic signature could predict the prognosis of BLCA patients well,45 and autophagy-related molecular clusters also could characterize the clinical trait and TME immune cell infiltration in some tumors, such as colon cancer.26 Moreover, Jiang et al44 reported that immune-infiltrating subtypes could predict prognosis and immunotherapeutic response in patients with MIBC. However, whether autophagy-related molecular subtypes combined with immunity could more accurately characterize the clinical features and immune response in BLCA remained unclear. In the current study, we identified a novel autophagy subtype and constructed an AI-score signature and confirmed that our model had robust and reliable predictive reliability, which showed it could be a useful predictive tool.
Notably, immunotherapy was a beneficial adjuvant treatment for MIBC.46 The present study has shown that AI-score models could accurately predict the effect of immunotherapy and provide guidance for the selection of different immunotherapeutic agents. Also, it could be utilized to identify the TME infiltration and clinical trait further. We found that the infiltration level of most immune infiltrating cells was gradually increased in the autophagy-low, -medium and -high subtypes, some of which had been confirmed. Cen et al47 found that autophagy enhanced Mesenchymal stem cells-mediated CD4+T cell migration and differentiation via CXCL8 and TGF-β1 signal pathway. Mariathasan et al48 divided the solid tumors into three distinct immunological phenotypes, including immune inflamed, immune excluded and immune desert. According to the present finding, the three autophagy types revealed different TME immune infiltration characterization. The autophagy-high subtype, characterized by high immune infiltration in TME and high immune anti-cancer activity as well as high ESTIMATE score and high expression of immune checkpoint genes, corresponded to immune-inflamed phenotype. The autophagy-low subtype, characterized by the suppression of immunity and low immune anti-cancer activity as well as low ESTIMATE score and low expression of immune checkpoint genes, corresponded to the immune-desert phenotype. The others corresponded to the immune excluded phenotype. This result confirmed autophagy subtype could characterize the biological characteristics of BLCA.
Besides, we characterized the effect of TMB in AI-score signature. Our data showed a significant difference in the survival probability of TMB in the high and low AI-score subgroups. The high AI-score subgroup combined with the high-TMB group had the most favorable prognosis. Besides, somatic mutation frequency was inconsistent between high and low AI-score subgroups. Therefore, we inferred that AI-score and TMB representing different aspects of tumor immunobiology could predict clinical response to immunotherapy in BLCA patients.
Previous literature reported that immunotherapy-related prognostic models and molecular subtypes are practical prognostic markers and therapeutic targets for BLCA patients.44,49 PD-L1 played an important role in the regulation of BLCA. Recent studies found that WDR5 activates PD-L1 expression through H3K4me3 modification, and OICR-9429 targets WDR5 to inhibit immune evasion by blocking PD-L1.50 In this study, we evaluated the predictive value of AI-score in predicting immunotherapy benefit and immune response in anti-PD-1/PD-L1 immunotherapy cohorts. We observed significant differences in the clinical benefit of immunotherapies targeting PD-1 and/or CTLA4 in the high and low AI-score subgroup. The AI-score signature could precisely reflect immune therapeutic efficacy of immune checkpoint blockade. Hence, the above results demonstrated that the values of AI-score in predicting immunotherapeutic outcomes were confirmed.
In conclusion, we identified three autophagic clusters and three immune subgroups in BLCA patients by unsupervised consensus clustering and further characterized their biological behavior. Then, we defined a novel autophagy subtype and confirmed their role in clinical features and TME immune cell infiltration. Finally, we constructed an AI-score signature to quantitatively assess clinicopathological features such as TNM-stage, immunotherapy efficacy and immune response against PD-1/PD-L1 in individual BLCA patients. In addition, AI-score signature and prognosis model could be a valid predictive tool which could accurately predict the prognosis of BLCA patients and guide effective clinical practice, which could be validated by TCGA internal validation set, GEO external validation set and clinical samples. In short, this work provided novel insights into the role of autophagy and immunity in improving clinical responses and facilitating personalized immunotherapy options for BLCA patients.
Abbreviations
BLCA, bladder cancer; GEO, Gene Expression Omnibus; TCGA, The Cancer Genome Atlas; GO, Gene Ontology; KEGG, Kyoto Encyclopedia of Genes and Genomes; HR, Hazard ratios; MIBC, muscle-invasive BLCA; ARGs, autophagy-related genes; TME, tumor microenvironment; ssGSEA, single-sample gene sets enrichment analysis; GSVA, Gene set variation analysis; DEG, differentially expressed genes; AI-score, autophagy-immune score; PCA, principal component analysis; CNV, Copy number variation; ESTIMATE, estimation of stromal and Immune cells in malignant Tumor tissues using Expression data; TMB, Tumor mutational burden; PD-1, programmed cell death protein-1; PD-L1, programmed death ligand-1; CTLA4, cytotoxic T-lymphocyte-associated protein 4.
Data Sharing Statement
Publicly available datasets were analyzed in this study. This data can be found at TCGA project (https://portal.gdc.cancer.gov/) and GEO database (https://www.ncbi.nlm.nih.gov/geo/).
Acknowledgment
The authors gratefully acknowledge the data generated by TCGA database used in this study.
Author Contributions
All authors made a significant contribution to the work reported, whether that is in the conception, study design, execution, acquisition of data, analysis and interpretation, or in all these areas; took part in drafting, revising or critically reviewing the article; gave final approval of the version to be published; have agreed on the journal to which the article has been submitted; and agree to be accountable for all aspects of the work.
Funding
This study was supported by the National Natural Science Foundation of China (Nos. 81872089, 81370849, 81672551, and 81202034); Natural Science Foundation of Jiangsu Province (BE2019751, BK20161434, and BK2012336).
Disclosure
The authors report no conflicts of interest for this work.
References
1. Sanchez A, Wszolek MF, Niemierko A, et al. Incidence, clinicopathological risk factors, management and outcomes of nonmuscle invasive recurrence after complete response to trimodality therapy for muscle invasive bladder cancer. J Urol. 2018;199(2):407–415. doi:10.1016/j.juro.2017.08.106
2. Siegel RL, Miller KD, Jemal A. Cancer statistics, 2020. CA Cancer J Clin. 2020;70(1):7–30. doi:10.3322/caac.21590
3. Dobruch J, Daneshmand S, Fisch M, et al. Gender and bladder cancer: a collaborative review of etiology, biology, and outcomes. Eur Urol. 2016;69(2):300–310. doi:10.1016/j.eururo.2015.08.037
4. Chamie K, Litwin MS, Bassett JC, et al. Recurrence of high-risk bladder cancer: a population-based analysis. Cancer. 2013;119(17):3219–3227. doi:10.1002/cncr.28147
5. Butt SU, Malik L. Role of immunotherapy in bladder cancer: past, present and future. Cancer Chemother Pharmacol. 2018;81(4):629–645. doi:10.1007/s00280-018-3518-7
6. Powles T, Eder JP, Fine GD, et al. MPDL3280A (anti-PD-L1) treatment leads to clinical activity in metastatic bladder cancer. Nature. 2014;515(7528):558–562. doi:10.1038/nature13904
7. Sharma P, Retz M, Siefker-Radtke A, et al. Nivolumab in metastatic urothelial carcinoma after platinum therapy (CheckMate 275): a multicentre, single-arm, Phase 2 trial. Lancet Oncol. 2017;18(3):312–322. doi:10.1016/S1470-2045(17)30065-7
8. Chen X, Xie R, Gu P, et al. Long noncoding RNA LBCS inhibits self-renewal and chemoresistance of bladder cancer stem cells through epigenetic silencing of SOX2. Clin Cancer Res. 2019;25(4):1389–1403. doi:10.1158/1078-0432.CCR-18-1656
9. Xie R, Chen X, Cheng L, et al. NONO inhibits lymphatic metastasis of bladder cancer via alternative splicing of SETMAR. Mol Ther. 2021;29(1):291–307. doi:10.1016/j.ymthe.2020.08.018
10. Zhou Q, Wang Z, Zeng H, et al. Identification and validation of poor prognosis immunoevasive subtype of muscle-invasive bladder cancer with tumor-infiltrating podoplanin(+) cell abundance. Oncoimmunology. 2020;9(1):1747333. doi:10.1080/2162402X.2020.1747333
11. Cao R, Yuan L, Ma B, et al. Immune-related long non-coding RNA signature identified prognosis and immunotherapeutic efficiency in bladder cancer (BLCA). Cancer Cell Int. 2020;20:276. doi:10.1186/s12935-020-01362-0
12. Ruan W, Chen X, Huang M, et al. A urine-based DNA methylation assay to facilitate early detection and risk stratification of bladder cancer. Clin Epigenetics. 2021;13(1):91. doi:10.1186/s13148-021-01073-x
13. Chen X, Zhang J, Ruan W, et al. Urine DNA methylation assay enables early detection and recurrence monitoring for bladder cancer. J Clin Invest. 2020;130(12):6278–6289. doi:10.1172/JCI139597
14. Riley RS, June CH, Langer R, et al. Delivery technologies for cancer immunotherapy. Nat Rev Drug Discov. 2019;18(3):175–196. doi:10.1038/s41573-018-0006-z
15. Wu T, Dai Y. Tumor microenvironment and therapeutic response. Cancer Lett. 2017;387:61–68. doi:10.1016/j.canlet.2016.01.043
16. Zhang B, Wu Q, Li B, et al. m(6)A regulator-mediated methylation modification patterns and tumor microenvironment infiltration characterization in gastric cancer. Mol Cancer. 2020;19(1):53. doi:10.1186/s12943-020-01170-0
17. Pitt JM, Marabelle A, Eggermont A, et al. Targeting the tumor microenvironment: removing obstruction to anticancer immune responses and immunotherapy. Ann Oncol. 2016;27(8):1482–1492. doi:10.1093/annonc/mdw168
18. Zhang X, Shi M, Chen T, et al. Characterization of the immune cell infiltration landscape in head and neck squamous cell carcinoma to aid immunotherapy. Mol Ther Nucleic Acids. 2020;22:298–309. doi:10.1016/j.omtn.2020.08.030
19. Inman BA, Longo TA, Ramalingam S, et al. Atezolizumab: a PD-L1-blocking antibody for bladder cancer. Clin Cancer Res. 2017;23(8):1886–1890. doi:10.1158/1078-0432.CCR-16-1417
20. Meng J, Lu X, Zhou Y, et al. Tumor immune microenvironment-based classifications of bladder cancer for enhancing the response rate of immunotherapy. Mol Ther Oncolytics. 2021;20:410–421. doi:10.1016/j.omto.2021.02.001
21. Kamoun A, de Reyniès A, Allory Y, et al. A consensus molecular classification of muscle-invasive bladder cancer. Eur Urol. 2020;77(4):420–433. doi:10.1016/j.eururo.2019.09.006
22. Amaravadi R, Kimmelman AC, White E. Recent insights into the function of autophagy in cancer. Genes Dev. 2016;30(17):1913–1930. doi:10.1101/gad.287524.116
23. Huang T, Wan X, Alvarez AA, et al. MIR93 (microRNA −93) regulates tumorigenicity and therapy response of glioblastoma by targeting autophagy. Autophagy. 2019;15(6):1100–1111. doi:10.1080/15548627.2019.1569947
24. Lin T, Zhang Q, Yuan A, et al. Synergy of tumor microenvironment remodeling and autophagy inhibition to sensitize radiation for bladder cancer treatment. Theranostics. 2020;10(17):7683–7696. doi:10.7150/thno.45358
25. Cao R, Ma B, Wang G, et al. Identification of autophagy-related genes signature predicts chemotherapeutic and immunotherapeutic efficiency in bladder cancer (BLCA). J Cell Mol Med. 2021;25(12):5417–5433. doi:10.1111/jcmm.16552
26. Zhu S, Wu Q, Zhang B, et al. Autophagy-related gene expression classification defines three molecular subtypes with distinct clinical and microenvironment cell infiltration characteristics in colon cancer. Int Immunopharmacol. 2020;87:106757. doi:10.1016/j.intimp.2020.106757
27. Gerada C, Ryan KM. Autophagy, the innate immune response and cancer. Mol Oncol. 2020;14(9):1913–1929. doi:10.1002/1878-0261.12774
28. Wang Z, Jensen MA, Zenklusen JC. A practical guide to the cancer genome atlas (TCGA). Methods Mol Biol. 2016;1418:111–141.
29. Tomczak K, Czerwińska P, Wiznerowicz M. The Cancer Genome Atlas (TCGA): an immeasurable source of knowledge. Contemp Oncol. 2015;19(1A):A68–A77. doi:10.5114/wo.2014.47136
30. Barrett T, Wilhite SE, Ledoux P, et al. NCBI GEO: archive for functional genomics data sets–update. Nucleic Acids Res. 2013;41(Database issue):D991–D995. doi:10.1093/nar/gks1193
31. Chen K, Yang D, Zhao F, et al. Autophagy and Tumor Database: ATdb, a novel database connecting autophagy and tumor. Database. 2020;2020. doi:10.1093/database/baaa052
32. Wang NN, Dong J, Zhang L, et al. HAMdb: a database of human autophagy modulators with specific pathway and disease information. J Cheminform. 2018;10(1):34. doi:10.1186/s13321-018-0289-4
33. Wilkerson MD, Hayes DN. ConsensusClusterPlus: a class discovery tool with confidence assessments and item tracking. Bioinformatics. 2010;26(12):1572–1573. doi:10.1093/bioinformatics/btq170
34. Hänzelmann S, Castelo R, Guinney J. GSVA: gene set variation analysis for microarray and RNA-seq data. BMC Bioinform. 2013;14:7. doi:10.1186/1471-2105-14-7
35. Subramanian A, Tamayo P, Mootha VK, et al. Gene set enrichment analysis: a knowledge-based approach for interpreting genome-wide expression profiles. Proc Natl Acad Sci U S A. 2005;102(43):15545–15550. doi:10.1073/pnas.0506580102
36. Chen DS, Mellman I. Oncology meets immunology: the cancer-immunity cycle. Immunity. 2013;39(1):1–10. doi:10.1016/j.immuni.2013.07.012
37. Yoshihara K, Shahmoradgoli M, Martínez E, et al. Inferring tumour purity and stromal and immune cell admixture from expression data. Nat Commun. 2013;4:2612. doi:10.1038/ncomms3612
38. Yu J, Mao W, Sun S, et al. Identification of an m6A-related lncRNA signature for predicting the prognosis in patients with kidney renal clear cell carcinoma. Front Oncol. 2021;11:663263. doi:10.3389/fonc.2021.663263
39. Mao W, Wang K, Xu B, et al. ciRS-7 is a prognostic biomarker and potential gene therapy target for renal cell carcinoma. Mol Cancer. 2021;20(1):142. doi:10.1186/s12943-021-01443-2
40. Chen S, Wang L, Xu C, et al. Knockdown of REGγ inhibits proliferation by inducing apoptosis and cell cycle arrest in prostate cancer. Am J Transl Res. 2017;9(8):3787–3795.
41. Hanahan D, Weinberg RA. Hallmarks of cancer: the next generation. Cell. 2011;144(5):646–674. doi:10.1016/j.cell.2011.02.013
42. Burger M, Catto JW, Dalbagni G, et al. Epidemiology and risk factors of urothelial bladder cancer. Eur Urol. 2013;63(2):234–241. doi:10.1016/j.eururo.2012.07.033
43. Cao R, Yuan L, Ma B, et al. Tumour microenvironment (TME) characterization identified prognosis and immunotherapy response in muscle-invasive bladder cancer (MIBC). Cancer Immunol Immunother. 2021;70(1):1–18. doi:10.1007/s00262-020-02649-x
44. Jiang W, Zhu D, Wang C, et al. An immune relevant signature for predicting prognoses and immunotherapeutic responses in patients with muscle-invasive bladder cancer (MIBC). Cancer Med. 2020;9(8):2774–2790. doi:10.1002/cam4.2942
45. Yan X, Wu HH, Chen Z, et al. Construction and validation of an autophagy-related prognostic signature and a nomogram for bladder cancer. Front Oncol. 2021;11:632387. doi:10.3389/fonc.2021.632387
46. Necchi A, Raggi D, Gallina A, et al. Impact of molecular subtyping and immune infiltration on pathological response and outcome following neoadjuvant pembrolizumab in muscle-invasive bladder cancer. Eur Urol. 2020;77(6):701–710. doi:10.1016/j.eururo.2020.02.028
47. Cen S, Wang P, Xie Z, et al. Autophagy enhances mesenchymal stem cell-mediated CD4(+) T cell migration and differentiation through CXCL8 and TGF-β1. Stem Cell Res Ther. 2019;10(1):265. doi:10.1186/s13287-019-1380-0
48. Mariathasan S, Turley SJ, Nickles D, et al. TGFβ attenuates tumour response to PD-L1 blockade by contributing to exclusion of T cells. Nature. 2018;554(7693):544–548. doi:10.1038/nature25501
49. Song BN, Kim SK, Mun JY, et al. Identification of an immunotherapy-responsive molecular subtype of bladder cancer. EBioMedicine. 2019;50:238–245. doi:10.1016/j.ebiom.2019.10.058
50. Zhang J, Zhou Q, Xie K, et al. Targeting WD repeat domain 5 enhances chemosensitivity and inhibits proliferation and programmed death-ligand 1 expression in bladder cancer. J Exp Clin Cancer Res. 2021;40(1):203. doi:10.1186/s13046-021-01989-5
 © 2022 The Author(s). This work is published and licensed by Dove Medical Press Limited. The full terms of this license are available at https://www.dovepress.com/terms.php and incorporate the Creative Commons Attribution - Non Commercial (unported, v3.0) License.
By accessing the work you hereby accept the Terms. Non-commercial uses of the work are permitted without any further permission from Dove Medical Press Limited, provided the work is properly attributed. For permission for commercial use of this work, please see paragraphs 4.2 and 5 of our Terms.
© 2022 The Author(s). This work is published and licensed by Dove Medical Press Limited. The full terms of this license are available at https://www.dovepress.com/terms.php and incorporate the Creative Commons Attribution - Non Commercial (unported, v3.0) License.
By accessing the work you hereby accept the Terms. Non-commercial uses of the work are permitted without any further permission from Dove Medical Press Limited, provided the work is properly attributed. For permission for commercial use of this work, please see paragraphs 4.2 and 5 of our Terms.