")
Back to Journals » International Journal of General Medicine » Volume 14
Characteristics of Myocardial Perfusion in Type 2 Diabetes Mellitus and Its Association with Left Ventricular Diastolic Dysfunction: A Study of Myocardial Contrast Echocardiography
Authors Liu Y, Ma J, Guo J , Lu H, Zhang Y, Chen Y
Received 22 September 2021
Accepted for publication 26 October 2021
Published 2 November 2021 Volume 2021:14 Pages 7533—7543
DOI https://doi.org/10.2147/IJGM.S340642
Checked for plagiarism Yes
Review by Single anonymous peer review
Peer reviewer comments 2
Editor who approved publication: Dr Scott Fraser
Yi Liu,1,* Jing Ma,2,* Jia Guo,1 Hao Lu,3 Yan Zhang,1 Yilei Chen3
1Department of Ultrasonography, Shuguang Hospital Affiliated to Shanghai University of Traditional Chinese Medicine, Shanghai, People’s Republic of China; 2Division of Cardiology, Xuhui Central Hospital, Zhongshan-Xuhui Hospital, Fudan University, Shanghai, People’s Republic of China; 3Department of Endocrinology, Shuguang Hospital Affiliated to Shanghai University of Traditional Chinese Medicine, Shanghai, People’s Republic of China
*These authors contributed equally to this work
Correspondence: Jia Guo
Department of Ultrasonography, Shuguang Hospital Affiliated to Shanghai University of Traditional Chinese Medicine, Shanghai, 200021, People’s Republic of China
Tel +86-13701688771
Email [email protected]
Hao Lu
Department of Endocrinology, Shuguang Hospital Affiliated to Shanghai University of Traditional Chinese Medicine, Shanghai, 200021, People’s Republic of China
Tel +86-13916719260
Email [email protected]
Background: Diabetic cardiomyopathy (DCM) will gradually progress to heart failure without intervention. The timely identification of left ventricular diastolic dysfunction (LVDD) in the early stage and active intervention helps delay the onset of heart failure. Although myocardial contrast echocardiography (MCE) allows an accurate evaluation of myocardial perfusion (MP), the characteristics of MP in early-stage or even sub-clinical LVDD are still unclear.
Objective: This study aims to reveal the characteristics of MP in asymptomatic and normotensive patients with type 2 diabetes mellitus (T2DM) using MCE and investigate its association with LVDD development.
Methods: A total of 327 T2DM patients were retrospectively analyzed. Patients diagnosed with LVDD were included in the LVDD+ group (n = 76), and those with normal left ventricular diastolic function were included in the LVDD– group (n = 251). The clinical characteristics, general echocardiographic findings, and MCE parameters were compared between the two groups. The accuracy of MCE parameters in the diagnosis of LVDD and their correlations with characteristics of T2DM were evaluated.
Results: In the LVDD+ group, the A×β (derived from the replenishment curve of MCE, presenting myocardial blood flow) was significantly lower, and the HbA1c and diabetes duration were significantly higher compared to the LVDD– group (all P < 0.05). The decrease of A×β helped warn the occurrence of LVDD although it was not suitable for the independent diagnosis of LVDD (AUC = 0.745). A×β was negatively correlated with diabetes duration and HbA1c (r = − 0.350 and − 0.226, both P < 0.001).
Conclusion: MCE was feasible for detecting MP abnormalities in asymptomatic T2DM patients. Although the A×β values of T2DM patients with subclinical LVDD were better than those with diagnosed LVDD, it impaired with the increase of HbA1c and diabetes duration. It suggested that MCE might be useful for monitoring glycemic control in T2DM patients with DCM.
Keywords: myocardial perfusion, type 2 diabetes mellitus, left ventricular diastolic dysfunction, diabetic cardiomyopathy, HbA1c, diabetes duration
Introduction
Diabetic cardiomyopathy (DCM) is a myocardial dysfunction that is independent of coronary artery disease, valve dysfunction, and hypertension, which exists in nearly two-thirds of patients with type 2 diabetes mellitus (T2DM).1–3 Several epidemiological studies have revealed that most T2DM patients die of cardiovascular complications.4,5 Without intervention, DCM will gradually progress to overt heart failure with systolic dysfunction.2 The mortality rate will then increase significantly, and there are few proven effective treatments for improving heart failure.3,6,7 Therefore, it is necessary to detect DCM as early as possible to improve the cardiovascular risk stratification of T2DM patients. Left ventricular diastolic dysfunction (LVDD) presented in T2DM patients without diabetic complications or cardiovascular disease has been suggested as the earliest functional effect of DCM before changes in systolic function.8 Its timely identification and active improvement in glycemic control helps avoid or delay the onset of heart failure since early-stage LVDD is reversible.9
However, the average duration of T2DM patients is usually more than 4 years when diagnosed with LVDD.10 This is primarily because echocardiography, which is the major diagnostic method of LVDD, lacks sensitive echocardiographic features in early-stage LVDD.11 Exploring more accurately quantifiable examinations will aid in the diagnosis of early LVDD and generate opportunities to reverse DCM. Although the pathogenesis of DCM is unclear, research has shown that diabetic microangiopathy is related to this dysfunction, and the myocardial microvascular may be abnormal before the diastolic function changes.12 Myocardial contrast echocardiography (MCE) has been introduced as a promising quantitative technique allowing an accurate evaluation of myocardial perfusion (MP). It is a well-established technique to quantitatively observe MP according to the recommendations of the European cardiovascular imaging association.13 However, the characteristics of MP in early-stage or even sub-clinical LVDD are still unclear.
The purpose of the present study is to reveal the characteristics of MP in asymptomatic and normotensive T2DM patients using MCE, and to investigate its association with LVDD development.
Materials and Methods
This retrospective study was approved by the institutional review board of Shuguang Hospital affiliated Shanghai University of TCM (2020–901-110-01) and the need for informed consent was waived. It was conducted following the Declaration of Helsinki.
Patients
Between March 2019 and June 2021, patients from the outpatient clinic and inpatient ward receiving echocardiography and MCE examinations were enrolled for this study. The patient inclusion criteria were as follows: 1) diagnosed as T2DM referred to the guidelines of the American Diabetes Association;14 2) Underwent a systematic examination to identify cardiovascular complications; and 3) complete clinical and imaging data. The exclusion criteria were as follows: 1) hypertension (blood pressure >140/90 mm Hg or ongoing treatment for hypertension); 2) a history of cardiovascular disease, including established or suspected coronary artery disease (CAD), myocardial infarction, valvular disease, stroke, arrhythmia, or any other cardiovascular disease; 3) regional wall motion abnormalities or left ventricular ejection fraction (LVEF) <50% by resting echocardiography; 4) inadequate echocardiographic image quality; and 5) other important comorbidities like tumors.
Finally, 327 T2DM patients were enrolled. Patients diagnosed with LVDD were included in the LVDD+ group (n = 76), and those with normal left ventricular diastolic function were included in the LVDD– group (n = 251) according to the evidence of echocardiography (Figure 1).
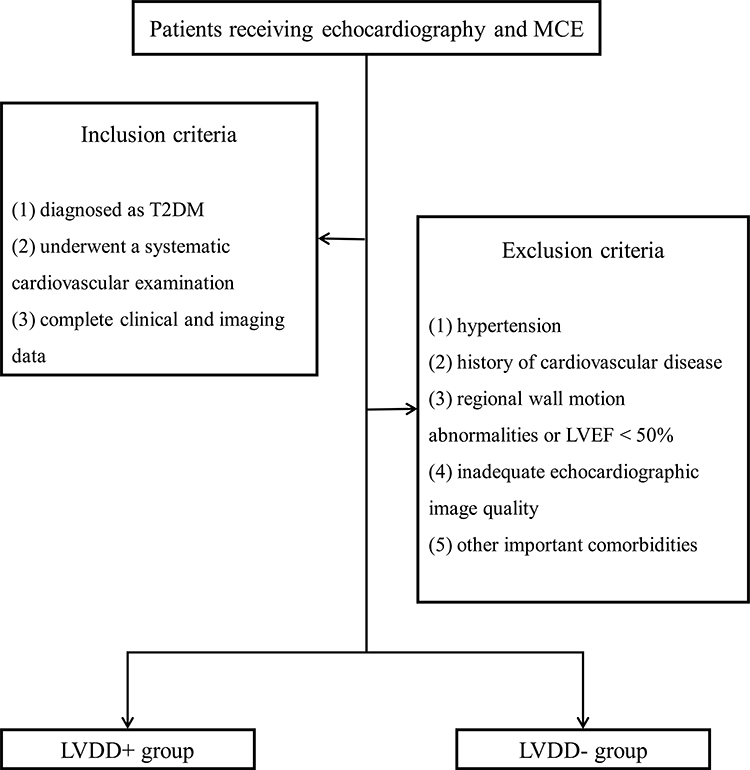 |
Figure 1 Flow chart of patient enrollment and grouping. LVDD+ group: patients diagnosed with LVDD; LVDD– group: patients with normal left ventricular diastolic function. Abbreviations: T2DM, type 2 diabetes mellitus; LVEF, left ventricular ejection fraction; LVDD, left ventricular diastolic dysfunction; MCE, myocardial contrast echocardiography. |
All patients underwent an interview to establish baseline characteristics. The clinical information, such as age, gender, body mass index (BMI) (calculated as weight/height2), body surface area (BSA) (calculated as 0.0061 × height (cm) + 0.0128 × weight (kg) − 0.1529), blood pressure, diabetes duration, smoking status, and medication intake, was collected. Blood samples were collected from venous blood in the morning for laboratory tests and fasting blood glucose (FBG), postprandial-blood glucose (PBG) (2 h after breakfast), glycated hemoglobin (HbA1c), total cholesterol (TC), triglycerides (TG), high-density lipoprotein cholesterol (HDL), low-density lipoprotein cholesterol (LDL), B-type natriuretic peptide (BNP), creatine kinase (CK), and creatine kinase isoenzyme MB (CK-MB) were recorded.
Echocardiography
All patients were examined at rest by transthoracic echocardiography using EPIQ 7C Ultrasonography (Philips Healthcare, Andover, MA, USA) equipped with an X5-1 probe (1–5 MHz) in the lateral decubitus position, and images were analyzed using QLAB software (Version 10.5, Philips). The interventricular septum thickness (IVST), posterior wall thickness (PWT), left ventricular end-diastolic dimension (LVDd), and left ventricular end-systolic dimension (LVDs) were measured in M-mode according to the recommendations of the American Society of Echocardiography.15 Left atrial volume index (LAVI) was assessed through the biplane area-length method, dividing the left atrial volume by the body surface area. LVEF was determined by modified biplane Simpson’s method. Pulsed-wave Doppler-derived transmitral inflow velocities were recorded in the apical 4-chamber view. Peak velocity in early diastole (E-wave) and late diastole (A-wave), deceleration time (DT), and E/A ratio were obtained. For tissue Doppler imaging, early diastolic mitral annular velocity (e’) was obtained from the two measurements at septal and lateral sides of mitral annulus, and the average E/e’ ratio was calculated by averaging the two. Tricuspid regurgitation peak velocity (TRPV) and isovolumetric relaxation time (IVRT) were determined using continuous-wave Doppler. All measurements were averaged over three consecutive cardiac cycles by a sonographer with more than 10 years of experience blinded to the study protocol. LVDD at rest was diagnosed if any three or more of the following criteria were met:16 1) average E/e’ > 14, 2) septal e’ < 7cm/s or lateral e’ < 10cm/s, 3) TRPV > 2.8m/s, and 4) LAVI > 34mL/m2.
MCE
MCE was performed after regular echocardiography. The Sonovue contrast agent (Bracco, Milan, Italy) was diluted with 5 mL 0.9% saline to form a microbubble suspension of sulfur hexafluoride. Subsequently, 2.5 mL of the suspension was diluted to 5 mL and was injected as an intravenous bolus through the median cubital vein at 2.0 mL/min, followed by a 5mL normal saline flush. The mitral valve level was set as the optimal focus and apical 4, 2 chamber, and long axis view were observed with a mechanical index of <0.2. Depletion-replenishment imaging was used with a transient, high-MI (1.35) to deplete myocardial microbubbles completely, and then replenishment was observed over 15 cardiac cycles. Quantitative MCE analysis was performed by one sonographer blinded to patient characteristics and group assignment. Five segmental regions of interest (ROIs) were manually placed within the myocardium in the apical segment (septal, inferior, lateral, and anterior segments, as well as apical cap) of the left ventricle at the end-systolic frame. The replenishment curve of each segment was obtained (as shown in Figure 2), which could be described by the following function:

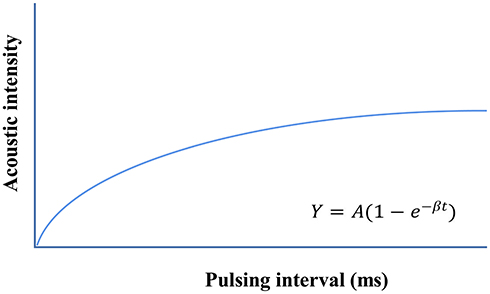 |
Figure 2 The replenishment curve formed after all microbubbles within an ultrasound field are destroyed by a single ultrasound pulse. It can be described by the following function: |
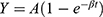
where t is the pulsing interval of ultrasound, Y is acoustic intensity at a pulsing interval, A is the plateau acoustic intensity reflecting myocardial blood volume, β is the rate of rise of acoustic intensity increase reflecting MP velocity, and A×β is the slope of the tangent to the curve at the origin, representing myocardial blood flow (MBF).17 All measurements were repeated 3 times to take the average. The global A, β, and A×β were calculated by averaging the ROIs of all segments in the apex (Figure 3).
 |
Figure 3 Quantitative MCE analysis in a T2DM patient. Apical 2-, 3-, and 4-chamber views are observed at the end-systolic frame. Five ROIs are placed in the myocardium of the apical segment. The specific positions are as follows: apical septal and lateral segments, as well as apical cap in apical 4-chamber view (A); apical inferior and anterior segments, as well as apical cap apical in 2-chamber view (B); and apical lateral and anterior segments, as well as apical cap in apical long axis view (C). A, β, and A×β in each segment are obtained and all measurements are repeated 3 times to take the average. A represents myocardial blood volume, β represents myocardial perfusion velocity, and A×β represents myocardial blood flow. Abbreviations: MCE, myocardial contrast echocardiography; T2DM, type 2 diabetes mellitus; ROI, regions of interest. |
Intra- and Inter-Observer Variability
MCE measurements were repeated in 75 randomly selected subjects in the LVDD– group and 25 in the LVDD+ group. Intra-observer reliability assessment was performed 1 week apart by the same sonographer, while inter-observer reliability assessment was carried out by another sonographer blinded to previous data.
Statistical Analysis
Independent sample t-test, chi-square test, and Mann–Whitney U-test were used for the comparison between LVDD+ and LVDD– groups. Intra- and inter-observer reliability was assessed by Bland–Altman analysis and intraclass correlation coefficient (ICC) test. Correlations of MCE with characteristics of T2DM were estimated using Pearson correlation coefficient. The diagnostic accuracy calculated by the area under the curve (AUC), sensitivity, and specificity of MCE parameters were evaluated by the receiver operator characteristic (ROC) curve. IBM SPSS Statistics 22.0 (IBM Corp., Armonk, NY, United States) and Medcalc (Version 22.0.1; MedCalc Software, Ostend, Belgium) were used for statistical analyses.
Results
Patients’ Characteristics
The characteristics of T2DM patients with and without LVDD are summarized in Table 1. Two hundred and fifty-one patients in the LVDD– group and 76 patients in the LVDD+ group were studied. Diabetes duration was longer and HbA1c was higher in the LVDD+ group than in the LVDD– group (both P values < 0.05). There was no significant difference in medication intake, other clinical information and laboratory tests between the two groups (all P values > 0.05).
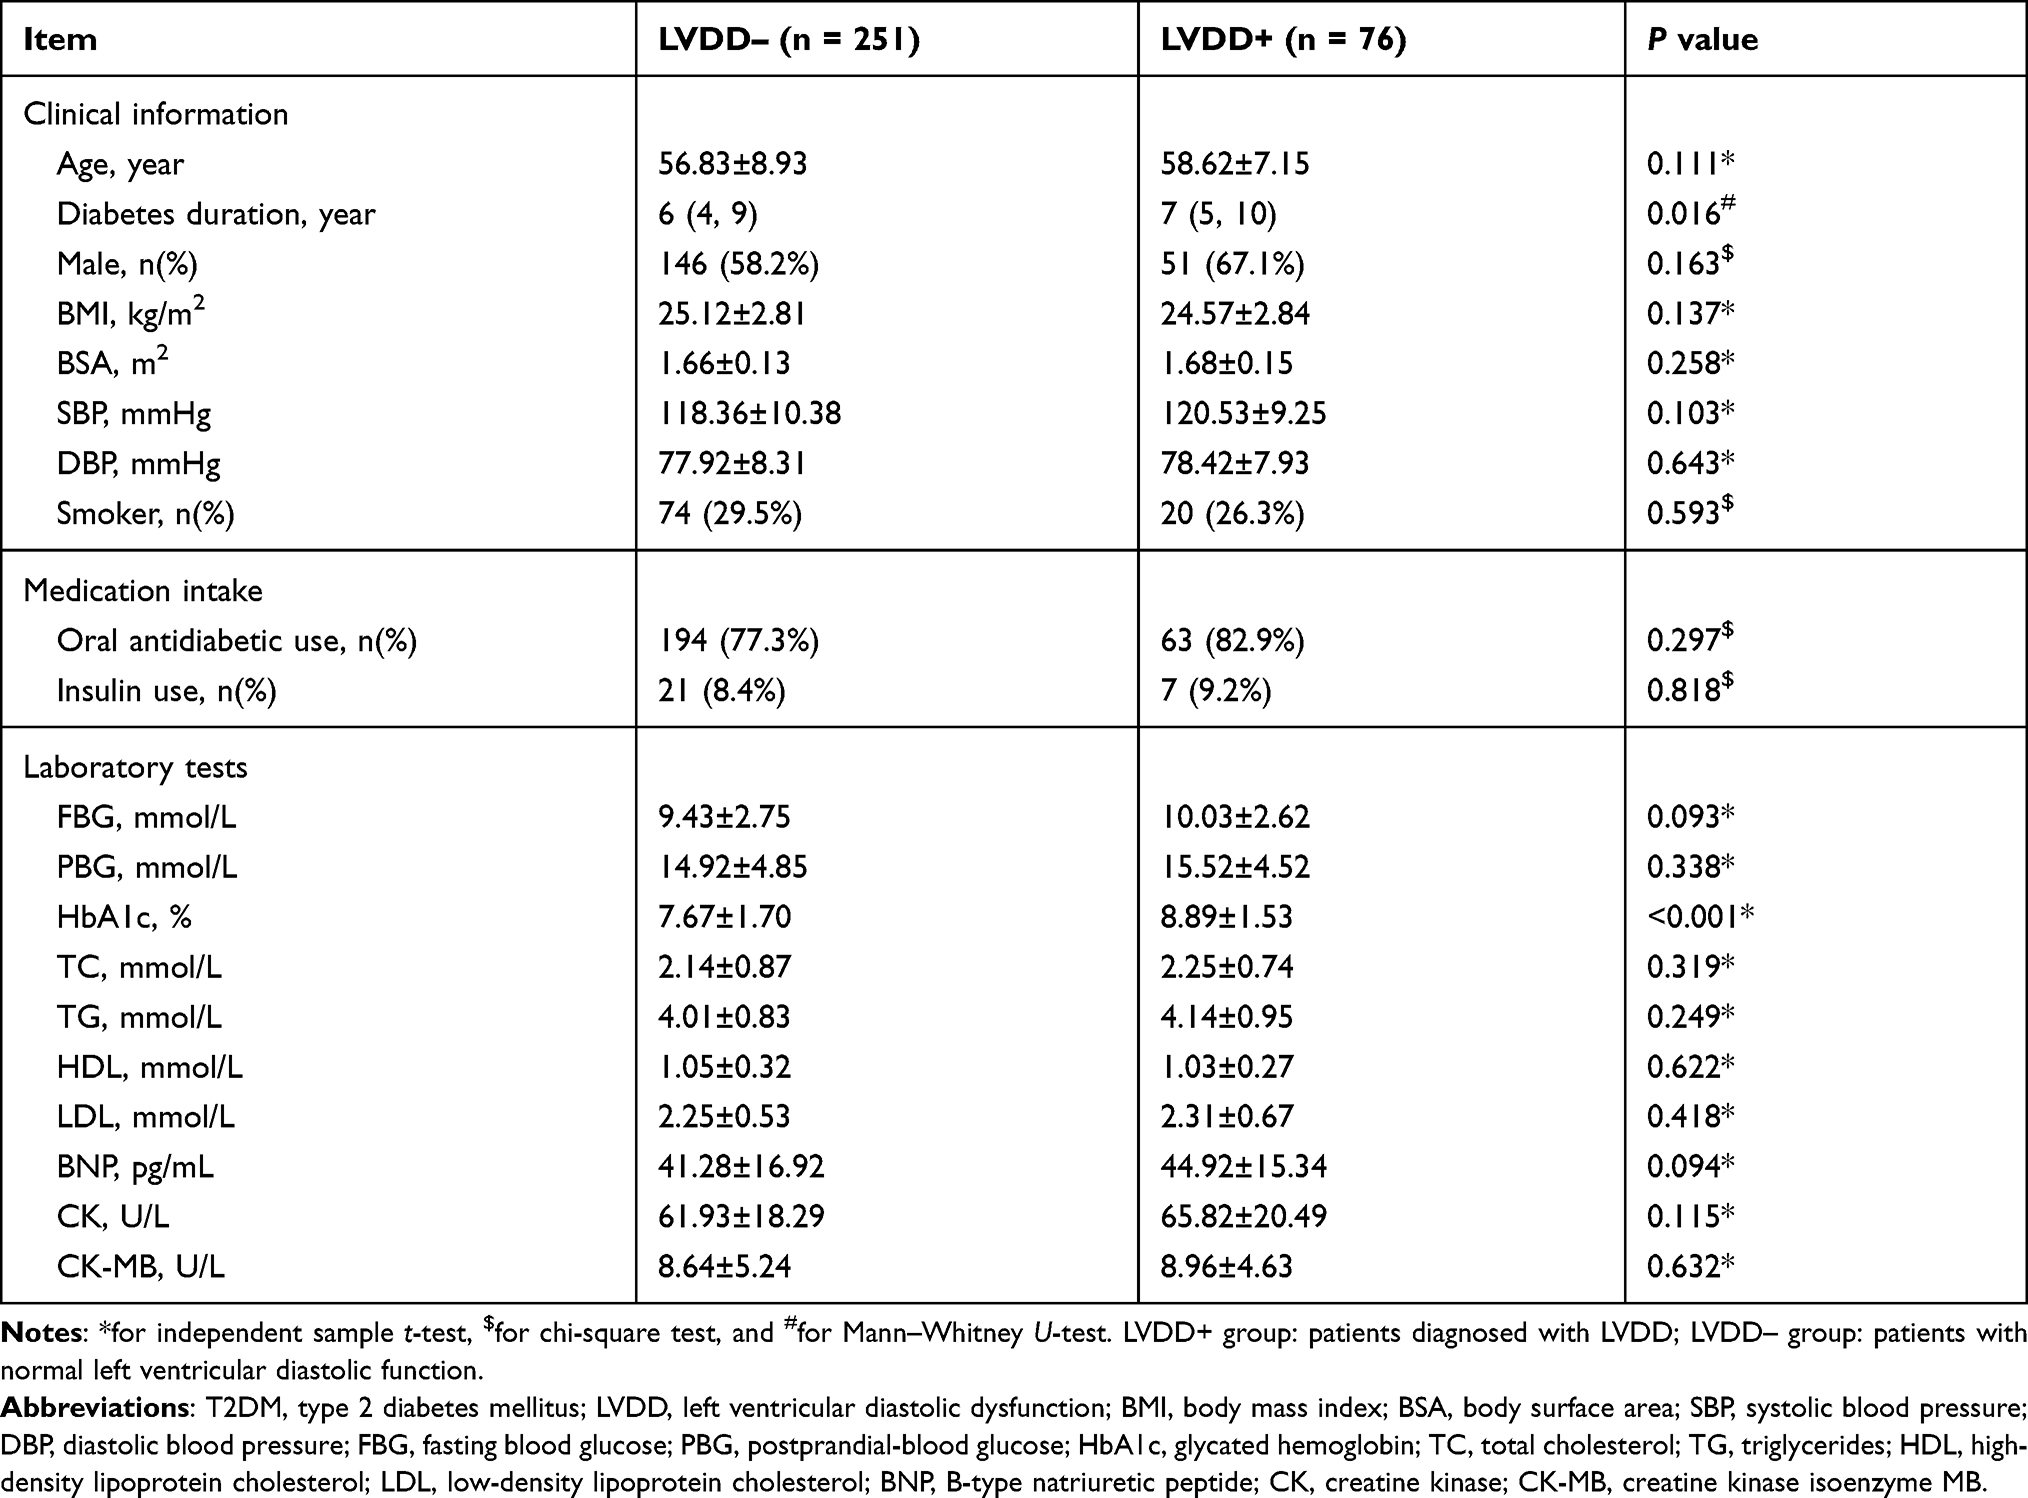 |
Table 1 Comparison of Clinical Characteristics in T2DM Patients Between LVDD– and LVDD+ Groups |
General Echocardiographic Findings
The general echocardiographic findings between the two groups are described in Table 2. All T2DM patients had preserved systolic function with an LVEF ≥ 55%. IVST, PWT, left ventricular dimension, LVEF, transmitral inflow velocities, E/A ratio, DT, and IVRT and were similar in patients between LVDD– and LVDD+ groups (all P values > 0.05). Nonetheless, T2DM patients with LVDD had differing degrees of impaired diastolic function as reflected by higher LAVI, TRPV, average E/e’, and lower septal and lateral e’ (all P values < 0.05).
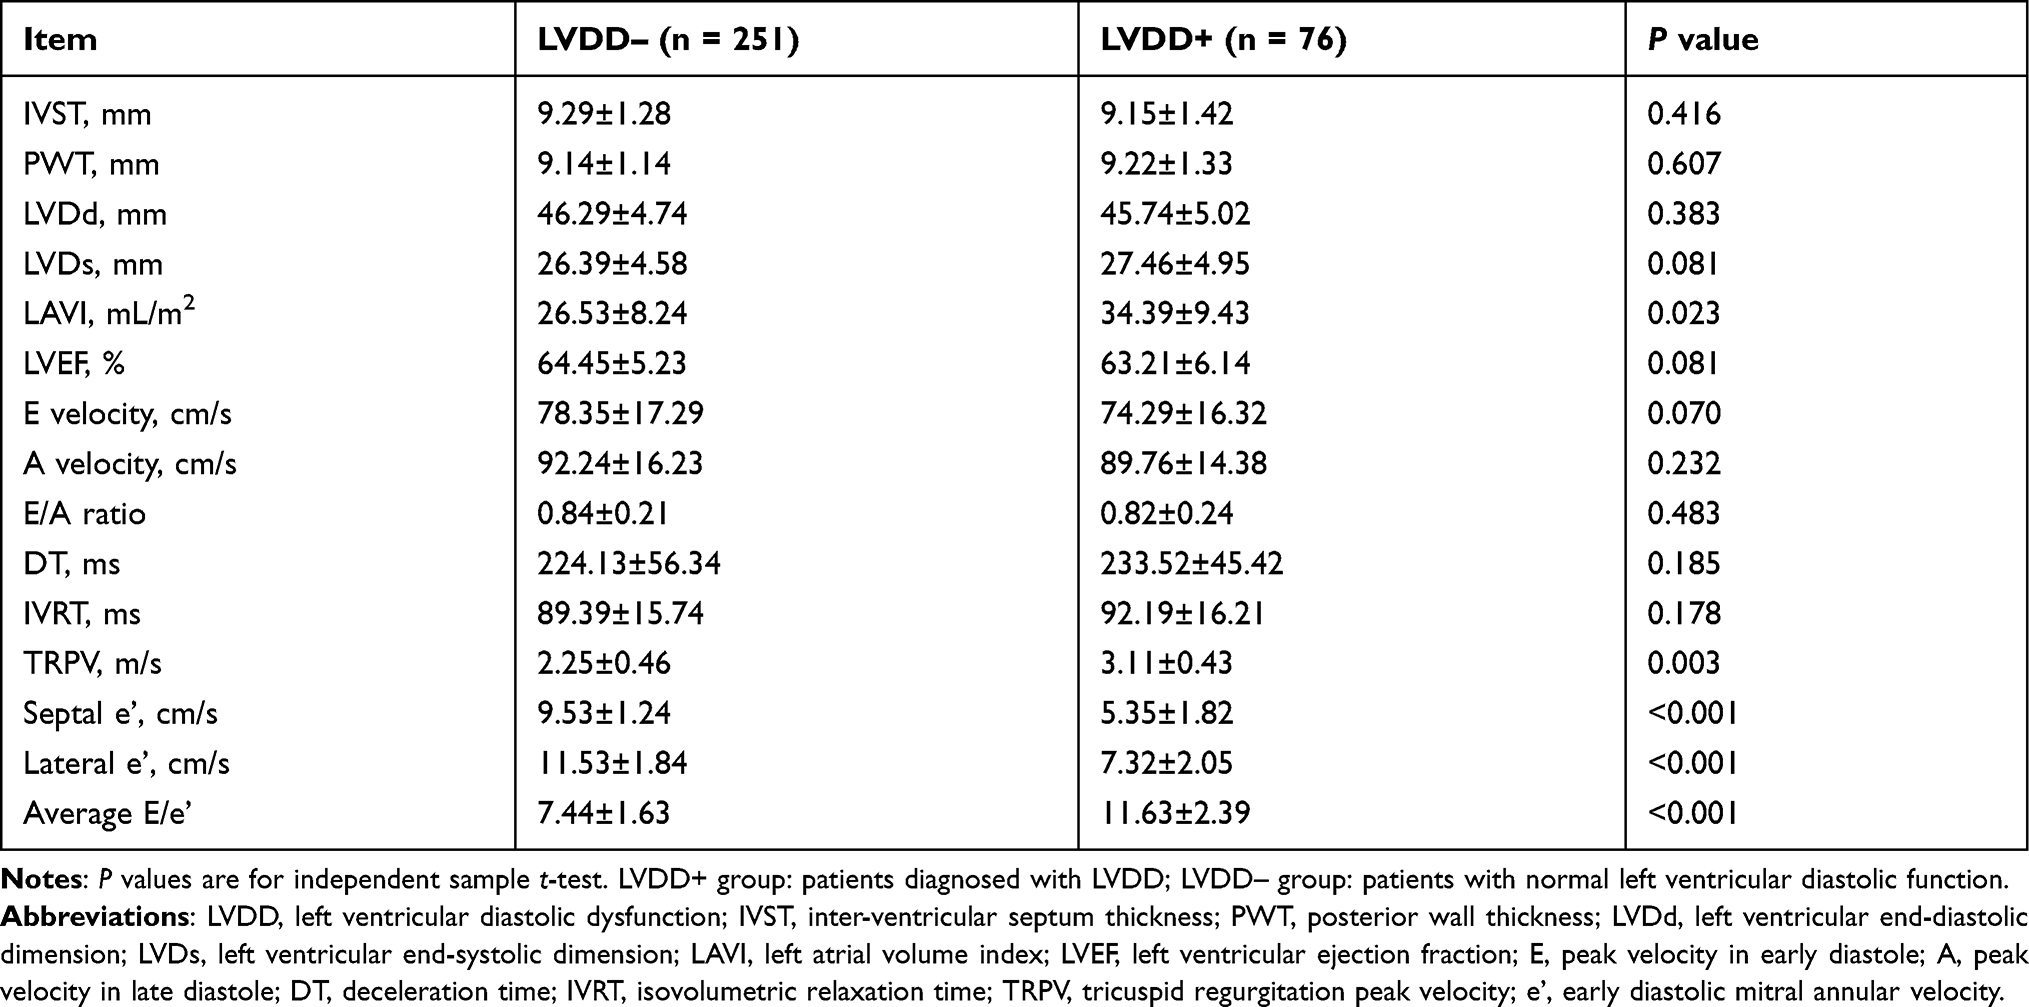 |
Table 2 Comparison of General Echocardiographic Parameters Between LVDD– and LVDD+ Groups |
MCE
For the MCE parameters of subjects, T2DM patients in the LVDD+ group had significantly lower β and A*β compared with those in the LVDD– group (both P values < 0.05). MCE parameter A in the LVDD+ group was lower compared to the LVDD– group but statistically it was not significant (P value = 0.102) (Table 3). The individual MBF distributions for the LVDD– and LVDD+ patients are plotted in Figure 4.
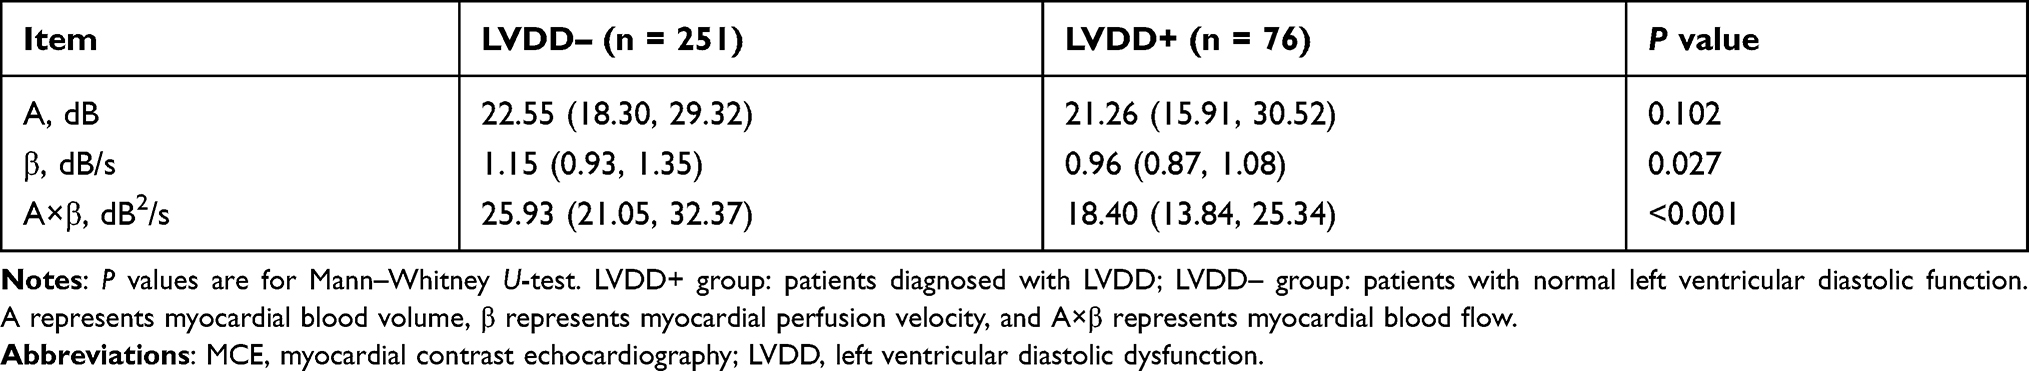 |
Table 3 Comparison of MCE Parameters Between LVDD– and LVDD+ Groups |
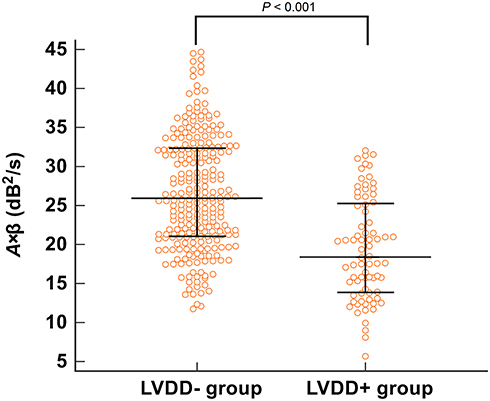 |
Figure 4 Comparison of MBF (represented by A×β) between LVDD– and LVDD+ groups. Bars represent median with interquartile 25–75. The MBF in the LVDD+ group is significantly lower than in the LVDD– group (P value < 0.05). LVDD+ group: patients diagnosed with LVDD; LVDD– group: patients with normal left ventricular diastolic function. Abbreviations: MBF, myocardial blood flow; LVDD, left ventricular diastolic dysfunction. |
Intra- and Inter-Observer Reproducibility
MCE parameter A×β was selected to evaluate intra-observer and inter-observer reproducibility. Both A×β obtained good to excellent ICC (0.947 and 0.902, respectively), with small standard deviations in Bland–Altman plots (−0.1 ± 3.1 and −0.5 ± 5.3, respectively) (Figure 5), indicating good consistency.
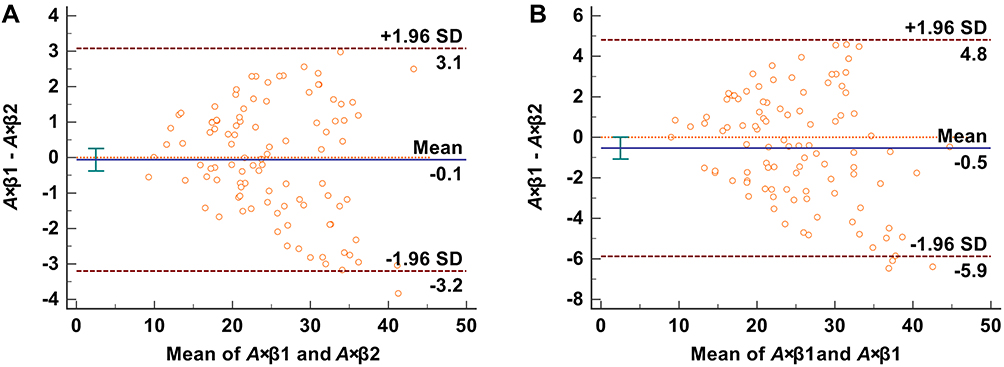 |
Figure 5 Bland–Altman plots for intra-observer (A) and inter-observer (B) reproducibility of MCE parameter A×β. Both show small standard deviations. A×β represents myocardial blood flow. Abbreviation: MCE, myocardial contrast echocardiography. |
MCE Parameters in Diagnosing LVDD of T2DM Patients
A ROC curve was constructed for MCE parameter A×β to explore its value in the diagnosis of LVDD in T2DM patients (Figure 6). Although it had diagnostic value with statistical significance for LVDD, the accuracy was not high (AUC = 0.745). A×β cut-off of 17.62dB2/s provided high specificity (90.4%) but relatively low sensitivity (44.7%), which indicated that it was less suitable for independent diagnosis of LVDD.
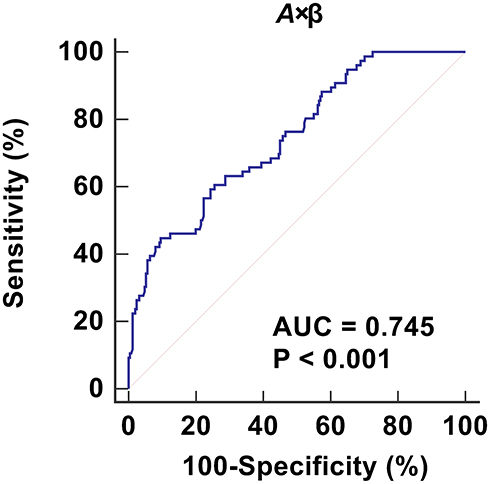 |
Figure 6 ROC curve of MCE parameter A×β in the diagnosis of LVDD in T2DM patients. A×β represents myocardial blood flow. Abbreviations: ROC, receiver operator characteristic; MCE, myocardial contrast echocardiography; LVDD, left ventricular diastolic dysfunction; T2DM, type 2 diabetes mellitus. |
Correlations of Diabetes Duration and HbA1c with MCE
The correlations of A×β with both diabetes duration and HbA1c are shown in Figure 7. A×β was negatively correlated with diabetes duration and HbA1c (r = −0.350 and −0.226, both P values < 0.001).
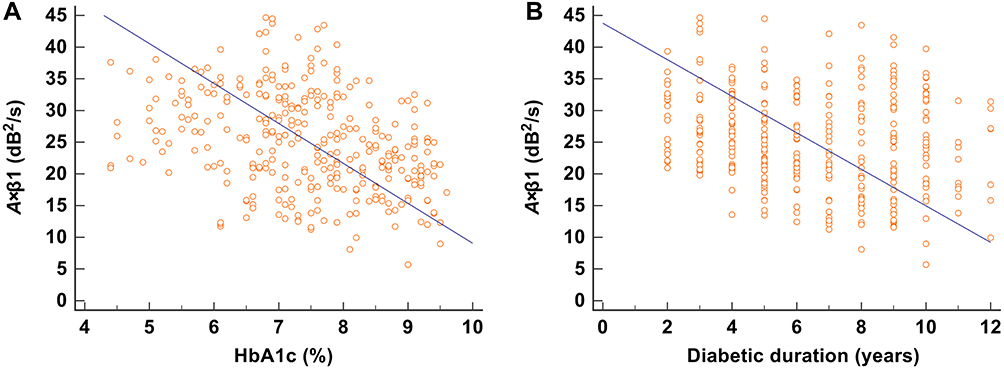 |
Figure 7 Correlations of A×β with HbA1c (A) and diabetic duration (B). A×β is negatively correlated with HbA1c and diabetic duration (r = −0.226 and −0.350, both P values < 0.001). |
Discussion
In the present study, we sought to reveal the characteristics of MP in T2DM patients who were independent of coronary artery disease, valve dysfunction, and hypertension, and explore its status in subclinical LVDD caused by DCM. We found that the incidence of LVDD should not be ignored (23.2%) in normotensive and asymptomatic T2DM, indicating the necessity of early intervention. The results of this study revealed that the MBF (represented by A×β) in T2DM patients with LVDD was significantly lower than in patients without LVDD. The ROC curve indicated that the decrease of A×β helped warn the occurrence of LVDD although it was not suitable for the independent diagnosis of LVDD. As evidenced by the correlation analyses of A×β values, patients with poor glycemic control and longer diabetes duration had poorer MBF, and such patients were more likely to suffer from LVDD. These results indicated that the monitoring of the trend of variations in A×β would allow timely initiation of treatment strategies to delay and prevent the progression of DCM.
Although MCE is used to measure the MP of DCM, it does not form a standard for diagnosing DCM.18 Current research has reported that LVDD is the earliest functional change of DCM.19 Therefore, identifying early or even subclinical LVDD may help prevent or delay the progression of DCM.8,20 MP dysfunction induced by diabetic microangiopathy as one of the main causes of LVDD is allowed for quantitative evaluation by MCE. In this way, the evaluation of the difference in MP of DCM at different stages is valuable, and it is expected to be used for direct observations of the improvement of MP after effective glycemic control.
It is known that DCM may be in a subclinical state for a long time before clinical signs or symptoms appear.21 The most commonly observed preclinical abnormalities of asymptomatic T2DM is LVDD.8 However, a large proportion of T2DM patients undergo subtle changes in cardiac function before the diagnosis of LVDD. Unlike previous studies, our study focused on observing the characteristics of MP in more than 300 asymptomatic and normotensive T2DM patients with MCE, which contributed to a better understanding of the MP in subclinical DCM.
Our results revealed that the main difference between T2DM patients with and without LVDD was HbA1c and diabetes duration, suggesting that myocardial function was impaired in T2DM patients with long-term poor glycemic control. HbA1C emerges as an important indicator of diastolic dysfunction in T2DM. It has proven to be associated with the risk of heart failure in T2DM patients.22 Similarly, Chaudhary et al23 found that higher HbA1C level was strongly associated with the presence of LVDD. With the prolongation of the diabetes duration, the function of islet cells gradually declines, leading to the deterioration of glycemic control.24 These findings support the notion that patients with long-term T2DM have poor glycemic control, which is exactly the key mechanism in the prevention of LVDD.25,26
Coronary microangiopathy has been recognized as a significant contributor to DCM.27 Since it causes a gradual decrease in perfusion along the base-to-apex, impaired MP may first appear in the apex.28 In addition to this, considering the adequate image quality in the apex and diagnosis efficiency in clinical practices, only the apex was selected for the MCE examination. This study revealed significant differences in the MP velocity and MBF between T2DM patients with and without LVDD. It verified the potential contribution from myocardial microvascular disease. Changes in myocardial microvasculature in diabetic patients have been demonstrated by histopathological studies.29
It is known that echocardiography is currently considered as the commonly used non-invasive examination to assess the presence and degree of LVDD.11 However, some normotensive subjects with mild and early LVDD failed to be diagnosed by standard echocardiography.30 In this study, although the MCE-derived MBF (A×β) was inappropriate to diagnose LVDD independently, it indicated that the probability of developing LVDD increased significantly when the MBF was close to the cut-off value of 17dB2/s. Besides, we have to recognize that the MBF results reported in various studies are quite different due to different ultrasound instruments and technical protocols. We hence suggest observing the tendency of MBF variation in T2DM patients using the same equipment and technical recommendation to assess the status of DCM.
The correlation analyses in the present study indicated that the MCE-derived MBF was negatively correlated with HbA1c and diabetes duration. This is consistent with the report of UK Prospective Diabetes Study, which proposed that strict glycemic control would effectively reduce diabetic microvascular disease, especially when the control was achieved in the early stage.31 Similarly, Voulgari supported this view by demonstrating that good glycemic control was associated with a lower incidence of DCM.32 In addition, Runqing et al33 observed that when the microcirculation is irreversibly affected by glycemic elevation, strict glycemic control may not be beneficial. Thus, MCE demonstrated the unique potential to evaluate the microvascular function of T2DM patients receiving treatments targeted to HbA1C for the prevention of LVDD.
Our study is limited by the evidence of coronary computed tomography angiography and only relied on medical history, electrocardiogram, echocardiography, and laboratory tests to exclude patients with CAD because it is not clinically recommended to perform computed tomography angiography on patients with low risk of CAD. Subsequently, we do not conduct a follow-up study to investigate whether the MP is improved when strict glycemic control is applied to patients with higher HbA1C levels. Further studies are required to investigate the role of MCE in T2DM patients.
Conclusion
The present study demonstrated that quantitative MCE examination was feasible for detecting MP abnormalities in asymptomatic and normotensive T2DM patients. Although the MCE-derived MBF values of T2DM patients with subclinical LVDD were better than those with diagnosed LVDD, it impaired with the increase of HbA1c and diabetes duration. Furthermore, quantitative measurements of MCE used to assess MBF may be useful for monitoring glycemic control in T2DM patients with DCM.
Data Sharing Statement
The data during the current study are available from the corresponding author on reasonable request.
Ethical Approval
Ethical approval for the study was obtained from the institutional review board of Shuguang Hospital affiliated Shanghai University of TCM (2020-901-110-01).
Informed Consent
Informed consents were waived for this retrospective study because patients’ consent to review their medical records were not required by the institutional review board.
Confidentiality Statement
Information relating to a patient’s health-care history, diagnosis, condition, treatment, or evaluation is considered individually identifiable health information. Confidentiality of this health information is maintained at all times, and may only be disclosed with the express written consent of the patient.
Author Contributions
Yi Liu and Jing Ma contributed equally in this study and are co-first authors. Study design: Yi Liu, Jing Ma, Jia Guo, and Hao Lu. Data collection and analysis: Yi Liu, Jing Ma, Yan Zhang, and Yilei Chen. Supervision: Yi Liu, Jia Guo, and Hao Lu. Statistics: Yi Liu, Jing Ma, Yan Zhang, and Yilei Chen. Manuscript writing: Yi Liu, Jing Ma, Yan Zhang, and Yilei Chen. Manuscript revision: Yi Liu, Jing Ma, Jia Guo, and Hao Lu. Approval of the manuscript: all authors. All authors contributed to data analysis, drafting or revising the article, have agreed on the journal to which the article will be submitted, gave final approval of the version to be published, and agree to be accountable for all aspects of the work.
Funding
National Natural Science Foundation of China (82074381); Shanghai Natural Science Foundation (18ZR1435400).
Disclosure
The authors declare that they have no conflicts of interest.
References
1. Boudina S, Abel ED. Diabetic cardiomyopathy revisited. Circulation. 2007;115(25):3213–3223. doi:10.1161/circulationaha.106.679597
2. Tillquist MN, Maddox TM. Update on diabetic cardiomyopathy: inches forward, miles to go. Curr Diab Rep. 2012;12(3):305–313. doi:10.1007/s11892-012-0274-7
3. Huynh K, Bernardo BC, McMullen JR, Ritchie RH. Diabetic cardiomyopathy: mechanisms and new treatment strategies targeting antioxidant signaling pathways. Pharmacol Ther. 2014;142(3):375–415. doi:10.1016/j.pharmthera.2014.01.003
4. Hippisley-Cox J, Coupland C. Diabetes treatments and risk of heart failure, cardiovascular disease, and all cause mortality: cohort study in primary care. BMJ. 2016;354:i3477. doi:10.1136/bmj.i3477
5. Cubbon RM, Adams B, Rajwani A, et al. Diabetes mellitus is associated with adverse prognosis in chronic heart failure of ischaemic and non-ischaemic aetiology. Diab Vasc Dis Res. 2013;10(4):330–336. doi:10.1177/1479164112471064
6. Paolillo S, Marsico F, Prastaro M, et al. Diabetic cardiomyopathy: definition, diagnosis, and therapeutic implications. Heart Fail Clin. 2019;15(3):341–347. doi:10.1016/j.hfc.2019.02.003
7. Bertoni AG, Hundley WG, Massing MW, Bonds DE, Burke GL, Goff DC. Heart failure prevalence, incidence, and mortality in the elderly with diabetes. Diabetes Care. 2004;27(3):699–703. doi:10.2337/diacare.27.3.699
8. Grigorescu ED, Lacatusu CM, Floria M, Mihai BM, Cretu I, Sorodoc L. Left ventricular diastolic dysfunction in type 2 diabetes-progress and perspectives. Diagnostics. 2019;9(3). doi:10.3390/diagnostics9030121
9. Vinereanu D, Nicolaides E, Tweddel AC, et al. Subclinical left ventricular dysfunction in asymptomatic patients with Type II diabetes mellitus, related to serum lipids and glycated haemoglobin. Clin Sci (Lond). 2003;105(5):591–599. doi:10.1042/cs20030168
10. Patil MB, Burji NP. Echocardiographic evaluation of diastolic dysfunction in asymptomatic type 2 diabetes mellitus. J Assoc Physicians India. 2012;60:23–26.
11. Ernande L, Bergerot C, Rietzschel ER, et al. Diastolic dysfunction in patients with type 2 diabetes mellitus: is it really the first marker of diabetic cardiomyopathy? J Am Soc Echocardiogr. 2011;24(11):1268–1275.e1261. doi:10.1016/j.echo.2011.07.017
12. Lorenzo-Almorós A, Tuñón J, Orejas M, Cortés M, Egido J, Lorenzo Ó. Diagnostic approaches for diabetic cardiomyopathy. Cardiovasc Diabetol. 2017;16(1):28. doi:10.1186/s12933-017-0506-x
13. Senior R, Becher H, Monaghan M, et al. Clinical practice of contrast echocardiography: recommendation by the European Association of Cardiovascular Imaging (EACVI) 2017. Eur Heart J Cardiovasc Imaging. 2017;18(11):1205–1205af. doi:10.1093/ehjci/jex182
14. American Diabetes Association. Standards of medical care in diabetes–2010. Diabetes Care. 2010;33(Suppl1):S11–61. doi:10.2337/dc10-S011
15. Lang RM, Bierig M, Devereux RB, et al. Recommendations for chamber quantification: a report from the American Society of Echocardiography’s Guidelines and Standards Committee and the Chamber Quantification Writing Group, developed in conjunction with the European Association of Echocardiography, a branch of the European Society of Cardiology. J Am Soc Echocardiogr. 2005;18(12):1440–1463. doi:10.1016/j.echo.2005.10.005
16. Nagueh SF, Smiseth OA, Appleton CP, et al. Recommendations for the Evaluation of Left Ventricular Diastolic Function by Echocardiography: an Update from the American Society of Echocardiography and the European Association of Cardiovascular Imaging. J Am Soc Echocardiogr. 2016;29(4):277–314. doi:10.1016/j.echo.2016.01.011
17. Wei K, Jayaweera AR, Firoozan S, Linka A, Skyba DM, Kaul S. Quantification of myocardial blood flow with ultrasound-induced destruction of microbubbles administered as a constant venous infusion. Circulation. 1998;97(5):473–483. doi:10.1161/01.cir.97.5.473
18. Maya L, Villarreal FJ. Diagnostic approaches for diabetic cardiomyopathy and myocardial fibrosis. J Mol Cell Cardiol. 2010;48(3):524–529. doi:10.1016/j.yjmcc.2009.06.021
19. Felício JS, Koury CC, Carvalho CT, et al. Present Insights on Cardiomyopathy in Diabetic Patients. Curr Diabetes Rev. 2016;12(4):384–395. doi:10.2174/1573399812666150914120529
20. Park J, Kim JS, Kim SH, et al. Subclinical left ventricular diastolic dysfunction and incident type 2 diabetes risk: the Korean Genome and Epidemiology Study. Cardiovasc Diabetol. 2017;16(1):36. doi:10.1186/s12933-017-0519-5
21. Hayat SA, Patel B, Khattar RS, Malik RA. Diabetic cardiomyopathy: mechanisms, diagnosis and treatment. Clin Sci (Lond). 2004;107(6):539–557. doi:10.1042/cs20040057
22. Tsapas A, Avgerinos I, Karagiannis T, et al. Comparative Effectiveness of Glucose-Lowering Drugs for Type 2 Diabetes: a Systematic Review and Network Meta-analysis. Ann Intern Med. 2020;173(4):278–286. doi:10.7326/m20-0864
23. Chaudhary AK, Aneja GK, Shukla S, Razi SM. Study on Diastolic Dysfunction in Newly Diagnosed Type 2 Diabetes Mellitus and its Correlation with Glycosylated Haemoglobin (HbA1C). J Clin Diagn Res. 2015;9(8):Oc20–22. doi:10.7860/jcdr/2015/13348.6376
24. Saisho Y. β-cell dysfunction: its critical role in prevention and management of type 2 diabetes. World J Diabetes. 2015;6(1):109–124. doi:10.4239/wjd.v6.i1.109
25. Mannucci E, Monami M, Dicembrini I, Piselli A, Porta M. Achieving HbA1c targets in clinical trials and in the real world: a systematic review and meta-analysis. J Endocrinol Invest. 2014;37(5):477–495. doi:10.1007/s40618-014-0069-6
26. Jia G, Whaley-Connell A, Sowers JR. Diabetic cardiomyopathy: a hyperglycaemia- and insulin-resistance-induced heart disease. Diabetologia. 2018;61(1):21–28. doi:10.1007/s00125-017-4390-4
27. Knapp M, Tu X, Wu R. Vascular endothelial dysfunction, a major mediator in diabetic cardiomyopathy. Acta Pharmacol Sin. 2019;40(1):1–8. doi:10.1038/s41401-018-0042-6
28. Gould KL, Nakagawa Y, Nakagawa K, et al. Frequency and clinical implications of fluid dynamically significant diffuse coronary artery disease manifest as graded, longitudinal, base-to-apex myocardial perfusion abnormalities by noninvasive positron emission tomography. Circulation. 2000;101(16):1931–1939. doi:10.1161/01.cir.101.16.1931
29. Adameova A, Dhalla NS. Role of microangiopathy in diabetic cardiomyopathy. Heart Fail Rev. 2014;19(1):25–33. doi:10.1007/s10741-013-9378-7
30. Tao L, Huang X, Xu M, et al. Value of circulating miRNA-21 in the diagnosis of subclinical diabetic cardiomyopathy. Mol Cell Endocrinol. 2020;518:110944. doi:10.1016/j.mce.2020.110944
31. UK Prospective Diabetes Study (UKPDS) Group. Intensive blood-glucose control with sulphonylureas or insulin compared with conventional treatment and risk of complications in patients with type 2 diabetes (UKPDS 33). Lancet. 1998;352(9131):837–853. doi:10.1016/S0140-6736(98)07019-6
32. Voulgari C, Papadogiannis D, Tentolouris N. Diabetic cardiomyopathy: from the pathophysiology of the cardiac myocytes to current diagnosis and management strategies. Vasc Health Risk Manag. 2010;6:883–903. doi:10.2147/vhrm.S11681
33. Huang R, Abdelmoneim SS, Nhola LF, Mulvagh SL. Relationship between HgbA1c and myocardial blood flow reserve in patients with type 2 diabetes mellitus: noninvasive assessment using real-time myocardial perfusion echocardiography. J Diabetes Res. 2014;2014:243518. doi:10.1155/2014/243518
 © 2021 The Author(s). This work is published and licensed by Dove Medical Press Limited. The full terms of this license are available at https://www.dovepress.com/terms.php and incorporate the Creative Commons Attribution - Non Commercial (unported, v3.0) License.
By accessing the work you hereby accept the Terms. Non-commercial uses of the work are permitted without any further permission from Dove Medical Press Limited, provided the work is properly attributed. For permission for commercial use of this work, please see paragraphs 4.2 and 5 of our Terms.
© 2021 The Author(s). This work is published and licensed by Dove Medical Press Limited. The full terms of this license are available at https://www.dovepress.com/terms.php and incorporate the Creative Commons Attribution - Non Commercial (unported, v3.0) License.
By accessing the work you hereby accept the Terms. Non-commercial uses of the work are permitted without any further permission from Dove Medical Press Limited, provided the work is properly attributed. For permission for commercial use of this work, please see paragraphs 4.2 and 5 of our Terms.