")
Back to Journals » Journal of Experimental Pharmacology » Volume 8
Characteristics of intracellular Ca2+ signals consisting of two successive peaks in hepatocytes during liver regeneration after 70% partial hepatectomy in rats
Authors Taira Z, Ueda Y, Monmasu H, Yamase D, Miyake S, Shiraishi M
Received 9 February 2016
Accepted for publication 8 June 2016
Published 3 October 2016 Volume 2016:8 Pages 21—33
DOI https://doi.org/10.2147/JEP.S106084
Checked for plagiarism Yes
Review by Single anonymous peer review
Peer reviewer comments 4
Editor who approved publication: Professor Bal Lokeshwar
Zenei Taira, Yukari Ueda, Hiroshi Monmasu, Daisuke Yamase, Sayaka Miyake, Maya Shiraishi
Faculty of Pharmaceutical Sciences, Tokushima Bunri University, Tokushima, Japan
Abstract: Two specific signals for regulating liver regeneration were found after 70% partial hepatectomy (PH) in rats. The first finding was a sustained increasing signal of intracellular Ca2+ ([Ca2+]i) in hepatocytes, consisting of two successive peaks with the first narrow peak at 1 hour and the second broad peak increasing by day 3 and then returning to normal by day 4. The second finding was an abnormal peak in the restoring ratio (Rr) curve of liver regeneration after 70% PH at day 4, where the Rr exceeded 100% temporarily, returned to a lower level, and then proceeded to a termination phase of liver regeneration. For 4 days around the two successive [Ca2+]i peaks and abnormal peak, various physiological activities were induced to promote liver regeneration after 70% PH. mRNA expression of genes encoding Ca2+-binding proteins S100A4 and calpain was induced between the two Ca2+ peaks. Hepatocytes underwent synchronous cell proliferation as the liver was restored from 30% to 70% at day 4, and significant expression of VEGF mRNA at around day 4 promoted angiogenesis to remodel the sinusoidal system. Cytochrome P450 activity levels in microsomes and alanine aminotransferase values at 24 hours after CCl4 administration were decreased after 70% PH, which recovered transiently to the control level at day 4, returned to the decreased level, and then slowly recovered by day 10. Thus, these results indicate that day 4 is important during liver regeneration after 70% PH.
Keywords: partial hepatectomy, ratio of liver regeneration, intracellular Ca2+, S100A4, termination signal
Introduction
Liver consists of various hepatic cells, including hepatocytes, biliary epithelial cells, sinusoidal endothelial cells, stellate cells, and Kupffer cells, which perform principal functions including detoxification, protein synthesis, and production of biochemical molecules necessary for digestion. Although normal adult liver cells are almost quiescent and only a small percentage undergo cell division,1–3 liver regeneration is triggered immediately by various hepatic injuries including partial hepatectomy (PH) and hepatocyte loss caused by viral or chemical injury.4,5 Seventy percent PH in rats, which was devised by Higgins and Anderson in 1931, is an excellent experimental model to induce liver regeneration, in which the liver loses 70% of its functions including detoxification, protein synthesis, production of biochemical molecules necessary for digestion, and blood flow.6 This loss of function causes liver failure and requires liver regeneration to restore the functions.7 The remnant liver lobes compensate for the liver loss by initially increasing in size through hypertrophy, followed by cell proliferation within 24 hours. Most of the liver mass is restored in 3 days and complete mass restoration by 7–10 days.3,6 Cell proliferation is initiated in hepatocytes and then other cell types. During this period, hepatocytes preserve their liver-specific functions while completing one or more rounds of synchronous cell division. Even liver regeneration triggered by 30% PH is able to restore the liver by hypertrophy alone.1,8,9 This liver regeneration process consists of three phases: 1) initiation or priming progression to enter the cell cycle for repeated division, 2) a proliferative phase restoring the liver volume before another insult, and 3) termination of growth and balancing the resultant size of the liver to comply with the functional demands of the organism.1,3,4,10
Liver regeneration is a highly complex and organized process. Numerous studies have revealed the roles of various factors in these processes, including cytokines, growth factors, metabolites, platelet-derived serotonin, stem cell factors, and innate inflammatory response factors.1,3,4,7,10–12 For example, during the priming step, interleukin (IL)-6, tumor necrosis factor-α, and other cytokines induce transition from G0 to G1 phase in the cell cycle, followed by cell cycle progression through G1 phase, which is stimulated by hepatocyte growth factor and transforming growth factor-α. IL-6 is a critical inducer of the acute phase response in the liver. Such networks are powerful promoters of liver regeneration after PH, but they are less potent to trigger the switch from PH.3
In recent studies on early signals of liver regeneration after PH, the stress signal inducing sinusoidal endothelial cells has been suggested to be critical for triggering liver regeneration after PH.9,13–15 Roles for hedgehog,16 extracellular ATP,17–19 nitric oxide,13,14 intracellular Ca2+ ([Ca2+]i),14,20,21 and/or crosstalk between them14,15 have been proposed in such cellular processes including differentiation, induction, development, motility, secretion, and cell proliferation.21,22 Calcium is a second messenger, and the roles of calcium in liver regeneration include protection against cell death and cell cycle regulation. Cytosolic calcium signals promote liver regeneration by enhancing the progression of hepatocytes through the cell cycle.21,22 Hepatocytes enter the cell cycle via the Ca2+/calmodulin complex. Hence, cell cycle progression is regulated by calcium/calmodulin-dependent pathways.20,22 Furthermore, in another liver regeneration model, we have found a novel increase in [Ca2+]i with two successive peaks during liver regeneration in mice after liver injury caused by intraperitoneal (ip) injection of a low dose of carbon tetrachloride (CCl4) (0.2 mL/kg of body weight).23 These two successive Ca2+ peaks consist of a significant increase in the first narrow peak at 30 minutes after CCl4 injection, which returns to the control level after 2 hours, followed by a gradual increase to the second peak at day 3.5 after CCl4 injection, which returns to the control level by day 4. Specifically, the Ca2+ signals in hepatocytes are switched between sensitivity and resistance to cell death by intoxication. These successive peaks of increased [Ca2+]i in hepatocytes have not been observed in other studies after CCl4-induced liver injury. However, a [Ca2+]i increase occurs by inactivating calcium uptake of the endoplasmic reticulum in liver microsomes of rats with liver injury induced by the administration of CC14 (2.5 mL/kg of body weight).24–26 The ATP-dependent calcium uptake activity in the endoplasmic reticulum remains low for 48 hours and then slowly returns to control levels, even though the calcium uptake activity of the liver mitochondria is unaffected. Furthermore, in the first 12 hours after CCl4 administration, the calcium content of the liver tissue and mitochondria shows a relatively slow increase, followed by a much larger influx of calcium into the tissue and mitochondria. This sequence of events suggest a critical role of the calcium pump activity of the endoplasmic reticulum in liver metabolism. Such [Ca2+]i peaks have also been observed in hepatocytes after PH,27 thereby protecting the cells against intoxication at days 1 and 2.5,28,29
In this study, we observed the phenomena occurring in a narrow time span at precise intervals to clarify the time course of [Ca2+]i concentrations and liver functions during liver regeneration after 70% PH.
Materials and methods
Materials
Collagenase, bovine serum albumin (BSA), sodium dithionite (Na2S2O4), sodium dodecyl sulfate, CCl4, 4-(2-hydroxyethyl)-1-piperazineethansulfonic acid (Hepes), ethylene glycol tetraacetic acid (EGTA), tris(hydroxymethyl)aminomethane (Tris), trypan blue, propidium iodide (PI), Evans blue (EB), and salicylamide (SAM) were purchased from Wako Pure Chemical Industries Ltd. (Osaka, Japan) Mayer’s hematoxylin and eosin Y (H&E) were purchased from Merck KGaA (Darmstadt, Germany). DNase-free RNase was obtained from Sigma-Aldrich (St. Louis, MO, USA). Other reagents were the highest grade available and purchased from commercial sources.
Animal treatments
Male Donryu rats (6–7 weeks old, 250–300 g) were obtained from SLC Co., Ltd. (Shizuoka, Japan) and were maintained under a 14:10-hour light–dark cycle. Animals had free access to food (commercial diet, MF pellets; Oriental Animal Foods Co., Osaka, Japan) and water during the experimental period. Some rats were intraperitoneally injected with 0.2 mL CCl4/kg of body weight in 20% (v/v) olive oil. After 24 hours, blood was collected from the tail vein, and serum alanine aminotransferase (ALT) activity (IU/L) was measured spectroscopically. The animals underwent surgery between 5pm and 7pm. Animal experiments were approved by the Animal Care and Use Committee at Tokushima Bunri University, Tokushima, Japan, as outlined in the Guide for the Care and Use of Laboratory Animals (Department of Health and Human Services Publication No. [NIH] 85-23, Revised 1985).
Liver resection for 70% PH
Rats were anesthetized with pentobarbital sodium, and the abdominal cavity was opened by a midline incision. The median and left lateral lobes were removed according to the Higgins and Anderson method,6 and the remnant liver lobes were left in place. The cavity was closed by a suture within 5 minutes. In a separate experiment, the wet weight of the resected liver and regenerating liver was measured to evaluate regeneration during the 21 days after 70% PH.
Biochemical assays
Blood was collected from the caudal vein and centrifuged at 2,000× g, and the serum ALT activity was measured spectroscopically at 550 nm using a GPT-UV diagnostic kit (Wako Pure Chemical Industries Ltd.). Rats with 70% PH were intraperitoneally administered CCl4 at 0.2 mL/kg of body weight in 20% olive oil at various days. The peak value of serum ALT was then measured after 24 hours. The hepatic microsomal cytochrome P450 content in rats after 70% PH was also measured by calculating the difference between the reduced and CO spectrum using a reducing reagent, sodium dithionite, as described previously.30
Pharmacokinetic analyses
After 70% PH, the rats were anesthetized with pentobarbital sodium, and a polyethylene cannula was inserted into their femoral artery. The rats were allowed to recover from anesthesia for at least 1.5 hours after surgery. Then, EB or SAM was administered intravenously via the tail vein, and a 0.3 mL sample of blood was collected through the cannula. Blood samples were centrifuged at 2,000× g for 2 minutes, and the serum drug concentration was determined as follows. EB (10 mg/kg of body weight) was administered intravenously, and then serum EB concentrations were determined several times for 120 minutes by the absorbanvce method.31 SAM (68.5 mg/kg of body weight) was intravenously administered, and then serum SAM concentrations were determined several times for 90 minutes by fluorescence at 415 nm after excitation at 335 nm.32 For pharmacokinetics, the metabolic parameters of a drug were characterized by the following parameters: the area under the plasma concentration curve (AUC), distribution of volume (Vdss) at a steady state after drug administration, and clearance (CL). Additionally, we used the mean residence time for the noncompartmental calculation model.33 When a dose of a drug (D) was administered intravenously, the pharmacokinetic parameters were estimated by applying the iterative least-squares computer program MOMENT for moment analysis of plasma concentration–time curves.34 Vdss is the distribution of volume when the blood concentration of a drug reaches a steady state after administration.
Isolation of hepatocytes
Hepatocytes were isolated from individual rats as described previously.35 Rats were quickly sacrificed under anesthesia with pentobarbital sodium, and their livers were immediately and rapidly dissected out, chilled on ice, and perfused with ice-cold 0.25 M sucrose to remove hemoglobin. Each liver was finely chopped and incubated with gentle agitation in 50 mL HBSS (pH 7.4; Thermo Fisher Scientific, Waltham, MA, USA) containing 0.2 mg/mL collagenase. The resulting cell suspensions were filtered through a 200 µm nylon mesh, washed with phosphate-buffered saline (PBS), centrifuged at 40× g for 5 minutes, and resuspended in HBSS (Hanks’ balanced salt solution). Hepatocytes were counted with a hemacytometer and adjusted to 3×10⁶ cells/mL. Cell viability was assessed by trypan blue exclusion and was found to be 70%–95%.
Measurement of the [Ca2+]i
[Ca2+]i in hepatocytes was measured using a fluorescent Ca2+ indicator, fura-2, as described previously.36–39 Hepatocytes were loaded with 5 µM fura-2-acetoxymethyl ester under continuous shaking for 30 minutes. After being washed with PBS (pH 7.4) twice, the cells were incubated at 37°C for 5 minutes to hydrolyze the fura-2-acetoxymethyl ester to free fura-2. The cells were harvested by centrifugation at 2,000× g for 5 minutes. Hepatocytes (1×10⁶ cells) were resuspended in 1 mL Ca2+- and Mg2+-free HBSS (137 mM NaCl, 5.1 mM KCl, 0.44 mM KH2PO4, 0.26 mM Na2HPO4, 5.5 mM glucose, 10 mM NaHepes buffer, pH 7.4) in a 10 mm quartz cuvette, and their fluorescence was measured at an emission wavelength of 500 nm and excitation of 340 or 380 nm using an MPF-44 spectrofluorometer (Hitachi, Tokyo, Japan). [Ca2+]i was calculated by the ratio (R) of the fluorescence intensities (F) at 500 nm after excitation at either 340 or 380 nm as follows: [Ca2+]i = Kd(R–Rmin)/(Rmax–R), assuming a dissociation constant (Kd) of 224 nM for Ca2+-fura-2. Following treatments for calibration, the fluorescence was measured under the same conditions. Rmax values were obtained by the addition of 20 µM sodium dodecyl sulfate, and Rmin values by the addition 50 µL of 3 mM EGTA in 50 mM Tris-HCl (pH 7.4).
Flow cytometric analyses
Flow cytometry
The culture medium was first replaced with ice-cold calcium- and magnesium-free PBS containing 1 mg/mL BSA, and then the cells were detached by repeated pipetting of the solution through a 1 mL pipette tip. The cell suspension was filtered through a 40 µm nylon mesh (Becton Dickinson and Company, Franklin Lakes, NJ, USA) to remove large cell aggregates. For flow cytometric analysis, the fluorescence of cells stained with PI was measured by an EPICS ELITE analyzer (Beckman Coulter Inc., Brea, CA, USA). The excitation source was an argon laser operated at the 488 nm line with a 300 mW power output. A minimum of 5×10⁴ cells were evaluated for each sample by dual-parameter analysis of DNA content and PI uptake.
Cell cycle analysis
The cell cycle of hepatocytes was analyzed as described previously.40 Hepatocytes were isolated from PH livers, and 0.5×10⁶ cells were fixed for 30 minutes in 10 mL of 70% ethanol at 4°C. After centrifugation at 40× g for 5 minutes, the cells were resuspended in PBS with 20 µg/mL DNase-free RNase and incubated at 37°C for 30 minutes. For PI staining, the cells were incubated with 2 mL DNA Prep Stain (Beckman Coulter Inc.) for 30 minutes. The fluorescence was measured by an EPICS XL-MCL flow cytometer (Beckman Coulter Inc.) using a 575 nm band-pass filter, and analyzed with EXPO32 ADC software (Beckman Coulter Inc.), or an FC500 Flow Cytometry System with Multicycle Software for Windows (Beckman Coulter Inc.).
Preparation of rat liver microsomes
Liver microsomes were prepared from individual rats by ultracentrifugation as described previously.12 Rats were sacrificed under anesthesia with pentobarbital sodium, and their livers were removed immediately. The livers were chilled and perfused with 0.25 M sucrose to remove the hemoglobin. Each liver (~3 g) was then finely chopped and homogenized in ice-cold 0.25 M sucrose (8 mL) using a motorized Potter-Elvehjem homogenizer (Sigma-Aldrich), and the homogenate was centrifuged at 10,000× g for 15 minutes. The supernatant was centrifuged at 105,000× g for 45 minutes to obtain a microsomal pellet. The microsomes were suspended in 0.25 M sucrose (8 mL) at a concentration of 2–5 mg protein/mL and stored in liquid nitrogen until use. The microsomal protein concentration was measured using Folin phenol reagent.42 Hepatic microsomal cytochrome P450 content was measured using the reduced minus CO-difference spectrum.30,43
RNA isolation and RT-PCR
Isolation of total RNA from rat livers was carried out as described previously.44 Pieces of fresh wet liver tissue (2 g) were snap-frozen in liquid nitrogen and then homogenized in 15 mL solution D (8 M guanidinium thiocyanate, 1% N-lauroylsarcosine, and 0.2 M 2-mercaptoethanol) in a 50 mL polypropylene tube using a polytron system. The homogenate was mixed with 2 mL of 2 M sodium acetate, pH 4, 15 mL water-saturated phenol, and 3 mL of a chloroform-isoamyl alcohol mixture (49:1) and then centrifuged at 2,000× g for 10 minutes at 4°C. The upper aqueous phase was transferred to a clean tube, and 15 mL isopropanol was added, followed by 1 hour of incubation at −20°C to precipitate the RNA. The RNA pellet was dissolved in 2 mL formamide and then stored at −20°C until use. The RNA concentration and purity were calculated by the optical density at 260 nm and the ratio of 260/280 nm, respectively.
RT-PCR analysis was performed using the GeneAmp® PCR system 9800 DNA Thermal Cycler (PerkinElmer Cetus, Norwalk, CT, USA) as described previously.45 The PCR conditions were 30 cycles at 94°C for 10 seconds, 55°C for 20 seconds, and 72°C for 20 seconds. Ethidium bromide staining was used to visualize the amplified DNA products. The amount of DNA used for PCR was standardized against ß-actin mRNA levels. The primers are listed in Table 1.
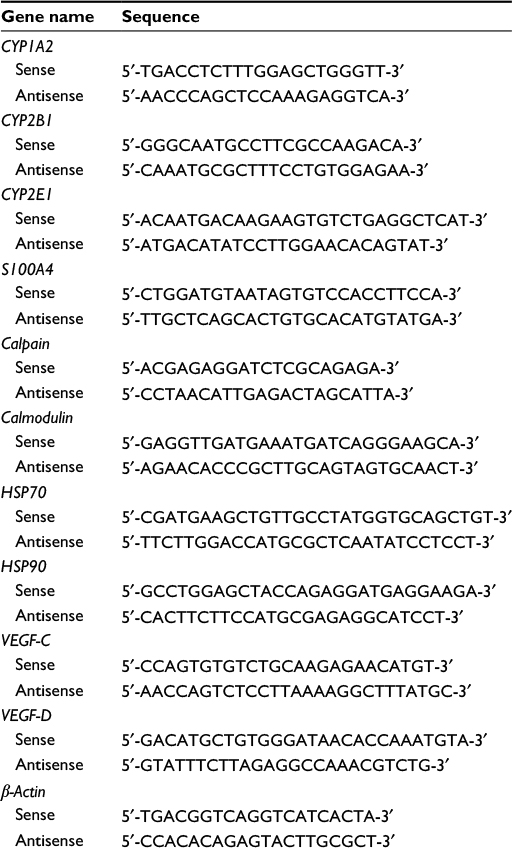 | Table 1 Primer list for RT-PCR |
Statistical analysis
Data are presented as the mean ± standard deviation. The significance of differences between two mean values was assessed by Student’s t-test. Differences were considered to be statistically significant at P<0.05.
Results
Physiological profiles of rats during liver regeneration after 70% PH
To evaluate the effects of liver damage and the recovery profile, body weight and ALT activity (IU/L) were measured for 21 days after 70% PH.
After 70% PH, the body weight was decreased to the minimum at 48 hours and then increased uniformly by 10 g per day, and was recovered to the control level at 7 days (Figure 1A). Serum ALT activity was increased to the maximum level (115.5±30.3 IU/L) at 24 hours and then returned to the control level (22.6 IU/L) by the next day (Figure 1B). Although the livers were injured by 70% PH, they appeared to rapidly recover from any hepatic damage. Furthermore, the Rr of the liver regeneration in rats after 70% PH was evaluated by the formula: Rr = 100 × (total weight of the regenerated liver/total weight of the initially excised liver lobe pieces/0.7). As shown in Figure 1C, although the liver mass increased uniformly on the Rr curve after 70% PH and returned to the initial liver weight by day 10–14, there was an abnormally high peak on the Rr curve at around day 4 (P<0.05). The liver mass, as judged by Rr, had suddenly increased at around day 4 after 70% PH, temporarily exceeding 100%, and then decreased steeply, followed by normal liver regeneration (P<0.05).
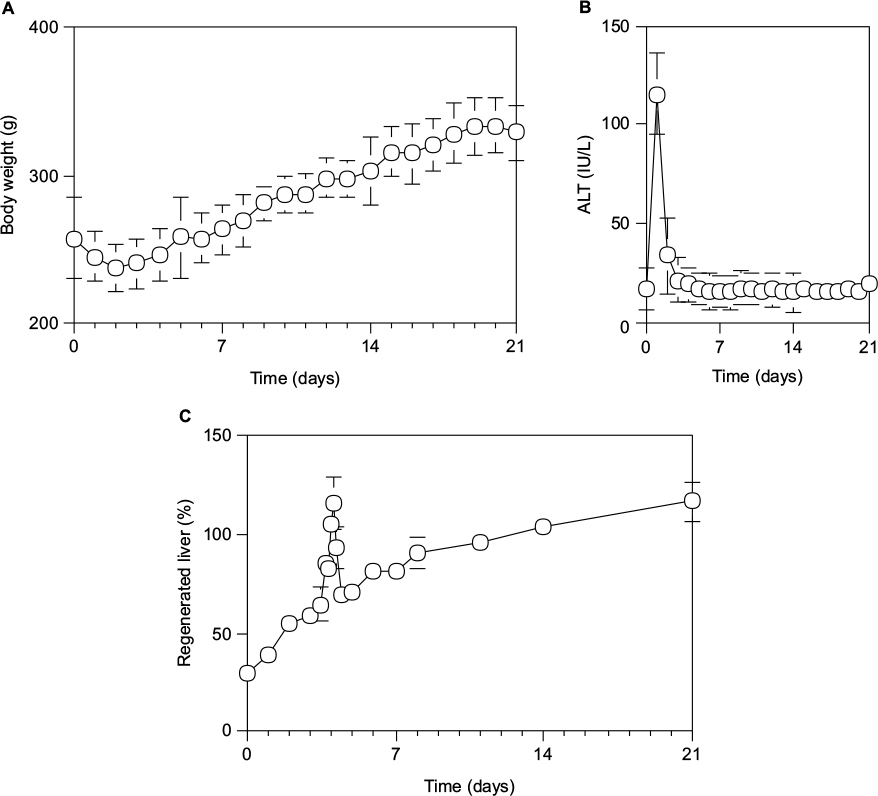 | Figure 1 Time course of physiological profiles during liver regeneration after 70% PH in rats. Notes: (A) Body weight (g). (B) Serum ALT activity (IU/L). (C) The Rr of liver regeneration after 70% PH was calculated by Rr = 100 × (total weight of regenerated liver/total weight of the liver lobe pieces excised/0.7). Each point presented as mean ± SD for six or more rats. Abbreviations: ALT, alanine aminotransferase; PH, partial hepatectomy; SD, standard deviation. |
As shown in Figure 2A, and described previously,33 although the serum ALT levels of normal rats reached a peak at 24 hours after a single IP injection of 0.2 mL CCl4/kg of body weight and returned by 48 hours to the normal level, the serum ALT levels in rats varied daily after 70% PH (Figure 2B). The serum ALT levels in rats after 70% PH decreased immediately from 471.8±124.1 IU/L (control level at day 0) to 56.7±21.0 IU/L at day 1, and then increased to the control level at day 10, which was sustained except for a transient increase at day 4. Furthermore, when the physiological profiles of rats after 70% PH were examined using pharmacokinetic parameters of SAM and EB, the Vdss of SAM showed an immediate increase in the body fluid volume after 70% PH, which was sustained at the high level until day 4, and then returned to the control level by day 6 (Figure 2C). The other pharmacokinetic parameters (Table 2) showed a significant decrease in liver functions immediately after 70% PH, which gradually recovered to the control level by day 10. Because EB is poorly permeable through blood vessels, it is useful to detect changes in blood volume. The Vdss of EB was increased immediately after 70% PH and varied similarly to the control level (Figure 2D).
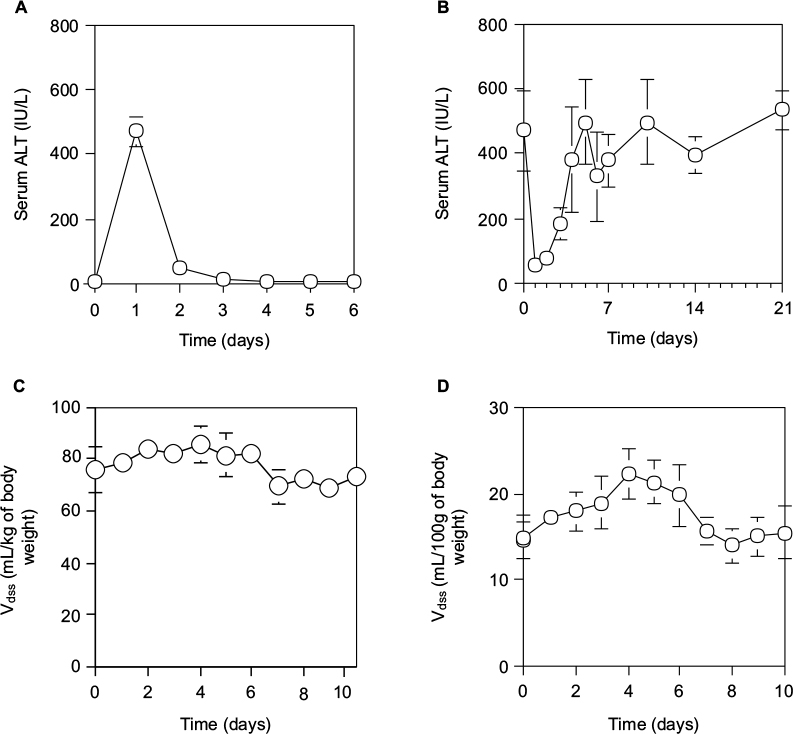 | Figure 2 Time course of physiological effects of drugs in rats during liver regeneration after 70% PH. Notes: (A) Serum ALT activity (IU/L) at 24 hours after ip administration of 0.2 mL/kg CCl4 to normal rats. (B) Serum ALT activity at 24 hours after ip administration of 0.2 mL/kg CCl4 to rats during liver regeneration after 70% PH. (C) Vdss of SAM. After intravenous administration of SAM (68.5 mg/kg of body weight), serum SAM was measured several times for 90 minutes by the fluorometric method. Vdss and other parameters of SAM were estimated by pharmacokinetics. (D) Vdss of EB. After intravenous administration of EB (10 mg/kg of body weight), serum EB concentrations were measured several times for 120 minutes by the absorbance method. Vdss of EB was estimated by pharmacokinetics. Each point is presented as mean ± SD for three rats. Abbreviations: ALT, alanine aminotransferase; EB, Evans blue; PH, partial hepatectomy; SAM, salicylamide; SD, standard deviation; Vdss, distribution of volume at a steady state after drug administration. |
 | Table 2 Pharmacokinetic parameters of SAM in rats after intravenous administration of SAM 68.5 mg/kg of body weight Note: Parameters show mean ± SD. Abbreviations: AUC, area under the plasma concentration curve; CL, clearance; MRT, mean residence time; SAM, salicylamide; Vdss, distribution of volume at a steady state after drug administration. |
Cellular profiles of hepatocytes isolated from rats after 70% PH
To examine regeneration process in hepatocytes, hepatocytes were isolated from the liver at various days after 70% PH and stained with fura-2. [Ca2+]i was measured using fluorescence of the hepatocyte suspension. The [Ca2+]i was consisting of two successive peaks as shown in Figure 3.
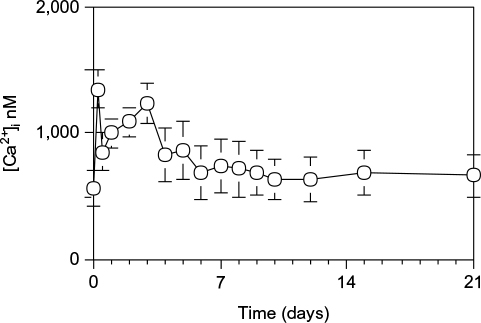 | Figure 3 [Ca2+]i in hepatocytes during liver regeneration after 70% PH. Notes: The [Ca2+]i concentration was measured using the fluorescent Ca2+ indicator fura-2. Hepatocytes were loaded with 5 µM fura-2-AM under continuous shaking for 30 minutes. After two washes with PBS (pH 7.4), the cells were incubated at 37°C for 5 minutes. Hepatocytes (1×10⁶ cells) were resupended in 1 mL Ca2+- and Mg2+-free HBSS in a 10 mm quartz cuvette, and the fluorescence was measured at an emission wavelength of 500 nm and excitation of 340 or 380 nm using spectrofluorometer. Each point is presented as mean ± SD for three rats. Abbreviations: AM, acetoxymethyl ester; PBS, phosphate-buffered saline; PH, partial hepatectomy; SD, standard deviation; HBSS, Hanks’ balanced salt solution. |
There was a sharp increase to 1349.3±155.1 nM in the first narrow peak at 1 hour after 70% PH, and a decrease after 2 hours to 562.1±136.0 nM, followed by a gradual increase to 1228.2±160.7 nM in the second peak at day 3 after 70% PH before returning to the control level by day 4.
Furthermore, we examined the cell cycle in hepatocytes during liver regeneration after 70% PH using PI.40
As shown in Figure 4, hepatocytes underwent two synchronous divisions with the S phase peaking at day 1.5 (18.5%±1.5% of cells) and day 4 (54.1%±13.1% of cells) after 70% PH, and the liver was restored to >70% on the Rr curve by day 4.
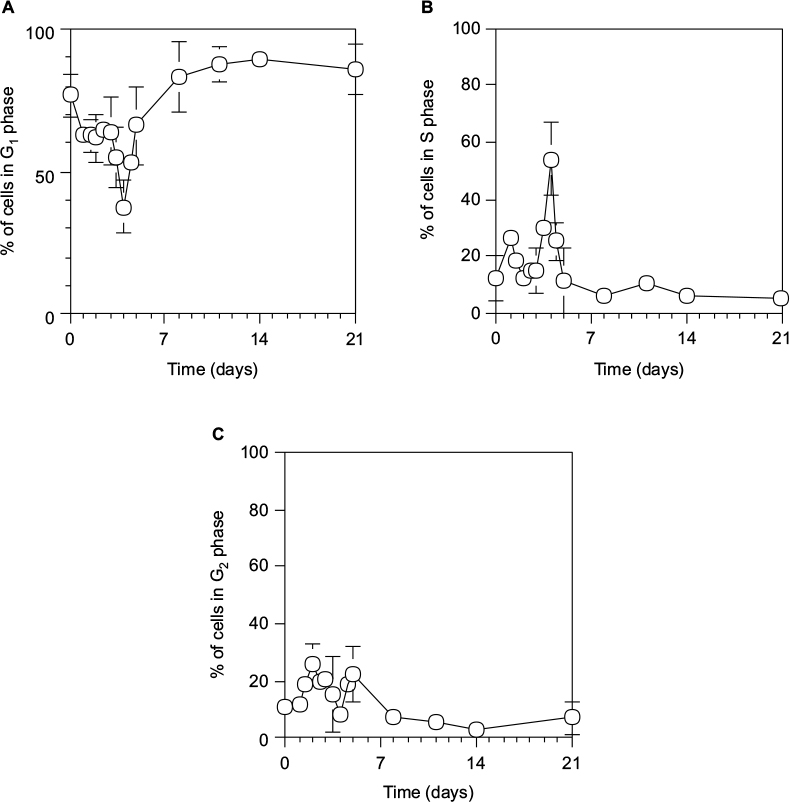 | Figure 4 Cell cycle distribution during liver regeneration after 70% PH. Notes: G1 (A), S (B), and G2 (C) phases. Hepatocytes were isolated from 70% PH rat livers, and 0.5×10⁶ cells were fixed with 70% ethanol at 4°C. The cells were stained with PI, and their fluorescence was measured by a flow cytometer using a 575-nm band-pass filter. Cells were estimated on graphs of cell counts versus PI staining. Each point is presented as mean ± SD for six rats. Abbreviations: PH, partial hepatectomy; PI, propidium iodide; SD, standard deviation. |
Subcellular profiles of proteins and total RNA after 70% PH
To characterize the subcellular profiles of protein and total RNA in rats during liver regeneration after 70% PH, microsomes and total RNA per 1 g wet liver were prepared on various days after 70% PH and analyzed as described previously.42,44
As shown in Figure 5A, the protein content in microsomes per 1 g wet liver from 70% PH rats was decreased to the minimum at day 4, increased by a peak at day 8, and then returned to the control level at day 0. As shown in Figure 5B, the cytochrome P450 activity in microsomes per 1 g wet liver from 70% PH rats was decreased immediately from 1.73±0.36 nmol/g of liver at the control level (day 0) to 1.22±0.18 nmol/g of liver at day 1 and continued to decrease until day 7, except for a transient increase at day 4, and then recovered slowly to the normal level by day 10.
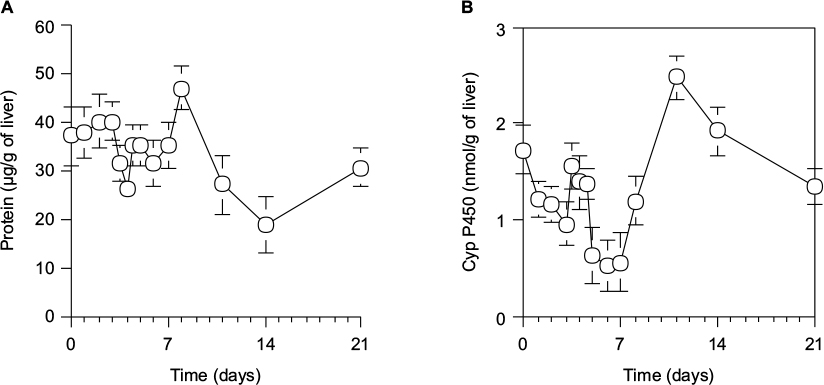 | Figure 5 Protein contents (A) and cytochrome P450 level (B) in microsomes per 1 g of wet liver in rats during liver regeneration after 70% PH. Notes: (A) Protein contents in microsomes were measured using Folin phenol reagent.42 (B) Microsomal cytochrome P450 levels were estimated using the method of Omura and Sato.30 Each point presents as the mean ± SD for three rats. Abbreviations: PH, partial hepatectomy; SD, standard deviation. |
The quantity of total RNA per 1 g wet liver weight isolated from a defined liver piece also varied with two successive peaks at days 3 and 4.5 (Figure 6A). It increased slowly by day 3 after 70% PH, steeply decreased at day 4, increased again to the peak within 12 hours, and then returned to the control level by day 5. Moreover, the mRNA expression profile of VEGF correlated with the quantity of total RNA (Figure 6B). It increased slowly by day 3 after 70% PH, sharply increased to the peak at 6 hours before day 4, and then returned to the control level at 3 hours within day 4. Thus, the expression profile of the VEGF gene suggests that induction of angiogenesis is necessary to remodel the sinusoidal vasculature system in new liver tissues.
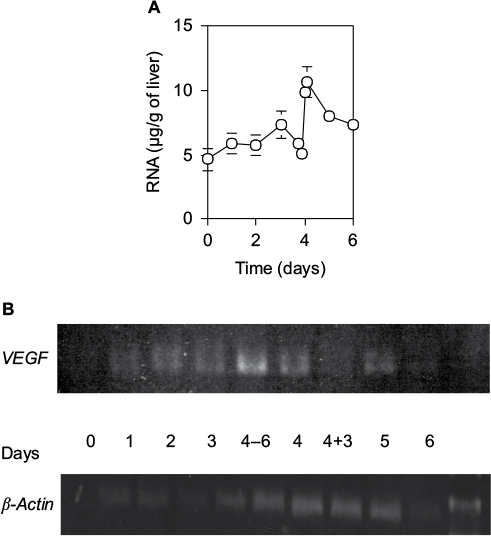 | Figure 6 RNA content (A) and expression levels of VEGF and b-actin (B) in the liver. Notes: (A) Total RNA in 2 g of wet liver was isolated with acid phenol, and calculated by the optical density at 260 nm. Each point presents as the mean ± SD for four rats. (B) VEGF gene expression was estimated by RT-PCR. Day 4–6 and 4+3 indicate 6 hours before day 4 and 3 hours after day 4, respectively. Abbreviation: SD, standard deviation. |
Furthermore, we examined transcription levels at the defined total RNA content. The mRNA expression of genes encoding xenobiotic metabolism proteins (cytochrome CYP1A2, CYP2E1, and CYP2B1), calcium-binding proteins (S100A4, calpain, and calmodulin), heat shock proteins (HSP70 and HSP90), and vasculogenesis proteins (VEGF-C and VEGF-D) was measured by RT-PCR.
As shown in Figure 7, only three genes, VEGF-D, S100A4, and calpain, were significantly induced by 70% PH, although their levels were very low at day 0. VEGF-D expression was increased from day 1 to 6 with a maximum of 1.7-fold at days 2–5. This result suggests that liver regeneration is induced together with the VEGF gene after 70% PH. Furthermore, Ca2+-binding proteins S100A4 and calpain were highly induced by day 4, which was consistent with the Ca2+ increase, and then decreased to the control level. The expression level of S100A4 was increased from day 1 to 5, reaching the maximum of 1.6-fold at day 3, and decreased thereafter. Calpain expression was increased to 1.8-fold at day 2, reaching the maximum of twofold at day 5, and then decreased below the day 0 level. Although expression of calmodulin was not induced by 70% PH, it was highly expressed. These gene expression profiles suggest that Ca2+-binding proteins are involved in transcriptional control or the cell cycle.22 In addition, the protein contents correlated with the RNA contents.
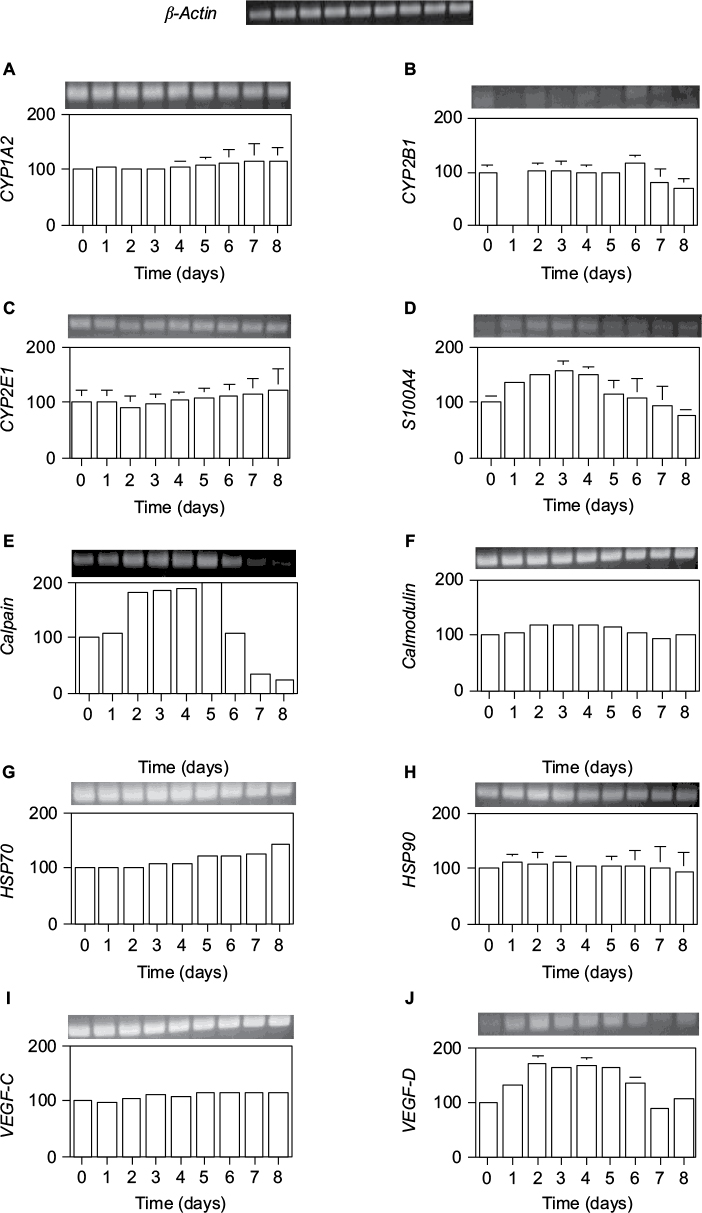 | Figure 7. Expression levels per total RNA unit content of several genes after 70% PH. Notes: (A) CYP1A2, (B) CYP2E1, (C) CYP2B1, (D) S100A4, (E) calpain, (F) calmodulin, (G) HSP70, (H) HSP90, (I) VEGF-C, and (J) VEGF-D. Total RNA in wet livers was isolated with acid phenol, and the expression levels of the indicated genes were estimated by RT-PCR. The vertical axis is the ratio (%) of the expression level at each day compared with that at day 0. The expression levels were normalized against b-actin expression, shown in upper row. Results are presented as the mean ± SD for double analyses. Abbreviations: PH, partial hepatectomy; SD, standard deviation. |
Furthermore, light microphotographs of H&E-stained liver sections (Figure 8) showed that sinusoids around the central vein had expanded daily after 70% PH, reached the largest volume at day 4 (Figure 8E), and then converged to the original size.
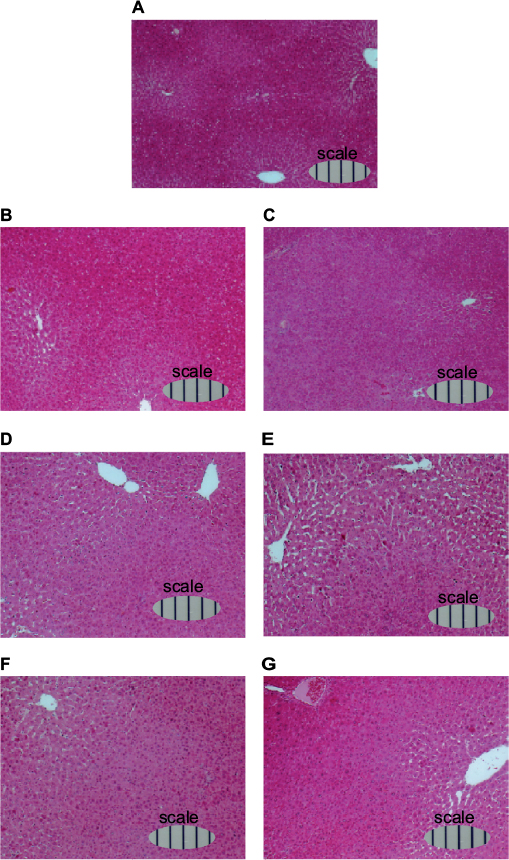 | Figure 8. Light microphotographs of H&E-stained liver sections of rats during liver regeneration after 70% PH (×10). Notes: Rats were sacrificed at (A) day 0, (B) day 1, (C) day 2, (D) day 3, (E) day 4, (F) day 5, and (G) day 6 after 70% PH, the livers were immediately removed, and weighed. Tissue samples were routinely fixed in 4% neutral buffered formalin for several days, dehydrated, paraffin-embedded, and sectioned at 5 µm thickness. Following deparaffinization in xylene, sections were dehydrated, stained with H&E, and mounted on glass slides for pathological assessment. Scale bars show in 100 µm. Abbreviations: H&E, hematoxylin and eosin; PH, partial hepatectomy. |
Discussion
We studied the regeneration mechanism of livers in male Donryu rats (7±1 weeks) subjected to the 70% PH method of Higgins and Anderson.6 After 70% PH, the mean body weight of rats had decreased by day 2, but increased uniformly thereafter. The increase in serum ALT was transient at day 1, suggesting weak liver injury. In this study, we found two novel signals that regulate liver regeneration after 70% PH in rats. The first finding was an increased signal in the [Ca2+]i of hepatocytes, which was sustained for the first 4 days after 70% PH, consisting of two successive peaks. The first was a narrow peak at 1 hour, which gradually increased to the second wider peak at day 3, and then steeply returned to the control level by day 4. The second finding was an abnormal and transient increase in the Rr curve of liver regeneration at around day 4 during liver regeneration after 70% PH. Then, the Rr curve temporarily exceeded 100% and decreased steeply, followed by ordinary liver regeneration, although it uniformly increased at other days during the experimental period. The normalization term in the Rr calculation was different from that in other studies which used body weight6 or estimated the whole original liver from the average weight.9 During the 4 days the two successive [Ca2+]i peaks and abnormal peak in the Rr curve of liver regeneration, various physiological signals were induced to promote liver regeneration after 70% PH. The expression of genes encoding Ca2+-binding proteins S100A4 and calpain was increased by day 4, corresponding to the increase in Ca2+, and the hepatocytes proliferated synchronously. Thus, the number of cells in S phase increased strikingly with two divisions after 70% PH. When liver regeneration was restored from 30% to 70% on the Rr curve after 70% PH, the abnormal peak in the Rr curve occurred at day 4 after 70% PH, and liver regeneration was sustained in the Rr curve by liver swelling alone, corresponding to 30% PH, as shown previously.9 In addition, around the period between the second peak in [Ca2+]i and the abnormal peak on the Rr curve, abnormal changes were found in the metabolic activities at day 4. Although we found sustained decreases in the cytochrome P450 level of microsomes prepared from 70% PH rats and ALT values at 24 hours after CCl4 administration immediately after 70% PH, their levels recovered temporarily to the control levels at day 4, returned to the decreased levels, and then slowly recovered by day 10. The quantity of total RNA per 1 g of wet liver had also varied intensely within a very short period with a steep decrease and then increase at around day 4 after 70% PH. Furthermore, the expression level of the VEGF gene showed a single variation which corresponded to the quantity of total RNA, probably because of hepatocyte proliferation. This observation suggests sinusoidal vascular remodeling to supply blood to the newly replicating hepatocytes during liver regeneration, and the abnormal proliferation resulted in activation of cell division. However, the distribution volumes of SAM and EB after 70% PH showed an immediate increase in the body fluid volume, suggesting liver swelling, which reached a peak at around day 4 and then returned to the control volume. Furthermore, the pharmacokinetic parameters of SAM showed a decrease in its metabolic potency at around day 4.
The sustained increase in [Ca2+]i, consisting of two successive peaks after 70% PH, corresponded to the increase in [Ca2+]i signals after liver injury induced by ip injection of a low dose of CCl4.23 Therefore, the [Ca2+]i signals after 70% PH must serve the same function as that in CCl4-induced liver injury, ie, a switch between sensitivity and resistance to cell death by intoxication, and in the period surrounding the two successive peaks, induction of hepatocyte resistance to intoxication. Indeed, hepatocytes are resistant to intoxication for 2 days after 70% PH5,29 and are the cytosolic Ca2+ increase.28 Thus, during this resistant period, the liver was urgently restored by 70% of the Rr to suppress liver failure by synchronous cell proliferation and hypertrophy, and then the hepatocytes switched back to the sensitive state during the second peak in [Ca2+]i. Furthermore, the high expression of the VEGF gene at several hours before day 4 after 70% PH may promote angiogenesis to remodel the blood system,4,11,46 and the gene expression of the Ca2+-binding protein S100A4 may support cell migration.22,47 Subsequently, during the abnormal peak in the Rr curve at day 4 after 70% PH, the liver regeneration may be sustained by liver swelling alone, which would restore the liver to an Rr of 70%, corresponding to 30% PH, as shown previously.9 Therefore, the liver regeneration phase changes to the ordinary regeneration mechanism to continue increasing the liver size.9 Hence, at the point of the abnormal increase in the Rr of liver regeneration after 70% PH, the liver regeneration should proceed to termination and switch to normal regeneration.
In conclusion, the increase in [Ca2+]i may be critical for the abnormal increase in Rr of liver regeneration at day 4 and the termination phase to complete liver regeneration after 70% PH. Further study is in progress to precisely characterize the sustained increase in [Ca2+]i, consisting of two successive peaks.
Acknowledgments
We thank Hiroyuki Komaki, Manami Aikawa, and Miho Tomita for experimental assistance. This study was supported in part by “Open Research Center Project” and “MEXT.HAITEKU, 2003–2007” grants from the Ministry of Education, Culture, Sports, Science and Technology of Japan.
Disclosure
The authors report no conflicts of interest in this work.
References
Fausto N, Campbell JS, Riehle KJ. Liver regeneration. Hepatology. 2006;43:S45–S53. | ||
Michalopoulos GK. Liver regeneration after partial hepatectomy: critical analysis of mechanistic dilemmas. Am J Pathol. 2010;176:2–13. | ||
Taub R. Liver regeneration: from myth to mechanism. Nat Rev Mol Cell Biol. 2004;5:836–847. | ||
Mohammed FF, Khokha R. Thinking outside the cell: proteases regulate hepatocyte division. Trends Cell Biol. 2005;15:555–563. | ||
Thakore KN, Mehendale HM. Role of hepatocellular regeneration in CCl4 autoprotection. Toxicol Pathol. 1991;19:47–58. | ||
Higgins G, Anderson R. Restoration of the liver of the white rat following partial surgical removal. Arch Pathol. 1931;12:186–202. | ||
Michalopoulos GK, DeFrances MC. Liver regeneration. Science. 1997;276(5309):60–66. | ||
Harkness RD. Changes in the liver of the rat after partial hepatectomy. J Physiol. 1952;117:267–277. | ||
Miyaoka Y, Ebato K, Kato H, Arakawa S, Shimizu S, et al. Hypertrophy and unconventional cell division of hepatocytes underlie liver regeneration. Curr Biol. 2012;22:1166–1175. | ||
Su AI, Guidotti LG, Pezacki JP, Chisari FV, Schultz PG. Gene expression during the priming phase of liver regeneration after partial hepatectomy in mice. Proc Natl Acad Sci USA. 2002;99:11181–11186. | ||
Böhm F, Köhler UA, Speicher T, Werner S. Regulation of liver regeneration by growth factors and cytokines. EMBO Mol Med. 2010;2:294–305. | ||
Duncan AW, Dorrell C, Grompe M. Stem cells and liver regeneration. Gastroenterology. 2009;137:466–481. | ||
Boo YC, Jo H. Flow-dependent regulation of endothelial nitric oxide synthase: role of protein kinases. Am J Physiol Cell Physiol. 2003;285:C499–C508. | ||
Díaz-Juárez J, Hernández-Muñoz R. The role of calcium and nitric oxide during liver enzyme release induced by increased physical forces as evidenced in partially hepatectomized rats. Liver Transpl. 2011;17:334–343. | ||
Wack KE, Ross MA, Zegarra V, Sysko LR, Watkins SC, et al. Sinusoidal ultrastructure evaluated during the revascularization of regenerating rat liver. Hepatology. 2001;33:363–378. | ||
Ochoa B, Syn WK, Delgado I, Karaca GF, Jung Y, et al. Hedgehog signaling is critical for normal liver regeneration after partial hepatectomy in mice. Hepatology. 2010;51:1712–1723. | ||
Crumm S, Cofan M, Juskeviciute E, Hoek JB. Adenine nucleotide changes in the remnant liver: an early signal for regeneration after partial hepatectomy. Hepatology. 2008;48:898–908. | ||
Gonzales E, Julien B, Serrière-Lanneau V, Nicou A, Doignon I, et al. ATP release after partial hepatectomy regulates liver regeneration in the rat. J Hepatol. 2010;52:54–62. | ||
Ove P, Takai SI, Umeda T, Lieberman I. Adenosine triphosphate in liver after partial hepatectomy and acute stress. J Biol Chem. 1967;242:4963–4971. | ||
Kahl CR, Means AR. Regulation of cell cycle progression by calcium/calmodulin-dependent pathways. Endocr Rev. 2003;24:719–736. | ||
Lagoudakis L, Garcin I, Julien B, Nahum, K, Gomes DA, et al. Cytosolic calcium regulates liver regeneration in the rat. Hepatology. 2010;52:602–611. | ||
Prevarskaya N, Skryma R, Shuba Y. Calcium in tumour metastasis: new roles for known actors. Nat Rev Cancer. 2011;11:609–618. | ||
Tachibana T, Kusumoto A, Ueda Y, Taira Z. A cytoprotection of rat hepatocytes mediated by the intracellular calcium. J Hard Tissue Biol. 2005;14:359–360. | ||
Moore L, Davenport GR, Landon EJ. Calcium uptake of a rat liver microsomal subcellular fraction in response to in vivo administration of carbon tetrachloride. J Biol Chem. 1976;251:1197–1201. | ||
Moore L, Schoenberg DR, Long RM. Impact of halogenated compounds on calcium homeostasis in hepatocytes. Environ Health Perspect. 1990;84:149–153. | ||
Toskulkao C, Glinsukon T. Hepatic lipid peroxidation and intracellular calcium accumulation in ethanol potentiated aflatoxin B1 toxicity. J Pharmacobiodyn. 1988;11:191–197. | ||
Díaz-Muñoz M, Cañedo-Merino R, Gutiérrez-Salinas J, Hernández-Muñoz R. Modifications of intracellular calcium release channels and calcium mobilization following 70% hepatectomy. Arch Biochem Biophys. 1998;349:105–112. | ||
Collins F, Schmidt MF, Guthrie PB, Kater SB. Sustained increase in intracellular calcium promotes neuronal survival. J Neurosci. 1991;11:2582–2587. | ||
Roberts E, Ahluwalia MB, Lee G, Chan C, Sarma DS, et al. Resistance to hepatotoxins acquired by hepatocytes during liver regeneration. Cancer Res. 1983;43:28–34. | ||
Omura T, Sato R. The carbon monoxide-binding pigment of liver microsomes: I. Evidence for its hemoprotein nature. J Biol Chem. 1964;239:2370–2378. | ||
Morris CJOR. The determination of plasma volume by the Evans blue method: the analysis of haemolysed plasma. J Physiol. 1944;102:441–445. | ||
Fleckenstein L, Mundy GR, Horovitz RA, Mazzullo JM. Sodium salicylamide: relative bioavailability and subjective effects. Clin Pharmacol Ther. 1976;19:451–458. | ||
Taira Z, Yabe K, Hamaguchi Y, Hirayama K, Kishimoto M, et al. Effects of Sho-saiko-to extract and its components, baicalin, baicalein, glycyrrhizin and glycyrrhetic acid, on pharmacokinetic behavior of salicylamide in carbon tetrachloride intoxicated rats. Food Chem Toxicol. 2004;42:803–807. | ||
Yamaoka K, Nakagawa T, Uno T. Statistical moments in pharmacokinetics. J Pharmacokinet Biopharm. 1978;6:547–558. | ||
Seglen PO. Preparation of isolated rat liver cells. Methods Cell Biol. 1976;13: 29–83. | ||
Grynkiewicz G, Poenie M, Tsien RY. A new generation of Ca2+ indicators with greatly improved fluorescence properties. J Biol Chem. 1985;260:3440–3450. | ||
Malgaroli A, Milani D, Meldolesi J, Pozzan T. Fura-2 measurement of cytosolic free Ca2+ in monolayers and suspensions of various types of animal cells. J Cell Biol. 1987;105:2145–2155. | ||
Bawolak MT, Gera L, Morissette G, Bouthillier J, Stewart JM, Gobeil LA, Lodge R, Adam A, Marceau F, et al. Fluorescent ligands of the bradykinin B1 receptors: pharmacologic characterization and application to the study of agonist-induced receptor translocation and cell surface receptor expression. J Pharmacol Exp Ther. 2009;329(1):159–168. | ||
Han AY, Zhang MH, Zuo XL, Zheng SS, Zhao CF, Feng JH, Cheng C. Effect of acute heat stress on calcium concentration, proliferation, cell cycle, and interleukin-2 production in splenic lymphocytes from broiler chickens. Poult Sci. 2010;89:2063–2070. | ||
Fried J, Perez AG, Clarkson BD. Flow cytofluorometric analysis of cell cycle distributions using propidium iodide. Properties of the method and mathematical analysis of the data. J Cell Biol. 1976;71:172–181. | ||
Caro AA, Cederbaum AI. Role of calcium and calcium-activated proteases in CYP2E1-dependent toxicity in HEPG2 cells. J Biol Chem. 2002;277:104–113. | ||
Lowry OH, Rosebrough NJ, Farr AL, Randall RJ. Protein measurement with the Folin phenol reagent. J Biol Chem. 1951;193:265–275. | ||
Casini AF, Farber JL. Dependence of the carbon-tetrachloride-induced death of cultured hepatocytes on the extracellular calcium concentration. Am J Pathol. 1981;105:138–148. | ||
Chomczynski P, Sacchi N. Single-step method of RNA isolation by acid guanidinium thiocyanate-phenol-chloroform extraction. Anal Biochem. 1987;162:156–159. | ||
Bruccoleri A, Gallucci R, Germolec DR, Blackshear P, Simeonova P, et al. Induction of early-immediate genes by tumor necrosis factor alpha contribute to liver repair following chemical-induced hepatotoxicity. Hepatology. 1997;25:133–141. | ||
Taniguchi E, Sakisaka S, Matsuo K, Tanikawa K, Sata M. Expression and role of vascular endothelial growth factor in liver regeneration after partial hepatectomy in rats. J Histochem Cytochem. 2001;49:121–130. | ||
Kiryushko D, Novitskaya V, Soroka V, Klingelhofer J, Lukanidin E, et al. Molecular mechanisms of Ca2+ signaling in neurons induced by the S100A4 protein. Mol Cell Biol. 2006;26:3625–3638. |
 © 2016 The Author(s). This work is published and licensed by Dove Medical Press Limited. The full terms of this license are available at https://www.dovepress.com/terms.php and incorporate the Creative Commons Attribution - Non Commercial (unported, v3.0) License.
By accessing the work you hereby accept the Terms. Non-commercial uses of the work are permitted without any further permission from Dove Medical Press Limited, provided the work is properly attributed. For permission for commercial use of this work, please see paragraphs 4.2 and 5 of our Terms.
© 2016 The Author(s). This work is published and licensed by Dove Medical Press Limited. The full terms of this license are available at https://www.dovepress.com/terms.php and incorporate the Creative Commons Attribution - Non Commercial (unported, v3.0) License.
By accessing the work you hereby accept the Terms. Non-commercial uses of the work are permitted without any further permission from Dove Medical Press Limited, provided the work is properly attributed. For permission for commercial use of this work, please see paragraphs 4.2 and 5 of our Terms.