")
Back to Journals » Diabetes, Metabolic Syndrome and Obesity » Volume 14
Characteristics of Gut Microbiota in Cerulein-Induced Chronic Pancreatitis
Received 18 November 2020
Accepted for publication 22 December 2020
Published 25 January 2021 Volume 2021:14 Pages 285—294
DOI https://doi.org/10.2147/DMSO.S291822
Checked for plagiarism Yes
Review by Single anonymous peer review
Peer reviewer comments 2
Editor who approved publication: Professor Ming-Hui Zou
Chunhua Wu,1 Mengmeng Li,2 Wenji Chen1
1Department of General Practice, Zhongda Hospital, Medical School, Southeast University, Nanjing 210009, People’s Republic of China; 2Department of Ophthalmology, Xuzhou First People’s Hospital, Xuzhou 221000, People’s Republic of China
Correspondence: Wenji Chen Email [email protected]
Background: Although clinical trials and animal models have evaluated the alterations of the microbiome in chronic pancreatitis (CP), the gut microbiota composition and diversity in cerulein-induced CP is unknown. This study aimed to evaluate the changes of gut microbiota in a CP mice model, and to determine whether these gut microbiota changes were consistent with those in patients with CP.
Methods: A total of ten male C57BL/6j mice were randomly divided into two groups. The experimental group were injected intraperitoneally with cerulein, while the normal control group received comparable injections of saline, the entire molding process lasted 6 weeks. Histology analysis was used to assess pancreatic morphological changes and fibrosis, meanwhile the gut microbiota composition and diversity were analyzed by high throughput sequencing. Spearman correlation analysis was used to determine whether body weight and weight changes were associated with changes in gut microbial abundance.
Results: The bacterial richness and diversity of CP mice decreased, and the gut microbiota changed, including lower levels of Firmicutes, decreased Firmicutes/Bacteroidetes ratio and increased abundance of Bacteroidetes, Actinobacteria and Verrucomicrobia. We found statistically significant differences in body weight and weight changes between the two groups. However, there was no significant correlation between alterations of gut microbiota and in body weight and weight changes.
Conclusion: Our results showed that the gut microbiota in cerulein-induced CP was changed.
Keywords: chronic pancreatitis, cerulein, gut microbiota, body weight, weight changes
Introduction
Gut microbiota plays an important role in human physiology by influencing metabolism, regulating the mucosal immune system, producing vitamins, promoting digestion and regulating intestinal architecture.1,2 Gut dysbiosis is associated with the pathogenesis of various gastrointestinal diseases such as inflammatory bowel disease and irritable bowel syndrome,3 as well as other diseases such as the metabolic syndrome, obesity, diabetes4–6 and pancreatic diseases including chronic pancreatitis (CP).7 CP is a chronic inflammatory disease of the pancreas, which is characterized by irreversible morphological changes that usually result in pain and/or permanent loss of function. This progressive, irreversible disease causes the destruction of healthy pancreatic tissue and the formation of fibrous scar tissue. This is followed by a gradual loss of exocrine and endocrine function, as well as clinical manifestations such as increased fat, abdominal pain and diabetes.8 Evidence for gut microbial dysbiosis is suggested by the frequent observation of small intestinal bacterial overgrowth in CP patients.9 In addition, higher levels of Enterobacteriaceae are found in CP, suggesting a relative abundance of Enterobacteriaceae could promote a systemic inflammatory response thus contributing to the development of CP.10 Gut microbiota alterations in the microbiome may have pathogenic effects, while normalization of the microbiome may have therapeutic effects. Nevertheless, functional roles of identified bacterial species and relevance to pathogenesis in CP remain unclear.
Much of the evidence that gut microbial dysbiosis is thought to contribute to the pathogenesis of CP comes from animal models and these models will continue to be valuable for testing hypotheses. Developing appropriate animal models is an essential step in gut microbiota of CP research. A variety of experimental models of CP11–13 have been established. A good model of CP recapitulating human disease is repeated intraperitoneal injection of cerulein, which is a cholecystokinin analog.14 This decapeptide stimulates smooth muscles and increases digestive secretions, resulting in parenchymal fibrosis and CP criteria to be prominently observed. The C57BL/6 mouse is the most commonly used inbred mouse in biomedical research. Although clinical trials and animal models have evaluated the alterations of the microbiome in CP,15,16 the gut microbiota composition and diversity in cerulein-induced CP of C57BL/6j mouse is unknown. This study aimed to evaluate the changes of gut microbiota in the feces of cerulein-induced CP mice model, and to determine whether these gut microbiota changes were consistent with those in patients with CP.
Materials and Methods
Animals
A total of ten male C57BL/6j mice, aged 6–8 weeks, weighing 20–22 g, were purchased from Animal Laboratory of Nanjing Medical University (Nanjing, China). At the time of purchase, the manufacturer provided a production license and a cage quality certificate, and the animal quality standards met the GB 14922.1–2001 microbiology and parasitological quality standards. Once in our experimental center, animals were kept strictly in accordance with the rules and regulations of Southeast University Experimental Animal Center. The SPF status of the facility was continuously monitored with sentinel animals by the Veterinary Service of Southeast University Laboratory Animal Center. Each group of animals was housed in a single ventilated cage. After 1 week of acclimation, the mice were randomly divided into an experimental group (CP) and a normal control group (CON) (n = 5 mice in each group) and maintained at a temperature of 18–26 °C for a 12-hour light/12-hour dark cycle, with free access to water and food. The water was made by a water purifier, and the food was provided by Jiangsu Synergy Bioengineering Co., Ltd (order number XC201910000003). Its composition: moisture 98 g/kg, crude ash 54.8 g/kg, crude protein 192.1 g/kg, crude fat 46.5 g/kg, crude fiber 30.3 g/kg, calcium 17 g/kg, total phosphorus 8.0 g/kg. All studies were performed according to the protocols approved by the Animal Experimental Ethical Inspection Form of Southeast University (No. 20190225003). We also followed the guidelines of the Administrative Measures for Experimental Animals of Jiangsu Province for the welfare of the laboratory animals.
Experimental Model of CP
For the CP group, mice were injected intraperitoneally with cerulein (Bubendorf, Switzerland) (50 μg/kg) once every hour for a total of 6 hours, three times a week for six consecutive weeks, as described previously.17 At the same time, normal control mice received comparable injections of saline. The weight of all mice was recorded before each intervention. After the modeling was completed, using clean cotton swabs 1–2 pieces of each mouse's uncontaminated feces were added into the corresponding sample preservation liquid, stirred well and sent to Hangzhou Guhe Information Technology Co., Ltd (Zhejiang Province, China) for fecal flora detection. Then, the mice were sacrificed and their pancreas and colon were collected and divided into two sections, one section was fixed in 10% neutral buffered formalin (Sigma-Aldrich) solution and the rest was immediately frozen in liquid nitrogen.
Evaluation of Pancreas Morphology and Fibrosis
Pancreatic tails were fixed in 10% neutral buffered formalin solution embedded in paraffin, and hematoxylin and eosin (HE) and Masson’s trichrome staining were performed according to standard histological examination methods. Then, the morphological changes and fibrosis were observed under a light microscope (Nikon, Japan).
DNA Extraction and 16S rDNA Amplicon Pyrosequencing
A PowerMax (fecal/soil) DNA isolation kit (MoBio Laboratories, Carlsbad, CA, USA) was used to extract total bacterial genomic DNA samples from all samples according to the instructions and the DNA stored at −20 °C until further analysis. PCR amplification of the bacterial 16S rRNA genes V4 region was performed using the forward primer 515F (5ʹ-GTGCCAGCMGCCGCGGTAA-3ʹ) and the reverse primer 806R (5ʹ-GGACTACHVGGGTWTCTAAT-3ʹ).
Bioinformatics and Statistical Analysis
The sequencing reaction was performed by Hangzhou Guhe Information and Technology Co., Ltd (Zhejiang, China). Sequence data analyses were mainly performed using QIIME and R packages (v3.2.0). Sequencing reads were clustered to operational taxonomic units (OTUs) with a 97% similarity threshold. According to the OTU clustering results, a Venn diagram was generated using the R package “VenDiagram” to visualize the shared and unique OTU between the two groups, based on the presence of OTUs in each group regardless of their relative abundance.18 OTU-level ranked abundance curves were generated to compare the richness and evenness of OTUs between the two groups. OTU-level alpha diversity indices, such as observe_species, Shannon diversity index, Simpson index and Chao1 richness estimator, were calculated using the OTU table in QIIME. We analyzed beta diversity using UniFrac distance metrics to study the structural variation of microbial communities among samples19 and visualized via principal coordinate analysis (PCoA), principal component analysis (PCA) and nonmetric multidimensional scaling (NMDS).20 Taxa abundances at the phylum, class, order, family, genus and species levels were statistically compared between the two groups by Kruskal.test from the R stats package. Linear discriminant analysis effect size (LEfSe) was determined with default parameters to detect differentially abundant taxa between the two groups.21
Data were presented as mean ± standard deviation (SD) and the two groups' differences were analyzed using the Wilcoxon–Mann–Whitney test. Adjusting p-values controlled the false discovery rate (FDR) using the Benjamini–Hochberg method. The possible correlation between changes in gut microbial abundance and both weight and weight changes were assessed by the Spearman test (r). The adjusted p-value was no more than 0.05, which was statistically significant.
Results
Pancreatic Histopathological Assessment
HE staining of pancreatic tissue in the CP group showed severe loss of acinar cells, infiltration of inflammatory cells' enlarged interstitial spaces, atrophy of the glands, degeneration and parenchyma fibrosis (Figure 1A,B). Masson’s trichrome staining (Figure 1C,D) showed extensive trichrome-positive staining in the CP group.
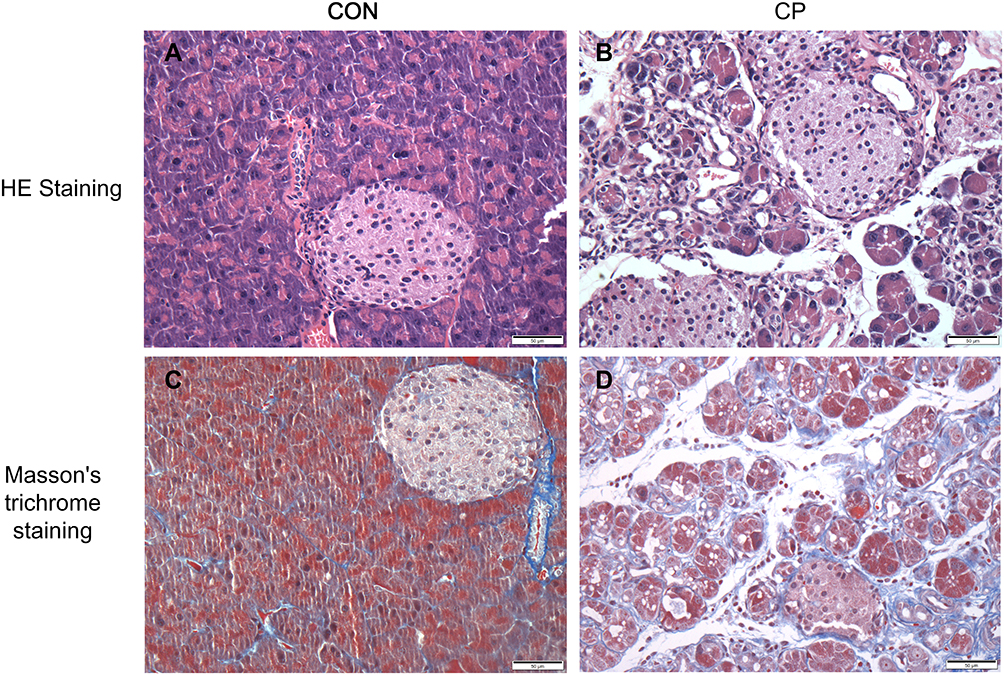 |
Figure 1 Hematoxylin and eosin staining (HE staining) (A,B), and Masson’s trichrome staining (C,D) in the two groups of mice (original magnification × 400). Abbreviations: CP, chronic pancreatitis group; CON, control group. |
Richness and Diversity of the Gut Microbiota
At the end of the experiment, we found that the feces of CP mice were yellow, almost the color of the feed, and felt softer than the feces of normal mice (Figure 2A). After Illumina MiSeq sequencing analysis, a Venn diagram showed shared and unique OTUs between the two groups (Figure 2B). OTU-level ranked abundance curves showed the gut microbiota of the CP group had a significantly lower richness and evenness than the control group (Figure 2C).
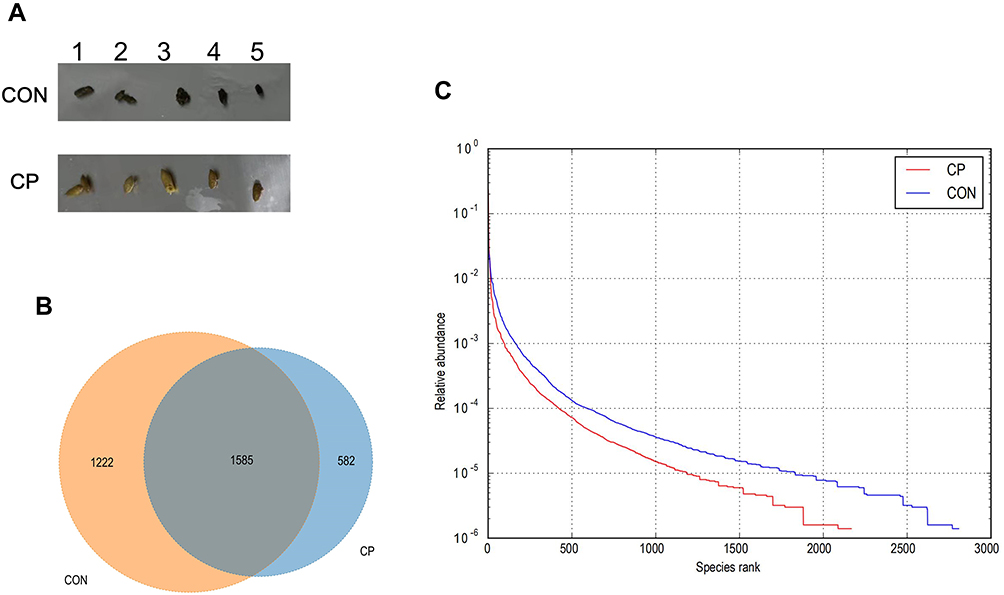 |
Figure 2 The appearance of the two groups of mice feces after modeling was completed (A), Venn diagram (B) and OTU-level ranked abundance curves (C). Abbreviations: CP, chronic pancreatitis group; CON, control group. |
The diversity of the fecal microbiota was determined by the alpha diversity analysis. Although there was no statistically significant difference in the Chao1 index between the two groups, the observed species and the Shannon and Simpson indexes in the CP group were lower than those in the control group (Figure 3A,B). Beta diversity between the two groups was also evaluated using unweighted UniFrac distances. A scatter plot based on PCoA scores showed a clear separation of the community composition between the two groups. PC1 and PC2 explained 42.94% and 15.47% of total variance, respectively (Figure 3C). PCA and NMDS showed similar results (Figure 3D,E).
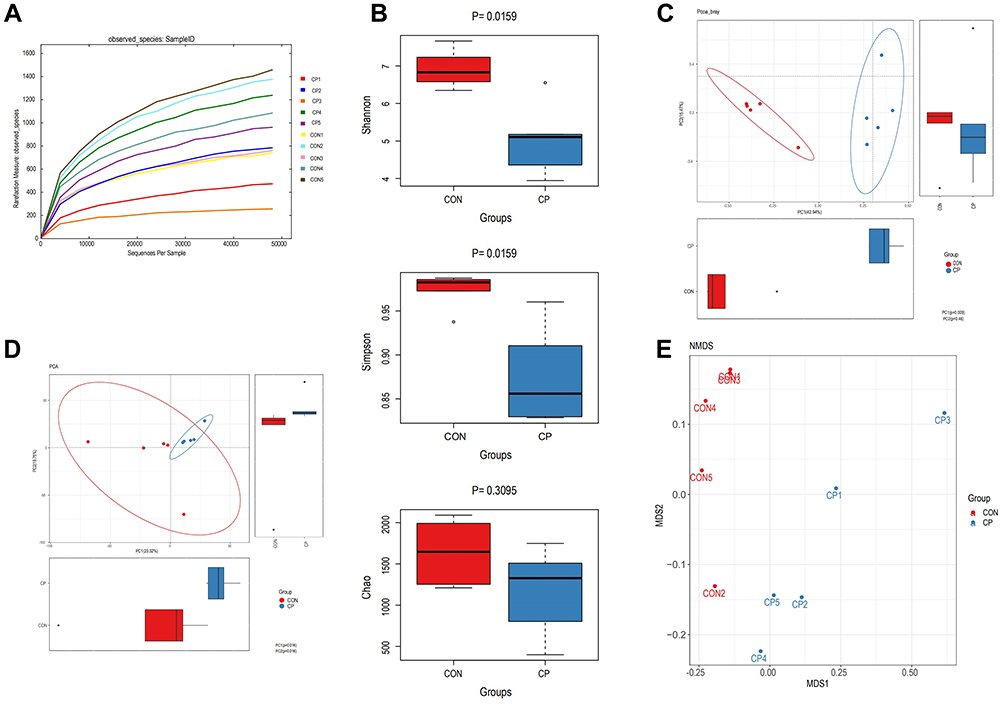 |
Figure 3 OTU-level alpha diversity indices, such as observed species (A), Shannon diversity index, Simpson index and Chao1 richness of each group (B), and beta diversity analysis visualized via principal coordinate analysis (PCoA) (C), principal component analysis (PCA) (D) and nonmetric multidimensional scaling (NMDS) (E). Abbreviations: CP, chronic pancreatitis group; CON, control group. |
Alterations of the Gut Microbiota
To determine the structural changes in the gut microbiota of the CP group and the control group, and the analysis of differences between the groups, we compared the relative abundance of the dominant strains from the phylum to genus level in the two groups. However, we found there were no differences between the CP group and the control group in class and order levels.
Bacteroidetes, Firmicutes, Proteobacteria and Actinobacteria were dominant at the phylum level. Bacteroidetes accounted for approximately 50% and Firmicutes accounted for approximately 46% of the total bacteria in the control group, and Bacteroidetes accounted for approximately 82% while Firmicutes accounted for about 7% in the CP group (Figure 4A). Bacteroidetes, Actinobacteria and Verrucomicrobia were more abundant in the CP group compared with the control group. While the levels of Firmicutes and the Firmicutes/Bacteroidetes ratio were lower in the CP group than in the control group (Table 1).
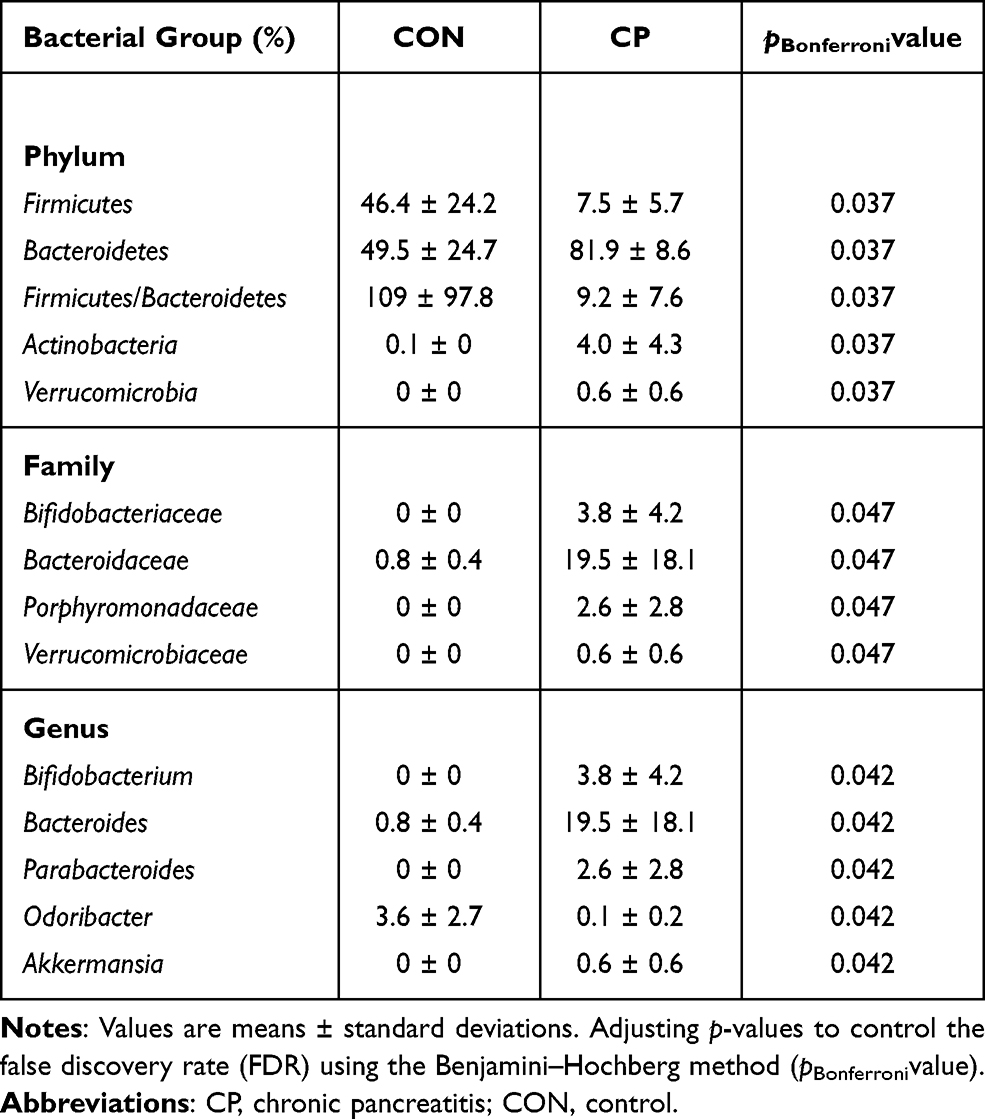 |
Table 1 Relative Abundance of Gut Bacterial Taxa in Two Groups |
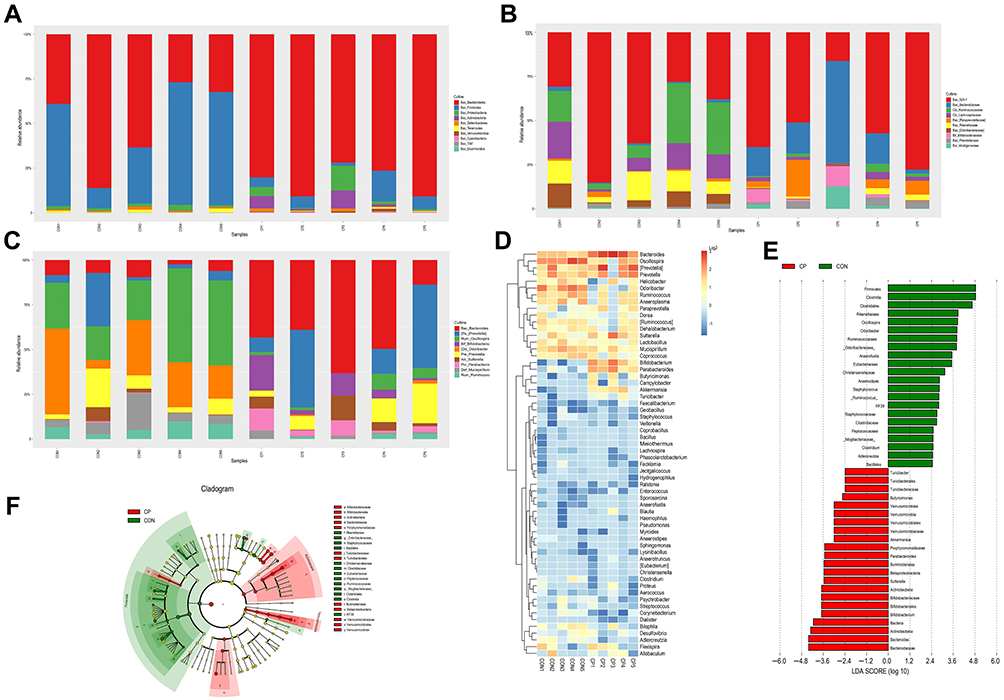 |
Figure 4 Relative abundances of the gut microbiota in the CP and CON groups at the phylum level (A), family level (B) and genus level (C), heatmap cluster at genus levels (D), cladogram of the LDA scores showing the abundant genera in CP (red) and CON (green) (E) and cladogram generated by LEfSe analysis showing the enriched taxa in CP (red) and CON (green) (F). Abbreviations: CP, chronic pancreatitis group; CON, control group; LDA, linear discriminant analysis; LEfSe, linear discriminant analysis effect size. |
At the family level, the microbiota was mainly composed of S24-7, Bacteroidaceae, Ruminococcaceae and Lachnospiraceae (Figure 4B). Bifidobacteriaceae, Bacteroidaceae, Porphyromonadaceae and Verrucomicrobiaceae were found to be more abundant in the CP group than the control group (Table 1).
At the genus level, Bacteroides, Prevotella and Odoribacter were the dominant bacteria (Figure 4C). The abundance of Bifidobacterium, Bacteroides, Parabacteroides and Akkermansia was higher in the CP group. However, the abundance of Odoribacter significantly reduced in the CP group (Figure 4D and Table 1). We also used LEfSe to detect differences in the microbiota profile between the two groups. The CP group was dominated by Actinobacteria, Verrucomicrobia, Bifidobacteriaceae, Bacteroidaceae, Porphyromonadaceae and Verrucomicrobiaceae. The control group was dominated by Firmicutes, Clostridia, Clostridiales and Rikenellaceae. (Figure 4E,F).
Association of Gut Microbiota Composition with Weight and Weight Changes
Before each intraperitoneal injection of the cerulein or saline, we measured the body weight of the two groups of mice, and obtained a total of 18 sets of data. We found that there was a statistical difference in body weight between the two groups at the twelfth injection. That is, at the last injection in the fourth week of the experiment, the weight of mice in the experimental group was lower than that in the control group, and the weight continued to be lower than the control group until the end of the experiment (Supplemental Figure 1).
We also found statistically significant differences in weight change between the two groups at the end of the study. To determine whether body weight and weight changes are associated with changes in gut microbial abundance, we additionally performed Spearman correlation analysis. However, there was no significant correlation between alterations of gut microbiota and in body weight and weight changes (Supplemental Tables 1–2).
Discussion
The cerulein-based model used in our study was an excellent histomorphological model of CP caused by recurrent acute pancreatitis. Despite the lack of a direct etiology correlation, this model is useful because the histological characteristics of different CP etiology are basically indistinguishable. However, the gut microbiota of this model has not been studied, and whether it is consistent with the distribution of gut microbiota in CP patients is unclear. To our knowledge, this was the first study to assess the gut microbiota in cerulein-induced CP.
Decreased gut microbiota diversity has been reported in CP animal models and CP patients. In this study, we also observed that the gut microbial diversity of cerulein-induced CP was significantly lower than that of healthy controls. This result suggested that gut microbiota diversity may be an important factor in regulating host metabolism and therefore can be used as a simple indicator of health status.
Bacteroidetes and Firmicutes are the two main intestinal phyla and they have been linked to obesity in both human and animal research.22,23 Turnbaugh et al22 observed that the microbiota of obese individuals displayed a higher level of the phylum Firmicutes and lower levels of Bacteroidetes. A possible explanation for this finding was that Firmicutes was more effective as an energy source than Bacteroidetes, which promoted more efficient absorption of calories and subsequent weight gain. Interestingly, obese people lost weight due to calorie restrictions and physical exercise24 as well as reduced fat or carbohydrate diets23 and laparoscopic sleeve gastrectomy25, which led to a distinct increase in Bacteroidetes and a decline in the abundance of Firmicutes and a reduction of the Firmicutes/Bacteroidetes ratio. Our results showed lower levels of Firmicutes and higher levels of Bacteroides, and the Firmicutes/Bacteroidetes ratio was significantly decreased in the gut microbiotas of CP mice. Although there was a statistically significant difference in body weight and weight changes between the two groups at the end of the study, there was no significant correlation between the Firmicutes/Bacteroidetes ratio and body weight and body weight changes in the CP and control groups. Therefore, a driver of changes in the composition of fecal microbiota may be the adaptability of bacteria to caloric restriction, as Bacteroides was less effective than Firmicutes as an energy source, thus inhibiting more efficient absorption of calories and subsequent slow weight gain.
As common probiotics, Bifidobacterium and Lactobacillus have received widespread attention. Surprisingly, our study found that Bifidobacterium was significantly higher in the CP group than in the control group. However, Lactobacillus was no different between the two groups. Our results seemed to be in conflict with previous data, which showed lower levels of Bifidobacterium or Lactobacillus in CP patients.7 Bifidobacterium increased significantly in prebiotic treatment of obese or overweight children.5 Although our study found that CP mice gained significantly less weight than healthy controls, both weight and weight changes have no relationship for this change in gut microbial abundance. Bifidobacterium was also found increased in active inflammatory bowel disease patients, and it may play a role in promoting inflammation.26 However, the role of increased Bifidobacterium in CP is unclear.
Another interesting taxon identified in our study was that Akkermansia abundance increased and Odoribacter abundance decreased. Akkermansia, which belongs to the Verrucomicrobia phyla, has been proposed as a potential biomarker for the state of healthy gut status. It has been determined that the intestinal Akkermansia abundance decreased in obesity or other signs of metabolic disorder.27 The antiobesity effects of pterostilbene28 induced an increase in Verrucomicrobia, Akkermansia and Odoribacter and a decrease in the levels of Firmicutes, and it also confirmed that there was a strong inverse correlation between Akkermansia muciniphila and body weight. However, no significant correlation between higher abundance of Akkermansia with weight and weight changes was observed in our study. The reason for the higher abundance of Akkermansia in the CP group may be due to the low utilization of intestinal nutrients in favor of the growth of Akkermansia. Genus Odoribacter, which belongs to the family Porphyromonadaceae, was found to decrease in our CP group. The genera of this taxa are often associated with opportunistic infections, particularly intra-abdominal and systemic infections.29 Odoribacter splanchnicus also showed a negative correlation with adiposity;28 nevertheless, the relevance of this change in our studies was unclear.
Although numerous CP animal models have been introduced, the gut microbiota of those model is scarcely studied. So far, only gut microbiota of CP induced by ethanol and cerulein11 and 3,5-diethoxycarbonyl-1,4-dihydrocollidine (DDC) have been reported.12,13 Han et al11 found that the bacterial richness and diversity of CP mice induced by ethanol and cerulein were reduced, and the gut microbiota changed, including the relative abundance of Lachnospiraceae_NK4A136, Ruminiclostridium and Roseburia were reduced, while Bacteroides and Alloprevotella were higher. Several possible reasons can explain the difference between our main results and theirs. Although all experiments were conducted in the same animal experiment center and used the same animal, namely male C57BL/6 mice, our CP model was different from this study. We used cerulein for modeling, they used cerulein in combination with alcohol for modeling. In addition, the location of our materials was different, colon feces were collected in their research, 1–2 pieces of uncontaminated anus feces from each mouse were collected in our study. Surprisingly, it was found12 that the DDC-induced CP model had significantly increased gut microbiota diversity and richness, DDC inducement decreased the proportion of Lactobacillus, Bacteroides, Roseburia and Prevotella, but increased the proportion of Alistipes, Incertae_Sedis, Helicobacter, Parabacteroides and Rikenella in the CP group compared with that in the control group. Li et al13 also observed that the diversity and evenness of the DDC-induced CP group was higher. They found the phylum Verrucomicrobia was unique in the CP group and DDC induced the proliferation of Verrucomicrobia. The CP group contained less Firmicutines but more Bacteroidetes when compared with the control group, and the decreased ratio of Firmicutes/Bacteroidetes suggested that the progression of CP resulted in the disproportions of Firmicutes and Bacteroidetes in the gut. In our study, we observed that the abundance of Bacteroides, Actinobacteria and Verrucomicrobia in the CP model group increased, but the abundance of Firmicutes decreased.
In summary, although changes in the gut microbiota of the three CP animal models have been reported, the results are inconsistent. This may be due to the different species of mice. Two of the studies12,13 used ICR mice. This study and the other study11 used C57BL/6 mice. The above-mentioned modeling methods were different in these four studies, and in two of the studies12,13 the gut microbiota comparison between multiple groups was performed. Different statistical data analysis methods may also affect the results.
Numerous studies have focused on microbial associations with CP in humans,15 and the results of these studies have been reviewed.7 This review reported that three studies showed lower levels of Bifidobacterium or Lactobacillus and higher levels of Enterobacteriaceae in CP. One of the studies15, which compared patients with endocrine and exocrine insufficiency, reported that patients with both CP and type-3c diabetes (T3cDM) had higher levels of Bacteroidetes and lower levels of Faecalibacterium compared to those without T3cDM, and pancreatic exocrine insufficiency had lower amounts of Bifidobacterium compared to those without pancreatic exocrine insufficiency. While Bifidobacteria levels were higher in CP and T3cDM without exocrine insufficiency. Recently, Zhou et al30 found in patients with CP, not including CP patients with diabetes, their gut microbiota dysbiosis with decreased diversity and richness. Compared with the control group, the intestinal microbiome of the CP group had a lower abundance of Firmicutes and Actinobacteria, and a higher abundance of Proteobacteria. Our research was partially similar to this research. However, the gut microbiota of the three CP animal models mentioned above was not completely consistent with CP patients. Most likely, these differences can be due to different environmental influences, such as diet, physical activity, as well as socioeconomic impacts.31 Therefore, none of these three models of CP can fully simulate patients with CP. This should be taken into account in future studies of the mechanisms involved in gut microbiotas in CP animal models and finding suitable animal models is worthy of further research.
There are some limitations to our research. First, the observation of gut microbiota and CP was independent. Therefore, the interaction between them remains unclear. We did not understand causality. In addition, we evaluated only a small number animals, it is necessary to analyze the gut microbiota of more samples, and the metabolism of a single bacteria and the correlation between the gut microbiota and CP deserve further study. Second, we did not analyze inflammatory biomarkers and internal and external secretions of the pancreas, which may explain changes in the intestinal flora. Finally, we only observed the changes in the gut microbiota of the two groups after the experiment was completed, and did not detect the dynamic changes, such as weight detection. This may have guiding significance for us to discover that the gut microbiota begins to change.
In summary, our results showed the bacterial richness and diversity of CP mice induced by cerulein were reduced, and the gut microbiota changed, including lower levels of Firmicutes, decreased Firmicutes/Bacteroidetes ratio and increased abundance of Bacteroidetes, Actinobacteria and Verrucomicrobia. Although we found statistically significant differences in body weight and weight change between the two groups at the end of the study, there was no significant correlation between alterations of gut microbiota and in body weight and weight changes. In short, more research is needed to confirm our results.
Acknowledgments
The authors would like to thank Hangzhou Guhe Information and Technology Co., Ltd for providing sequencing reaction.
Author Contributions
All authors made substantial contributions to conception and design, acquisition of data, or analysis and interpretation of data; took part in drafting the article or revising it critically for important intellectual content; agreed to submit to the current journal; gave final approval of the version to be published; and agree to be accountable for all aspects of the work.
Funding
This research was supported by the Basic Scientific Research Operating Expenses of Southeast University, China (No 3290009423) and Social Development and Clinical Frontier Technology Project of Jiangsu Province of China (No BE2019714).
Disclosure
The authors report no conflicts of interest in this work.
References
1. Nicholson JK, Holmes E, Kinross J, et al. Host-gut microbiota metabolic interactions. Science (New York, NY). 2012;336:1262–1267.
2. Marchesi JR, Adams DH, Fava F, et al. The gut microbiota and host health: a new clinical frontier. Gut. 2016;65:330–339.
3. Sartor RB, Wu GD. Roles for intestinal bacteria, viruses, and fungi in pathogenesis of inflammatory bowel diseases and therapeutic approaches. Gastroenterology. 2017;152(2):327–339.e4.
4. Turnbaugh PJ, Hamady M, Yatsunenko T, et al. A core gut microbiome in obese and lean twins. Nature. 2009;457:480–484.
5. Nicolucci AC, Hume MP, Martinez I, Mayengbam S, Walter J, Reimer RA. Prebiotics reduce body fat and alter intestinal microbiota in children who are overweight or with obesity. Gastroenterology. 2017;153:711–722.
6. Burcelin R, Serino M, Chabo C, Blasco-Baque V, Amar J. Gut microbiota and diabetes: from pathogenesis to therapeutic perspective. Acta Diabetol. 2011;48:257–273.
7. Memba R, Duggan SN, Ni Chonchubhair HM, et al. The potential role of gut microbiota in pancreatic disease: a systematic review. Pancreatology. 2017;17(6):867–874.
8. Whitcomb DC, Frulloni L, Garg P, et al. Chronic pancreatitis: an international draft consensus proposal for a new mechanistic definition. Pancreatology. 2016;16(2):218–224.
9. Capurso G, Signoretti M, Archibugi L, Stigliano S, Delle Fave G. Systematic review and meta-analysis: small intestinal bacterial overgrowth in chronic pancreatitis. United European Gastroenterol. 2016;4(5):697–705.
10. Gorovits ES, Tokareva EV, Khlynova OV, Zhelobov VG. El’kin VD: [complex evaluation of intestine microbiocenosis condition in patients with chronic pancreatitis]. Zh Mikrobiol Epidemiol Immunobiol. 2013;4:73–76.
11. Han MM, Zhu XY, Peng YF, Lin H, Liu DC, Li L. The alterations of gut microbiota in mice with chronic pancreatitis. Ann Transl Med. 2019;7(18):464.
12. Hu Y, Teng C, Yu S, et al. Inonotus obliquus polysaccharide regulates gut microbiota of chronic pancreatitis in mice. AMB Express. 2017;7:39.
13. Li K, Zhuo C, Teng C, et al. Effects of ganoderma lucidum polysaccharides on chronic pancreatitis and intestinal microbiota in mice. Int J Biol Macromol. 2016;93:904–912.
14. Kim H. Cerulein pancreatitis: oxidative stress, inflammation, and apoptosis. Gut Liver. 2008;2(2):74–80.
15. Jandhyala SM, Madhulika A, Deepika G, et al. Altered intestinal microbiota in patients with chronic pancreatitis: implications in diabetes and metabolic abnormalities. Sci Rep. 2017;7:43640.
16. Hamada S, Masamune A, Nabeshima T, Shimosegawa T. Differences in gut microbiota profiles between autoimmune pancreatitis and chronic pancreatitis. Tohoku J Exp Med. 2018;244:113–117.
17. Ulmasov B, Xu Z, Talkad V, Oshima K, Neuschwander-Tetri BA. Angiotensin ii signaling through the at1a and at1b receptors does not have a role in the development of cerulein-induced chronic pancreatitis in the mouse. Am J Physiol Gastrointest Liver Physiol. 2010;299:G70–G80.
18. Zaura E, Keijser BJ, Huse SM, Crielaard W. Defining the healthy “core microbiome” of oral microbial communities. BMC Microbiol. 2009;9:259.
19. Lozupone CA, Hamady M, Kelley ST, Knight R. Quantitative and qualitative beta diversity measures lead to different insights into factors that structure microbial communities. Appl Environ Microbiol. 2007;73:1576–1585.
20. Ramette A. Multivariate analyses in microbial ecology. FEMS Microbiol Ecol. 2007;62:142–160.
21. Segata N, Izard J, Waldron L, et al. Metagenomic biomarker discovery and explanation. Genome Biol. 2011;12:R60.
22. Turnbaugh PJ, Ley RE, Mahowald MA, Magrini V, Mardis ER, Gordon JI. An obesity-associated gut microbiome with increased capacity for energy harvest. Nature. 2006;444:1027–1031.
23. Ley RE, Turnbaugh PJ, Klein S, Gordon JI. Microbial ecology: human gut microbes associated with obesity. Nature. 2006;444:1022–1023.
24. Nadal I, Santacruz A, Marcos A, et al. Shifts in clostridia, bacteroides and immunoglobulin-coating fecal bacteria associated with weight loss in obese adolescents. Int J Obes (Lond). 2009;33(7):758–767.
25. Damms-Machado A, Mitra S. Effects of surgical and dietary weight loss therapy for obesity on gut microbiota composition and nutrient absorption. Biomed Res Int. 2015;2015:806248.
26. Wang W, Chen L, Zhou R, et al. Increased proportions of bifidobacterium and the lactobacillus group and loss of butyrate-producing bacteria in inflammatory bowel disease. J Clin Microbiol. 2014;52:398–406.
27. Derrien M, Belzer C, de Vos WM. Akkermansia muciniphila and its role in regulating host functions. Microb Pathog. 2017;106:171–181.
28. Etxeberria U, Hijona E, Aguirre L, et al. Pterostilbene-induced changes in gut microbiota composition in relation to obesity. Mol Nutr Food Res. 2017;61:1.
29. Boente RF, Ferreira LQ, Falcao LS, et al. Detection of resistance genes and susceptibility patterns in bacteroides and parabacteroides strains. Anaerobe. 2010;16:190–194.
30. Zhou CH, Meng YT, Xu JJ, et al. Altered diversity and composition of gut microbiota in Chinese patients with chronic pancreatitis. Pancreatology. 2020;20(1):16–24.
31. Dugas LR, Fuller M, Gilbert J. Layden BT: the obese gut microbiome across the epidemiologic transition. Emerg Themes Epidemiol. 2016;13:2.
 © 2021 The Author(s). This work is published and licensed by Dove Medical Press Limited. The full terms of this license are available at https://www.dovepress.com/terms.php and incorporate the Creative Commons Attribution - Non Commercial (unported, v3.0) License.
By accessing the work you hereby accept the Terms. Non-commercial uses of the work are permitted without any further permission from Dove Medical Press Limited, provided the work is properly attributed. For permission for commercial use of this work, please see paragraphs 4.2 and 5 of our Terms.
© 2021 The Author(s). This work is published and licensed by Dove Medical Press Limited. The full terms of this license are available at https://www.dovepress.com/terms.php and incorporate the Creative Commons Attribution - Non Commercial (unported, v3.0) License.
By accessing the work you hereby accept the Terms. Non-commercial uses of the work are permitted without any further permission from Dove Medical Press Limited, provided the work is properly attributed. For permission for commercial use of this work, please see paragraphs 4.2 and 5 of our Terms.