")
Back to Journals » ClinicoEconomics and Outcomes Research » Volume 11
Characteristics and outcome of high-cost ICU patients
Authors Aung YN , Nur AM , Ismail A, Aljunid SM
Received 18 March 2019
Accepted for publication 1 July 2019
Published 2 August 2019 Volume 2019:11 Pages 505—513
DOI https://doi.org/10.2147/CEOR.S209108
Checked for plagiarism Yes
Review by Single anonymous peer review
Peer reviewer comments 2
Editor who approved publication: Prof. Dr. Dean Smith
Yin Nwe Aung,1,2 Amrizal M Nur,2 Aniza Ismail,2,3 Syed M Aljunid2,4
1Department of Laboratory Diagnostic Services and Community Medicine, Faculty of Medicine and Health Sciences, UCSI University, Kuala Lumpur, Malaysia; 2International Centre for Casemix and Clinical Coding, Faculty of Medicine, Universiti Kebangsaan Malaysia, Kuala Lumpur, Malaysia; 3Department of Community Health, Faculty of Medicine, Universiti Kebangsaan Malaysia, Kuala Lumpur, Malaysia; 4Department of Health Policy and Management, Faculty of Public Health, Kuwait University, Hawally, Kuwait
Purpose: Care at ICUs is expensive and variable depending on the type of care that the patients received. Knowing the characteristics of the patient and his or her disease is always useful for improving health services and cost containment.
Patients and methods: An observational study was conducted at four different intensive care units of an academic medical institution. Demographic characteristics, disease-management casemix information, cost and outcome of the high costing decile, and the rest of the cases were compared.
Results: A total of 3,220 discharges were included in the study. The high-cost group contributed 35.4% of the ICU stays and 38.8% of the total ICU expenditure. Diseases of the central nervous system had higher odds to be in the top decile of costly patients whereas the cardiovascular system was more likely to be in the non-high cost category. The high-cost patients were more likely to have death as an outcome (19.2% vs 9.3%; p<0.001). The most common conditions that were in the high-cost groups were craniotomy, other ear, nose, mouth, and throat operations, simple respiratory system operations, complex intestinal operations, and septicemia. These five diagnostic groups made up 43% of the high-cost decile.
Conclusion: High-cost patients utilized almost 40% of the ICU cost although they were only 10% of the ICU patients. The chances of admission to the ICU increased with older age and severity level of the disease. Central nervous system diseases were the major problem of patients aged 46–69 years old. In addition to cost reduction strategies at the treatment level, detailed analysis of these cases was needed to explore and identify pre-event stage prevention strategies.
Keywords: casemix, MY-DRG, utilization, burden, health services, Malaysia
Introduction
Intensive care unit (ICU) is an integral component of a hospital that utilizes scarce resources. Care of patient at the ICU is the most resource intensive as well as the costliest in the hospital. ICU is the place which provides a large part of aggressive care, accounting for 20–30% of the hospital care costs.1 ICU utilized resources disproportionately; a huge amount of money is required to benefit very few people.2–5 Several studies reported that the top 5–50% of the health care users account for more than 50% of the health care utilization and cost.6–11 The daily cost of an ICU bed is three times higher than a bed in the general floor.12,13 The cost of ICU care is up to 13% of the total hospital cost.14 Moreover, the cost for ICU services is still escalating mainly due to advances in medical technology and changes in disease epidemiology, with a rise of 12% over 6 years.12 Financial pressure is one of the problems that many hospitals and health systems face. Improving the efficiency of health services is the key target for health care managers and policy makers.
High-cost users were defined as the top 10% of the patients when all individuals with at least one day spent in the ICU were ranked from the highest to the lowest total ICU cost during their ICU stay. Characterization of high-cost ICU spenders and profiling the types of their diseases would identify the areas to be focused upon and explored for possible interventions in order to limit the health care cost. The top deciles of the highest resource utilizing cases were explored in earlier studies, but the study focus was particularly on the elderly and the study locations were mainly in the west and developed countries. This study aimed to explore the patient characteristics and the outcomes of the high-cost ICU patients in a Malaysian hospital and to compare the finding with those of earlier studies done in developed countries. This study also sought to evaluate the association between high-cost spenders and demographic/clinical characteristics of patients admitted into the ICUs.
ICU is one of the most cost-intensive units in hospital services. This study focuses on high-cost cases which consume a significant amount of resources and is the first study in Malaysia that attempts to estimate the resource used and outcome of services in the ICU setting. Since Malaysia is a middle-income country with limited resources, the findings may provide hospital managers and policy makers with the information to find solutions to enhance the efficiency of services for these high-cost patients managed in ICUs.
Materials and methods
We conducted a retrospective observational cross-sectional study at the Hospital Canselor Tuanku Muhriz (HCTM) with the approval of the ethics committee of Univeristi Kebangsaan Malaysia (UKM), as stated in approval letter numbered UKM/PPI/111/8/JEP-2016-540. The consent from the patients to review the medical records was not the requisite of the Research and Ethical Committee as long as the patients’ identifiable information is not released.
Study population
The Hospital Canselor Tuanku Muhriz, also known as Hospital Univiersiti Kebangsaan Malaysia, is a tertiary teaching hospital. It is located in Kuala Lumpur, Malaysia, and has almost 40,000 admissions per year. At HCTM, different units provide different levels of health services, with intensive care being one of them. There are four main units providing intensive care: General ICU, Cardiac ICU, Coronary Care Unit ICU, and Pediatric ICU. Some cases also require multiple ICU admissions. All patients who were admitted to any type of ICU either single unit or multiple units from 1 January 2013 to 31 December 2015 were included in the study. The patients were identified from the ICU census. Those patients who were admitted to paid wards and those patients with incomplete charts were excluded from the study. If a patient was admitted to several units, the most suitable diagnosis was based on the Malaysian Diagnostic Related Groups (MY-DRG) codes from the discharge summary. When the patient was admitted to multiple ICUs, the total cost at each ICU was calculated and the summation was used as the cost of care at ICU.
Data source
The data were obtained from the hospital electronic records, discharge summary, casemix database, and hospital costing template, ICU census records and also from patient records. The length of stay at ICU was identified from the ICU census which kept the list of all patients admitted to and discharged from ICU. This information was again confirmed with the patients’ records. The discharge summary and MY-DRG diagnosis of these patients were obtained from the HCTM electronic medical record, MY-DRG database and some incomplete information were again counter checked with the patients’ record. The cost of care at ICU was estimated using a top-down approach. In this method, the cost of care at HCTM was allocated into three cost centers, namely, overhead cost centers, intermediate cost centers, and final cost centers. The overhead cost centers consist of all the hidden costs such as administration and infrastructure are considered as overhead cost centers. The cost of care at overhead cost centers is allocated to the intermediate cost centers, where areas with special services involved such as investigation. The cost of care at intermediate cost centers and allocated from overhead cost centers are again assigned to final cost centers, the cost of care in the wards. The required financial information was obtained from the hospital financial department and the information recorded in the hospital costing template. The cost was first recorded in Malaysian Ringgits, and then converted to USD using the average exchange rate during the period of the study.
Variables
From the above data sources, the following variables were extracted: total length of stay at hospital, length of stay at each intensive care unit, age and sex of the patient, the MY-DRG groups by discharge summary, severity and outcome of the patient, and cost during the stay at ICU per episode of admission. According to the cost of care at ICU, the patients were grouped into two groups, the top decile was grouped as high-cost patients, and the remaining patients were grouped into non-high-cost patients. The other covariates were extracted from the MY-DRG casemix database. The age was then grouped into different categories similar to an earlier study completed in Canada. In their study, only adult patients were recruited, omitting cases under 18, and they were grouped into 18–45, 46–69, 70–79, and over 80 years old. As our study included PICU, we had one additional age group of 0–17. That study used Elixhauser comorbidity score, which we have not captured in our study database. We used the MY-DRG severity level as a variable in place of the Elixhauser score. MY-DRG coded the last digit as severity levels I, II, and III, based on the presence of comorbidities and complications and the extent of procedure required, determined by the MY-DRG grouper software using the assigned algorithm. The software algorithm was validated through a series of casemix implementation works in Malaysia and a number of developing countries.15–18
Statistical analysis
Univariate analyses were used to compare the patient characteristics between high-cost and non-high-cost groups. The case was classified as a high-cost group when the cost of care at ICU per admission episode was in the top 10%. Patient demographics including age, sex, severity level (mild, moderate, severe), patient outcome (death or alive), and most common MY-DRGs were assessed. In addition, the cost of care at ICU and the cost of care for total hospital admission between the two groups were also compared. Continuous variables were analyzed using two sample t-test for normally distributed data and Man–Whitney U test for non-parametric data. The age was analyzed as both continuous and categorical variables, by grouping the ages into 0–17; 18–45; 46–69; 70–79; and 80 and above. The age groups were classified based on a previous study.13 The categorical data between the two groups were tested using Chi-square test with significance level of 0.05.
Multivariate logistic regression was conducted to determine the factors influencing the high-cost status, presented with adjusted odds ratio (OR). The variables included in the regression model was based on the previous studies and availability of data. Our model included age (as categorical data), sex, severity of the case, the MY-DRG group. Subgroup analysis was done on patients with death as an outcome status using the same logistic regression. The data were analyzed using the statistical software package STATA version 13.
Results
There were 3,220 cases admitted to ICU. The top costing 338 cases were identified as the high-cost group and the remaining 2,882 cases as non-high-cost group. The mean cost at ICU among the high-cost patients was USD19,223 (SD 10,043), median USD16,370 (IQR 12,593–21,961). A Non-high-cost patient required USD3,561 (2,269) on average with a median of USD2,519 (IQR 2,010–4,392) during the ICU stay. The mean cost of total hospital stay among the high-cost patients was USD32,767 (SD 29,428), median USD25,793 (IQR 18,799–35,344) and that for among the non-high cost was USD8,472 (SD 11,320), median USD5,633 (IQR 3,278–9,926). The high-cost patient spent 58.7% of the total hospital cost at ICU whereas for the non-high-cost patients it was only 42.0%. The average costs of care by age group, by severity level, by patient outcome, and by sex are presented in Table 1.
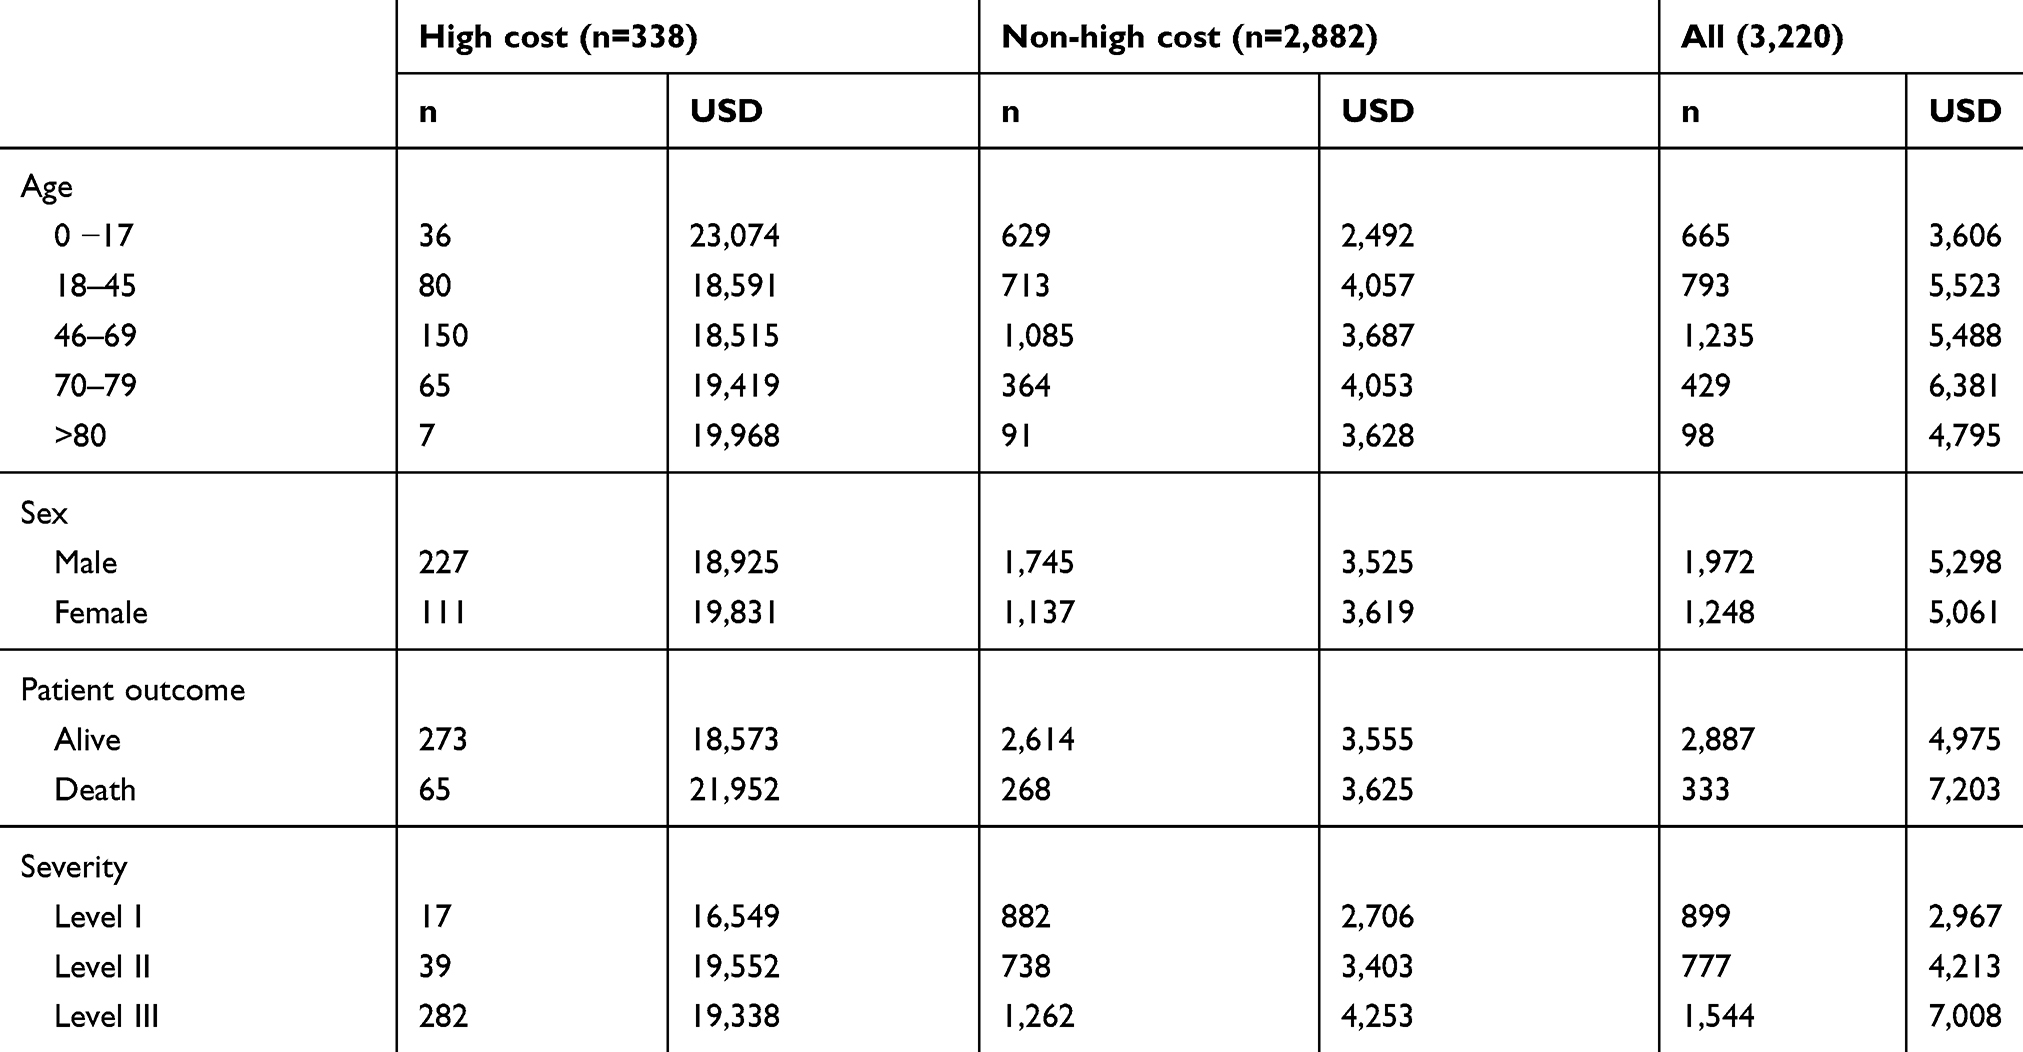 |
Table 1 Mean cost of care (USD) |
The detailed characteristics of the patients between the two groups are presented in Table 2. The mean age was 49.8 years (SD 22.8) among the high-cost patients, and 42.8 years among the non-high-cost patients (SD 25.8). (p<0.001). In both the high-cost and non-high-cost groups, those cases aged 46–69 were the highest cases followed by the 18–45 years age group. This was most likely due to the uneven age grouping pattern. The differences in distributions were observed among the following age groups: 0–17, 46–69, and 70–79 (Table 2).
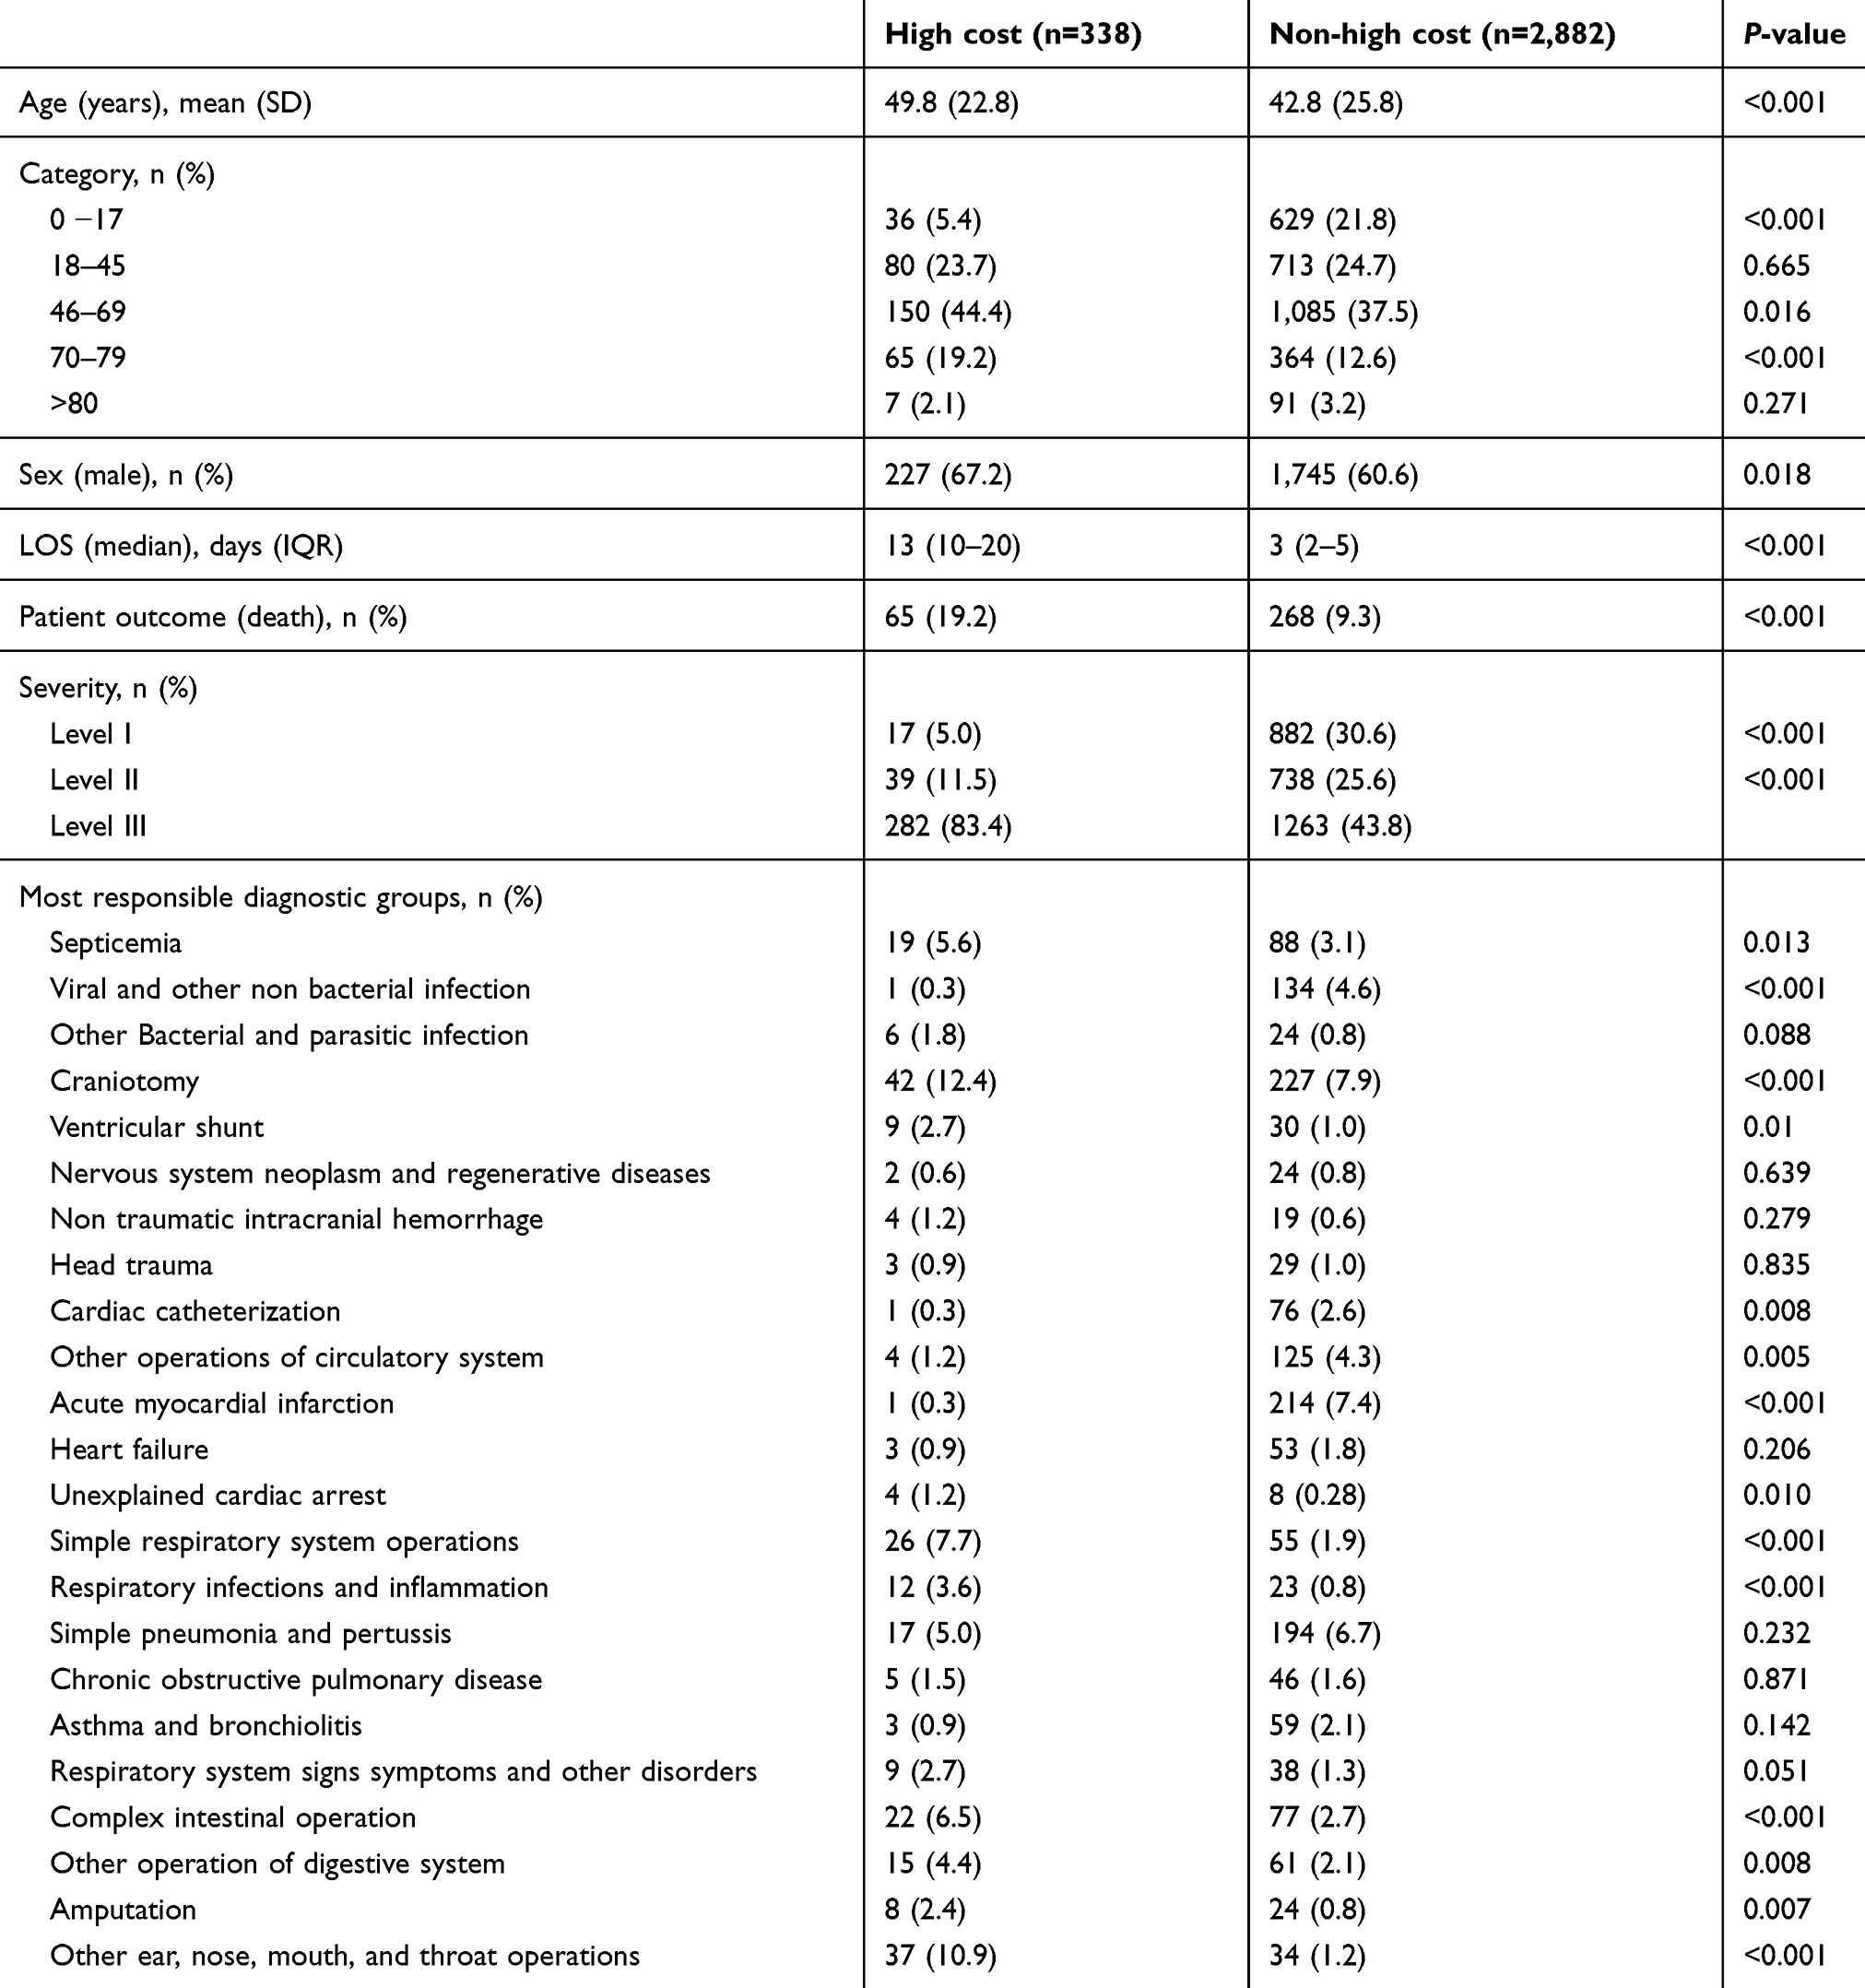 |
Table 2 Patient characteristics |
There was a slightly higher percentage of male patients in the high-cost group 67.2% vs 60.6%, but the difference was statistically significant, with p-value 0.018. More deaths occurred in the high-cost patients with 19.2% death compared to 9.3% of the death in the non-high-cost cases (p<0.001). High-cost cases had higher MY-DRG severity level, whereas severity levels I, II, and III were more evenly distributed in the non-high-cost group. Craniotomy, ear nose mouth, and throat operations, simple respiratory system operations, and complex intestinal operations were significantly more in the high-cost group (p<0.001). However, cases like acute myocardial infarction and viral and non-bacterial infections were particularly high in the non-high-cost group.
Multivariate logistic regression analysis was also done, and the results showed that compared to the age group 0–17, the odds ratio increased from 1.57 to 2.00 with increasing age groups (p<0.05) except for the age group of older than 80 where the odds ratio of the high-cost group was 0.76 compared to those <17 (p=0.56). This could probably be due to the very few numbers of elderly patients admitted to the ICU. The adjusted OR of male to female in the high-cost group was 1.42 (95% CI 1.09−1.85), and the death chance was 1.4 times higher in the high-cost group (95% CI 0.99−1.97). We explored the most commonly occurring MY-DRG groups compared to the rest of the MY-DRGs. Craniotomy, respiratory problems (respiratory system operations, respiratory infections and inflammation, and pneumonia/pertussis), complex gastrointestinal operations, and ear, nose, mouth, and throat infection had statistically significant higher odds of being in the high-cost group (OR ranging from 3.25 to 12.78 all with p<0.001) (Table 3).
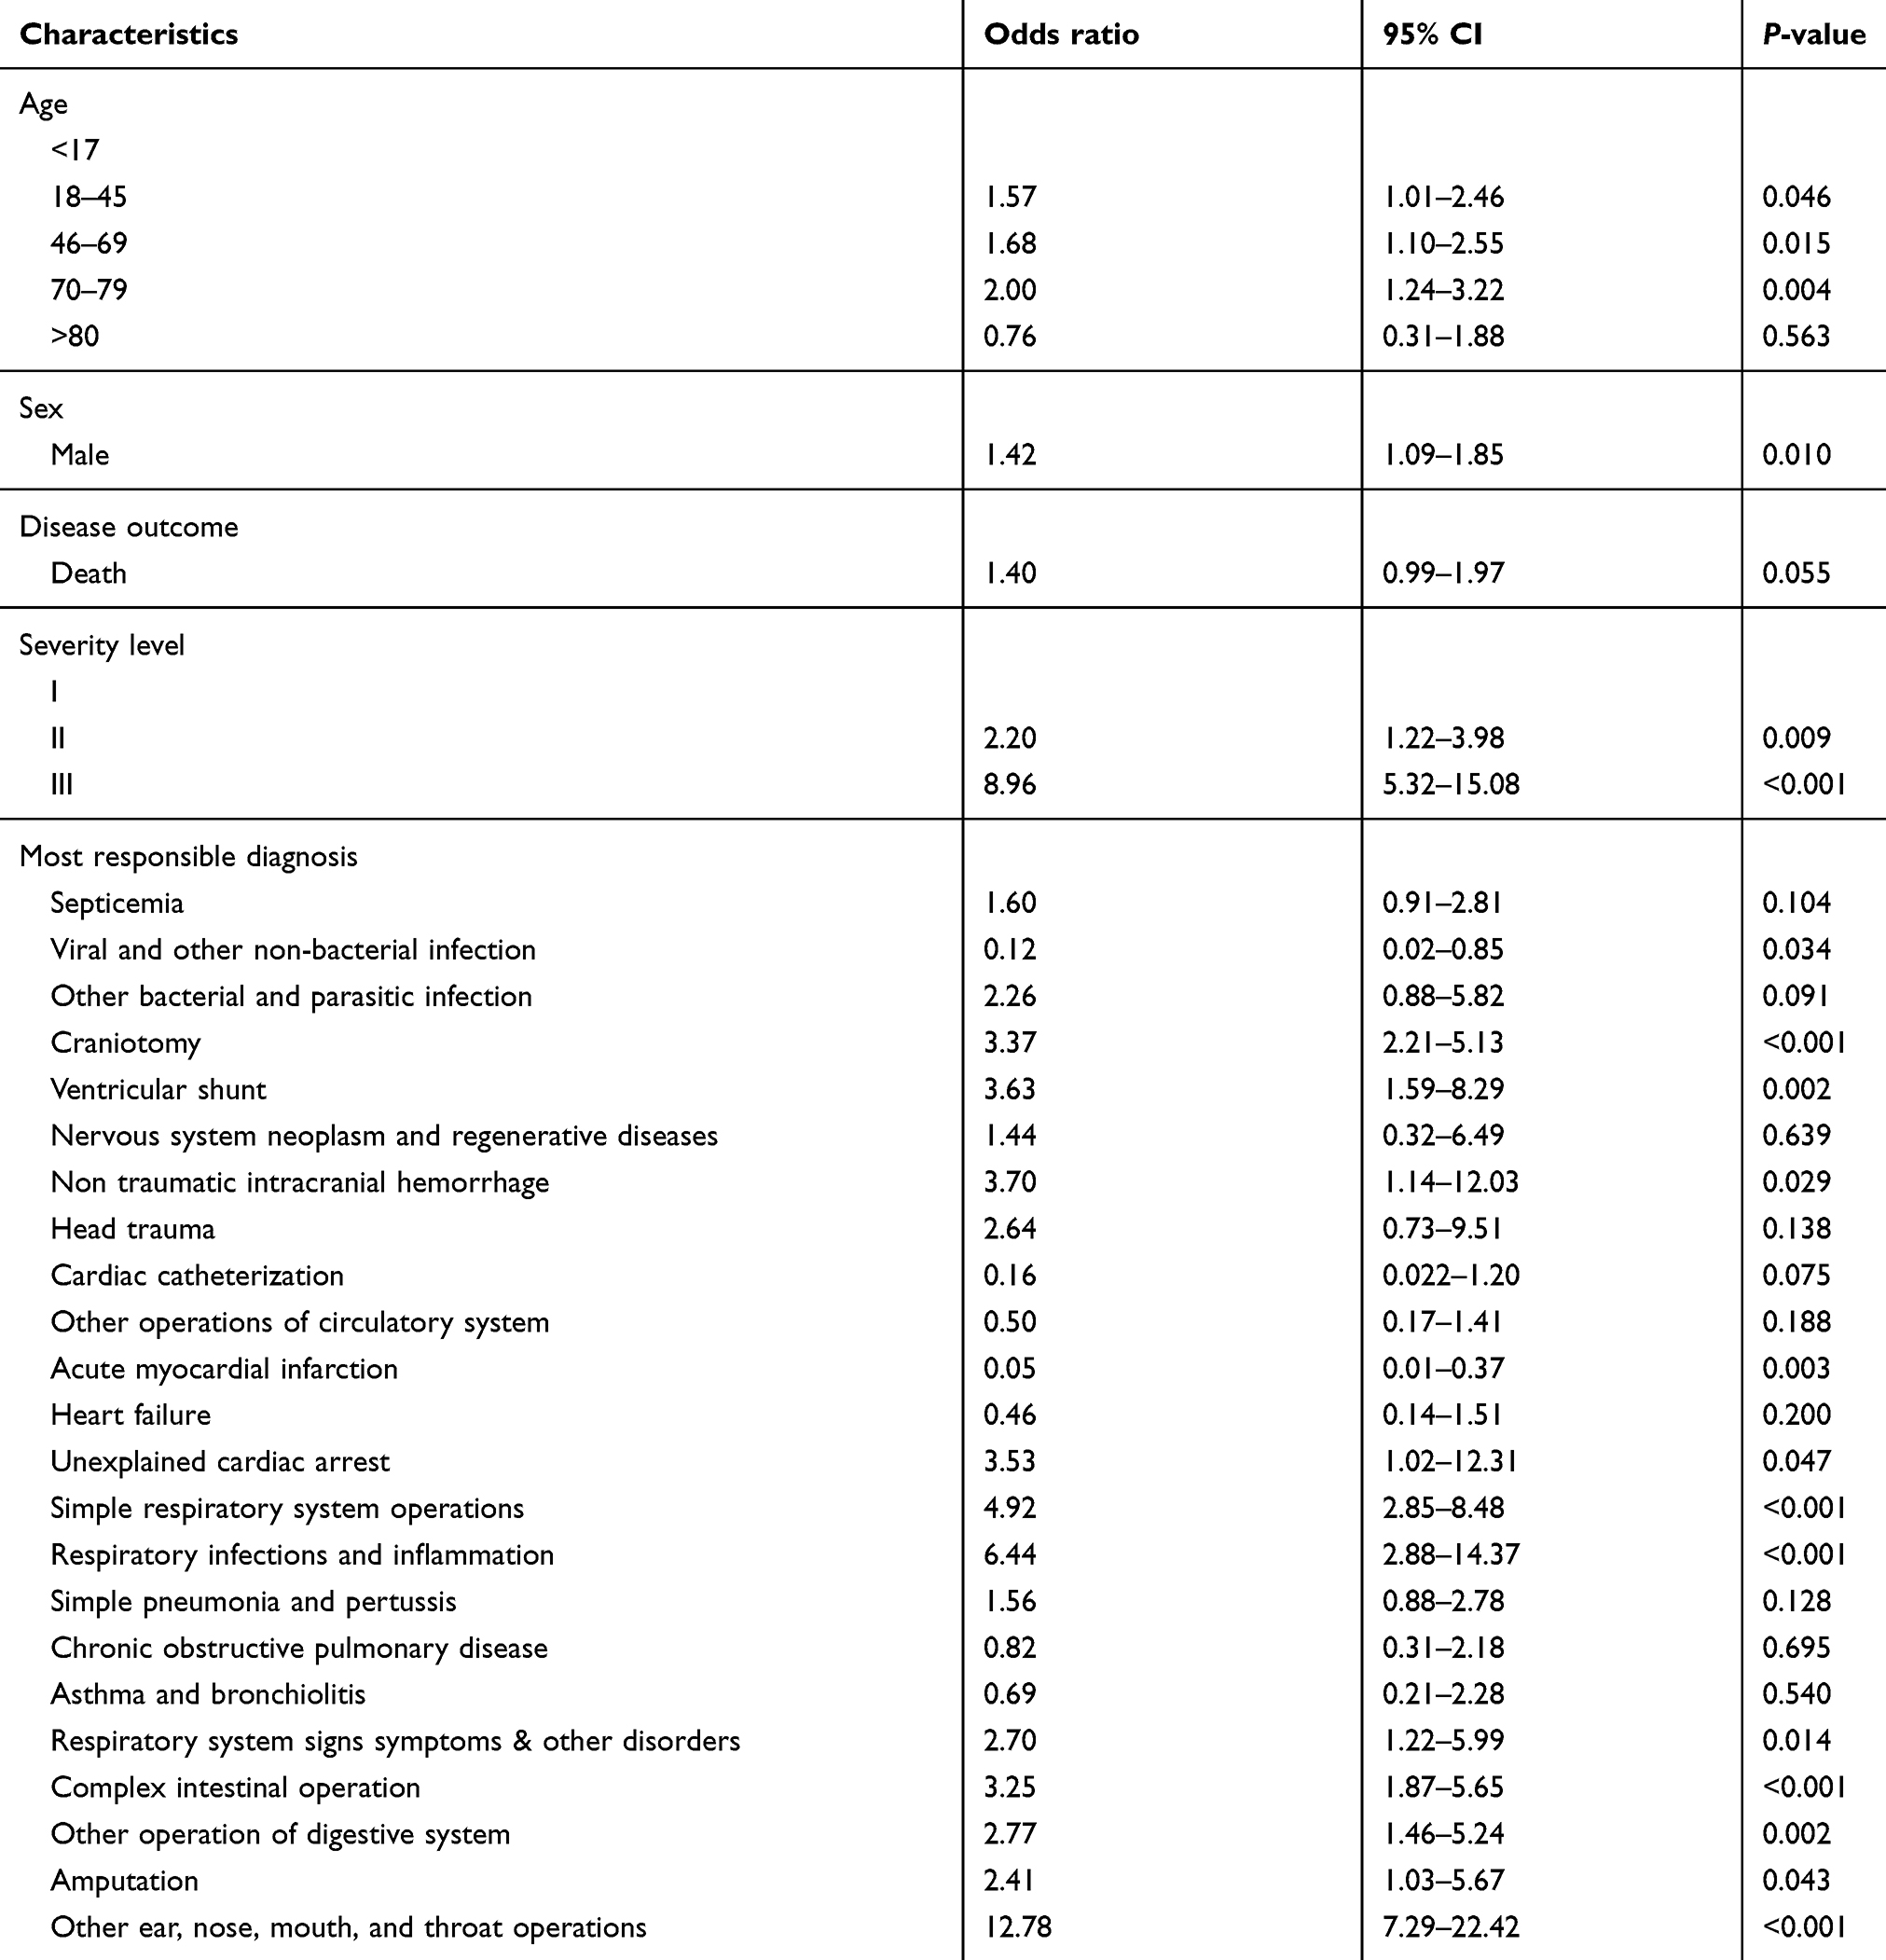 |
Table 3 Multivariate logistic regression for variables associated with high cost among all patients |
We also did a subgroup analysis among deceased patients. Although the odds ratio direction remained the same, the findings were no longer statistically significantly different, except for a few. Severity level III had 12.24 times higher odds (95% CI 1.24–120.18; p=0.032) to be in the high-cost group than those from severity level I. Compared to the rest of the MY-DRGs, the adjusted OR for diseases having MYDRG code for simple respiratory operation was 5.6 (95% CI 1.41–22.18; p=0.014); that for complex intestinal operations was 8.95 (95% CI 2.3–34.76; p=0.00) and that for other operations of the digestive system was 8.74 (95% CI 1.98–38.65; p=0.004). Amputation was another MY-DRG with odds ratio of 6.23 (95% CI 1.18–32.96; p=0.031). There was no death among asthma and bronchiolitis cases. The adjusted odds ratio of deaths among the high cost and the non-high-cost cases can be seen in Table 4.
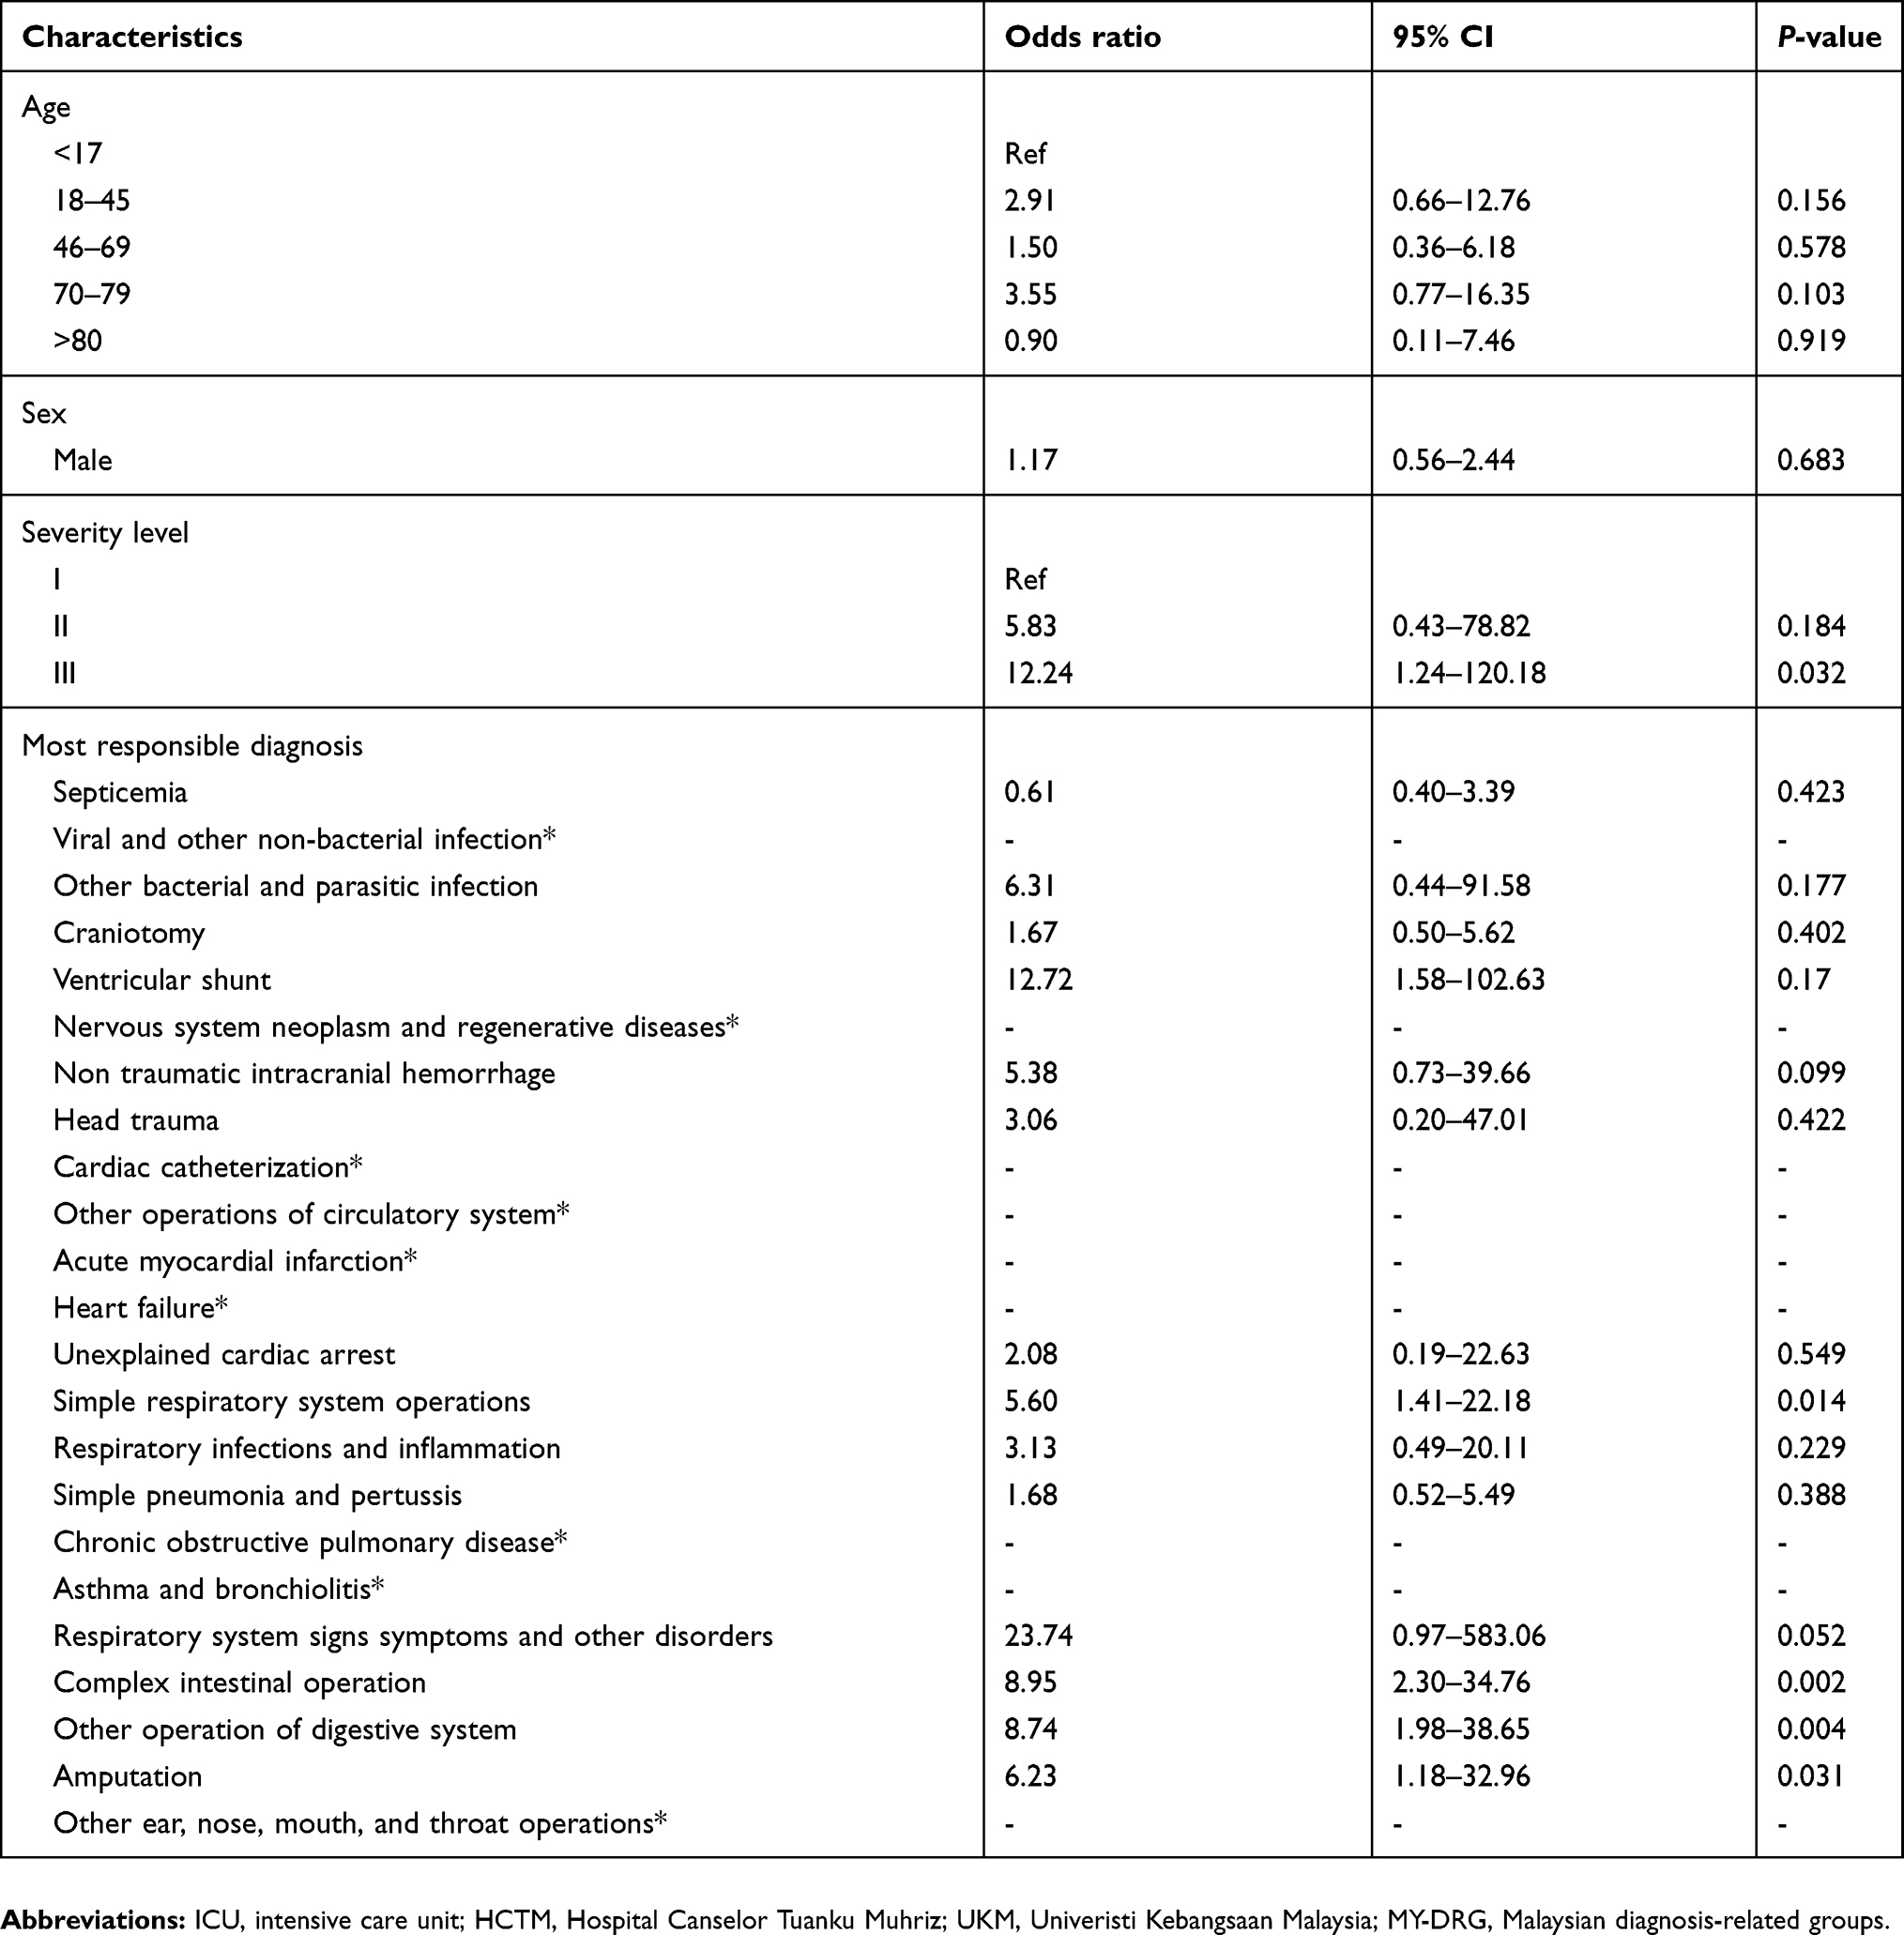 |
Table 4 Multivariate logistic regression for variables associated with high cost among death outcome patient |
Discussion
This study was conducted retrospectively using data and patients’ files from a Malaysian Teaching Hospital to explore the demographic characteristics, disease characteristics, and disease outcomes of the high-cost patients during their stay at the ICU. Based on our study, 47.2% of the total hospital cost of ICU patients was spent at the ICU. High-cost cases which constituted just 10.5% of the total ICU patients utilized 35.4% of the ICU patient-days and 38.8% of the cost spent at ICU. A study in Canada stated that 49% of the total ICU cost was spent by 10% of high-cost users.13 Similar to their finding, our high-cost patients were also using a higher share of the cost than the rest of the ICU patients. In contrast to their study, our study showed that the high-cost users were more likely to die. The overall mortality of our ICU patients was around 10%; whereas, in Canada, the mortality of ICU patients was as high as 27.7%. In addition to the possibility of more effective care at ICU services in Malaysian institutions, we still need to explore the ICU admission criteria for the suitability of patients admitted to ICU. Our ICU patients had very few patients older than 80, whereas in other earlier studies, 15.8% of their ICU patients were older than 80 years.13 In contrast, in our study, those older than 80 constituted only 3.84% of the adult ICU patients and 3.04% of all the ICU patients. This might probably be due to the differences in population structures and disease epidemiologies among countries.
Many studies focused on the cost of care for the aged population.7,19–25 Our study showed that craniotomy was the commonest diagnostic groups among ICU patients as well as being the commonest among the high-cost ICU group. Craniotomy was required mostly among those aged 18–45 years and 46–69 years with 90% of the high-cost craniotomy cases being contributed by those of the 18–69 years old group. Our study highlighted that identification of the types of diseases which contributed to the high cost at ICU especially among the younger age group would also be of value for health policy makers.
Our study noticed that diseases coded under other ear, nose, mouth, and throat operations, respiratory infections, and simple respiratory system operations had high chances of being in the high-cost group having an adjusted odds ratio of 12.78, 6.44, and 4.92, respectively (p<0.001). Since a spectrum of diseases were involved in the above diagnostic-related groups (DRGs), we still need to explore matters like which diseases in particular under these DRGs were contributing to the high-cost and high-volume cases at ICUs. Other ear, nose, mouth, and throat operations were also one of the highly admitted cases among the 46–69 and 70–79-year-old groups. Earlier studies stated that mechanical ventilation was a significant contribution to ICU cost.21 Based on this estimation, the abovementioned DRGs might probably have required mechanical ventilation.
In addition to the earlier conditions, craniotomy, non-traumatic intracranial hemorrhage, ventricular shunt, unexplained cardiac arrest, and complex intestinal operations also had adjusted odds ratio of more than 3 with p-value of less than 0.05. This signified that intervention and support were required for these conditions. Reardon et al stated that conditions like intracranial hemorrhage were influenced by the type of interventions and support required for their management.13 Not only management efficiency needed to be improved, many of the above conditions were preventable. Hence, suitable intervention strategies addressing each of these common conditions could subsequently limit the high-cost cases at ICU.
Earlier studies showed contradictory disease outcomes among high-cost groups.13,22 In line with the study by Kramer, our study also had the high-cost group having higher mortality. It is generally accepted that at older age people have higher mortality rate.26,27 In our study, the majority of patients were from the younger age group and less than 3% of the study population was older than 80 years. This had probably caused our study finding of the older aged group not being linked to higher mortality. Interestingly, the average cost of care at ICU among the older age (>80 years) high-cost group was the lowest in our study. Previous studies also revealed that cost could not be predicted with increasing age.23,24
Limitations of the study
Our study was based on the existing casemix database. Comorbidities and procedures were coded from patients’ discharge forms in the medical electronic records. Although we have counterchecked some information from patients’ records, we could not access some information such as the APACHE scores which were not regularly reported, and hence were not able to be used in our study for severity scores. We have to use proxy severity scores identified from the MY-DRG grouper software.
Patients records were paper based, and we were not able to itemize the detailed procedures of each case, and so we were not able to use activity-based costing. For this reason, we used the top-down approach, and the cost estimated was not able to be counter checked with the cost obtained from an activity-based costing.
We understand the limitations of the study that focus on a single center, but our study was conducted at one of the most advanced public hospitals in Malaysia that receive referrals for severe cases needing ICU services. In addition, this is the only hospital in Malaysia that have extensive database on cost and outcome of care for ICU cases since the hospital has been implementing casemix system/DRGs since 2002. The cost and outcome of these cases may reflect the true situation in the management of high-cost ICU patients in the country.
Conclusion
Among ICU patients, the top spending decile utilized one-third of the total ICU costs. During their hospital stay, high-cost patients spent almost 60% of the hospital cost at ICU. The high-cost patients were more likely to have death as an outcome. Neurological diseases such as head injury, intracranial hemorrhage and craniotomy, and respiratory diseases were more likely to be in the high-cost category. Regardless of being a very common ICU problem, myocardial infarction and other cardiac diseases were more likely to be in the non-high-cost group. More research needs to be done to explore effective disease prevention and cost reduction strategies for the common high-cost conditions.
Ethical approval
This study received the approval of UKM Research and Ethics Committee (approval no: JEP-2016-540). The consent from the patients to review the medical records was not a requisite of the Research and Ethical Committee as long as the patients’ identifiable information is not released.
Data availability
The data that support the findings of this study are available from HCTM but restrictions apply to the availability of these data and are not publicly available. Data are however available from the authors upon reasonable request and with permission of HCTM.
Acknowledgments
We would like to acknowledge the contribution of the UKM Research Ethics Committee and Director of HCTM for the approval to conduct the study. None of those acknowledged herein received compensation for their assistance.
Disclosure
The authors report no conflicts of interest in this work.
References
1. Oye RK, Bellamy PE. Patterns of resource consumption in medical intensive care. Chest. 1991;99(3):685–689. doi:10.1378/chest.99.3.685
2. Rais S, Nazerian A, Ardal S, Chechulin Y, Bains N, Malikov K. High-cost users of Ontario’s healthcare services. Healthc Policy. 2013;9(1):44–51.
3. Ronksley PE, McKay JA, Kobewka DM, Mulpuru S, Forster AJ. Patterns of health care use in a high-cost inpatient population in Ottawa, Ontario: a retrospective observational study. CMAJ Open. 2015;3(1):E111–E118. doi:10.9778/cmajo.20140049
4. Welton JM, Meyer AA, Mandelkehr L, Fakhry SM, Jarr S. Outcomes of and resource consumption by high-cost patients in the intensive care unit. Am J Crit Care. 2002;11(5):467–473.
5. Wodchis WP, Austin PC, Henry DA. A 3-year study of high-cost users of health care. Can Med Assoc J. 2016;188(3):182–188. doi:10.1503/cmaj.150064
6. Berk ML, Monheit AC. The concentration of health care expenditures, revisited. Health Aff (Millwood). 2001;20(2):9–18. doi:10.1377/hlthaff.20.2.9
7. Coughlin TA, Long SK. Health care spending and service use among high-cost Medicaid beneficiaries, 2002-2004. Inquiry. 2009;46(4):405–417.
8. Forget EL, Deber R, Roos LL. Medical Savings Accounts: will they reduce costs? Can Med Assoc J. 2002;167(2):143–147.
9. Joynt KE, Gawande AA, Orav EJ, Jha AK. Contribution of preventable acute care spending to total spending for high-cost Medicare patients. Jama. 2013;309(24):2572–2578.
10. Muratov S, Lee J, Holbrook A, et al. Senior high-cost healthcare users’ resource utilization and outcomes: a protocol of a retrospective matched cohort study in Canada. BMJ Open. 2017;7(12):e018488. doi:10.1136/bmjopen-2017-018488
11. Riley GF. Long-term trends in the concentration of Medicare spending. Health Aff (Millwood). 2007;26(3):808–816. doi:10.1377/hlthaff.26.3.808
12. Canadian Institue for Health Information. Care in Canadian ICUs. Ottawa, ON: CIHI;2016.
13. Reardon PM, Fernando SM, Van Katwyk S, et al. Characteristics, outcomes, and cost patterns of high-cost patients in the intensive care unit. Crit Care Res Pract. 2018;2018:7. doi:10.1155/2018/5452683
14. Halpern NA, Pastores SM. Critical care medicine in the United States 2000-2005: an analysis of bed numbers, occupancy rates, payer mix, and costs. Crit Care Med. 2010;38(1):65–71. doi:10.1097/CCM.0b013e3181b090d0
15. Aljunid SM, Hamzah SM, Mutalib SA, Nur AM, Shafie N, Sulong S. The UNU-CBGs: development and deployment of a real international open source Casemix grouper for resource challenged countries. BMC Health Serv Res. 2011;11(1):A4. doi:10.1186/1472-6963-11-S1-A4
16. Aljunid SM, Moshiri H, Amin R. The impact of introducing case mix on the efficiency of teaching hospitals in Malaysia. BMC Health Serv Res. 2010;10(2):A9. doi:10.1186/1472-6963-10-302
17. Aljunid SM, Rodrigues JM, Best L, et al. ICHI categorial structure: a WHO-FIC tool for semantic interoperability of procedures classifications. Stud Health Technol Inform. 2015;216:1090.
18. Zafirah SA, Nur AM, Puteh SEW, Aljunid SM. Potential loss of revenue due to errors in clinical coding during the implementation of the Malaysia diagnosis related group (MY-DRG((R))) Casemix system in a teaching hospital in Malaysia. BMC Health Serv Res. 2018;18(1):38. doi:10.1186/s12913-018-2843-1
19. Calver J, Brameld KJ, Preen DB, Alexia SJ, Boldy DP, McCaul KA. High-cost users of hospital beds in Western Australia: a population-based record linkage study. Med J Aust. 2006;184(8):393–397.
20. Chin-Yee N, D’Egidio G, Thavorn K, Heyland D, Kyeremanteng K. Cost analysis of the very elderly admitted to intensive care units. Crit Care. 2017;21(1):109. doi:10.1186/s13054-017-1686-1
21. Dasta JF, McLaughlin TP, Mody SH, Piech CT. Daily cost of an intensive care unit day: the contribution of mechanical ventilation. Crit Care Med. 2005;33(6):1266–1271.
22. Kramer AA, Dasta JF, Kane-Gill SL. The impact of mortality on total costs within the ICU. Crit Care Med. 2017;45(9):1457–1463. doi:10.1097/CCM.0000000000002563
23. Moran JL, Peisach AR, Solomon PJ, Martin J. Cost calculation and prediction in adult intensive care: a ground-up utilization study. Anaesth Intensive Care. 2004;32(6):787–797. doi:10.1177/0310057X0403200610
24. Noseworthy TW, Konopad E, Shustack A, Johnston R, Grace M. Cost accounting of adult intensive care: methods and human and capital inputs. Crit Care Med. 1996;24(7):1168–1172.
25. Reyes JC, Alonso JV, Fonseca J, Santos ML, Jimenez Mde L, Braniff J. Characteristics and mortality of elderly patients admitted to the Intensive Care Unit of a district hospital. Ind J Crit Care Med. 2016;20(7):391–397. doi:10.4103/0972-5229.186219
26. Fuchs L, Chronaki CE, Park S, et al. ICU admission characteristics and mortality rates among elderly and very elderly patients. Intensive Care Med. 2012;38(10):1654–1661. doi:10.1007/s00134-012-2629-6
27. Yu W, Ash AS, Levinsky NG, Moskowitz MA. Intensive care unit use and mortality in the elderly. J Gen Intern Med. 2000;15(2):97–102. doi:10.1046/j.1525-1497.2000.02349.x
 © 2019 The Author(s). This work is published and licensed by Dove Medical Press Limited. The full terms of this license are available at https://www.dovepress.com/terms.php and incorporate the Creative Commons Attribution - Non Commercial (unported, v3.0) License.
By accessing the work you hereby accept the Terms. Non-commercial uses of the work are permitted without any further permission from Dove Medical Press Limited, provided the work is properly attributed. For permission for commercial use of this work, please see paragraphs 4.2 and 5 of our Terms.
© 2019 The Author(s). This work is published and licensed by Dove Medical Press Limited. The full terms of this license are available at https://www.dovepress.com/terms.php and incorporate the Creative Commons Attribution - Non Commercial (unported, v3.0) License.
By accessing the work you hereby accept the Terms. Non-commercial uses of the work are permitted without any further permission from Dove Medical Press Limited, provided the work is properly attributed. For permission for commercial use of this work, please see paragraphs 4.2 and 5 of our Terms.