")
Back to Journals » Journal of Inflammation Research » Volume 14
Changes of Lipopolysaccharide-Induced Acute Kidney and Liver Injuries in Rats Based on Metabolomics Analysis
Authors Gao H , Yang T, Chen X, Song Y
Received 17 February 2021
Accepted for publication 7 April 2021
Published 6 May 2021 Volume 2021:14 Pages 1807—1825
DOI https://doi.org/10.2147/JIR.S306789
Checked for plagiarism Yes
Review by Single anonymous peer review
Peer reviewer comments 2
Editor who approved publication: Professor Ning Quan
Huan Gao,1 Tao Yang,2 Xuan Chen,3 Yanqing Song1
1Department of Pharmacy, The First Hospital of Jilin University, Changchun, 130021, People’s Republic of China; 2Houde Food Co., Ltd, Liaoyuan, 136200, People’s Republic of China; 3Department of Neurosurgery, The First Hospital of Jilin University, Changchun, 130021, People’s Republic of China
Correspondence: Yanqing Song
Department of Pharmacy, The First Hospital of Jilin University, Changchun, 130021, People’s Republic of China
Tel +86 431 88782482
Email [email protected]
Background: The bacterial endotoxin lipopolysaccharide (LPS) was the classic inducer to establish many inflammatory disease models, especially multiple organ injury. Evidences indicated that the mechanism that causes inflammation response is not just related to cytokine release. The main aim of this study was to better elucidate the possible links between metabolic changes and the pathogenesis of LPS-induced acute liver and kidney in order to understand the mechanisms and screening therapeutic targets for developing early diagnostic strategies and treatments.
Methods: An experimental rat model was established by intraperitoneal injection of 10 mg/kg LPS. An untargeted metabolomics analysis of the serum in the LPS and control groups was carried out using ultra-performance liquid chromatography/quadrupole time-of-flight mass spectrometry (UPLC/QTOF-MS). LPS-induced pathological damage in the lungs, liver, kidneys, and colon was observed, along with changes in biochemical indexes, indicating that there was a severe inflammatory response in many organs after administration of LPS for 8 h. Principal component analysis (PCA) and partial least squares-discriminant analysis (PLS-DA) showed distinct separation in the serum metabolite profiles between the LPS and control groups, indicating significant changes in endogenous metabolites.
Results: The untargeted metabolomics analysis showed that there were 127 significantly different serum metabolites and 53 altered pathways after LPS administration, including pathways related to the metabolism of D-glutamine and D-glutamate, taurine and hypotaurine, beta-alanine, glutathione, and butanoate, which are involved in the inflammatory response, oxidative stress, and amino acid metabolism.
Conclusion: The study suggested that LPS-induced acute liver and kidney injury mainly involves inflammatory response, oxidative stress, and protein synthesis, finally causing multi-organ damage. Correcting the disturbances to the metabolites and metabolic pathways may help to prevent and/or treat LPS-induced acute liver and kidney damage.
Keywords: untargeted metabolomics, LPS, acute kidney injury, acute liver injury, amino acid metabolism
Increasing studies have reported that the bacterial endotoxin lipopolysaccharide (LPS) could impact levels of inflammatory mediators, playing an important role in the development of systemic inflammatory response which may trigger sepsis and be linked to acute kidney and liver injury. Thus, LPS has been administered to animals to create reliable experimental models that provide mechanistic insights into how cells and organs respond to inflammation; then these models have been extensively employed to assess strategies to prevent or attenuate systemic inflammatory response or multiple organ failure.1,2 Responses in organs and tissues to endotoxemia are closely associated with alterations in metabolism and catabolic signals. Metabolites, including lipids, amino acids and glucose, have been identified during the process of inflammatory process in plasma.3,4 There is a dual directional regulation between metabolite levels and inflammatory defenses,5 and understanding the alterations in the serum metabolome during injuries is critical for making and directing more precise and personalized therapeutic intervention. Therefore, comprehensive metabolomics-based evaluation of LPS-induced acute kidney and liver injury is necessary.
Metabolomics analysis can be used to monitor disturbances in endogenous small-molecule metabolites in cells, tissues, and biofluids of the body in response to a toxicant or other environmental change, and it is a viable approach for continued discovery around the pathophysiology, diagnosis and prognosis and provides a greater level of biochemical detail and insight than other systems' biology methods.6 Ultra-high-performance liquid chromatography coupled to quadrupole time-of-flight mass spectrometry (UPLC-Q/TOF-MS) and gas chromatography-mass spectrometry (GC-MS) have been used to quantitatively analyze various metabolites in biological samples, rapidly and effectively separating and identifying the individual compounds, which are more sensitive than nuclear magnetic resonance (NMR). Furthermore, UPLC-MS is commonly used for “untargeted” metabolomics due to its broad range of different types of metabolites.7
In this study, changes in the plasma metabolites of a rat model of LPS-induced acute kidney and liver injuries were assessed using UPLC-Q/TOF-MS, along with assessing the pathological signs in the main organs and serum. This allowed the identification of altered metabolites and metabolic pathways, to better understand the pathogenesis of LPS-induced acute kidney and liver injuries and to provide new insights into the development of early diagnostic strategies and treatments.
Materials and Methods
Chemicals and Reagents
LPS from Escherichia coli 055:B5 was purchased from Sigma-Aldrich (USA). Commercial enzyme-linked immunosorbent assay (ELISA) kits to assess the levels of the cytokines tumor necrosis factor (TNF)-α and interleukin (IL)-6 and a terminal deoxynucleotidyl transferase dUTP nick end labeling (TUNEL) kit were obtained from R&D Systems (USA). Radioimmunoprecipitation assay (RIPA) lysis buffer and superoxide dismutase (SOD), catalase (CAT), and malondialdehyde (MDA) assay kits were purchased from Beyotime Co. Ltd. (China). Acetonitrile and methanol (high-performance liquid chromatography [HPLC] grade) were obtained from Thermo Fisher Scientific (USA). Ultra-pure distilled water was prepared using a Milli-Q purification system (Millipore Corp., USA). All other reagents (analytical grade) were obtained from Sigma-Aldrich (USA).
Animals
A total of 20 Sprague–Dawley rats (male, 200–220 g) were randomly divided into the LPS model group and the control group (n=10 per group). The rats were obtained from the Center of Experimental Animals of Baiqiuen Medical College of Jilin University (Jilin, China). The experiment was approved by the Jilin University Animal Care and Use Ethics Committee (protocol number 2019–239) and performed in accordance with the National Institutes of Health guide for the care and use of laboratory animals. After acclimatization for 1 week, the rats in the LPS group were intraperitoneally injected with 10 mg/kg LPS (dissolved in normal saline) which was based on earlier reports and the rats in the control group were intraperitoneally injected with an equivalent amount of normal saline.8,9 After 8 h, the rats were anesthetized using chloral hydrate, and then blood was collected by direct puncture of the abdominal aorta. The blood was then centrifuged at 3000 × g to prepare a serum sample. Organ tissues were collected and divided into two parts; one part was fixed in 4% formaldehyde, and the other was frozen in liquid N2. All serum and tissue samples were stored at −80 until biochemical analysis.
Metabolomics Analysis
Each serum sample was thawed at 4°C, and 100 µL of each sample was transferred to a tube. About 400 µL methanol was added to the tube and vortexed for 1 min. After centrifuging at 4°C for 10 min at 12,000 rpm, the supernatant was collected and transferred to another tube to concentrate it using a vacuum concentrator. Next, 150 µL 2-chlorobenzalanine in 80% methanol solution was added and a 0.22-µm membrane was used to filter the samples for LC-MS. To prepare the quality control (QC) samples, 20 µL was obtained from each tube.10,11
Chromatographic separation was performed using an UltiMate 3000 System (Thermo Fisher Scientific) equipped with an ACQUITY UPLC HSS T3 column (150×2.1 mm, 1.8 µm; Waters, USA) maintained at 40°C. The temperature of the autosampler was 8°C. Gradient elution of the analytes was carried out using 0.1% formic acid in water (C) and in acetonitrile (D) in the positive ion mode, or 5 mM ammonium formate in water (A) and acetonitrile (B) in the negative ion mode at a flow rate of 0.25 mL/min. After equilibration, 2 µL of each sample was injected. An increasing linear gradient of solvent B (negative mode) or solvent D (positive mode) (v/v) was used as follows: 0–1 min, 2% B/D; 1–9 min, 2–50% B/D; 9–12 min, 50–98% B/D; 12–13.5 min, 98% B/D; 13.5–14 min, 98–2% B/D; and 14–17 min, 2% B (negative mode) or 14–20 min, 2% D (positive mode).
Electrospray ionization (ESI)-multistage mass spectrometry (MSn) experiments were performed using a Q Exactive mass spectrometer (Thermo Fisher Scientific) with a spray voltage of 3.8 and −2.5 kV in the positive and negative ion mode, respectively. The sheath gas and auxiliary gas were set at 30 and 10 arbitrary units, respectively. The capillary temperature was 325°C. The analyzer scanned over a mass range of m/z 81–1000 for a full scan at a mass resolution of 70,000, with data-dependent acquisition of higher-energy collision dissociation (HCD) MS/MS spectra. The normalized collision energy was 30 eV. Dynamic exclusion was implemented to remove some of the unnecessary information in the MS/MS spectra.12 The metabolomics study workflow is shown in Figure 1. A random QC sample was inserted into the sequence of samples after every set of five real samples. The samples were analyzed in one batch to eliminate system errors. The compounds or metabolites were selected and confirmed according to retention time (RT), exact molecular weight (m/z), mass spectra, and peak intensity (PI). A principal component analysis (PCA) was then carried out to verify the quality of the data and the stability and repeatability of the analytical method.
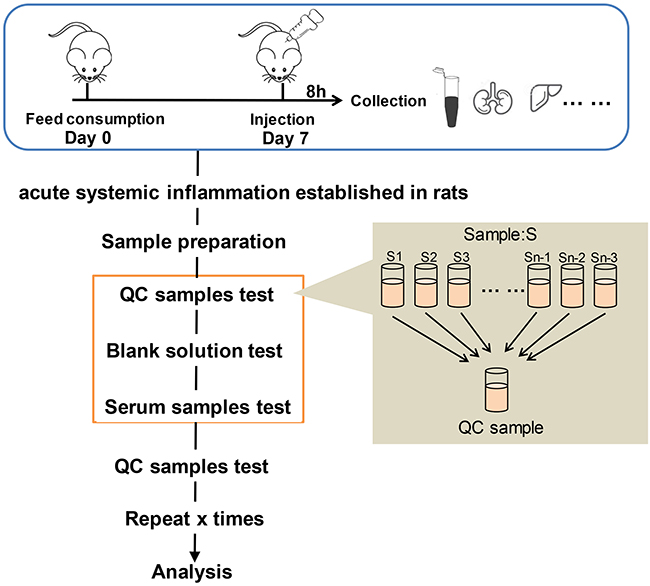 |
Figure 1 Metabolomics study workflow. |
The raw UPLC-MS/MS data were converted into mzXML format by Proteowizard software (v3.0.8789). The data were analyzed using XCMS package of R language (v3.3.2) for peaks identification, peaks filtration and peaks alignment. The major parameters were bw=2, ppm=15, peakwidth=c(5, 30), mzwid=0.015, mzdiff=0.01, method= “centWave”. Information concluding Mass to charge ratio (m/z), retention time (rt) and peak intensity were collected for further study. Batch normalization of peak area was applied.13 Then the data were used to search several qualitative metabolomics databases, comprising the mzCloud database (www.mzcloud.org), the Human Metabolome Database (www.hmdb.ca), METLIN (metlin.scripps.edu), MoNA (mona. fiehnlab.ucdavis.edu), and MassBank (www.massbank.jp).
To identify candidate biomarkers (ie, the differential serum metabolites between the LPS and control groups), the following criteria were used: Variable Importance in Projection (VIP) value ≥1 and Student’s t-test P value ≤0.05. PCA and partial least squares-discriminant analysis (PLS-DA) were conducted using R language.14 A metabolite correlation analysis was also conducted based on Pearson’s correlation coefficients, and R language was used to visualize the results in a chord diagram.
A pathway enrichment analysis of the differential metabolites was conducted, using MetaboAnalyst (www.metaboanalyst.ca) to map the metabolites to pathways in the Kyoto Encyclopedia of Genes and Genomes (KEGG) database (www.kegg.jp) in order to identify the altered metabolic pathways.15
ELISAs
The levels of the inflammatory factors tumor necrosis factor (TNF)-α and interleukin (IL)-6 in the serum were assessed using the ELISA kits (R&D Systems) according to the manufacturer’s instructions.
Determination of SOD, CAT, and MDA Levels in Serum
SOD, CAT, and MDA are biomarkers of oxidative stress, representing the degree of damage and antioxidant abilities of organs or cells. Using the assay kits (Beyotime, China), the samples were processed according to the manufacturer’s instructions. The protein in each sample was quantified. After incubation, the absorbance value was assessed using a microplate reader (EL808; Bio-TEK Instruments, USA).
Histopathological Analysis
Kidney, lung, liver, colon, hippocampus, and cerebral cortex tissues were fixed in 4% formaldehyde immediately after obtaining them from the rats. The tissues were then subjected to an alcohol gradient, embedded in paraffin, and sectioned at a thickness of 5 μm. Histopathological examination was performed after hematoxylin and eosin (H&E) staining. Images were visualized using a light microscope (Nikon Eclipse TS200; Nikon Corp., Japan) at 100×, 200×, or 400× magnification.
TUNEL Assays
The paraffin-embedded tissues were sectioned at a thickness of 5 µm in the coronal plane using a freezing microtome (CM1950; Leica, Wetzlar, Germany). TUNEL assays (Roche, Germany) were conducted according to the manufacturer’s instructions. Images were visualized using a microscope (Nikon Eclipse TS200; Nikon Corp., Japan) at 200×magnification.
Complete Blood Cell Count Analysis
Whole blood was collected at the time of euthanasia via direct puncture of the abdominal aorta and stored in tubes pre-filled with ethylenediaminetetraacetic acid (EDTA). The analysis was performed using an ABC Vet Animal Blood Counter (Scil Animal Care Company, Gurnee, IL, USA) according to the manufacturer’s instructions. The red blood cell (RBC), white blood cell (WBC), monocyte, neutrophil, and lymphocyte counts were assessed.16
Statistical Analysis
The experiments were designed following the standard approach to ensure adequate sample sizes for reliable statistical analysis.17,18 The data are presented as mean ± standard error of the mean (SEM). The data were analyzed using GraphPad Prism 5 (GraphPad Software). Statistical significance was analyzed by means of two-tailed Student’s t-test or analysis of variance (ANOVA). A p-value <0.05 was considered statistically significant.
Results
Effects of LPS on Blood Counts
The RBC, WBC, monocyte, neutrophil, and lymphocyte counts were measured in whole blood from rats. The WBC count was significantly decreased in the LPS group compared to the control group (Figure 2A). Differential WBC analysis (Figure 2B–E) revealed that LPS notably increased the percentages of circulating monocytes, neutrophils, and lymphocytes, which may lead to acute systemic inflammation. LPS had no effect on the RBC count.
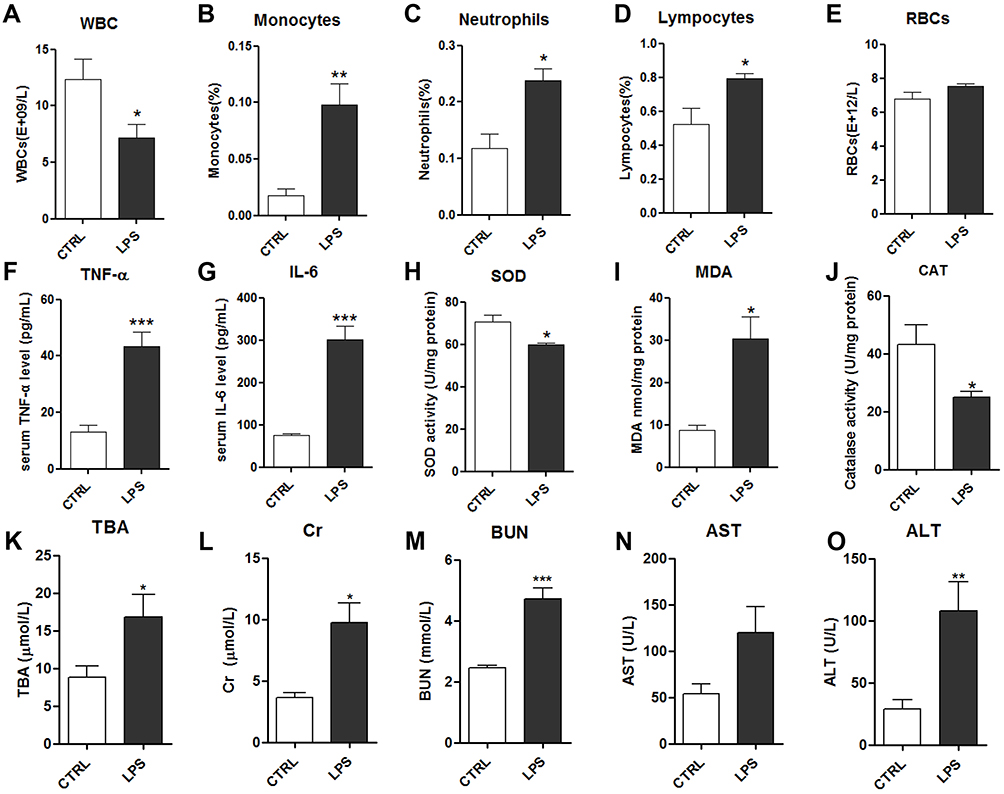 |
Figure 2 Effects of LPS on serum biochemical indicators: white blood cells (WBCs) (A), monocytes (B), neutrophils (C), lymphocytes (D) and red blood cells (RBCs) (E); serum levels of TNF-α (F) and IL-6 (G); serum levels of the oxidative stress factors superoxide dismutase (SOD) (H), malondialdehyde (MDA) (I), and catalase (CAT) (J); and kidney and liver function indicators: total bile acids (TBA) (K), creatine (Cr) (L), blood urea nitrogen (BUN) (M), aspartate transaminase (AST) (N) and alanine transaminase (ALT) (O). Notes: Data are expressed as mean ± SEM (n=10 per group). *p<0.05, **p<0.01, ***p<0.001 vs control group. |
Effects of LPS on Cytokine, SOD, CAT, and MDA Levels in Serum
The inflammatory cytokines TNF-α and IL-6 were measured in the serum using ELISAs. TNF-α and IL-6 were significantly increased in the LPS group compared to the control group (Figure 2F–G). As oxidative stress is highly associated with inflammatory injury, biochemical methods were used to assess multiple factors, comprising the MDA level and the activities of the antioxidant enzymes SOD and CAT. The antioxidant enzymes SOD and CAT were significantly decreased in the LPS group compared to the control group, while MDA was significantly increased in the LPS group (Figure 2H–J). These results suggested that 10 mg/kg LPS could induce inflammation and oxidative stress in rats after 8 h, which may disrupt the function of tissues and organs.
Effects of LPS on the Kidney and Liver Function
To evaluate the effects of LPS on liver function, alanine transaminase (ALT) activity, aspartate transaminase (AST) activity, and total bile acid (TBA) levels in the serum were assessed. They were markedly increased in the LPS group compared to the control group, indicating that 10 mg/kg LPS caused considerable liver injury in the rats at 8 h (Figure 2K–O). Additionally, to evaluate the effects of LPS on kidney function, the mean serum blood urea nitrogen (BUN) and creatinine (Cr) levels were assessed, and they all increased after intraperitoneal injection of 10 mg/kg LPS (Figure 2L and M). Together, these data showed that intraperitoneal injection of LPS induced severe systemic inflammation and caused kidney and liver damage.
Histopathological Evaluation in Multiple Tissues
H&E staining of liver sections revealed vacuolar degeneration, massive necrosis of hepatocytes, and severe inflammatory cell infiltration in the LPS group (Figure 3A–F). Additionally, there were more TUNEL-positive cells in the LPS group than in the control group (Figure 3G–L).
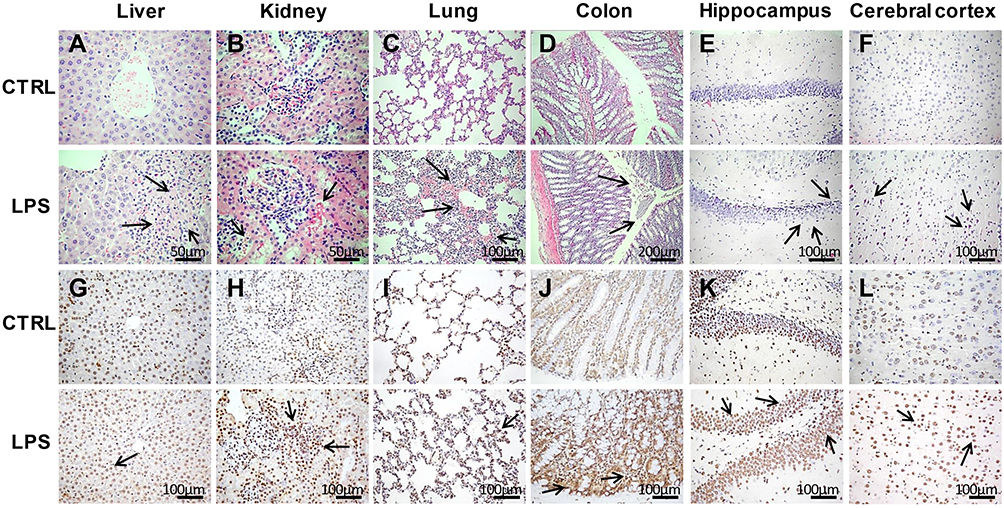 |
Figure 3 Histopathological analyses of tissues in the LPS and control groups. (A–F) Hematoxylin and eosin (H&E) staining of liver (400×), kidney (400×), lung (200×), colon (100×), hippocampus (200×), and cerebral cortex (200×) tissues in the LPS and control groups. (G–L) Terminal deoxynucleotidyl transferase dUTP nick end labeling (TUNEL) assays of liver, kidney, lung, colon, hippocampus, and cerebral cortex tissues (200×) in the LPS and control groups. The arrows point to the damage area. |
Regarding the kidney tissues, the epithelial cells of renal tubules showed vacuolar degeneration, damaged brush borders, and the presence of protein casts in the LPS group, unlike in the control group (Figure 3B). In addition, necrosis of tubular epithelial cells was observed in the LPS group. The results of TUNEL staining indicated apoptosis (Figure 3H), which suggests that renal pathological damage had already occurred at 8 h after LPS administration.
The lung tissues stained with H&E showed that the LPS-induced lung injury mainly involved a degree of inflammatory cell infiltration, destruction of alveoli, and thickened alveolar septa (Figure 3C). The damaged alveoli and apoptotic cells were clearer based on the TUNEL assays (Figure 3I).
Regarding the colon tissues, LPS administration led to inflammatory cell infiltration, partial mucosal epithelial damage, and missing goblet cells (Figure 3D). In contrast, the control rats had intact colon mucosal epithelia, along with normal colonic epithelial and goblet cells. There were also more TUNEL-positive cells in the LPS group than in the control group (Figure 3J), demonstrating that LPS caused severe injury in the colon.
Regarding H&E staining of the hippocampus tissues, the LPS rats had thinner cell layers and neuronal degeneration. In contrast, the control rats had normal morphology, with clear cell layers, nuclei, and nucleoli (Figure 3E). Regarding the cerebral cortex, LPS caused eosinophilic necrosis (Figure 3F). There were many TUNEL-positive apoptotic cells in the hippocampus and cerebral cortex tissues from LPS rats (Figure 3K and L).
Thus, LPS induced acute systemic inflammation, disrupting the normal function of multiple organs and damaging the liver, kidneys, colon, lungs, hippocampus, and cerebral cortex. Accordingly, the disease model was successfully established by 10 mg/kg LPS at 8 h after administration, and further analyses were carried out.
Validation of Metabolomics Data
The total ion chromatograms (TICs) in the positive and negative ion modes allowed differences to be observed visually (Figure 4A–D). By testing the QC samples along with the real samples, method repeatability and instrument precision were confirmed (relative standard deviation [RSD] <15%). In addition, the PCA score plots of the metabolic profiles of the QC samples indicated that the detection system was stable (in the Supplementary Material).
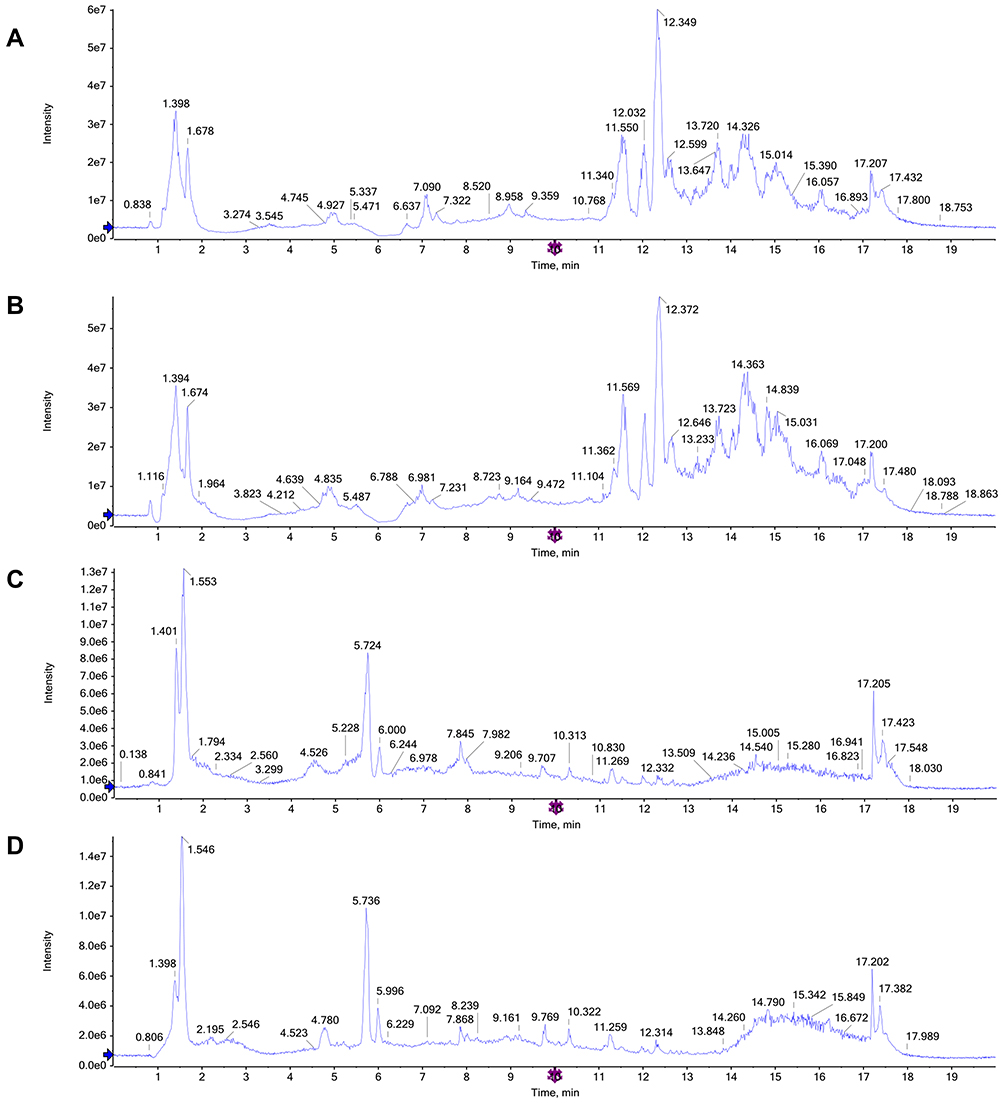 |
Figure 4 Representative total ion chromatograms (TICs) of serum samples subjected to (UPLC/QTOF-MS) in positive and negative ion modes. (A and B) TICs of CTRL group and LPS group in the positive ion modes; (C and D) TICs of CTRL group and LPS group in the negative ion modes. |
Multivariate Analysis of Metabolic Profiles
The PLS-DA score plots for the LPS and control groups indicated notable separation regarding both the negative and positive ion modes (Figure 5A–D). The PLS-DA model had a low risk of overfitting (R2=0.92, Q2=0.15 in the positive ion mode, and R2=0.92, Q2=0.1 in the negative ion mode), good fitness (R2Y=0.991 in the positive ion mode, and R2Y=0.991 in the negative ion mode), and good prediction (Q2=0.904 in the positive ion mode, and Q2=0.897 in the negative ion mode). These results indicate that the LPS-induced acute systemic inflammation model was successfully established.
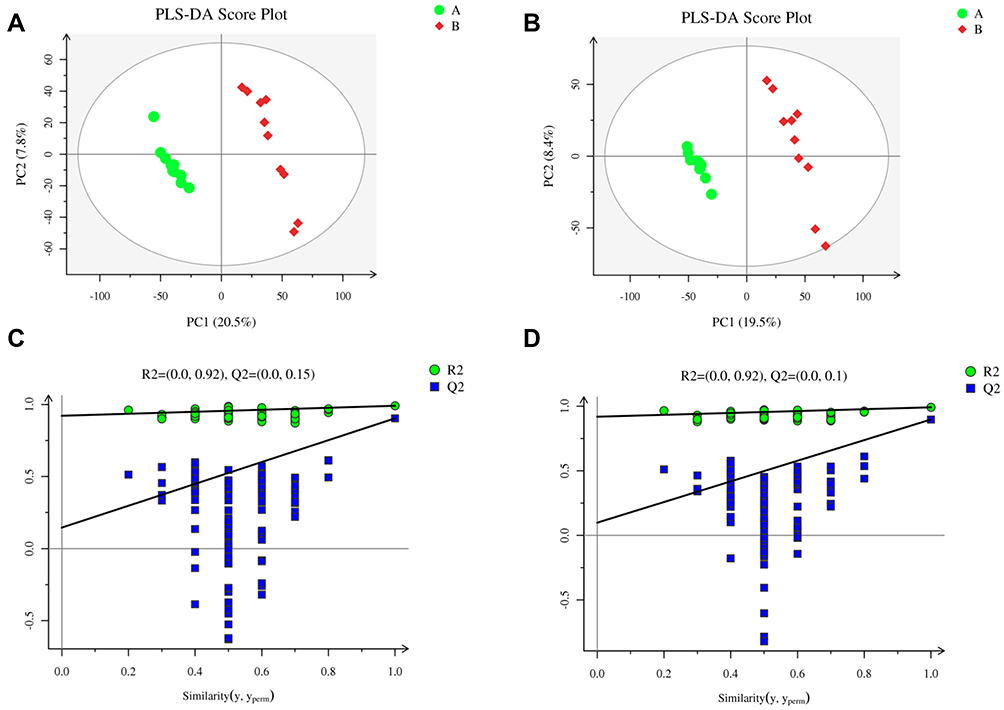 |
Figure 5 Metabolomics analysis of serum samples from rats in the LPS and control groups (n=10 per group) in the positive and negative ion modes. Partial least squares-discriminant analysis (PLS-DA) score plot in the (A) positive and (B) negative ion modes. Permutation test of PLS-DA model in the (C) positive and (D) negative ion modes. |
Endogenous metabolites were picked if they met criteria related to multiple data processing methods (VIP ≥1 and P ≤0.05). Using R language and multiple metabolomics databases, the serum levels of 127 metabolites were significantly different between the LPS and control groups (Table 1). The 127 metabolites were divided into two groups; the levels of 59 metabolites decreased and the levels of 68 metabolites increased in the LPS group. The results of the correlation analysis were visualized using a chord diagram (Figure 6) and compounds belonging to the classes of amino acid, lipid, and carbohydrate were the most enriched in the changed endogenous metabolites. Red indicates increased abundance and blue indicates decreased abundance.
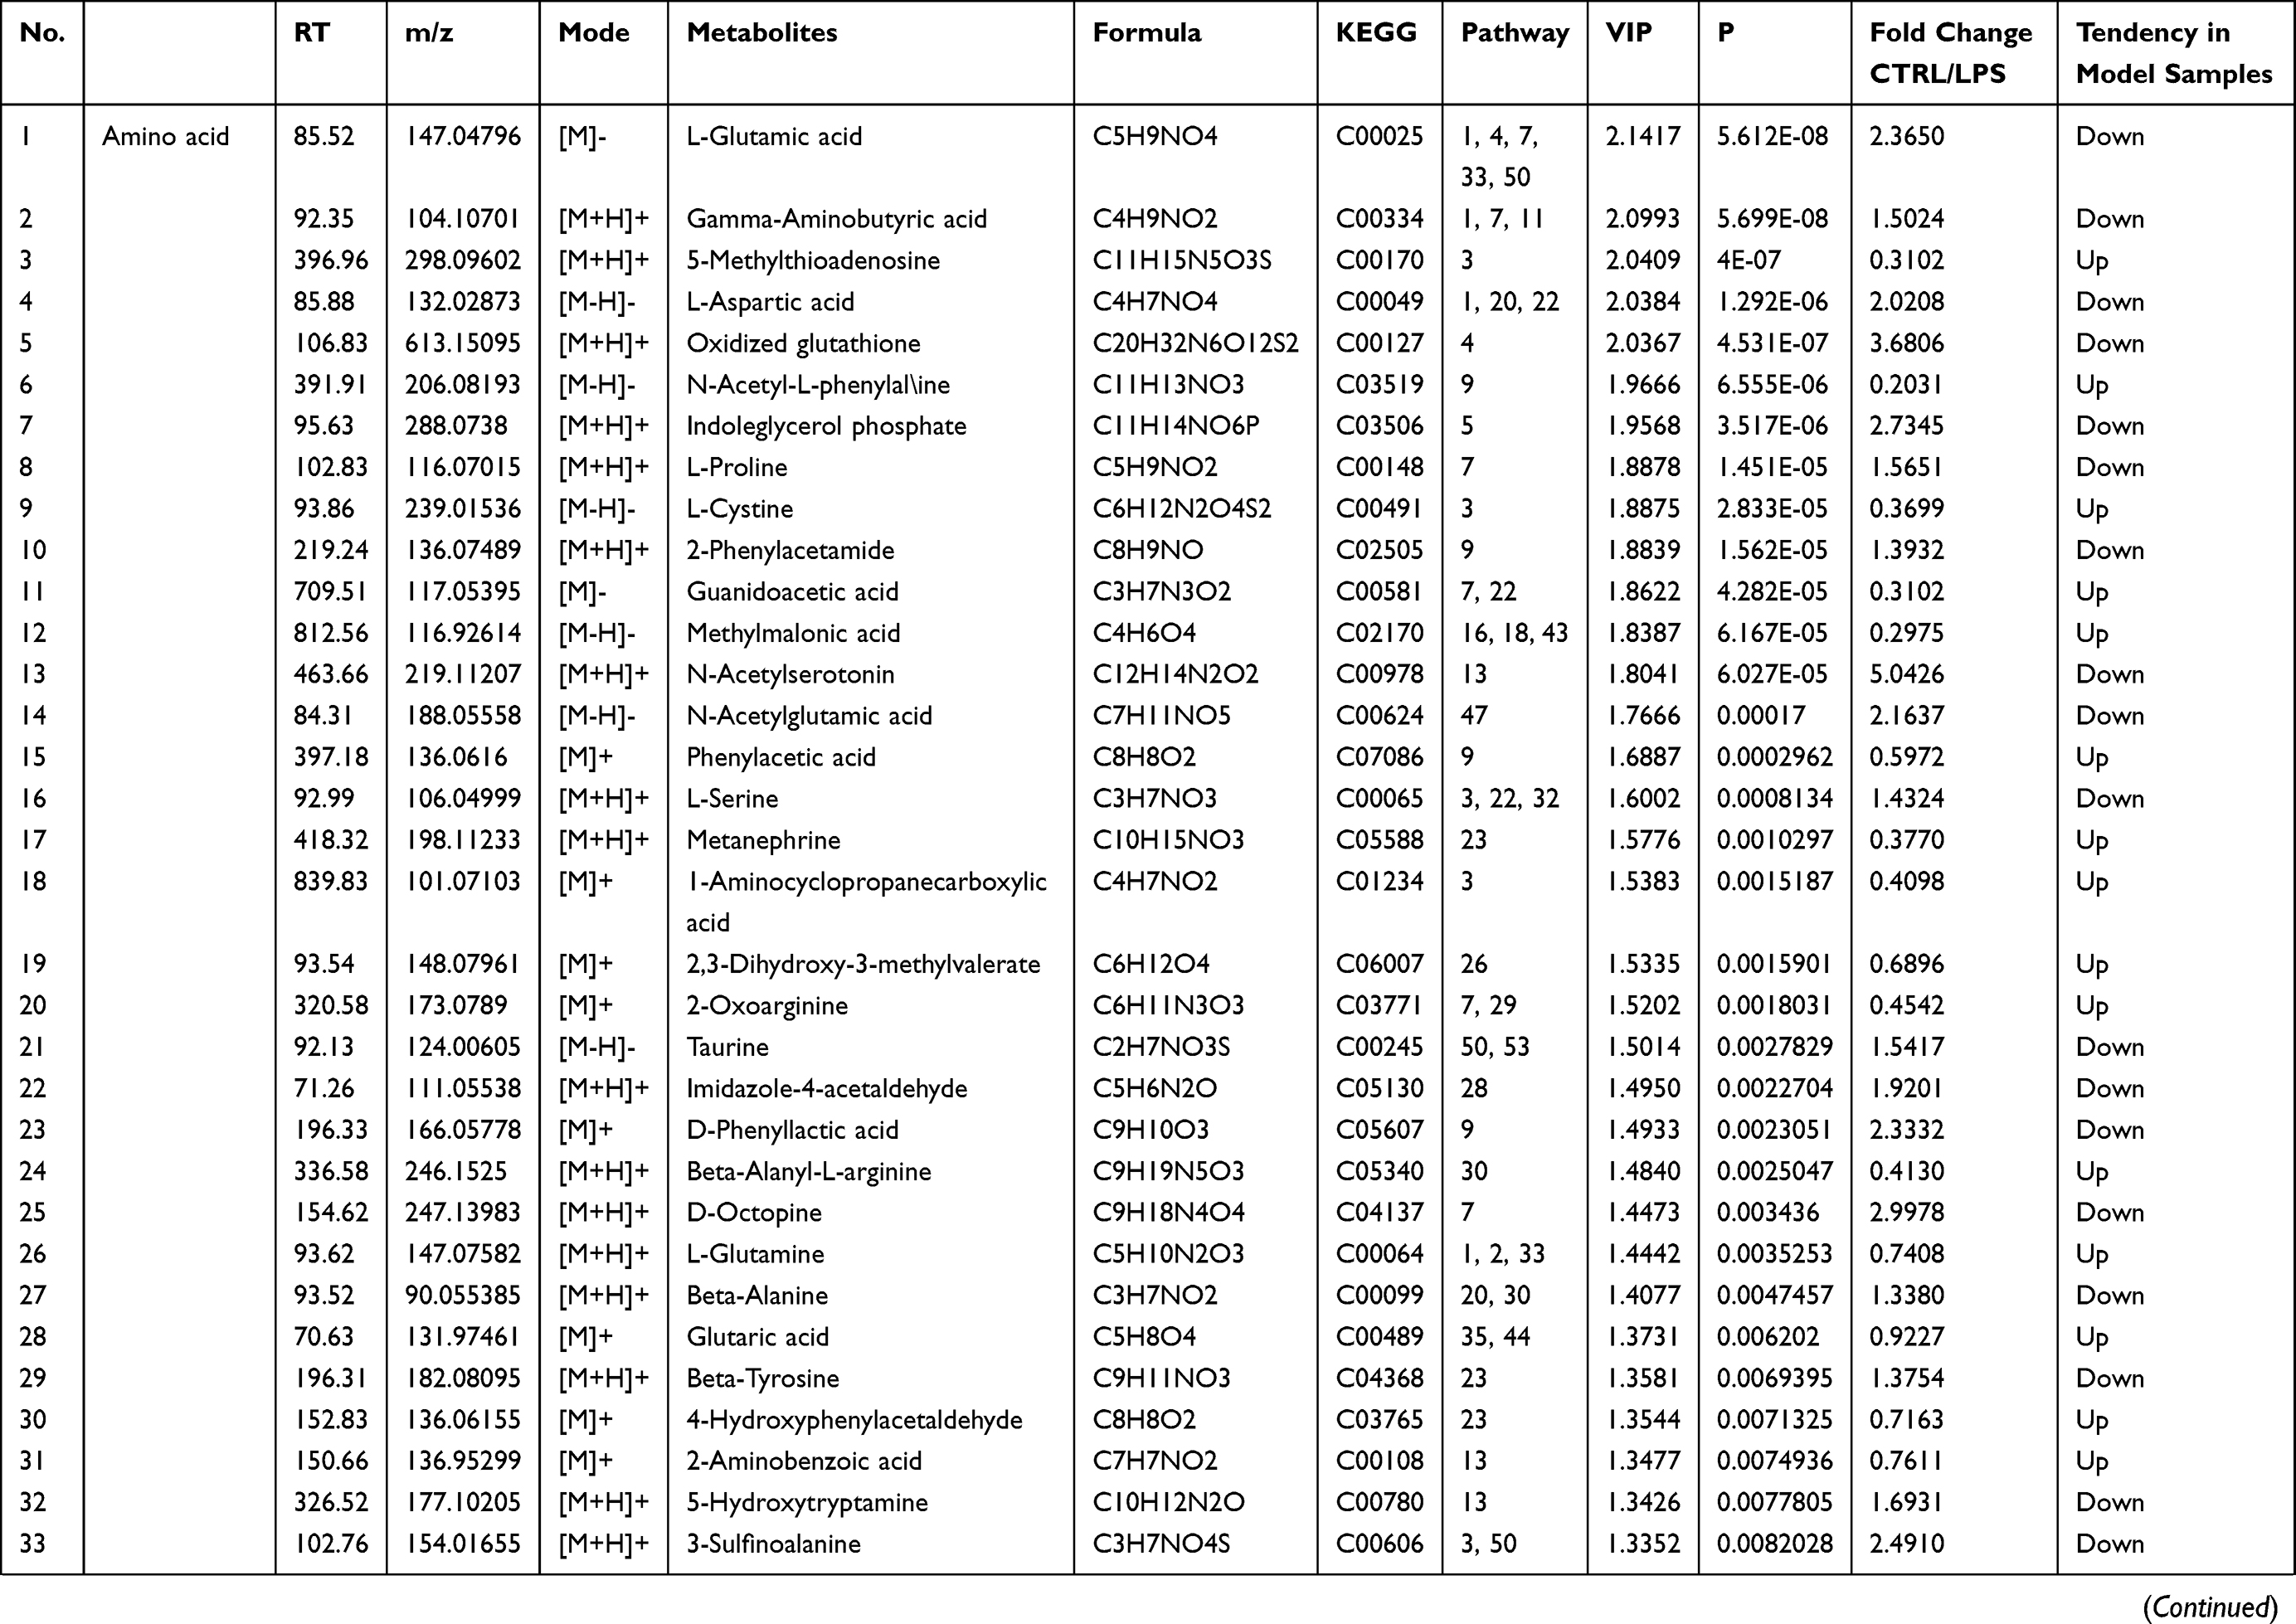 | 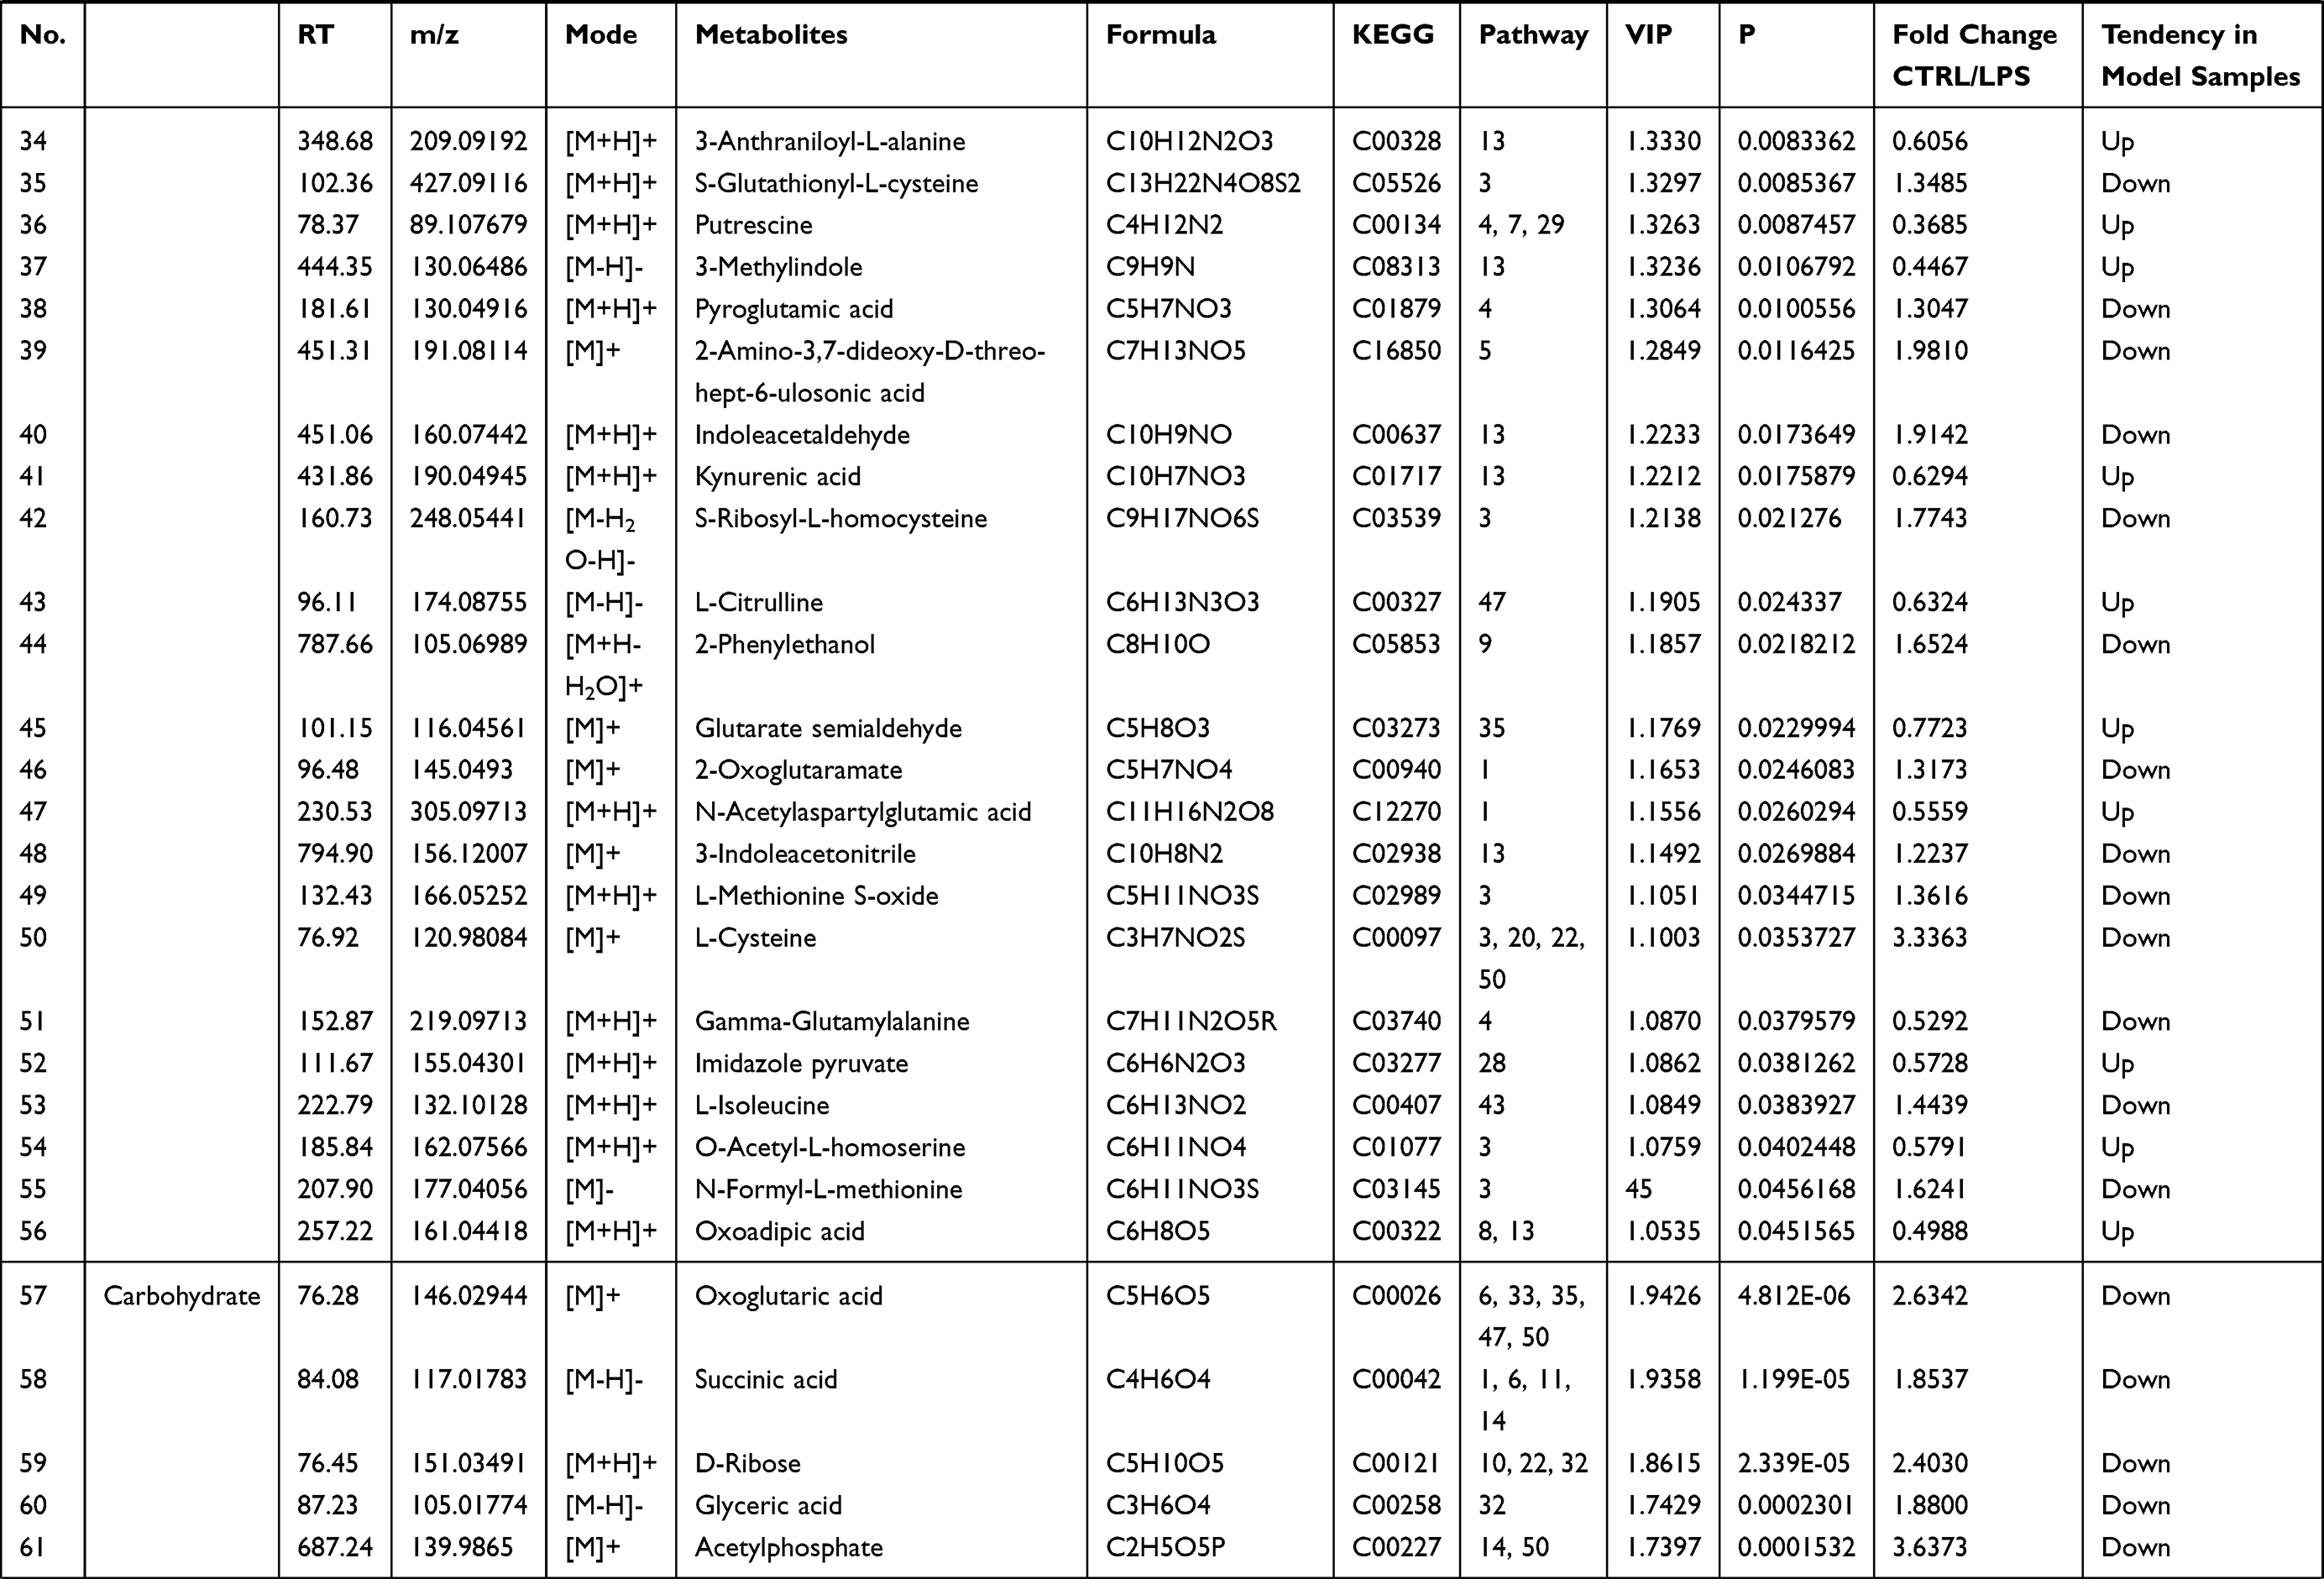 | 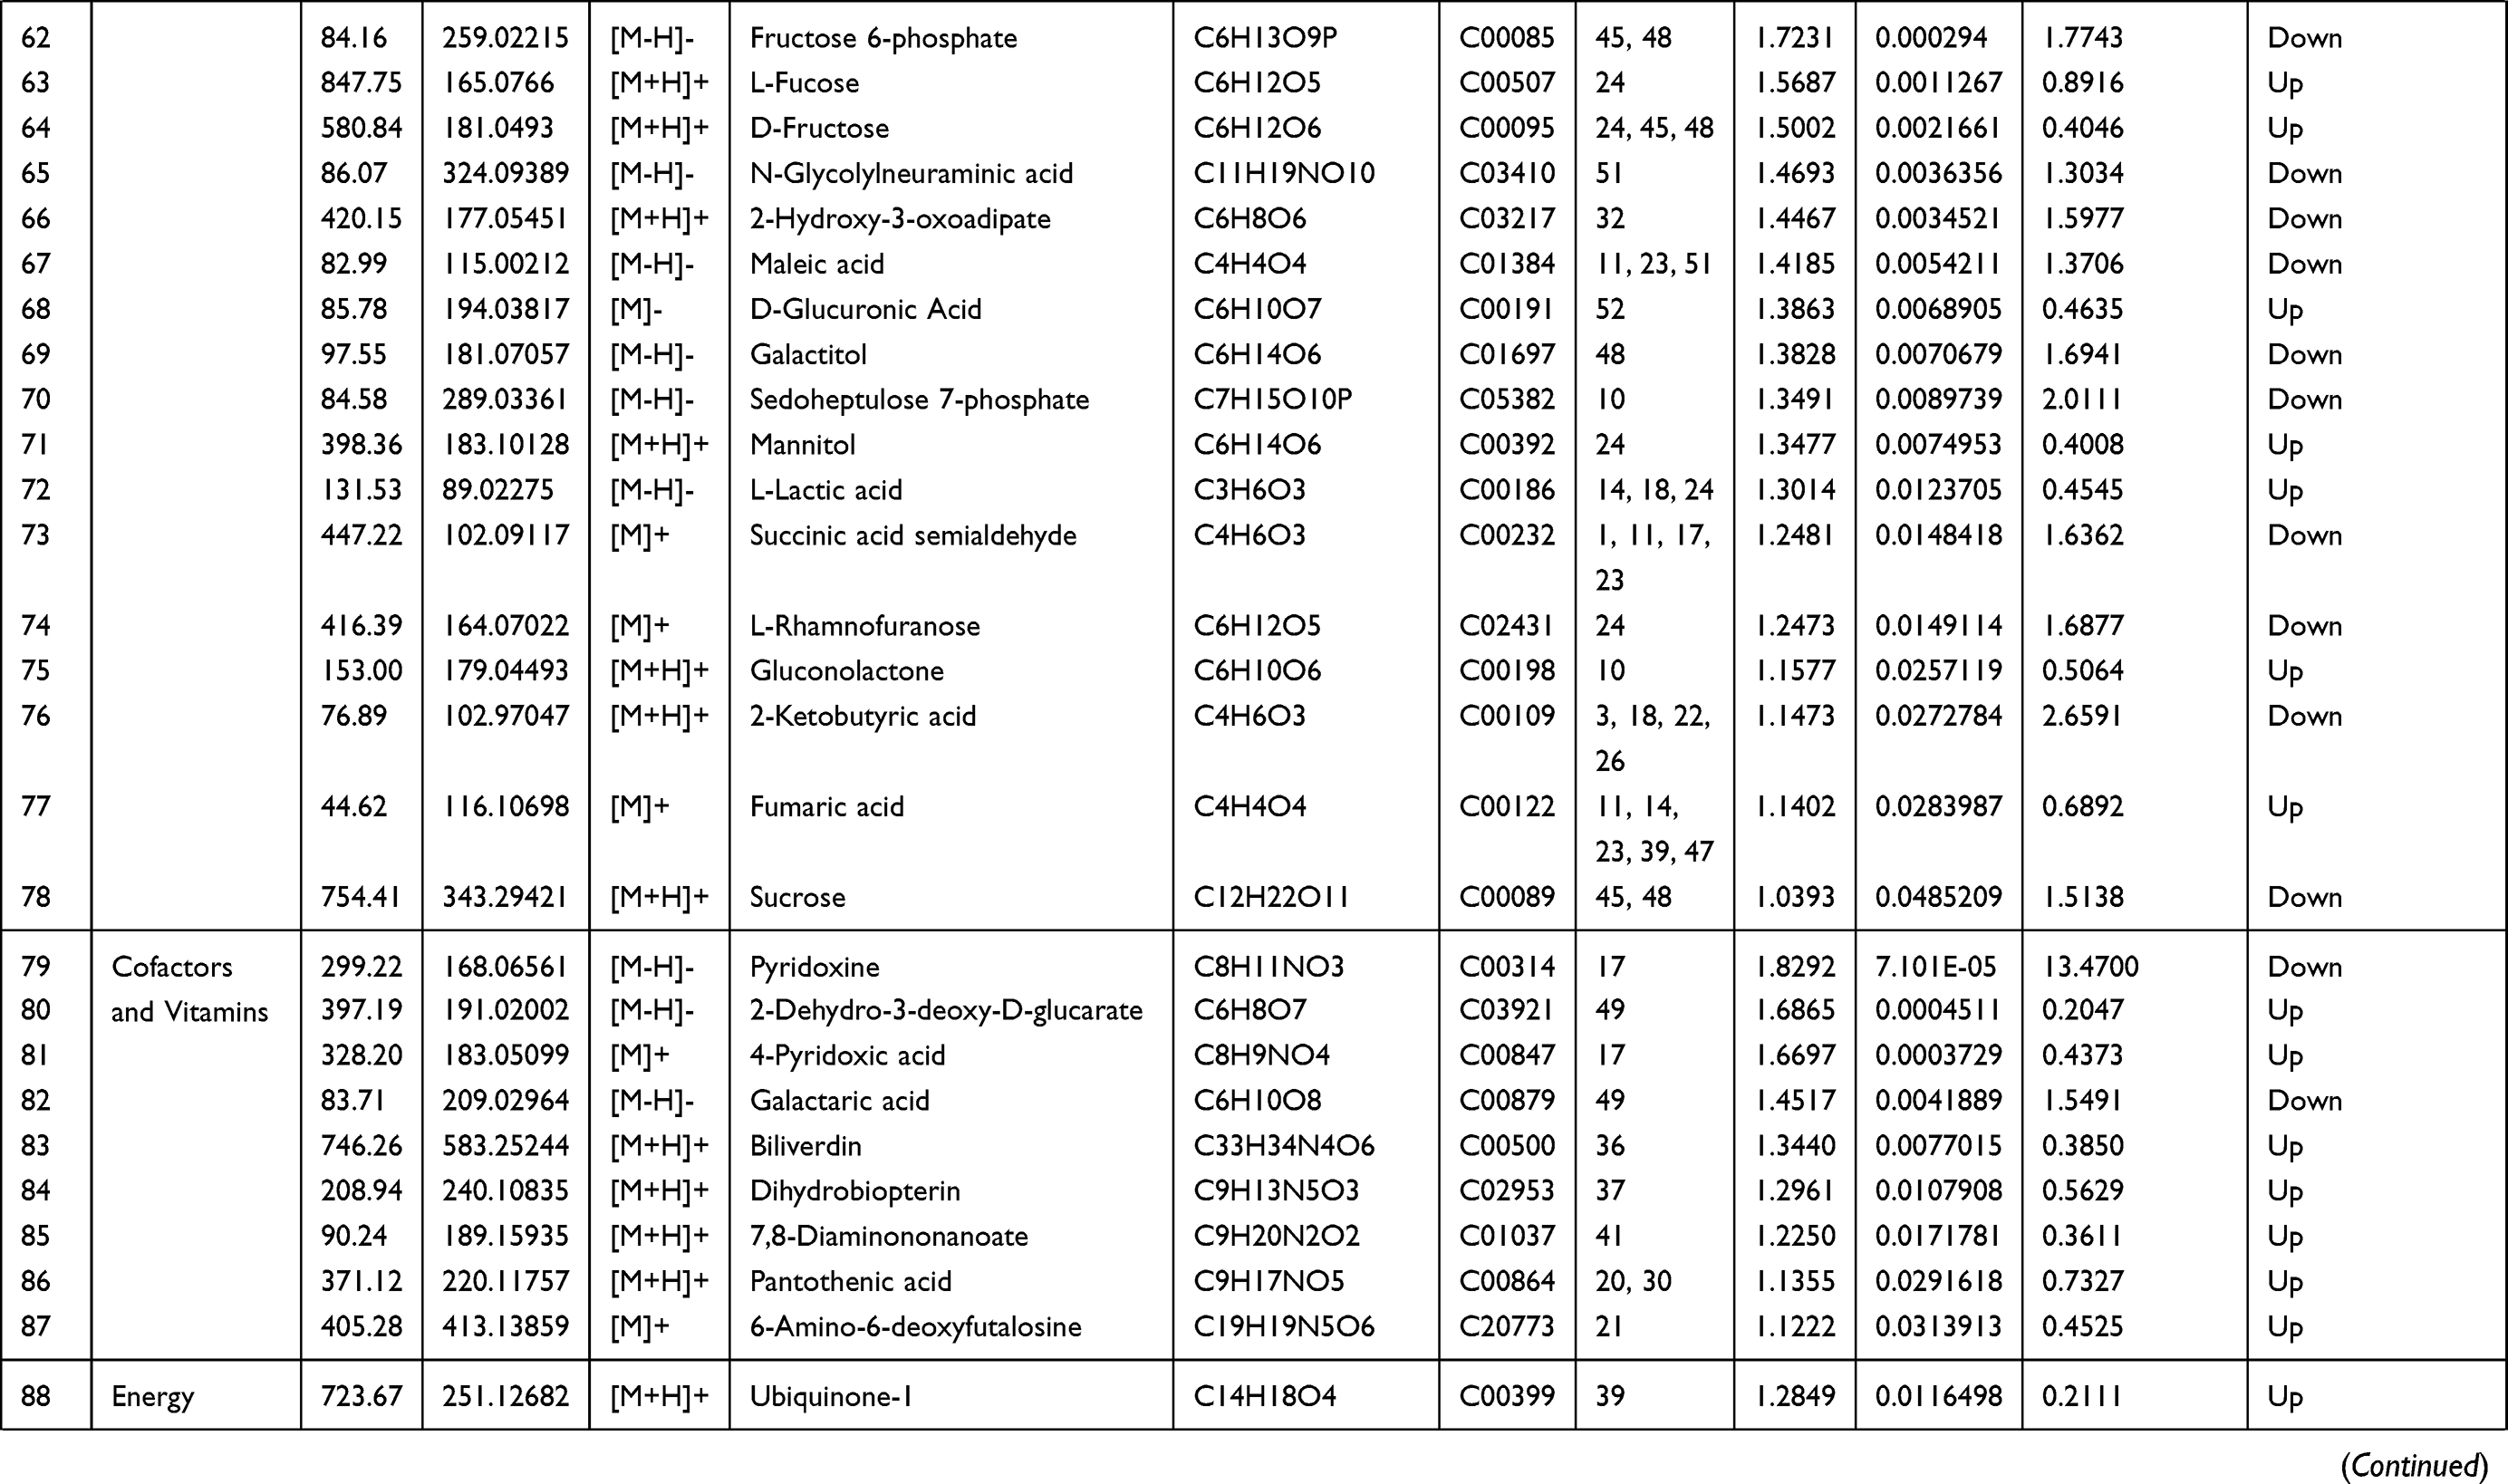 | 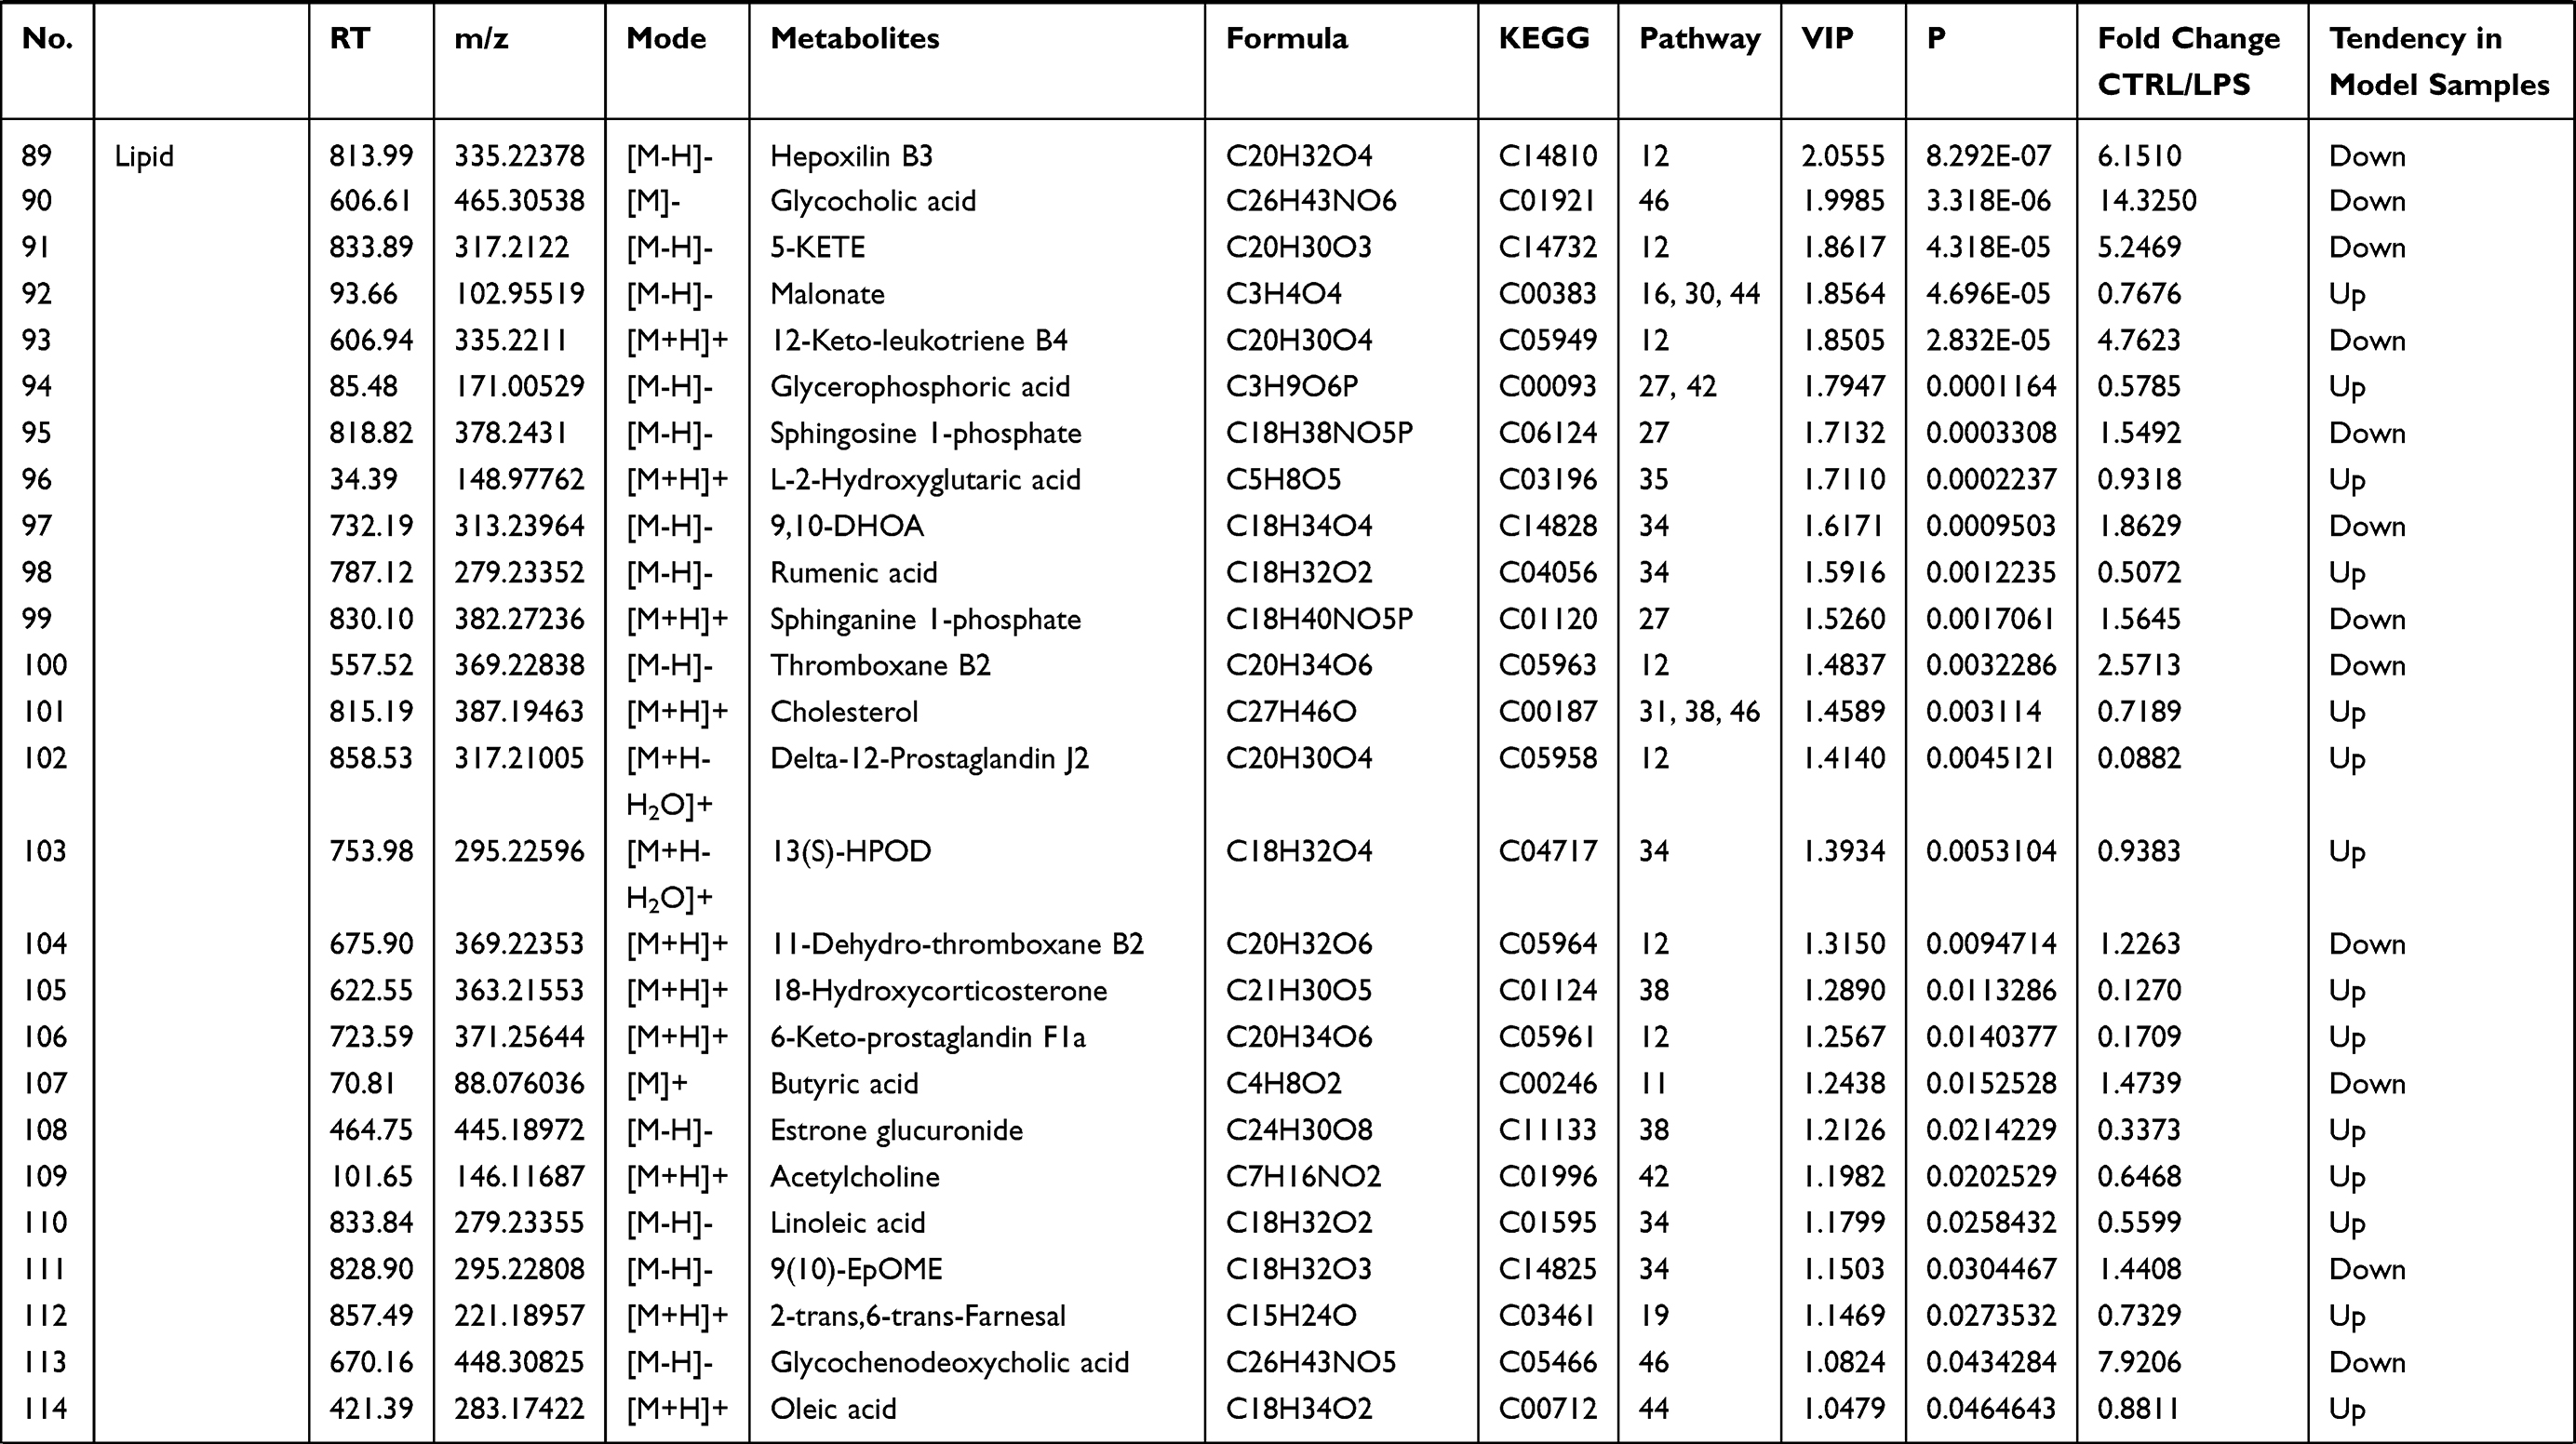 |
Table 1 Identification of Serum Endogenous Metabolites During LPS-Induced Acute Systemic Inflammation |
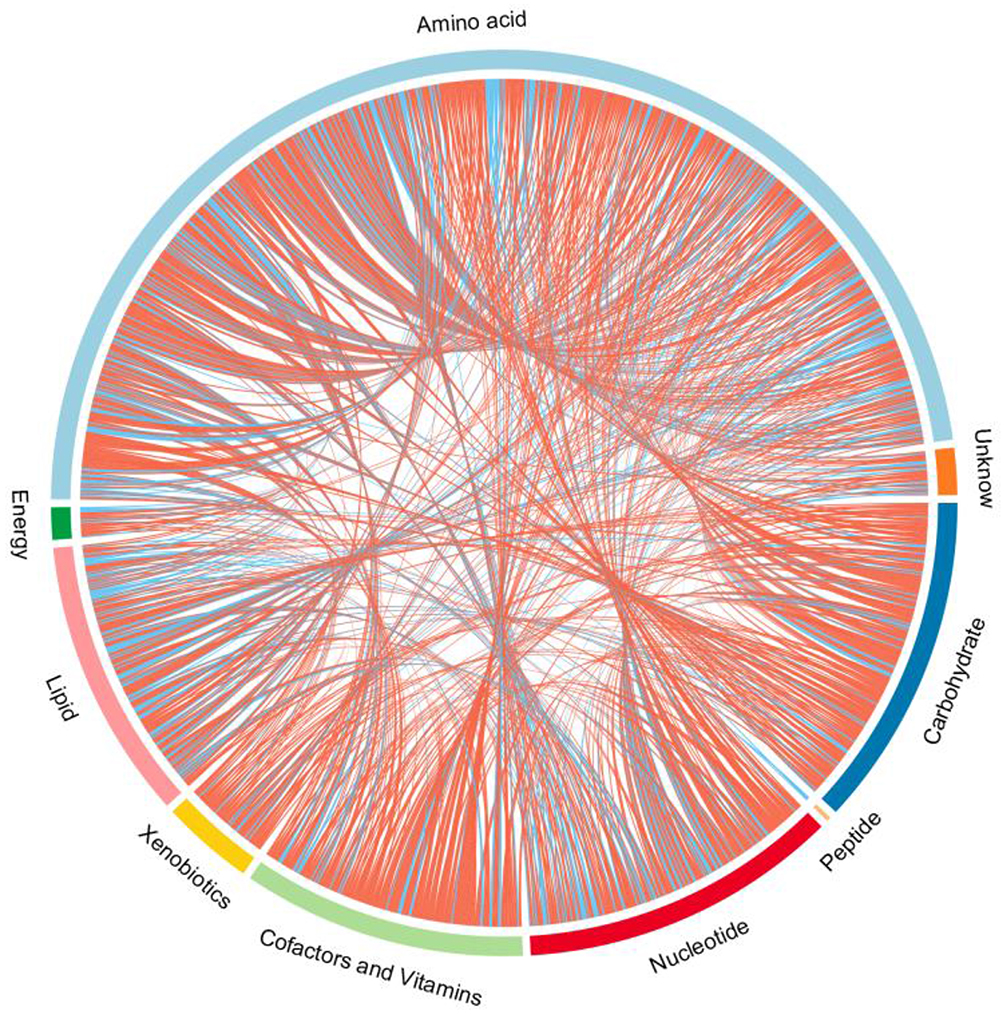 |
Figure 6 Chord diagram of differential serum metabolites. Classification of the metabolites detected into major functional classes. |
Analysis of the Differential Metabolites and Pathways
Pathway enrichment and pathway topology analyses were performed to identify the pathways that were most relevant to the differential metabolites that had been identified as candidate biomarkers, as well as the network of the matched pathways. Totally, 53 pathways were relevant to the candidate biomarkers. Several of these may play critical roles in the occurrence and development of acute systemic inflammation, including the pathways related to the metabolism of D-glutamine and D-glutamate, linoleic acid, taurine and hypotaurine, beta-alanine, glutathione, and butanoate. A graph of the 10 most relevant pathways was constructed, with the log(P) values from the pathway enrichment analysis on the y-axis and the pathway impact values from the pathway topology analysis on the x-axis (Figure 7A). As shown in Figure 7B, the interactions among the pathways mainly relate to amino acid and carbohydrate metabolism. Regarding the points, the size represents the pathway impact value and the color represents the degree of pathway correlation (based on the number of connected nodes).
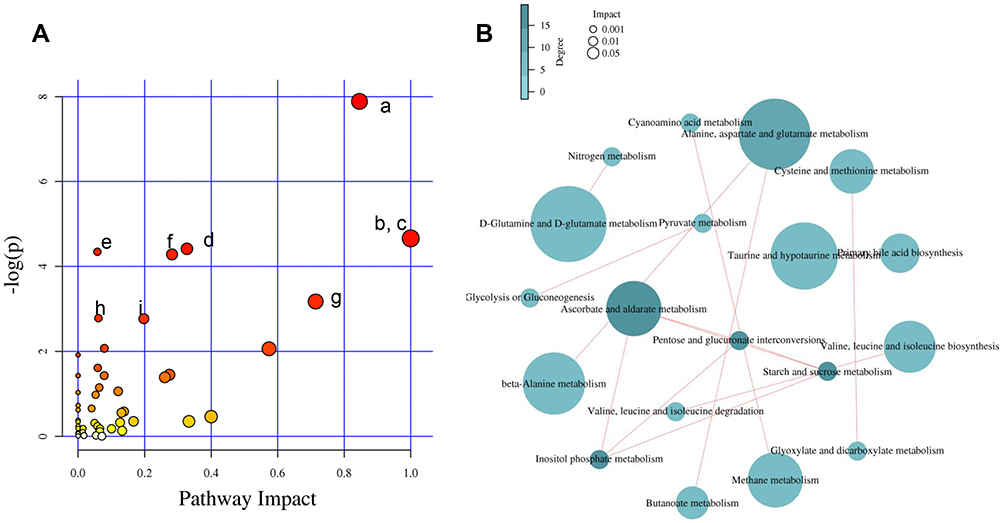 |
Figure 7 Pathway analysis. (A) Summary of pathway analysis. (a) Alanine, aspartate, and glutamate metabolism; (b) D-glutamine and D-glutamate metabolism; (c) linoleic acid metabolism; (d) arginine and proline metabolism; (e) butanoate metabolism; (f) glutathione metabolism; (g) taurine and hypotaurine metabolism; (h) pantothenate and coenzyme A (CoA) biosynthesis and (i) cysteine and methionine metabolism. Log (P) values from the pathway enrichment analysis are shown on the y-axis, and pathway impact values from the pathway topology analysis are shown on the x-axis. (B) Network diagram of metabolic pathway. The size represents the pathway impact value and the color represents the degree of pathway correlation (based on the number of connected nodes). |
The results of the correlation analysis indicated the possible interactions between the metabolic pathways affected by LPS (Figure 8). The possible interactions between the candidate biomarkers and pathways were determined based on metabolites with altered abundance between the LPS and control groups and an analysis using the KEGG database.
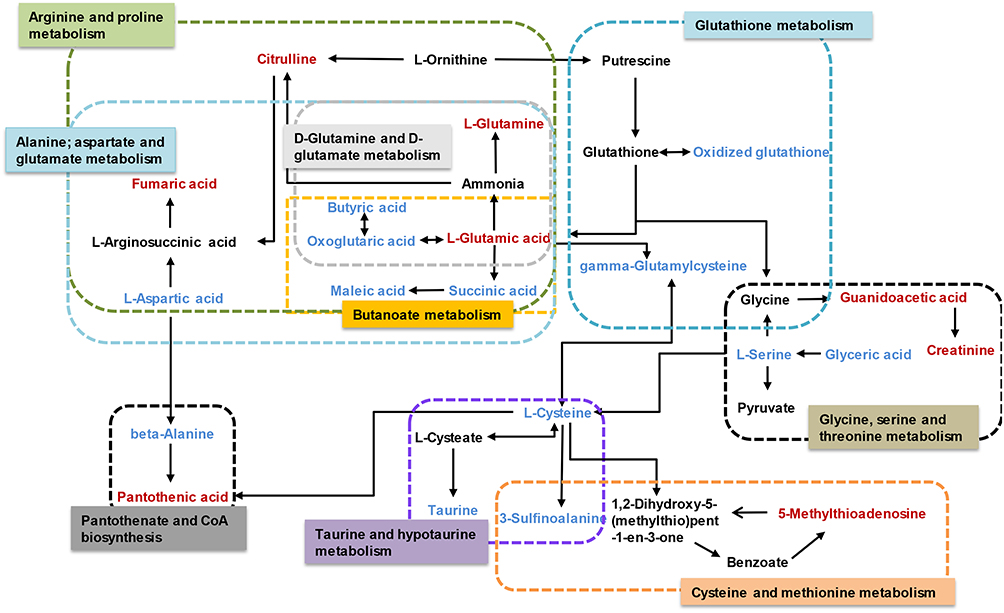 |
Figure 8 Schematic diagram of the disturbed metabolic pathways affected by LPS. Red indicates increased abundance and blue indicates decreased abundance in the LPS group compared to the control group. |
Discussion
LPS, an integral component of the Gram-negative bacterial outer membrane, can cause an uncontrollable inflammatory response, which can lead to damage to liver, kidney, lung and, eventually, fatal sepsis syndrome.19 Thus, LPS was the classic inducer to establish multiple inflammatory disease models. However, more evidences indicated that the mechanism that causes inflammation response is not just related to cytokine release. It is necessary to comprehensively understand LPS-induced liver and kidney injury based on metabolomics.
As compared to NMR, GC-MS and LC-MS are more sensitive and automated, which are better suited for the measurement of low-abundant metabolites and a variety of classes of compounds. Furthermore, GC-MS is more suitable for the analysis of volatile or thermally stable substance, including organic acids, amino acids, sugars and fatty acids, etc.20 However, LC-MS is widely used for “untargeted” metabolomics because it effectively detects a broad range of different types, especially for unstable or non-volatility metabolites.7 Related researches have reported the metabolomics changes in rats with LPS-induced systemic inflammatory response by GC-MS in lower doses which has shown that about 24 metabolites were differentially in the serum and mainly related to aminoacyl-tRNA biosynthesis, glutathione metabolism and arginine biosynthesis.18 In this study, more metabolomics and regulatory pathways were detected and analyzed by LC-MS to comprehensively explain the pathogenesis of LPS-induced kidney and liver damage. In addition, different treatment concentration or period of LPS lead to multiple disease symptoms, and this might be related to different metabolic response. Thus, this study focused on the mechanism and changes of acute kidney and liver injury induced by LPS in high-dose (10 mg/kg).
In this study, the systemic inflammatory tissue damage, biochemical indexes, and altered metabolic pathways were examined by histopathological evaluation, molecular biological methods, and LC-MS, respectively. Histopathological damage to the organs including the kidneys, liver, colon, and lungs occurred within 8 h after LPS was injected intraperitoneally. There were also significant changes in blood counts (WBC, monocyte, neutrophil, and lymphocyte counts), inflammatory factors (TNF-α and IL-6), oxidative stress indexes (SOD, MDA, and CAT activity), renal function indexes (serum +Cr and BUN), and liver function indexes (ALT, AST, and TBA). In the metabolomics analysis, 127 metabolites with altered abundance were identified; based on this, 53 pathways were identified as relevant to the pathological process, mainly involving the metabolism of D-glutamine and D-glutamate, linoleic acid, taurine and hypotaurine, beta-alanine, glutathione, and butanoate. The altered pathways are involved in multiple physiological processes, including the inflammatory response, oxidative stress, energy metabolism, and amino acid metabolism.
Inflammatory Response
Regarding lipids, there were significant alterations in the levels of oleic acid, linoleic acid, and arachidonic acid-related metabolites. Linoleic acid is a precursor of arachidonic acid, which can be converted into various lipid mediators involved in the regulation of immunity.21 Linoleic acid metabolism, arachidonic acid metabolism, and prostaglandin-related metabolites (delta-12-prostaglandin J2 and 6-keto-prostaglandin F1a) were significantly altered in the LPS group, which is consistent with previous research.22 Oleic acid has been demonstrated to promote wound healing, combat autoimmune conditions, and eliminate pathogens by affecting macrophages, lymphocytes, and neutrophils.23 The increase in oleic acid suggested that it might represent a self-protection mechanism in the acute inflammatory stage after LPS treatment for 8 h.
Glycocholic acid, a bile acid related to liver function, effectively inhibits both acute and chronic inflammation.24 There was a marked reduction in glycocholic acid, which is consistent with the occurrence of liver injury.
D-Glutamine and D-glutamate metabolism are associated with cell growth, lipid peroxidation, antioxidant defense, and anti-inflammation.25,26 Glutamine is a principal biosynthesis material, contributing to nucleotide and nonessential amino acid synthesis.27 Glutamine increases glutathione synthesis and alleviates renal dysfunction, liver fibrosis and inflammatory cytokine production.28–30 Supplementing with glutamine reduces pulmonary functional and morphological impairment and inflammation in acute respiratory distress syndrome (ARDS).31 There was a notable increase in glutamine after LPS administration, while no increases were found in glutathione, glutamate, or related amino acids, indicating that the body tried to modulate the anti-inflammatory response during the organ damage.
Oxidative Stress
LPS could induce the reactive oxygen species (ROS) accumulation, then decrease antioxidant defenses and lipid peroxidation of biological membranes with increased MDA production, which finally aggravates liver and kidney injury and in turn results in many pathological changes. Oxidative stress not only causes a series of morphological changes such as vacuolar degeneration, apoptosis, inflammatory cell infiltration and necrosis of renal parenchymal cells and hepatocytes, but also reduces glomerular filtration function and renal tubule reabsorption function. In present study, several biochemical parameters were assessed to determine the level of oxidative stress damage, including MDA, SOD and CAT activities. MDA is a representative product of polyunsaturated fatty acid peroxidation, which can be increased by oxidative stress.32 Hydroxyl radical and ROS are dismutated by SOD to generate hydrogen peroxide, which can be decomposed by CAT.33 The MDA level was significantly increased in the LPS group, while the activities of SOD and CAT were markedly decreased, indicating oxidative stress damage.
Taurine and hypotaurine metabolism, glycine metabolism, cysteine and methionine metabolism, pantothenate and coenzyme A (CoA) biosynthesis and glutathione metabolism are associated with antioxidant defense and anti-lipid peroxidation. The liver is the predominant place to secret bile, and any changes of bile acid homeostasis were linked to various types of liver injury. Taurine is well known as an abundant amino that possesses various physiological functions, such as bile acid conjugation, osmoregulation, and detoxification.34 Taurine and betaine both play important roles in scavenging ROS and improving antioxidant status and attenuating apoptosis and necrosis in LPS-induced liver injury.35–38 In this study, LPS induced pathological damage and increased the ALT/AST and TBA levels, and it dramatically decreased the serum levels of taurine and betaine aldehyde (which can be transformed into betaine), which might be a self-protection mechanism to attenuate LPS-induced oxidative damage. Cysteine, as the key critical precursor of glutathione synthesis, can scavenge and combine with free radicals. L-cysteine and L-cystine are transformed into one another based on the redox state of the cell.39 In this study, the level of L-cystine was higher while the level of L-cysteine was lower in the LPS group than the control group, indicating a disturbance of redox homeostasis after LPS administration and concurring with previous research.40 Glutathione metabolism helps maintain the normal function of liver and kidney,41 and glutathione metabolism was down-regulated in the LPS group, with the significant changes in oxidized glutathione and L-glutamine.
Pantothenic acid is the precursor of coenzyme A (CoA), which participates in sugar, lipid, and protein metabolism, suggesting an anti-lipid peroxidation effect. The possible regulatory mechanisms include scavenging ROS to protect cell membrane integrity, promoting phospholipid synthesis for repair, and increasing glutathione biosynthesis.40 Elevated pantothenic acid may be a protective response after LPS treatment.
Amino Acid Metabolism
The metabolomics results showed that the levels of multiple branched-chain amino acids (BCAAs) were significantly decreased in the LPS group compared to the control group, indicating a lack of energy and biological materials. As the metabolomics results showed that the serum levels of several amino acids were disturbed in the LPS group, LPS-induced acute liver and kidney injury were clearly associated with the alterations in amino acid metabolism (Table 1). The levels of glutamic acid, aspartic acid, proline, serine, alanine, tyrosine, cysteine, and isoleucine were decreased after LPS administration, which was related to the down-regulation of alanine, aspartate, and glutamate metabolism, arginine and proline metabolism, and cysteine and methionine metabolism. Essential amino acids play critical roles in regulating energy metabolism and synthesizing proteins of the body.42 In the study, serine and glycine were reduced, which are the potent antioxidants to scavenge free radicals and play a key role in anti-oxidative defense of liver cell.43 The decreased tyrosine level in the LPS group indicated LPS-induced kidney injury, as decreased tyrosine has been observed in chronic renal damage.44 Arginine is suggested as a potential biomarker in hepatic and renal injuries and served as a precursor for BUN and Cr.45 The increased level of BUN and Cr and arginine-related metabolites in LPS group indicated a disturbance of arginine metabolism. In addition, LPS-induced renal injury could be evidenced by the decreased level of tyrosine, which has been reported in chronic renal damage.42 Glutamic acid, as a key amino acid, serves as a signaling factor between the immune and nervous systems, a key transamination partner required for glutathione regulation, and a critical component of the defense against oxidative stress.43,46 The reduction in glutamic acid in the LPS group may indicate the damage due to inflammatory cytokines and ROS. Above alterations have been shown to induce oxidative stress and enhance amino acid catabolism, which might further aggravate the pathological damage and disturb normal biological function.43,47
Conclusion
In this study, multiple methods were used to investigate the pathological characteristics and changes in biochemical indexes during LPS-induced acute systemic inflammation. An untargeted metabolomics method involving UPLC-QTOF/MS was used to analyze the metabolite profile. In the acute systemic inflammation model, pathological injury occurred in the liver, colon, lungs, and kidneys. LPS significantly altered the serum levels of 127 metabolites, which were found to be involved in 53 pathways. The 10 most relevant pathways (Figure 8) were found to involve amino acid metabolism and lipid metabolism, and these were identified by the KEGG analysis as being involved in the regulation of multiple physiological processes, including the inflammatory response, oxidative stress, and amino acid metabolism. The results suggested that LPS-induced acute systemic inflammation mainly involves the inflammatory response, oxidative stress, and protein synthesis, causing organ damage and functional impairment. The differential metabolites and metabolic pathways identified in this paper should be further studied using targeted metabolomics, lipidomics, and proteomics, in order to elucidate mechanisms and screening therapeutic targets for developing early diagnostic strategies and treatments.
Acknowledgments
This work was supported by the National Natural Science Foundation of China (Grant numbers 81803608, 81903712).
Disclosure
The authors report no conflicts of interest.
References
1. Deng M, Scott MJ, Loughran P, et al. Lipopolysaccharide clearance, bacterial clearance, and systemic inflammatory responses are regulated by cell type-specific functions of TLR4 during sepsis. J Immunol. 2013;190(10):5152–5160. doi:10.4049/jimmunol.1300496
2. Calvano SE, Coyle SM. Experimental human endotoxemia: a model of the systemic inflammatory response syndrome? Surg Infect (Larchmt). 2012;13(5):293–299. doi:10.1089/sur.2012.155
3. Fong YM, Marano MA, Moldawer LL, et al. The acute splanchnic and peripheral tissue metabolic response to endotoxin in humans. J Clin Invest. 1990;85(6):1896–1904. doi:10.1172/JCI114651
4. Khovidhunkit W, Kim MS, Memon RA, et al. Effects of infection and inflammation on lipid and lipoprotein metabolism: mechanisms and consequences to the host. J Lipid Res. 2004;45(7):1169–1196.
5. Pearce EL, Pearce EJ. Metabolic pathways in immune cell activation and quiescence. Immunity. 2013;38(4):633–643. doi:10.1016/j.immuni.2013.04.005
6. Schrimpe-Rutledge AC, Codreanu SG, Sherrod SD, et al. Untargeted metabolomics strategies-challenges and emerging directions. J Am Soc Mass Spectrom. 2016;27(12):1897–1905. doi:10.1007/s13361-016-1469-y
7. Eckerle M, Ambroggio L, Puskarich M, et al. Metabolomics as a driver in advancing precision medicine in sepsis. Pharmacotherapy. 2017;37(9):1023–1032. doi:10.1002/phar.1974
8. Zhang H, Sha J, Feng X, et al. Dexmedetomidine ameliorates LPS induced acute lung injury via GSK-3β/STAT3-NF-κB signaling pathway in rats. Int Immunopharmacol. 2019;74:105717. doi:10.1016/j.intimp.2019.105717
9. Abdelmageed M, El-Awady M, Suddek G. Apocynin ameliorates endotoxin-induced acute lung injury in rats. Int Immunopharmacol. 2016;30:163–170. doi:10.1016/j.intimp.2015.12.006
10. Dunn WB, Broadhurst D, Begley P, et al. Procedures for large-scale metabolic profiling of serum and plasma using gas chromatography and liquid chromatography coupled to mass spectrometry. Nat Protoc. 2011;6(7):1060–1083. doi:10.1038/nprot.2011.335
11. Zelena E, Dunn WB, Broadhurst D, et al. Development of a robust and repeatable UPLC-MS method for the long-term metabolomic study of human serum. Anal Chem. 2009;81(4):1357–1364. doi:10.1021/ac8019366
12. Want EJ, Masson P, Michopoulos F, et al. Global metabolic profiling of animal and human tissues via UPLC-MS. Nat Protoc. 2013;8(1):17–32. doi:10.1038/nprot.2012.135
13. Liu M, Gong X, Quan Y, et al. A cell-based metabonomics approach to investigate the varied influences of chrysophanol-8-O-β-D-glucoside with different concentrations on L-02 cells. Front Pharmacol. 2018;9:1530. doi:10.3389/fphar.2018.01530
14. Thevenot EA, Roux A, Xu Y, et al. Analysis of the human adult urinary metabolome variations with age, body mass index, and gender by implementing a comprehensive workflow for univariate and OPLS statistical analyses. J Proteome Res. 2015;14(8):3322–3335. doi:10.1021/acs.jproteome.5b00354
15. Huang X, Gan G, Wang X, et al. The HGF-MET axis coordinates liver cancer metabolism and autophagy for chemotherapeutic resistance. Autophagy. 2019;15(7):1258–1279. doi:10.1080/15548627.2019.1580105
16. Kasawara KT, Cotechini T, Macdonald-Goodfellow SK, et al. Moderate exercise attenuates lipopolysaccharide-induced inflammation and associated maternal and fetal morbidities in pregnant rats. PLoS One. 2016;11(4):e0154405. doi:10.1371/journal.pone.0154405
17. Shan J, Qian W, Kang A, et al. Lipid profile perturbations in the plasma and lungs of mice with LPS-induced acute lung injury revealed by UHPLC-ESI-Q exactive HF MS analysis. J Pharm Biomed Anal. 2019;162:242–248. doi:10.1016/j.jpba.2018.09.037
18. Geng C, Guo Y, Wang C, et al. Comprehensive evaluation of lipopolysaccharide-induced changes in rats based on metabolomics. J Inflamm Res. 2020;13:477–486. doi:10.2147/JIR.S266012
19. Seán TA, Seán C, Paul NM, et al. Lipopolysaccharide-induced sepsis induces long-lasting affective changes in the mouse. Brain Behav Immun. 2015;43:98–109. doi:10.1016/j.bbi.2014.07.007
20. Zeki ÖC, Eylem CC, Reçber T, et al. Integration of GC-MS and LC-MS for untargeted metabolomics profiling. J Pharm Biomed Anal. 2020;190:113509. doi:10.1016/j.jpba.2020.113509
21. Ameer YT, Helene CB, Yewon C, et al. Dietary linoleic acid lowering reduces lipopolysaccharide-induced increase in brain arachidonic acid metabolism. Mol Neurobiol. 2017;54(6):4303–4315. doi:10.1007/s12035-016-9968-1
22. Liu YJ, Li H, Tian Y, et al. PCTR1 ameliorates lipopolysaccharide-induced acute inflammation and multiple organ damage via regulation of linoleic acid metabolism by promoting FADS1/FASDS2/ELOV2 expression and reducing PLA2 expression. Lab Invest. 2020;100(7):904–915. doi:10.1038/s41374-020-0412-9
23. Helioswilton SC, Patricía RS, Bethânea CP, da Silva JS, Cardoso CR. An overview of the modulatory effects of oleic acid in health and disease. Mini Rev Med Chem. 2013;13(2):201–210.
24. Zohreh S, Kashaf R, Daniel RK, et al. Potential role of uric acid in metabolic syndrome, hypertension, kidney injury, and cardiovascular diseases: is it time for reappraisal? Curr Hypertens Rep. 2013;15(3):175–181. doi:10.1007/s11906-013-0344-5
25. Minjiang C, Siming L, Hong Z, et al. Identification of the potential metabolic pathways involved in the hepatic tumorigenesis of rat diethylnitrosamine-induced hepatocellular carcinoma via H NMR-based metabolomic analysis. Biomed Res Int. 2019;9367082.
26. Qu XY, Gao H, Sun JM, et al. Identification of key metabolites during cisplatin-induced acute kidney injury using an HPLC-TOF/MS-based non-targeted urine and kidney metabolomics approach in rats. Toxicology. 2020;431:152366. doi:10.1016/j.tox.2020.152366
27. Zhu Y, Li TT, Suzane RS, et al. A critical role of glutamine and asparagine γ-nitrogen in nucleotide biosynthesis in cancer cells hijacked by an oncogenic virus. MBio. 2017;8(4):e01179–17. doi:10.1128/mBio.01179-17
28. Zhang F, Wang XY, Pan LY, et al. Glutamine attenuates lipopolysaccharide-induced acute lung injury. Nutrition. 2009;25(6):692–698. doi:10.1016/j.nut.2008.11.032
29. Shrestha N, Chand L, Han M, et al. Glutamine inhibits CCl4 induced liver fibrosis in mice and TGF-β1 mediated epithelial-mesenchymal transition in mouse hepatocytes. Food Chem Toxicol. 2016;93:129–137. doi:10.1016/j.fct.2016.04.024
30. Zhan F, Wang X, Zhang J, et al. Glutamine alleviates the renal dysfunction associated with gentamicin-induced acute kidney injury in Sprague-Dawley rats. Biotechnol Appl Biochem. 2021;18.
31. Gisele PO, Jamil ZK, Phillipe SLG, et al. Glutamine therapy reduces inflammation and extracellular trap release in experimental acute respiratory distress syndrome of pulmonary origin. Nutrients. 2019;11(4):831. doi:10.3390/nu11040831
32. Inas AA, Mariam Y, Laila R, Solieman A. Lipid peroxidation plasma biomarker correlated with hepatic fibrosis in human Schistosoma mansoni infection. Acta Parasitol. 2015;60(4):735–742. doi:10.1515/ap-2015-0105
33. Li R, Zhou XQ, Liu D, et al. Enhancing the activity and stability of Mn-superoxide dismutase by one-by-one ligation to catalase. Free Radic Biol Med. 2018;129:138–145. doi:10.1016/j.freeradbiomed.2018.09.018
34. Wu Q, Zhang H, Dong X, et al. UPLC-Q-TOF/MS based metabolomic profiling of serum and urine of hyperlipidemic rats induced by high fat diet. J Pharm Anal. 2014;4(6):360–367. doi:10.1016/j.jpha.2014.04.002
35. Kayoko S, Chian JJ, Kyoko T, et al. Role of ROS production and turnover in the antioxidant activity of taurine. Adv Exp Med Biol. 2015;803:581–596.
36. Shao HB, Chu LY, Lu ZH, et al. Primary antioxidant free radical scavenging and redox signaling pathways in higher plant cells. Int J Biol Sci. 2007;4(1):8–14. doi:10.7150/ijbs.4.8
37. Schaffer SW, Jong CJ, Ramila KC, et al. Physiological roles of taurine in heart and muscle. J Biomed Sci. 2010;17(Suppl 1):S2. doi:10.1186/1423-0127-17-S1-S2
38. Liu YY, Li F, Zhang L, et al. Taurine alleviates lipopolysaccharide‑induced liver injury by anti‑inflammation and antioxidants in rats. Mol Med Rep. 2017;16(5):6512–6517. doi:10.3892/mmr.2017.7414
39. Gordon FR, Ian LM. Existing and potential therapeutic uses for N-acetylcysteine: the need for conversion to intracellular glutathione for antioxidant benefits. Pharmacol Ther. 2014;141(2):150–159. doi:10.1016/j.pharmthera.2013.09.006
40. Ping F, Guo Y, Cao YM, et al. Metabolomics analysis of the renal cortex in rats with acute kidney injury induced by sepsis. Front Mol Biosci. 2019;6:152. doi:10.3389/fmolb.2019.00152
41. Homma T, Fujii J. Application of glutathione as anti-oxidative and anti-aging drugs. Curr Drug Metab. 2015;16(7):560–571. doi:10.2174/1389200216666151015114515
42. Liao ST, Li P, Wang JS, et al. Protection of baicalin against lipopolysaccharide induced liver and kidney injuries based on H NMR metabolomic profiling. Toxicol Res. 2016;5(4):1148–1159. doi:10.1039/C6TX00082G
43. Shi C, Han X, Mao X, et al. Metabolic profiling of liver tissues in mice after instillation of fine particulate matter. Sci Total Environ. 2019;696:133974. doi:10.1016/j.scitotenv.2019.133974
44. José MFC, Manfred WB, Milton F, et al. Maleylacetoacetate isomerase (MAAI/GSTZ)-deficient mice reveal a glutathione-dependent nonenzymatic bypass in tyrosine catabolism. Mol Cell Biol. 2002;22(13):4943–4951. doi:10.1128/MCB.22.13.4943-4951.2002
45. Saitoh W, Yamauchi S, Watanabe K, et al. Metabolomic analysis of arginine metabolism in acute hepatic injury in rats. J Toxicol Sci. 2014;39(1):41–50. doi:10.2131/jts.39.41
46. Yang CY, Hao RJ, Du XD, Wang Q, Deng Y, Sun R. Response to different dietary carbohydrate and protein levels of pearl oysters (Pinctada fucata martensii) as revealed by GC-TOF/MS-based metabolomics. Sci Total Environ. 2019;650:2614–2623. doi:10.1016/j.scitotenv.2018.10.023
47. Turner MC, Krewski D, Pope CA, et al. Long-term ambient fine particulate matter air pollution and lung cancer in a large cohort of never-smokers. Am J Respir Crit Care Med. 2011;184(12):1374–1381. doi:10.1164/rccm.201106-1011OC
 © 2021 The Author(s). This work is published and licensed by Dove Medical Press Limited. The full terms of this license are available at https://www.dovepress.com/terms.php and incorporate the Creative Commons Attribution - Non Commercial (unported, v3.0) License.
By accessing the work you hereby accept the Terms. Non-commercial uses of the work are permitted without any further permission from Dove Medical Press Limited, provided the work is properly attributed. For permission for commercial use of this work, please see paragraphs 4.2 and 5 of our Terms.
© 2021 The Author(s). This work is published and licensed by Dove Medical Press Limited. The full terms of this license are available at https://www.dovepress.com/terms.php and incorporate the Creative Commons Attribution - Non Commercial (unported, v3.0) License.
By accessing the work you hereby accept the Terms. Non-commercial uses of the work are permitted without any further permission from Dove Medical Press Limited, provided the work is properly attributed. For permission for commercial use of this work, please see paragraphs 4.2 and 5 of our Terms.