")
Back to Journals » Clinical and Experimental Gastroenterology » Volume 13
Changes in Function and Dynamics in Hepatic and Splenic Macrophages in Non-Alcoholic Fatty Liver Disease
Authors Fukushima H, Kono H , Hirayama K, Akazawa Y, Nakata Y, Wakana H, Fujii H
Received 6 February 2020
Accepted for publication 27 July 2020
Published 21 August 2020 Volume 2020:13 Pages 305—314
DOI https://doi.org/10.2147/CEG.S248635
Checked for plagiarism Yes
Review by Single anonymous peer review
Peer reviewer comments 4
Editor who approved publication: Professor Andreas M. Kaiser
Hisataka Fukushima,1 Hiroshi Kono,1 Kazuyoshi Hirayama,1 Yoshihiro Akazawa,1 Yuuki Nakata,1 Hiroyuki Wakana,1 Hideki Fujii1,2
1First Department of Surgery, Faculty of Medicine, University of Yamanashi, Yamanashi, Japan; 2Department of Surgery, Kofu Municipal Hospital, Yamanashi, Japan
Correspondence: Hiroshi Kono Email [email protected]
Background: The aim of this study was to investigate the populations and functions of hepatic and splenic macrophages (Mfs) in non-alcoholic fatty liver disease (NAFLD).
Materials and Methods: Experiment 1: Wild-type and STAM® mice were given chow or high-fat diets for designated periods. In isolated Mfs, phagocytosis and cytokine production were assessed. Immunohistochemistry for CD68 and F4/80 and expression of CD14 and CD16 were assessed. Experiment 2: Bone marrow cells harvested from enhanced green fluorescent protein (EGFP) mice were transplanted into wild-type mice with or without splenectomy after total body irradiation that was kept on methionine- and choline-deficient diets.
Results: Experiment 1: The number of CD68-positive cells and the percentage of F4/80-positive/CD68-positive cells increased with the progression of NAFLD. Production of TNF-α and IL-6 by hepatic Mfs was greater than that by splenic Mfs in mice with NASH. The number of CD14+CD16− Mfs increased in the spleen and decreased in the liver in animals that had progressed to NASH. Furthermore, the number of CD14+CD16+ hepatic Mfs was increased in animals that had progressed to NASH with fibrosis. Experiment 2: EGFP-positive cells were observed in the liver after transplantation. In the splenectomy group, EGFP-positive Mfs were also observed; however, the number was significantly less than that in the sham operation group.
Conclusion: The populations and functions of hepatic and splenic Mfs are altered during the progression of NAFLD. In addition, increased hepatic Mfs during the progression of NAFLD may migrate from bone marrow to the liver via the spleen.
Keywords: tissue macrophage, NASH, NAFLD, M1-type macrophage, bone marrow transplantation, EGFP mouse, STAM mouse
Introduction
Non-alcoholic fatty liver disease (NAFLD), described by Schaffiner in the Gastroenterology of Bockus in 1986,1 shows the same progression as alcoholic liver disease irrespective of drinking history and has been increasing recently in Japan due to westernization of the diet and lack of exercise. Non-alcoholic steatohepatitis (NASH) is a severe form of NAFLD and includes not only fat deposition in the hepatocytes, but also necrosis, inflammation, and fibrosis. As a result, NASH can progress to cirrhosis and hepatocellular carcinoma (HCC).2–4 Hepatocellular carcinoma is the most common primary malignancy in the liver. It is well known that chronic hepatitis B and C viral infections are risk factors for HCC.5 Although treatment of hepatitis viral infections has improved, the incidence of HCC is still increasing in parallel with epidemics of metabolic syndrome including obesity and diabetes mellitus.6–8 Recently, NAFLD and NASH have been reported to be major causes of virus-independent HCC worldwide.9
In NASH, M1-type hepatic macrophages (Mfs) were found to be increased and produced inflammatory cytokines,10–12 resulting in progressive pathological changes including inflammation, necrosis, and fibrosis.13 Indeed, intrahepatic expression of the proinflammatory cytokine TNF-α was increased in NAFLD patients.14 Furthermore, it was also reported that the phagocytic ability of hepatic Mfs had deteriorated.15 Indeed, contrast-enhanced ultra-sonography revealed that uptake of microbubbles by Mfs was decreased in the liver and increased in the spleen in NAFLD patients16,20 Thus, the function of tissue-resident Mfs, including hepatic and splenic Mfs may be difference in NAFLD patients with progression of disease. Although there have been several studies investigating the etiology of NASH, it remains challenging due to the need for invasive diagnostic methods including liver biopsy.17 Therefore, the use of animal models is useful to help elucidate the mechanisms of this disease.18 Indeed, a methionine- and choline-deficient (MCD) diet is one of the widely used animal models of NAFLD.19 In contrast, the STAM mouse also develops NASH, NASH with fibrosis, and finally HCC. This model demonstrates a pathological progression that is very similar to that in human, in particular the rapid and step-wise progression from steatosis to NASH to fibrosis.20 In this study, the functional difference and dynamics of the Mfs between the liver and spleen was investigated using these two different NAFLD mouse models.
Materials and Methods
Animals and Treatments
Male wildtype mice (C57BL/6, 8–9 weeks of age, obtained from Jackson Laboratories, Bar Harbor, ME) and male STAM® mice [7 weeks of age for the NASH group, 9 weeks of age for the NASH with fibrosis (NASHf) group; mice were obtained from Stelic Institute & Co., Tokyo, Japan] were housed in a cleanroom, and given free access to water. Both wildtype and STAM® mice were given free access to regular laboratory chow diets or high-fat diets (High Fat Diet 32, CLEA-Japan, Tokyo, Japan) for several days (the NASH group, for 4 weeks; the NASHf group, for 8 weeks; and the NASH HCC group, for 12 weeks). The mice were sacrificed, and exsanguinated livers and spleens were removed. Sections from livers and spleens were fixed in 10% formalin. The experimental protocol followed our institutional and the National Research Council criteria for the care and use of laboratory animals in research. All animals used for this study were housed in sterilized cages in a facility with a 12-hr night/day cycle. Temperature and relative humidity were maintained at 23 ± 2°C and 50 ± 10%, respectively. Staff in the animal laboratory facility of the University of Yamanashi maintained these animal facilities, and veterinarians are always available to ensure animal health. All animals were given humane care in compliance with governmental regulations and institutional guidelines. Studies were performed according to protocols approved by the appropriate institutional review board (approval No 19-58).
Isolation of the Macrophages from the Liver and Spleen
Hepatic Mfs were isolated from mice as previously described with minor modifications.21 Briefly, mice were anesthetized with inhaled diethyl ether, the abdomen was opened and the portal vein was cannulated with a small length of polypropylene tube. Then, the inferior vena cava was ligated above the diaphragm, and the inferior vena cava dissected. The liver was perfused in situ for 5 min with Ca2+/Mg2+-free liver perfusion medium (LPM-1), and was then perfused with complete liver perfusion medium (LPM-2) containing 0.06% collagenase type IV (Sigma, St Louis, MO, USA) for an additional 15 min. After perfusion, the liver was removed, cut into small pieces, and homogenized. For the splenic Mfs, splenectomy was performed before cannulation of the portal vein. Then, the removed spleen was cut into small pieces and homogenized. After passing through a 70-µm nylon mesh to eliminate non-digested materials, cells were washed twice with warm Gey’s balanced salt solution (GBSS-B) and centrifuged on a 16% (w/v) Nycodenz (Axis-Shields, Oslo, Norway) gradient at 1900g, 4ºC for 20 min. Mfs were collected from under the interface, washed with GBSS-B and resuspended in Dulbecco’s modified Eagle’s medium (DMEM; GIBCO Laboratories Life Technology, Grand Island, NY). The purity of isolated macrophage using this method was previously reported from this laboratory.22
Assessment of Phagocytosis by Isolated Macrophages
Isolated Mfs from the liver and spleen were collected, resuspended at a concentration of 1 × 10⁶ cells/mL in DMEM supplemented with 10% fetal calf serum and antibiotics, and plated (1 × 10⁶ cells per well, n = 5 in each group) in a 24-well culture plate. The same concentration of Fluorescein isothiocyanate (FITC)-labeled latex beads (1 µm; Polysciences, Harrison, PA) in the previous study were added to each well. Cells were incubated in 5% CO2 for 12 hours at 37ºC and washed three times with phosphate-buffered saline (PBS).23 Then, the same microscopic field was photographed in normal light or FITC filter. The number of FITC-labeled beads taken in by each cell was counted in three different microscopic (×400) fields per mouse to assess the phagocytic ability.
Production of TNF-α, IL-6, and IL-10 by Isolated Tissue Macrophages
Hepatic and splenic Mfs were isolated, resuspended at a concentration of 1×10⁶ cells/mL in DMEM supplemented with 10% fetal calf serum and antibiotics, plated (1×10⁶ cells per well, n = 5 in each group) in a 24-well culture plate, and immediately stimulated by 0, 1, 10, and 100 µg/mL lipopolysaccharide (LPS; Escherichia coli serotype 0111: B4; Sigma). Then, cells were incubated in 5% CO2 for 48 hours at 37ºC, and supernatants were collected and stored at −80ºC for further analysis. Concentrations of TNF-α, IL-6, and IL-10 were determined using ELISA kits according to the manufacturer’s protocol (Invitrogen, Carlsbad, CA).
Immunohistochemical Staining for CD68 and F4/80
Each section was deparaffinized and treated in proteinase K (400 µg/mL; Dako, Carpentaria, CA, USA) for 10 min at room temperature for CD68-antigen retrieval, and diluted proteinase K (20 µg/mL) for 5 min at room temperature for F4/80-antigen retrieval. Endogenous peroxidase was quenched by incubation in 0.3% H2O2 at room temperature, followed by rinsing with PBS. Endogenous biotin was quenched using the Dako Biotin Blocking System (Dako). Sections were blocked using 5% normal blocking serum for 20 min. Rat monoclonal anti-CD68 (1:100; AbD Serotec, Oxford, UK) and anti-F4/80 (1:100; AbD Serotec) antibodies were applied overnight at 4ºC and for 30 min at room temperature, respectively. Following incubation, immunoperoxidase staining was completed using a Vectastain ABC elite kit (Vector Laboratories, Burlingame, CA, USA) and 3,3ʹ-diaminobenzidine-tetrachloride as a chromogen. CD68- and F4/80-positive Mfs were counted in three different (×400) fields.
Double Immunofluorescence Staining for CD14 and CD16
Each section was deparaffinized and incubated in antigen retrieval solution for 20 min at 96°C using Dako REAL Target Retrieval Solution. Sections were blocked with 5% normal blocking goat serum (ab7481) for 20 min. Rabbit polyclonal anti-CD14 (bis Bs-1192R) and Rat monoclonal anti-CD16/32 (2.4G2) antibodies were applied overnight at 4°C, followed by incubation with FITC conjugated Goat anti-Rat IgG (H+R) polyclonal antibody and Alexa Flour 647 Goat anti-Rabbit IgG for 2 hr at room temperature in a dark area. Double immunofluorescence of sections was examined with an inverted confocal laser-scanning microscope (OLYMPUS FV1000).
Bone Marrow Transplantation
Bone marrow cells were harvested from the femurs of the enhanced green fluorescent protein (EGFP) mice [C57BL/6-Tg (CAG-EGFP)1Osb/J, obtained from Jackson Laboratories, Bar Harbor, ME]. After passing through a 70 μm nylon mesh to purify material and eliminate unnecessary tissues and/or cells were washed twice with DMEM. The pellet was put into Tris-buffered ammonium chloride for 20 min at room temperature and hemolysis of red blood cells was performed. Then, the cells were washed with DMEM 3 times and adjusted to a concentration of 5×10⁶ cells/mL in DMEM supplemented with 10% fetal calf serum and antibiotics.
Eight weeks old C57/BL6 mice were irradiated with 5Gy 2 times with an interval of 2 hours. Twenty-four hours after radiation, mice were transplanted with 200 µl of bone marrow solution into the tail vein. Thereafter, they were induced to develop NAFLD by being placed on MCD diets for several weeks (the NASH group, for 4 weeks; the NASHf group, for 8 weeks; and the NASH HCC group, 12 weeks). Four weeks after transplantation, animals were sacrificed to check the effect of the transplantation. Also, mice were sacrificed 12 or 16 weeks after the transplantation, and livers and spleens were harvested. Each section was deparaffinized and incubated in antigen retrieval solution for 20 min at 96°C using Dako REAL Target Retrieval Solution. Sections were blocked with 5% normal blocking goat serum (ab7481) for 20 min. Rat anti-Mouse CD68 (MCA1957GA) monoclonal antibody was applied overnight at 4°C, followed by incubation with Alexa Flour 647 Anti-Complement C3, Rat-Mono (11H9), for 2 hours at room temperature in a dark area. Double immunofluorescence of sections was examined. Rat anti-Mouse F4/80 (MCA497GA) monoclonal antibody, and Anti-CD163/M130 (BIS bs-2527R) polyclonal antibody were also applied.
C57BL/6 mice underwent splenectomy at 4 weeks of age and were transplanted with EGFP cells at 8 weeks of age, then, they were induced to develop NASH using the MCD diet. The mice were then sacrificed at 4, 8, 12, or 16 weeks after bone marrow transplantation. Liver and spleen tissues were harvested and used for further analysis.
Statistical Analysis
Data are expressed as the mean ± SEM. Statistical differences between mean values were analyzed by ANOVA with Bonferroni post hoc tests. p <0.05 was considered to be significant.
Results
Experiment 1
Phagocytosis by Macrophages
In hepatic Mfs, the number of beads per Mf decreased with the progression of NAFLD, and the number was significantly less in the NASHf group than in the control group (Figure 1). In splenic Mfs, the number of beads per Mf increased with the progression of NAFLD, and the number was significantly greater in the NASH and NASHf groups than in the control. In hepatic Mfs, the percentage of Mfs with beads to all Mfs decreased with the progression of NAFLD, and the percentage was significantly less in the NASHf group than in the control and NASH groups (Figure 1B). In splenic Mfs, the percentage of Mfs with beads to all Mfs increased with the progression of NAFLD, and the percentage was significantly greater in the NASHf group than the control and NASH groups.
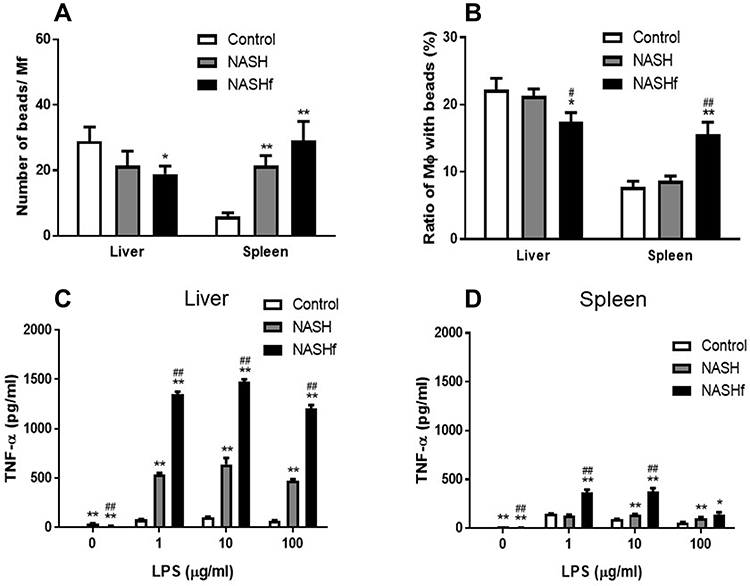 |
Figure 1 Phagocytosis and production of TNF-α by isolated hepatic and splenic macrophages Phagocytosis of isolated hepatic or splenic Mfs is shown. (A), count of FITC-labeled beads per Mfs; and (B), percentage of Mfs with FITC-labeled beads to all Mfs. Production of TNF-α by isolated hepatic or splenic Mfs stimulated with LPS is shown as described in the Materials and Methods. (C), isolated hepatic Mfs; and (D). Isolated splenic Mfs. Data represent means by ANOVA with Bonferroni’s post hoc test. Data represent means ± SEM (n = 5 in each group). *p <0.05 and **p <0.01 compared with the control by ANOVA with Bonferroni’s post hoc test. #p <0.05 and ##p <0.01 compared with the NASH group by ANOVA with Bonferroni’s post hoc test. |
Production of TNF-α, IL-6, and IL-10 by Hepatic and Splenic Macrophages Stimulated with LPS
In hepatic Mfs, production of TNF-α was increased significantly with the progression of NAFLD (Figure 1C). In splenic Mfs, production of TNF-α also increased significantly with the progression of NAFLD (Figure 1D). Production of TNF-α by hepatic Mfs was significantly greater than that by splenic Mfs in the same condition of NAFLD.
In hepatic Mfs, production of IL-6 was significantly greater in the NASH and NASHf groups than in the control group, and also was significantly less in the NASHf group than in the NASH group (Figure 2A). In splenic Mfs, production of IL-6 was increased significantly with the progression of NAFLD (Figure 2B). The production of IL-6 by hepatic Mfs was significantly greater than that by splenic Mfs in the same condition of NAFLD.
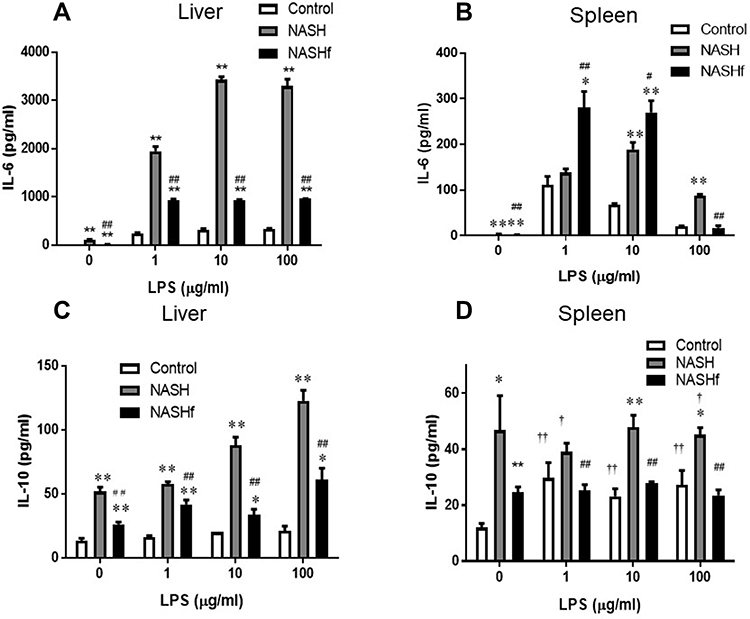 |
Figure 2 Production of IL-6 and IL-10 by isolated tissue macrophages. Production of IL-6 and IL-10 by isolated hepatic or splenic Mfs stimulated with LPS is shown as described in the Materials and Methods. (A), production of IL-6 by isolated hepatic Mfs; (B), production of IL-6 by isolated splenic Mfs; (C), production of IL-10 by isolated hepatic Mfs; and (D), production of IL-10 by isolated splenic Mfs. Data represent means ± SEM (n = 5 in each group). *p <0.05 and **p <0.01 compared with the control by ANOVA with Bonferroni’s post hoc test. #p <0.05 and ##p <0.01 compared with the NASH group by ANOVA with Bonferroni’s post hoc test. †p <0.05 and ††p <0.01 compared with the NASHf by ANOVA with Bonferroni’s post hoc test. |
In hepatic Mfs, production of IL-10 was significantly greater in the NASH group than in the control group (Figure 2C). Furthermore, it was significantly less in the NASHf group than in the NASH group. In splenic Mfs, production of IL-10 was significantly greater in the NASH group than in the control group (Figure 2D). Furthermore, it was significantly less in the NASHf group than in the NASH group.
Immunohistochemical Analysis for CD68 and F4/80
In the liver, although the number of CD68-positive cells increased in the NASHf group compared with the control and NASH groups, there were no significant differences among the three groups studied. In the spleen, the number of CD68-positive cells was significantly greater in the NASH group than in the control group. Although the number of CD68-positive cells also increased in the NASHf group compared with the control, there were no significant differences among the three groups studied (Figure 3A).
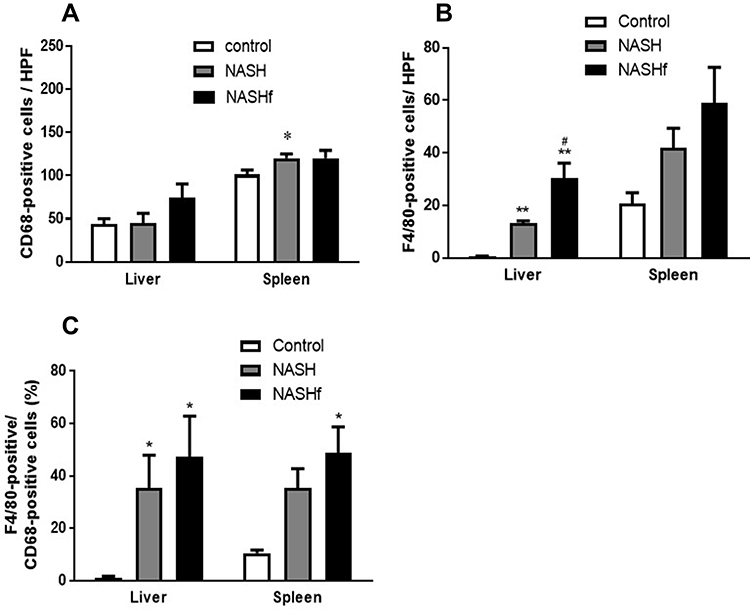 |
Figure 3 Immunohistochemical staining for CD68 and F4/80. (A), The number of CD68-positive cells in the liver or spleen; (B), The number of F4/80-positive cells in the liver or spleen; and (C), Percentage of F4/80-positive cells to CD68-positive cells is shown. Data represent means ± SEM (n = 5 in each group). *p <0.05 and **p <0.01 compared with the control by ANOVA with Bonferroni’s post hoc test. #p <0.05 compared with the NASH group by ANOVA with Bonferroni’s post hoc test. |
In the liver, the number of F4/80-positive cells was significantly greater in the NASH and NASHf groups than in the control group (Figure 3). Furthermore, the number of F4/80-positive cells was significantly greater in the NASHf group than in the NASH group. In the spleen, although the number of F4/80-positive cells increased with the progression of NAFLD, there were no significant differences among the three groups studied. In the liver, the percentage of F4/80-positive cells to CD68-positive cells was significantly greater in the NASH and the NASHf groups than in the control group (Figure 3C). In the spleen, this percentage increased with the progression of NAFLD, and there was a significant difference between the NASHf group and the control group.
Double Immunofluorescence Staining for CD14 and CD16
In the liver, the number of CD14+CD16− Mfs decreased with the progression of NAFLD; however, there were no significant differences among the three groups studied (Figure 4A). The number of CD14+CD16+ Mfs in the NASHf group was significantly increased compared with the control group (Figure 4B).
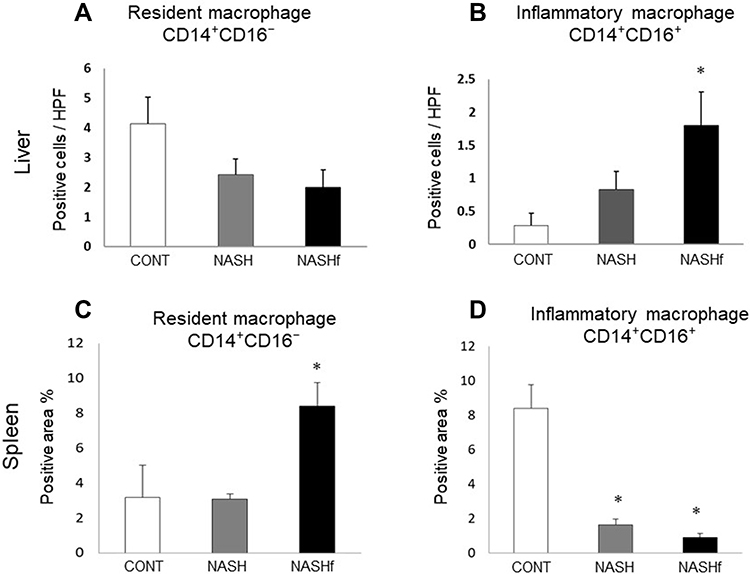 |
Figure 4 Double immunofluorescence staining for CD14 and CD16. (A), The number of CD14+CD16− cells and (B), the number of CD14+16+ cells in the liver are shown. (C), the positive area/whole area (%) of CD14+CD16− cells in the spleen; and (D), the positive area/whole area (%) of CD14+CD16+ cells in the spleen are shown. Data represent means ± SEM (n = 5 in each group). *p < 0.05 compared with the NASH group by ANOVA with Bonferroni’s post hoc test. |
In the spleen, the area of CD14+CD16− Mfs was wider in the NASHf group than in the control group (Figure 4C). The area of CD14+CD16+ Mfs in the NASHf and the NASH groups was significantly less than that of the control group (Figure 4D).
Experiment 2
Distribution and Dynamics of EGFP-Positive Cells After Bone Marrow Transplantation
EGFP-positive cells were not observed in the liver tissues in mice fed chow diets without the EGFP cell transplantation (Figure 5A). In animals underwent a sham operation, EGFP-positive cells were observed in the spleen; however, no positive cells were observed in the liver 4 weeks after the bone marrow transplantation (Figure 5B–D). Furthermore, 12 weeks after the bone marrow transplantation, positive cells were detected in the livers of animals fed with MCD diets; however, positive cells were not detected in the livers of animals fed with chow diets. Moreover, 16 weeks after transplantation, EGFP-positive cells were substantially co-localized with both CD68 and F4/80 in the livers of mice fed MCD diets (Figure 5E and F).
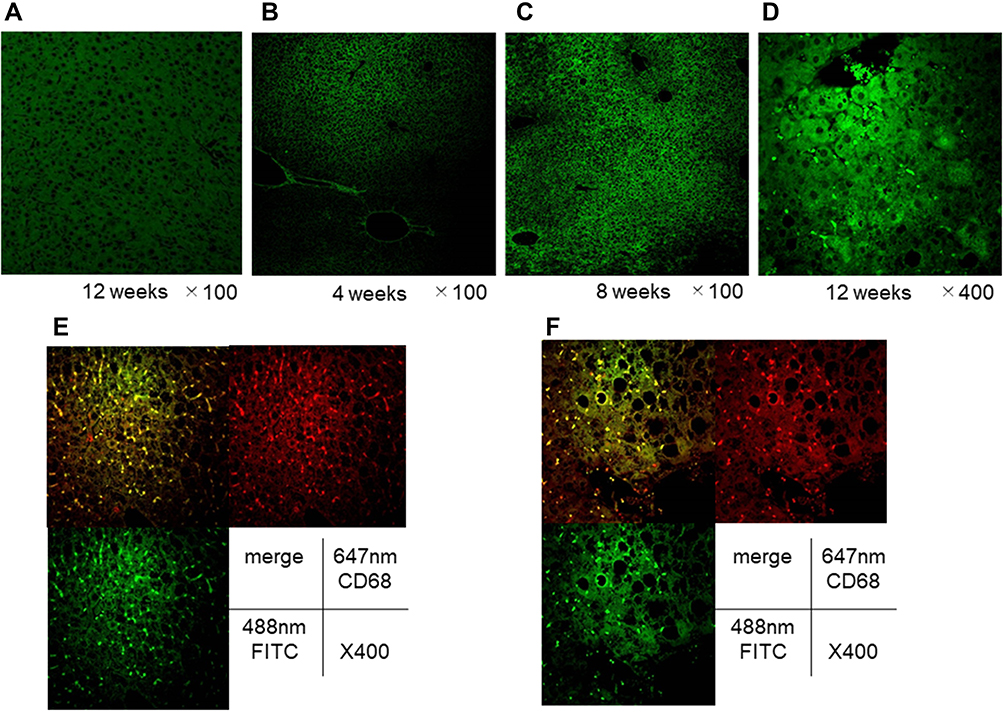 |
Figure 5 Liver pathology after the EGFP cell transplantation, and population of EGFP-positive cells and double immunofluorescence staining for CD68 and F4/80 in the liver of animals without splenectomy. Representative photomicrographs are shown. (A), liver tissues in normal animals fed chow diet for 12 weeks without the EGFP cell transplantation. Mice without splenectomy were sacrificed at 4 weeks (B), 8 weeks (C), and 12 weeks (D) after EGFP cell transplantation. (E), CD68 staining and F4/80 staining in the liver 16 weeks after the cell transplantation in animals without the splenectomy; and (F), CD68 staining and F4/80 staining in the liver 16 weeks after the cell transplantation in animals without the splenectomy. |
In animals underwent splenectomy, there were no EGFP-positive cells in the liver 8 weeks after transplantation. In contrast, 12 weeks after transplantation, a few EGFP-positive cells, which were co-localized with both CD68 and F4/80, were observed in the liver (Figure 6A and B). Importantly, the number of positive Mfs was significantly less in mice underwent splenectomy than in animals underwent sham operation in the same week (Figure 6C).
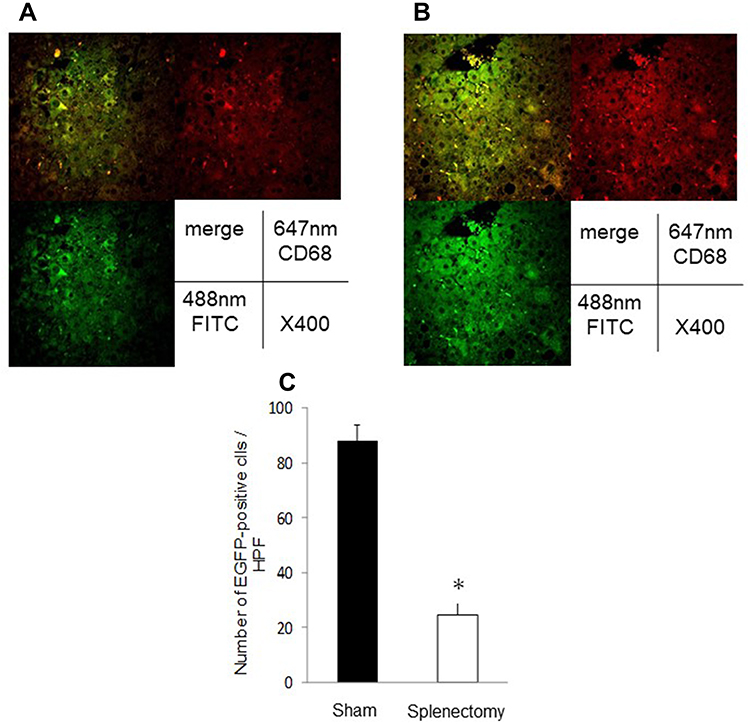 |
Figure 6 Double immunofluorescence staining for CD68 and F4/80 in the liver of animals with splenectomy, and the number of EGFP-positive macrophages in the liver. Representative photomicrographs are shown. (A), CD68 staining; and (B), F4/80 staining in the liver 16 weeks after bone marrow transplantation. (C), the number of EGFP-positive Mfs. Data represent means ± SEM (n = 5 in each group). *p <0.05 compared with the NASH group by ANOVA with Bonferroni’s post hoc test. |
Discussion
Asanuma et al reported that the number of hepatic Mfs increased, and the phagocytic ability deteriorated in NASH.2,15 In the progression of NAFLD to NASH, Mfs have important role in the inflammatory response. Though some studies indicated that the number of hepatic Mfs increased in the dietary mouse model of NAFLD. Alternatively, it was also reported from other studies that there was no increasing in total number of Mf.24–28 In this study, with progression of NAFLD, the number of the total hepatic Mfs tended to increase; however, there were no significant differences in the number between the liver and the spleen (Figure 1). In contrast, the percentage of the M2-type (matured) hepatic Mfs/total hepatic Mfs significantly increased (Figure 3C). Furthermore, both the percentage of Mfs contributing to phagocytosis and phagocytic ability deteriorated (Figure 1A and B). On the other hand, the number of splenic Mfs and the percentage of matured Mfs significantly increased (Figure 3C). Both the phagocytic ability per total Mfs and the percentage of Mfs contributing to phagocytosis also increased (Figure 1A and B). These results indicated that in order to compensate for the reduction of phagocytosis by hepatic Mfs, the number of the splenic Mfs increased, and they showed enhanced phagocytosis.
It was previously reported that M1-type hepatic Mfs are increased in NASH and produce inflammatory cytokines in the liver.10 In this study, inflammatory cytokines, including TNF-α and IL-6, produced by the M1-type Mfs were increased, and anti-inflammatory cytokine IL-10, which is an produced by the M2-type Mfs, did not show marked increases, although there were significant differences between the two subtypes of Mfs. In addition, inflammatory cytokine levels were significantly greater in the liver than the spleen, and IL-10 levels were similar both in the liver and spleen (Figures 2–4). These results indicated that only the M1-type Mfs were increased in the liver in NAFLD. Taken together, the number both of hepatic and splenic Mfs increases, and they were matured with the progression of NAFLD. Furthermore, the hepatic Mfs produce inflammatory cytokines, and the splenic Mfs showed enhanced phagocytosis. Thus, Mfs produce numerous proinflammatory cytokines and exacerbate fibrosis or inflammation in NASH term. Alternatively, Mfs could change their function and produce less cytokine with progresses of disease from FAFLD to NASH.
Reid et al reported that resident hepatic Mfs decreased with the development of NASH and were subsequently replaced by a recruited monocyte-derived Mf population in the liver.29 Furthermore, in necroptosis induced by bacterial infection with Listeria monocytogenes, hepatic Mfs were replaced by bone marrow-derived monocytes for tissue repair and re-establishment of local environment in the liver.30 Many studies have been performed to clarify the role of both resident and recruited immune cells contributing to the progression of NAFLD. Indeed, recruited monocytes, neutrophils, T cells, and NKT cells involved in the progression of NAFLD.31 Therefore, to investigate the dynamics of Mfs, another experiment was conducted (Experiment 2). As a result, 4 weeks after the transplantation of EGFP-positive cells, the positive cells were detected only in the spleen (Figures 5 and 6). Furthermore, 12 weeks after bone marrow transplantation, the positive cells were found in the liver. These EGFP-positive cells were identified as Mfs by immunohistochemical staining for CD68 and F4/80 (Figure 5A and B). These results indicated that the population of Mfs derived from bone marrow increased with the progression of NAFLD. Furthermore, the number of EGFP-positive cells in animals with splenectomy was significantly less than those in animals without splenectomy. This result indicated that infiltrating hepatic Mfs derived from bone marrow could enter the liver via the spleen.
Taken together, the progression of NAFLD alters the function of hepatic and splenic Mfs. Furthermore, these inflammatory hepatic Mfs that increased with the pathophysiological progression of NAFLD may have migrated into the liver via the spleen from bone marrow.
Abbreviations
NAFLD, non-alcoholic fatty liver disease; HCC, hepatocellular carcinoma; EGFP, enhanced green fluorescent protein; NASH, non-alcohol steatohepatitis.
Author Contributions
All authors made substantial contribution to conception and design, acquisition of data, or analysis and interpretation of data; took part in drafting the article or revising it critically for important intellectual content; gave final approval of the version to be published; and agree to be accountable for all aspects of the work.
Disclosure
All authors have no financial and personal relationships with other people or organizations that could potentially and inappropriately influence (bias) their work and conclusions. The authors report no conflicts of interest in this work.
References
1. Schaffner F, Thaler H. Nonalcoholic fatty liver disease. Prog Liver Dis. 1986;8:283–298.
2. Ekstedt M, Franzen LE, Mathiesen UL, et al. Long-term follow-up of patients with NAFLD and elevated liver enzymes. Hepatology. 2006;44:865–873. doi:10.1002/hep.21327
3. Younossi Z, Tacke F, Arrese M, et al. Global perspectives on nonalcoholic fatty liver disease and nonalcoholic steatohepatitis. Hepatology. 2019;69:2672–2682. doi:10.1002/hep.30251
4. Angulo P. Nonalcoholic fatty liver disease. N Engl J Med. 2002;346:1221–1231. doi:10.1056/NEJMra011775
5. Trevisani F, Cantarini MC, Wands JR, Bernardi M. Recent advances in the natural history of hepatocellular carcinoma. Carcinogenesis. 2008;29:1299–1305. doi:10.1093/carcin/bgn113
6. Ascha MS, Hanouneh IA, Lopez R, Tamimi TA, Feldstein AF, Zein NN. The incidence and risk factors of hepatocellular carcinoma in patients with nonalcoholic steatohepatitis. Hepatology. 2010;51:1972–1978. doi:10.1002/hep.23527
7. Nordenstedt H, White DL, El-Serag HB. The changing pattern of epidemiology in hepatocellular carcinoma. Dig Liver Dis. 2010;42(Suppl 3):S206–14. doi:10.1016/S1590-8658(10)60507-5
8. Blonski W, Kotlyar DS, Forde KA. Non-viral causes of hepatocellular carcinoma. World J Gastroenterol. 2010;16:3603–3615. doi:10.3748/wjg.v16.i29.3603
9. Starley BQ, Calcagno CJ, Harrison SA. Nonalcoholic fatty liver disease and hepatocellular carcinoma: a weighty connection. Hepatology. 2010;51:1820–1832. doi:10.1002/hep.23594
10. Li Z, Soloski MJ, Diehl AM. Dietary factors alter hepatic innate immune system in mice with nonalcoholic fatty liver disease. Hepatology. 2005;42:880–885. doi:10.1002/hep.20826
11. Yang SQ, Lin HZ, Lane MD, Clemens M, Diehl AM. Obesity increases sensitivity to endotoxin liver injury: implications for the pathogenesis of steatohepatitis. Proc Natl Acad Sci U S A. 1997;94:2557–2562. doi:10.1073/pnas.94.6.2557
12. Lumeng CN, Bodzin JL, Saltiel AR. Obesity induces a phenotypic switch in adipose tissue macrophage polarization. J Clin Invest. 2007;117:175–184. doi:10.1172/JCI29881
13. Duarte N, Coelho IC, Patarrao RS, Almeida JI, Penha-Goncalves C, Macedo MP. How inflammation impinges on NAFLD: a role for kupffer cells. Biomed Res Int. 2015;2015:984578. doi:10.1155/2015/984578
14. Engin A. Non-alcoholic fatty liver disease. Adv Exp Med Biol. 2017;960:443–467.
15. Asanuma T, Ono M, Kubota K, et al. Super paramagnetic iron oxide MRI shows defective Kupffer cell uptake function in non-alcoholic fatty liver disease. Gut. 2010;59:258–266. doi:10.1136/gut.2009.176651
16. Iijima H, Moriyasu F, Tsuchiya K, et al. Decrease in accumulation of ultrasound contrast microbubbles in non-alcoholic steatohepatitis. Hepatol Res. 2007;37:722–730. doi:10.1111/j.1872-034X.2007.00130.x
17. Froehlich F, Lamy O, Fried M, Gonvers JJ. Practice and complications of liver biopsy. Results of a nationwide survey in Switzerland. Dig Dis Sci. 1993;38:1480–1484. doi:10.1007/BF01308607
18. Reid DT, Eksteen B. Murine models provide insight to the development of non-alcoholic fatty liver disease. Nutr Res Rev. 2015;28:133–142. doi:10.1017/S0954422415000128
19. Itagaki H, Shimizu K, Morikawa S, Ogawa K, Ezaki T. Morphological and functional characterization of non-alcoholic fatty liver disease induced by a methionine-choline-deficient diet in C57BL/6 mice. Int J Clin Exp Pathol. 2013;6:2683–2696.
20. Fujii M, Shibazaki Y, Wakamatsu K, et al. A murine model for non-alcoholic steatohepatitis showing evidence of association between diabetes and hepatocellular carcinoma. Med Mol Morphol. 2013;46:141–152. doi:10.1007/s00795-013-0016-1
21. Tsuchiya M, Kono H, Matsuda M, Fujii H, Rusyn I. Protective effect of Juzen-taiho-to on hepatocarcinogenesis is mediated through the inhibition of Kupffer cell-induced oxidative stress. Int J Cancer. 2008;123:2503–2511. doi:10.1002/ijc.23828
22. Kono H, Fujii H, Amemiya H, et al. Role of Kupffer cells in lung injury in rats administered endotoxin 1. J Surg Res. 2005;129:176–189. doi:10.1016/j.jss.2005.06.009
23. Kono H, Fujii H, Asakawa M, et al. Functional heterogeneity of the kupffer cell population is involved in the mechanism of gadolinium chloride in rats administered endotoxin. J Surg Res. 2002;106:179–187. doi:10.1006/jsre.2002.6434
24. Kiki I, Altunkaynak BZ, Altunkaynak ME, Vuraler O, Unal D, Kaplan S. Effect of high fat diet on the volume of liver and quantitative feature of Kupffer cells in the female rat: a stereological and ultrastructural study. Obes Surg. 2007;17:1381–1388. doi:10.1007/s11695-007-9219-7
25. Tosello-Trampont AC, Landes SG, Nguyen V, Novobrantseva TI, Hahn YS. Kuppfer cells trigger nonalcoholic steatohepatitis development in diet-induced mouse model through tumor necrosis factor-alpha production. J Biol Chem. 2012;287:40161–40172. doi:10.1074/jbc.M112.417014
26. de Meijer VE, Sverdlov DY, Le HD, Popov Y, Puder M. Tissue-specific differences in inflammatory infiltrate and matrix metalloproteinase expression in adipose tissue and liver of mice with diet-induced obesity. Hepatol Res. 2012;42:601–610. doi:10.1111/j.1872-034X.2011.00960.x
27. Clementi AH, Gaudy AM, van Rooijen N, Pierce RH, Mooney RA. Loss of Kupffer cells in diet-induced obesity is associated with increased hepatic steatosis, STAT3 signaling, and further decreases in insulin signaling. Biochim Biophys Acta. 2009;1792:1062–1072. doi:10.1016/j.bbadis.2009.08.007
28. Daemen S, Schilling JD. The interplay between tissue niche and macrophage cellular metabolism in obesity. Front Immunol. 2019;10:3133. doi:10.3389/fimmu.2019.03133
29. Reid DT, Reyes JL, McDonald BA, Vo T, Reimer RA, Eksteen B. Kupffer cells undergo fundamental changes during the development of experimental NASH and are critical in initiating liver damage and inflammation. PLoS One. 2016;11:e0159524. doi:10.1371/journal.pone.0159524
30. Bleriot C, Dupuis T, Jouvion G, Eberl G, Disson O, Lecuit M. Liver-resident macrophage necroptosis orchestrates type 1 microbicidal inflammation and type-2-mediated tissue repair during bacterial infection. Immunity. 2015;42:145–158. doi:10.1016/j.immuni.2014.12.020
31. Heymann F, Tacke F. Immunology in the liver–from homeostasis to disease. Nat Rev Gastroenterol Hepatol. 2016;13:88–110. doi:10.1038/nrgastro.2015.200
 © 2020 The Author(s). This work is published and licensed by Dove Medical Press Limited. The full terms of this license are available at https://www.dovepress.com/terms.php and incorporate the Creative Commons Attribution - Non Commercial (unported, v3.0) License.
By accessing the work you hereby accept the Terms. Non-commercial uses of the work are permitted without any further permission from Dove Medical Press Limited, provided the work is properly attributed. For permission for commercial use of this work, please see paragraphs 4.2 and 5 of our Terms.
© 2020 The Author(s). This work is published and licensed by Dove Medical Press Limited. The full terms of this license are available at https://www.dovepress.com/terms.php and incorporate the Creative Commons Attribution - Non Commercial (unported, v3.0) License.
By accessing the work you hereby accept the Terms. Non-commercial uses of the work are permitted without any further permission from Dove Medical Press Limited, provided the work is properly attributed. For permission for commercial use of this work, please see paragraphs 4.2 and 5 of our Terms.