")
Back to Journals » HIV/AIDS - Research and Palliative Care » Volume 8
Changes in coronary heart disease risk profiles of HIV patients in Zimbabwe over 9 months: a follow-up study
Authors Zhou DT , Oktedalen O, Shawarira-Bote S, Stray-Pedersen B
Received 20 May 2016
Accepted for publication 23 June 2016
Published 25 October 2016 Volume 2016:8 Pages 165—174
DOI https://doi.org/10.2147/HIV.S113206
Checked for plagiarism Yes
Review by Single anonymous peer review
Peer reviewer comments 3
Editor who approved publication: Professor Bassel Sawaya
Danai Tavonga Zhou,1,2 Olav Oektedalen,3 Sandra Shawarira-Bote,4 Babill Stray-Pedersen5
1Department of Medical Laboratory Sciences, College of Health Sciences, University of Zimbabwe, Avondale, Harare, Zimbabwe; 2Institute of Clinical Medicine, University of Oslo, 3Department of Infectious Diseases, Oslo University Hospital, Oslo, Norway; 4Newlands Clinic, Harare, Zimbabwe; 5Institute of Clinical Medicine, University in Oslo and Womens Clinic, Oslo University Hospital, Oslo, Norway
Abstract: Dyslipidemia, hypertension, inflammation, and coronary heart disease (CHD) are adverse events in human immunodeficiency virus (HIV)-infected patients even if they are receiving antiretroviral therapy (ART). Yet, data on CHD risk induced by HIV or ART in sub-Saharan Africa are limited. The aim of this longitudinal study was to describe changes in CHD risk profiles measured by lipids, inflammatory markers, and Framingham scores among HIV-positive patients previously reported from Harare, Zimbabwe. Patients were grouped into ART-experienced patients (n=147) and ART-naïve patients (n=23) and followed up for 9 months. Generalized least squares random-effects modeling was applied to explain changes in total cholesterol (TC), high-density lipoprotein (HDL), low-density lipoprotein, TC/HDL ratio, myeloperoxidase, highly sensitive C-reactive protein, and Framingham scores over the 9-month period. Independent variables included age, sex, monthly earning, body mass index, systolic blood pressure (SBP), diastolic blood pressure, duration of HIV diagnosis, duration of ART, viral load, and CD4 count. In ART-experienced patients, there was a substantial decrease in TC over time, ART-negative patients showed a significant increase in TC and HDL over time, and the increase in TC was associated with high viral load and low duration of HIV diagnosis, while increase in HDL was associated with young age, low body mass index, and low SBP. Framingham risk scores increased with time in ART-positive patients, and the change was positively correlated with age, sex, high SBP, and low HDL. There was no association between calculated CHD risk (TC/HDL ratio or Framingham score) and changes in levels of inflammatory markers (myeloperoxidase and highly sensitive C-reactive protein) in any of the patient groups. In conclusion, ART-experienced HIV-positive patients show changes in lipid values over time that makes it necessary to include lipid monitoring in order to reduce any risk of long-term CHD.
Keywords: ART, CHD, cohort, Framingham, HIV
Introduction
An estimated 36.9 million people are infected with human immunodeficiency virus (HIV) worldwide, and transmission in Zimbabwe and sub-Saharan Africa is mainly through heterosexual contact.1 Significant advances have been made with advent of antiretroviral therapy (ART); hence, acquired immuno deficiency syndrome due to HIV is now manageable as a chronic disease in patients who have access to medication and who achieve durable viral suppression.2,3 However, metabolic abnormalities, including dyslipidemia, insulin resistance, diabetes, hypertension, and long-term risk factor of coronary heart disease (CHD), have been widely reported.4
Studies have shown that progression of HIV infection is associated with decreases in total cholesterol (TC), high-density lipoprotein (HDL), and low-density lipoprotein (LDL) and an increase in triglycerides, and these effects are reversed by ART.4,5 In addition, patients on ART are exposed to different types of dyslipidemia, which could put them at risk of developing CHD due to fat redistribution and alterations in plasma lipid and lipoprotein concentration.6,7 On the other hand, studies done in sub-Saharan Africa have provided conflicting evidence of any association between ART and increased risk of CHD via lipid elevations and hypertension, while studies that describe changes over time are few.8,9
Traditionally, CHD risk has been associated with diabetes, dyslipidemia, high blood pressure, hypertension, obesity, smoking, sedentary lifestyle, family history, and anthropometric measurements.10 Recent research indicates that inflammatory processes are also involved in the pathogenesis and progression of CHD through endothelial dysfunction and injury.11–13 Proinflammatory cytokines have been associated with progression and severity of HIV infection,14,15 and inflammatory parameters of interleukin-6 and d-dimer have been linked to increased risk of myocardial infarction in HIV patients.16
CHD risk profiles due to HIV or ART may vary in different countries and regions of the world because of different diets, genetics, and lifestyles; hence, extrapolating from one region to another is problematic.17 Studies from developed countries have shown high risk of CHD in HIV patients, irrespective of ART exposure or type of ART, yet sub-Saharan and Zimbabwean longitudinal studies on CHD risk remain few.18 The aim of this longitudinal study was to describe and explain changes in CHD risk markers over a 9-month follow-up period in ART+ and ART– patients based in Harare, Zimbabwe. Results could be of interest, informing clinicians and policy makers about the need to monitor and manage CHD risk in HIV population.
Materials and methods
Ethical considerations
Ethical clearance was given by the Joint Research Ethics Committee, Zimbabwe, Medical Research Council of Zimbabwe and Research Ethics Committee, Norway,19 and the study was carried out according to ethical principles of the Declaration of Helsinki. Patients gave written consent after being informed about the study procedures together with the potential benefits and risks. To ensure confidentiality and privacy, samples and data were assigned numerical identifiers. The research was purely observational, and researchers were not in any way involved in clinical decision making.19 Hence, ART-negative patients were free to start ART over the course of study as recommended by clinicians, while those on ART could switch drugs as and when necessary, according to Zimbabwean guidelines for treatment of HIV patients. To avoid losing useful data, patients with most relevant data were retained and those who had changed ART groups were classified by intention-to-treat approach,19 while statistical methods were selected to minimize type I error due to cautious approach and to allow for the greatest generalizability.20
Study site and study patients
This observational longitudinal prospective cohort study over 9 months was carried out at an urban HIV Treatment Clinic in Harare, Zimbabwe, targeting patients from disadvantaged communities as described at baseline.21 The clinic does not offer routine monitoring of lipids but does periodically monitor body mass index (BMI), blood pressure, CD4 count, and viral load. Study participants were documented HIV-positive patients who had been attending clinic in Harare, and those on ART had been on treatment for an average of 1 month at baseline as described earlier.21 Figure S1 shows the recruitment and follow-up of HIV-infected adult patients. Out of 250 adult patients initially approached at HIV clinic, 215 patients had complete demographic, anthropometric, and lipid profile data, 45 patients were lost to follow-up or died during the period, and finally 170 patients were followed up and included in the study. There was no difference in demographic characteristics of the patients for age, sex, ART exposure, and ART groups, at baseline and follow-up, respectively.
Study variables
Stored serum and plasma samples, collected at recruitment and follow-up, were thawed once at room temperature; serum lipid analysis was carried out on a Mindray® BS 120 (Mindray Medical International, Limited; Shenzhen, China) automated biochemistry analyzer as described in prior reports.19,21 Inflammatory markers (myeloperoxidase [MPO]) and highly sensitive C-reactive protein (hsCRP) were analyzed by manual enzyme linked immunosorbent assay (ELISA) and by an automated Diazyme® machine (Siemens® Healthineers Global, Erlangen, Germany), respectively, as described in their respective baseline reports.22,23 Plasma viral loads were determined using absolute quantification by digital polymerase chain reaction (PCR) methods on a Roche LightCycler® 480 System (Roche Diagnostics, Mannheim, Germany), while plasma CD4 counts were determined by Partec CyFlow® machine (Sysmec Partec Company, Görlitz, Germany) at clinic laboratory on samples collected within 6–9 months of baseline data collection. Nadir CD4 counts were available for a subgroup of patients.
The Framingham risk online calculator was used to estimate the CHD risk of patients at baseline and follow-up. To enable subgroup comparisons, Framingham risk scores were categorized into low, medium, and high as described earlier.20 MPO ≥170 AAU/L was considered for high CHD risk,22 hsCRP cutoff was set at 3 mg/dL,23 age was categorized as <30 years, 30–40 years, 40–50 years, and >50 years (Table 1), and BMI was categorized using World Health Organization (WHO) guidelines as <18.5 kg/m2: underweight, 18.6–24.9 kg/m2: normal and >25 kg/m2: overweight.24 CD4 counts were grouped as <350 cells/mm3, 350–500 cells/mm3 and >500 cells/mm3, <500 cells/mm3, in-line with WHO and Zimbabwean guidelines.25–28 Viral loads were classified as undetectable (for values below the clinic cutoff value of 37 copies/mL), 38–100 copies/mL, 101–500 copies/mL, 501–1,000 copies/mL, and >1,000 copies/mL. HIV patients with HIV RNA <1,000 copies/mL were classified as suppressed, according to WHO guidelines.25,27
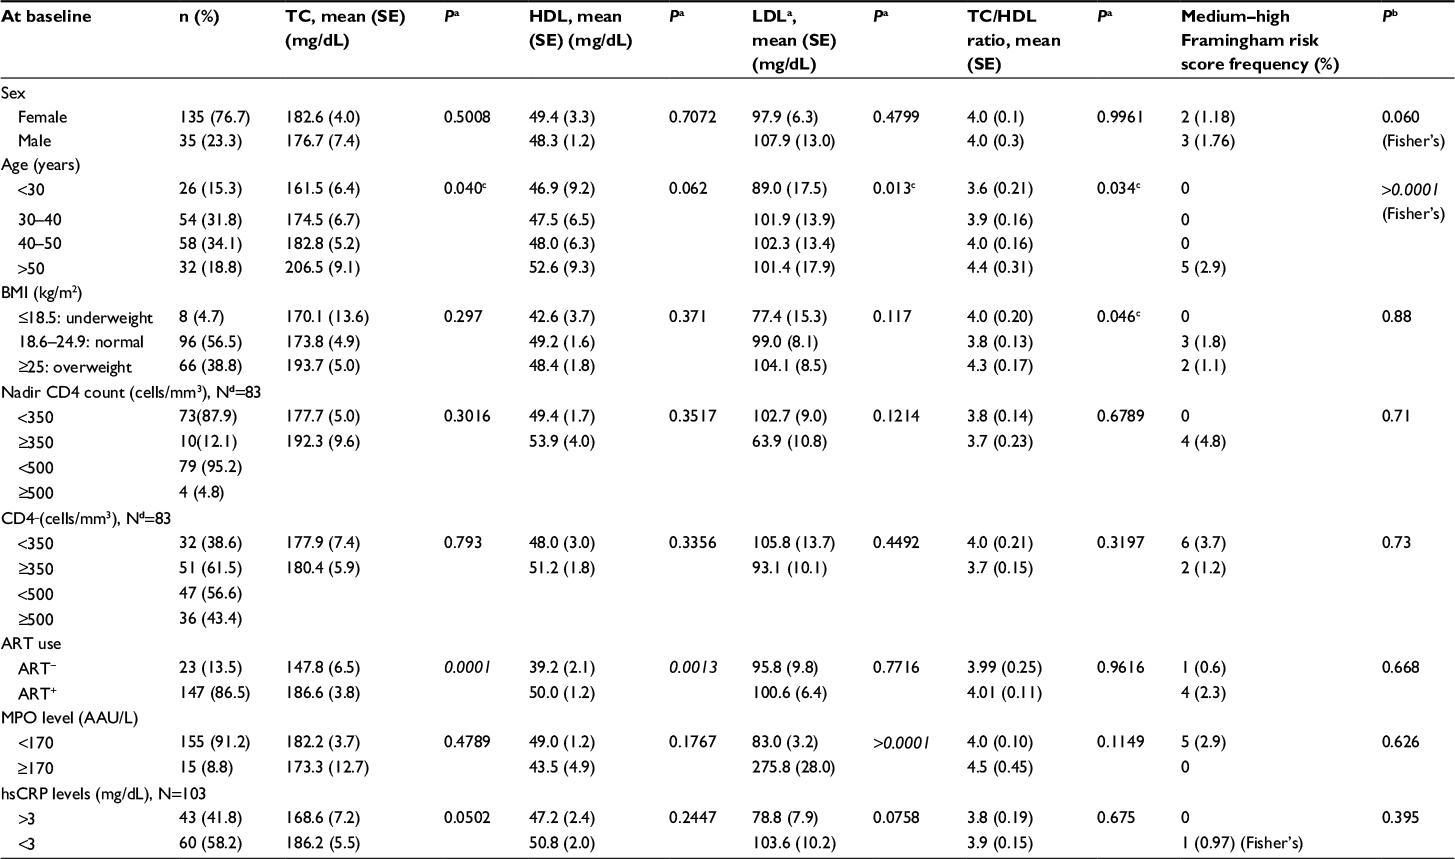 | Table 1 Comparison of demographic biochemical and clinical data of study population at baseline Notes: AAU/L, units of measurement for MPO activity. aFrom one-way ANOVA using Bartlett’s tests for equal variances. bFrom chi-square using Fisher’s exact tests due to low numbers of patients. Data with >2 groups was tested by one-way ANOVA with Bonferroni adjustments for multiple testing. cNot significant after Bonferroni adjustment. dOnly a sub-fraction of patients had this data. Italicized values represent significant P-values <0.05. Abbreviations: ANOVA, analysis of variance; ART, antiretroviral therapy; BMI, body mass index; CD4, cluster of differentiation 4; HDL, high-density lipoprotein; hsCRP, highly sensitive C-reactive protein; LDL, low-density lipoprotein; MPO, myeloperoxidase; SE, standard error; TC, total cholesterol. |
Outcome variables for analysis were lipid levels (TC, HDL, LDL, and TC/HDL ratio), MPO, hsCRP, and Framingham risk scores. Exposure variable was ART experience (comprising ART- and ART+). Outcome variables were tested for independent variables, such as age, sex, monthly earnings, and changes in BMI, systolic blood pressure (SBP), diastolic blood pressure (DBP), duration of HIV diagnosis, duration of ART, viral load at follow-up, and CD4 count.
Data analysis
Data were analyzed using Stata® version 13.0 (StataCorp LP, College Station, TX, USA). Normally, distributed variables were summarized using mean and standard deviation or mean and standard error at 95% confidence interval, while non-Gaussian variables were summarized using median and interquartile ranges. Baseline categorical demographic data were compared using Pearson’s chi-square tests, while continuous data were compared using Student’s t-test for two group means and one-way analysis of variance with Bonferroni adjustments for multiple testing, for data involving three or more groups. Statistical significance was set at two-sided level of P<0.05 for two group comparisons, adjusted to <0.02 for three group comparisons, and <0.01 for four group comparisons.
Baseline and follow-up data were compared using paired Student’s t-tests or paired chi-square tests, as appropriate. However, due to the presence of both between-subject and within-subject effects, statistical analysis for mean difference in baseline and follow-up levels for lipids, MPO, and Framingham risk scores assumed a repeated measures experiment, and data were tested using mixed models for panel data. Mixed-effects modeling comprising pooled, fixed, and random effects was applied, in sequence, to try to explain changes in CHD risk-dependent variables (TC/HDL ratio, Framingham scores, and inflammatory markers) over time. Postestimation tests for the most suitable model for each dependent variable included the Breusch and Pagan Lagrangian multiplier test for random effects and Hausman tests for fixed effects29 from which it was determined that most appropriate model for all dependant variables was generalized least squares random-effects model, hence beta coefficients for that model were adopted as effect sizes for the interpretation of results.
Explanatory variables included age, sex, baseline monthly earnings, BMI, SBP, DBP, duration of HIV diagnosis, duration of ART, log-transformed viral load at follow-up, and CD4 count. Changes in time-variant data (dependent variables, BMI, SDP, DBP, and CD4) were specified in the Stata® commands for reshaping wide data to long data, where the first measurement was baseline data and the second measurement was follow-up data, except for CD4 (where the first value was nadir CD4 and the second value was follow-up measurement).
Results
Cohort comprised 170 HIV patients measured for lipid levels, DBP and SBP, MPO, hsCRP, BMI, CD4 counts, and Framingham CHD risk profiles at least twice, except for viral load, which was measured once, 6–9 months after recruitment (Table 1). There were 215 participants at recruitment (Figure S1) with the mean age of 41±10 years; 145 (78%) of them were female, and 14% of them were ART naïve (Table 2). The attrition rate was 20.9%: five (2.3%) patients died due to acquired immunodeficiency syndrome-defining illnesses, seven (3.2%) patients transferred from the clinic, 24 (11.2%) patients were lost to follow-up at the clinic for unknown reasons, and nine (4.2%) patients had incomplete follow-up data necessary for analysis.19 Finally, 170 HIV positive patients were back to be included at follow-up with the mean age of 40±10 years; 79% were female, and only 6% were ART naïve. There was a notable decline in the proportion of ART-naïve patients from 14% at baseline to 6% at follow-up, P<0.05 (Table 2).
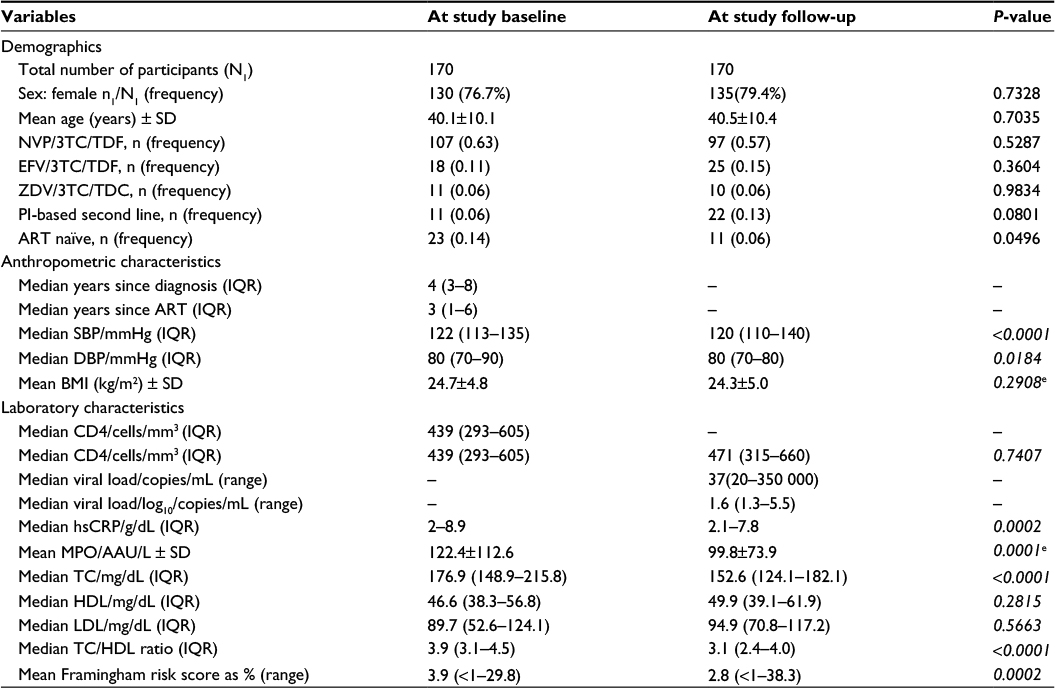 | Table 2 Demographic, anthropometric, laboratory characteristics, and ART combinations at baseline and follow-up Note: All values compared using nonparametric tests for the equality of matched pairs, except for values marked with “e”, which were compared using paired t-tests for matched pairs. Italicized values represent significant P-values <0.05. Abbreviations: ART, antiretroviral therapy; CD4, cluster of differentiation 4; BMI, body mass index; DBP, diastolic blood pressure; EFV/3TC/TDF, efavirenz/lamivudine/tenofovir; HDL, high-density lipoprotein; hsCRP, highly sensitive C-reactive protein; IQR, interquartile range; LDL, low-density lipoprotein; MPO, myeloperoxidase; NVP/3TC/TDF, nevirapine/lamivudine/tenofovir; PI, protease inhibitor; SBP, systolic blood pressure; SD, standard deviation; TC, total cholesterol; ZDV/3TC/TDC, zidovudine/lamivudine/tenofovir. |
Baseline characteristics for all 170 patients followed up are shown in Table 1 and were not stratified by ART exposure due to low numbers of ART-naïve patients at follow-up. Eight (4.7%) patients were underweight, and 66 (38.8%) patients were overweight; 48.8% (n=83) of the followed-up patients had nadir and study baseline CD4 counts: 73 (87.9%) patients had immune suppression measured by nadir CD4 counts <350 cells/mm3, and 32 (38.6%) patients had study baseline CD4 counts <350 cells/mm3, showing CD4 count recovery, as the proportion of patients with CD4 counts above the 2010 WHO threshold increased over time.25 Baseline results for inflammatory markers MPO and hsCRP showed that 91% and 42% of the patients, respectively, had levels within normal ranges, as shown in Table 1.
Of the 45 patients lost to follow-up, 18% (n=8) of patients were ART naïve at baseline, and 82% (n=37) of patients were ART experienced at baseline. Though 123 of the 170 patients had not changed ART at follow-up, 33 (20%) of them had changed drugs at the time of follow-up, and 14 (8%) of the ART-negative patients had started ART. Hence intention-to-treat approach was used to classify patients by ART experience during longitudinal analysis.19
There was no difference between baseline and follow-up cohorts in terms of demographics (Table 2). However, when baseline means or medians were compared with respective follow-up data for DBP, SBP, CD4 count, MPO, hsCRP, TC, TC/HDL ratio, and Framingham risk score, there were significant differences. Most ART+ patients were on nevirapine (NVP)-based first line (63% at baseline and 57% at follow-up), while 11% at baseline and 15% at follow-up were on efavirenz-based first-line ART (Table 2).
Six-month viral load test results were available for 158 patients, 75% of them had undetectable viral loads (either <37 copies/mL or below the lower limit of detection at the clinic), while 80% of them had suppressed viral loads (<1,000 copies/mL). For detailed longitudinal analysis, wide data were converted to long format using Stata®, and data were strongly balanced.27 Summary of panel data demonstrated the presence of marked differences in values of between-patient and within-patient variances in time-variant data. Of note are observations that between-patient and within-patient standard deviations as well as variances differed for TC, HDL, LDL, CD4 count, BMI, hsCRP, MPO, SBP, and DBP.
Patients were subsequently grouped by ART exposure status, and random-effects modeling gave insight into the relationships of risk factors of CHD with various explanatory variables. For example, TC increased by 13.3 mg/dL over 9 months in ART- but decreased by 33.4 mg/dL in ART+, and changes were positively correlated with log10 viral load in the ART naïves and positively correlated with age in ART-experienced patients. HDL increased by 6.9 mg/dL in ART-naïve patients, and increase in HDL was associated with young age, low BMI, and low SBP. There was slight change in HDL in ART-experienced patients, which did not reach statistical significance. LDL did not change significantly over time of study but was positively correlated with male sex in ART-naïve patients and positively correlated with log10 viral load in ART-positive patients. MPO was not correlated with either Framingham risk scores or TC/HDL ratio but was correlated with low BMI in ART-negative patients and with high LDL in ART-experienced patients. Framingham risk scores did not change for ART-naïve group. In ART+ group, an increase in 10-year calculated Framingham risk score was positively associated with age, TC/HDL ratio, and SBP. It is important to note that independent explanatory variables tested for did not fully account for observed changes.
Discussion
Participants of this longitudinal study have been fully discussed elsewhere.19,21 Briefly, at recruitment, most participants (40%) were in the age range 39–49 years, hence the mean age was in the mid-forties with a large standard deviation due to the wide age range (18–68 years). The population had an overrepresentation of females, with 22% males. Retention for further participation was quite high (80%), most likely explained by the high standard of care and regular clinic visits at the HIV clinic, involvement of clinic staff in reminding patients about the value of follow-up, timing of follow-up, and data collection, which was done during routine patient visits.19 There was a decline in the proportion of ART-naïve patients from 14% at baseline to 6% at follow-up, which can be explained by mistiming of clinic visits as ART-naïve patients returned less frequently for visits than the ART-experienced patients.
There was also a low death rate, as only 3% of patients (n=5) demised before 9 months follow-up. Death rate is markedly less than earlier reported from Zimbabwe; a 15% death rate was reported in an earlier study of Zimbabwean patients attending the DART study,30 while a 7.5% death rate was reported from a 5-year cohort study of mother–baby pairs in peri-urban Harare pre-ART.31 This reduction in the number of deaths points to the improvement of care and treatment of HIV-infected patients compared to early days of HIV and ART.32–34 Only 83 patients had both nadir and baseline CD4 counts, 12.1% of the patients had nadir CD4 counts >350 cells/mm3, 61.5% of the patients had baseline CD4 counts >350 cells/mm3, and 69.5% of the patients had desirable CD4 counts >350 cells/mm3 at follow-up. There may be different reasons for changes in CD4 cells. Many patients started ART before 2011 when cutoff for starting ART was 200 cells/mm3, hence only 12% of the patients had nadir CD4 counts >350 cells/mm3 threshold.27 Furthermore, many patients recovered immune function, hence there was significant difference between average nadir CD4 and average CD4 cells at study follow-up (P-value <0.0001). CD4 cell count recovery is important to protect against long-term HIV-induced complications such as cardiovascular disease.35 Of late, WHO recommends that all HIV-positive patients should be treated with ART independent of their CD4 value.27 In agreement with latest WHO guidelines from 2013 for early initiation of ART, Zimbabwe ART guidelines of 201526 project that the percentage of patients with CD4 accounts below 2013 WHO threshold27 for ART, are higher than for 2010 threshold25 for all three time points (nadir, study baseline, and study follow-up), indicating that more patients will require ART in response to those guidelines. Interestingly, in our study, there was no correlation between the CD4 cell count and risk of CHD measured by Framingham risk score.
Approximately 4.7% of the patients in our cohort were underweight (BMI <18.5 kg/m2) and 38.8% were overweight (BMI ≥25.0 kg/m2) (Table 1). Results of the current study contrast with report from Dar es Salaam in Tanzania, in which the proportions of underweight and overweight were 28% and 15%, respectively, at study baseline.36 Reasons for differences are not immediately clear as both cohorts were on first-line ART. The prevalence of BMI ≥25kg/m2 differs in different cohorts.37
In terms of CHD risk, there were both expected and unexpected results; a reduction in TC levels in ART-experienced patients, but increase in TC for the ART-naïve group, over the course of follow-up. In terms of CHD risk, this suggests that even for patients who are not ART experienced, there were some atherogenic changes. On the other hand, HDL increased with time in ART-naïve patients and the increase correlated with reductions in SBP, BMI, and age. The results suggest that in spite of TC increase, there was concomitant HDL recovery, a desirable outcome in ART-naïve patients, which is correlated with low SBP, young age, and low BMI. This may be the evidence that early, improved care of ART– HIV patients could be one way to reduce CHD in our setting, as factors associated with HDL recovery are modifiable by lifestyle changes, hence early intervention might benefit the patients.
TC/HDL ratio, an approximation of CHD risk, showed positive correlations with age, SBP, BMI, and duration of ART in ART-experienced patients. Framingham risk score increased over time in ART-positive patients, and the increase was positively associated with age, SBP, and TC/HDL ratio. Increases in Framingham risk scores suggest an increased risk of CHD in ART+ patients over time. Significant factors positively associated with this increase are, however, modifiable as patients can control weight, blood pressure, and blood lipids through exercise, diet, and smoking cessation.
Negative correlations between Framingham risk scores and high BMI and TC in ART-negative patients were an unexpected outcome and are in contrast to the general population experience. Interestingly, neither HDL nor LDL had any influence on Framingham risk score among the same ART- patient group.
A cross-sectional study from Nigeria37 reports that CHD risk factors such as low HDL, overweight, hypertension, and hypercholesterolemia were high, while the frequency of smoking was low, in agreement with our cohort, but differs from the Data collection on Adverse events of Anti-HIV Drugs (DAD) study and other studies performed in Western countries.38–40 In contrast to our study, the Development of Antiretroviral Therapy (DART) study performed in females and treated with second-line ART (protease inhibitors) for 48 weeks showed persistently high lipid levels.30 An increase in TC has been reported from several previous studies of HIV patients on first-line or second-line ART,7,36,41,42 hence the difference in our study requires further enquiry. In contrast to the current study, increases in HDL have been reported from many reports, and the change is most prominent in patients on NVP-based ART.41,43 A very low proportion of patients (2.5%, n=5) had high overall Framingham risk score >20% at baseline,21 and this low frequency did not change much at follow-up (4.8%, n=7). This result agrees with a report from South Africa,44 but results are lower than those from Ugandan males45 and from developed countries, where ART is much more readily available.46–48 Age, lipids, and high SBP are associated with increasing Framingham risk scores, suggesting that CHD risk and other noncommunicable diseases may become more important in our setting due to an aging HIV population on ART, unless efforts are made to contain modifiable risk factors, such as blood pressure, lipids, and BMI, as suggested by literature.39,49,50 There was no evidence for association between MPO and CHD, though MPO increase was associated with LDL in ART-experienced patients and negatively correlated with BMI in ART-naïve patients, suggesting that inflammation is likely to be elevated in patients with elevated atherogenic LDL. An increase in TC with concomitant increase in HDL levels in ART-naïve patients is encouraging as HDL is protective against CHD.51 Age, BMI, and SBP were negatively associated with an increase in HDL in this group, suggesting that diagnosing patients early and giving patients adequate support including control of weight and blood pressure could protect patients from the development of atherogenic lipids before starting ART.52,53 In ART-experienced patients, there was a decrease in TC, positively correlated with age and duration of ART, with no concomitant change in HDL, suggesting that an aging HIV population on ART is at risk of CHD through poor HDL recovery, and not an increase in TC.51 Zimbabwe, other sub-Saharan African countries, and many developing countries do not involve lipid monitoring in HIV patients on ART in their current standard practices.13 However, it is clear that identification and treatment of lipid abnormalities is important in HIV patients as lipids are modifiable cardiovascular risk factors.13,54,55 It is clear that dyslipidemia in HIV-infected individuals is a complex condition, with multiple contributing factors including the HIV virus itself, individual genetic characteristics, and ART-induced metabolic changes.56,57 Given that longevity on ART has been improved making HIV a chronic manageable disease, there is a need for sub-Saharan country HIV programs to institute laboratory monitoring of lipids for patients.58
No further evidence was provided for any association of changes in MPO and hsCRP with CHD risk measures, though there was an association between MPO and LDL.
This is in contrast to reports from studies that have shown that MPO and hsCRP levels are significantly associated with the occurrence of CHD events among high-risk patients.59–61
Limitations
Attrition reduced power to detect changes in CHD risk profiles, while data on diet and physical activity were not collected. Data on smoking, family history of CHD, and type of ART were not included in the analysis due to low numbers of patients with the outcome of interest.38 The low numbers of smokers were likely due to a large proportion of females in the cohort, but it may also likely to be due to underreporting of undesirable outcomes by participants as female smokers are viewed with disdain in our population. The study population consisted mainly of youth and females, which could have masked the true findings of the study, with regard to CHD risk in our setting. Subanalysis by ART exposure and by type of ART was made difficult by low numbers of ART-naïve patients and patients on efavirenz-, zidovudine-, or protease inhibitor-based therapy compared to those on NVP-based ART (Table 2).
Strengths
Generalized least squares random-effects models are efficient models used to account for both between-subject and within-subject effects in a longitudinal study. As patients had some missing data, random-effects modeling rather than generalized linear modeling was the method of choice for detailed longitudinal analysis, as a way to preserve participants with missing data. At baseline, the participants were carefully randomly selected for participation and regularly monitored for adherence as reported earlier,21 whereas high retention of participants at follow-up was one way to reduce type I error. There was improved information on patients’ health as some baseline and follow-up CD4 cells and viral load values were available, compared to earlier reports,19,21 although some patients did not have this data.
Conclusion
Our main finding is that the risk of future CHD determined by Framingham risk scores is small, but increasing among ART-experienced outpatients at a Zimbabwean HIV treatment clinic, though ART-naïve patients did not show similar increase. There is a need to monitor markers of CHD, such as lipids, together with blood pressure in HIV patients to avoid the convergence of HIV with CHD in an aging HIV population on ART.
Acknowledgments
The authors would like to thank Letten Foundation, Norway, for funding this research; University of Zimbabwe, College of Health of Sciences, Department of Medical Laboratory Sciences’ academic, technical staff and students; Vitaris Kodogo, Tutsirai Hwati, Brian Pakarimwa, Lenon Scotch, Doreen Mhandire; and Tinei Shamu for help with data collection; and Newlands Clinic staff and patients.
Author contributions
All authors were responsible for the following activities: substantial contributions to conception and design, acquisition of data, or analysis and interpretation of data; drafting the article or revising it critically for important intellectual content; final approval of the version to be published; and agreement to be accountable for all aspects of the work in ensuring that questions related to the accuracy or integrity of any part of the work are appropriately investigated and resolved.
Disclosure
The authors report no conflicts of interest in this work.
References
UNAIDS. Every Minute, A Young Woman Is Infected with HIV. Geneva, Switzerland: Joint United Nations Program on HIV/AIDS (UNAIDS); 2012. | ||
The Henry J Kaiser Family Foundation [webpage on the Internet]. The Global HIV/AIDS Epidemic. Available from: http://kff.org/global-health-policy/fact-sheet. Accessed August 15, 2015. | ||
Palella FJ Jr, Delaney KM, Moorman AC, et al. Declining morbidity and mortality among patients with advanced human immunodeficiency virus infection. HIV Outpatient Study Investigators. N Engl J Med. 1998;338(13):853–860. | ||
Feeney ER, Mallon PW. HIV and HAART-associated dyslipidemia. Open Cardiovasc Med J. 2011;5:49–63. | ||
Bekolo CE, Nguena MP, Ewane L, Bekoule PS, Kollo B. The lipid profile of HIV-infected patients receiving antiretroviral therapy in a rural Cameroonian population. BMC Public Health. 2014;14:236. | ||
Friis-Møller N, Weber R, Reiss P, et al; DAD Study Group. Cardiovascular disease risk factors in HIV patients – association with antiretroviral therapy. Results from the DAD study. AIDS. 2003;17(8):1179–1193. | ||
Riddler SA, Smit E, Cole SR, et al. Impact of HIV infection and HAART on serum lipids in men. JAMA. 2003;289(22):2978–2982. | ||
Daniyam CA, Iroezindu MO. Lipid profile of anti-retroviral treatment-naïve HIV-infected patients in Jos, Nigeria. Ann Med Health Sci Res. 2013;3(1):26–30. | ||
Manuthu EM, Joshi MD, Lule GN, Karari E. Prevalence of dyslipidemia and dysglycaemia in HIV infected patients. East Afr Med J. 2008;85(1):10–17. | ||
National Cholesterol Education Program (NCEP) Expert Panel on Detection, Evaluation, and Treatment of High Blood Cholesterol in Adults (Adult Treatment Panel III). Third report of the National Cholesterol Education Program (NCEP) expert panel on detection, evaluation, and treatment of high blood cholesterol in adults (Adult Treatment Panel III) final report. Circulation. 2002;106:3143–3421. | ||
Bash LD, Erlinger TP, Coresh J, Marsh-Manzi J, Folsom AR, Astor BC. Inflammation, homeostasis, and the risk of kidney function decline. Am J Kidney Dis. 2009;53:596–605. | ||
Pai JK, Pischon T, Ma J, et al. Inflammatory markers and the risk of coronary heart disease in men and women. N Engl J Med. 2004;351(25):2599–2610. | ||
Fisher SD, Miller TL, Lipshultz SE. Impact of HIV and highly active antiretroviral therapy on leukocyte adhesion molecules, arterial inflammation, dyslipidemia and atherosclerosis. Atherosclerosis. 2006;185(1):1–11. | ||
Maggi P, Maserati R, Antonelli G. Atherosclerosis in HIV patients: a new face for an old disease? AIDS Rev. 2006;8(4):204–209. | ||
Lafeuillade A, Poizot-Martin I, Quilichini R, et al. Increased interleukin-6 production is associated with disease progression in HIV infection. AIDS. 1991;5:1139–1140. | ||
de Gaetano, Donati K, Rabagliati R, Iacoviello L, Cauda R. HIV infection, HAART, and endothelial adhesion molecules: current perspectives. Lancet Infect Dis. 2004;4(4):213–222. | ||
Gaziano TA, Bitton A, Anand S, Gessel SA, Murphy A. Growing epidemic of coronary heart disease in low- and middle income countries. Curr Probl Cardiol. 2010;35(2):72–115. | ||
Mbewu A, Mbanya J-C. In: Jamison DT, Feachem RG, Makgoba MW, editors. Disease and Mortality in Sub-Saharan Africa. 2nd ed. Cardiovascular Disease. Washington, DC: World Bank; 2006. | ||
Zhou DT, Nehumba D, Oktedalen O, et al. Changes in lipid profiles of HIV+ adults over 9 months at a Harare HIV clinic: a longitudinal study. Biochem Res Int. 2016;2016:7. Article ID 3204818. | ||
Gupta SK. Intention-to-treat concept: a review. Perspect Clin Res. 2011;2(3):109–112. | ||
Zhou DT, Kodogo V, Chokuona KFV, Gomo E, Oktedalen O, Stray-Pedersen B. Dyslipidaemia and cardiovascular disease risk profiles of patients attending an HIV treatment clinic in Harare, Zimbabwe. HIV/AIDS Res Palliative Care. 2015;7:145–155. | ||
Zhou DT, Mandishona A, Oektadalen O, Gomo ZA, Stray-Pedersen B. Levels of anti-myeloperoxidase antibodies in HIV positive patients at an HIV clinic in Harare, Zimbabwe. J Med Dental Sci Res. 2015;2(6):01–07. | ||
Zhou DT, Kodogo V, Dzafitita M, Øktedalen O, Muswe R, Stray-Pedersen B. Lipids and hsCRP as markers of coronary heart disease risk in HIV infected adults. IJSTR. 2015;4(8):252–257. | ||
World Health Organization [webpage on the Internet]. International Classification of adult underweight, overweight and obesity according to BMI; 2006 [updated 2015]. Available from: http://apps.who.int/bmi/index.jsp?introPage=intro_3.html. Accessed August 31, 2016. | ||
World Health Organization [webpage on the Internet]. Antiretroviral therapy for HIV infection in adults and adolescents, Recommendations for a public health approach: 2010 revision. Available from: http://apps.who.int/iris/bitstream/10665/44379/1/9789241599764_eng.pdf. Accessed August 31, 2016. | ||
Guidelines for Antiretroviral Therapy for the Prevention and Treatment of HIV in Zimbabwe National Medicine and Therapeutics Policy Advisory Committee (NMTPAC) and The AIDS and TB Directorate, Ministry of Health and Child Care; 2013. Available from: http://www.nac.org.zw/sites/default/files/2013%20Zimbabwe%20ARV%20Guidelines%20%20Main%20Document%20(1).pdf. Accessed 31 August, 2016. | ||
World Health Organization [webpage on the Internet]. Consolidated guidelines on the use of antiretroviral drugs for treating and preventing HIV infection recommendations for a public health approach; 2013. Available from: http://apps.who.int/iris/bitstream/10665/85321/1/9789241505727_eng.pdf. Accessed August 31, 2016. | ||
AIDS info [webpage on the Internet]. Guidelines for the Use of Antiretroviral Agents in HIV-1-Infected Adults and Adolescents; Management of the Treatment-Experienced Patient (Virologic Failure). Available from: https://aidsinfo.nih.gov/guidelines/html/1/adult-and-adolescent-arv-guidelines/15/virologic-failure-and-suboptimal-immunologic-response. Accessed August 31, 2016. | ||
Torres-Reyna O [webpage on the Internet]. Panel Data Analysis Fixed and Random Effects using Stata (v. 4.2), Princeton University Data and Statistical Services. Available from: http://www.princeton.edu/~otorres/Panel101.pdf. Accessed August 31, 2016. | ||
Gomo ZAR, Hakim JG, Walker SA, et al; for the DART Team. Impact of second-line antiretroviral regimens on lipid profiles in an African setting: the DART trial sub-study. AIDS Res Ther. 2014;11(1):32. | ||
Kurewa EN, Kandawasvika GQ, Mhlanga F, et al. Realities and challenges of a five year follow up of mother and child pairs on a PMTCT program in Zimbabwe. Open AIDS J. 2011;5:51–58. | ||
Reniers G, Slaymaker E, Nakiyingi-Miiro J, et al. Mortality trends in the era of antiretroviral therapy: evidence from the network for analysing longitudinal population based HIV/AIDS data on Africa (ALPHA) on behalf of the ALPHA Network. AIDS. 2014;28(4):S533–S542. | ||
May MT, Gompels M, Delpech V, et al; UK Collaborative HIV Cohort (UK CHIC) Study. Impact on life expectancy of HIV-1 positive individuals of CD4+ cell count and viral load response to antiretroviral therapy. AIDS. 2014;28(8):1193–1202. | ||
Lawna SD, Harries AD, Anglarete X, Myerg L, Wood R. Early mortality among adults accessing antiretroviral treatment programmes in sub-Saharan Africa. AIDS J. 2008;22(15):1897–1908. | ||
Gengis EH, Deeks SG. CD4+ T cell recovery with antiretroviral therapy: more than the sum of the parts. Clin Infect Dis. 2009;48(3):362–364. | ||
Liu E, Armstrong C, Spiegelman D, et al. First-line antiretroviral therapy and changes in lipid levels over 3 years among HIV-infected adults in Tanzania. Clin Infect Dis. 2013;56(12):1820–1828. | ||
Edward AO, Oladayo AA, Omolola AS, Adetiloye AA, Adedayo PA. Prevalence of traditional cardiovascular risk factors and evaluation of cardiovascular risk using three risk equations in Nigerians living with human immunodeficiency virus. North Am J Med Sci. 2013;5(12):680–688. | ||
Walker ARP, Sareli P. Coronary heart disease: outlook for Africa. J R Soc Med. 1997;90(1):23–27. | ||
Anastos K, Ndamage F, Lu D, et al. Lipoprotein levels and cardiovascular risk in HIV-infected and uninfected Rwandan women. AIDS Res Ther. 2010;7:34. | ||
Friis-Moller N, Thiébaut R, Reiss P, et al; DAD Study Group. Predicting the risk of cardiovascular disease in HIV-infected patients: the data collection on adverse effects of anti-HIV drugs study. Eur J Cardiovasc Prev Rehabil. 2010;17(5):491–501. | ||
Kakinami L, Adams MJ, Block RC, Cohn SE, Maliakkal B, Fisher SG. Short communication: risk of elevated total cholesterol/high-density lipoprotein cholesterol ratio after antiretroviral therapy in HIV/hepatitis C virus patients. AIDS Res Hum Retroviruses. 2012;28(12):1552–1556. | ||
Hejazi N, Rajikan R, Choong CLK, Sahar S. Metabolic abnormalities in adult HIV infected population on antiretroviral medication in Malaysia: a cross-sectional survey. BMC Public Health. 2013;13:758. | ||
van Leth F, Phanuphak P, Stroes E, et al. Nevirapine and efavirenz elicit different changes in lipid profiles in antiretroviral-therapy-naïve patients infected with HIV-1. PLoS Med. 2004;1(1):e19. | ||
Mashinya F, Alberts M, Van Geertruyden J-P, Colebunders R. Assessment of cardiovascular risk factors in people with HIV infection treated with ART in rural South Africa: a cross sectional study. AIDS Res Ther. 2015;12:42. | ||
Mateena FJ, Kanters S, Kalyesubula R, et al. Hypertension prevalence and Framingham risk score stratification in a large HIV-positive cohort in Uganda. J Hypertens. 2013;31(7):1372–1378. | ||
Hadigan C, Meigs JB, Wilson PWF, et al. Prediction of coronary heart disease risk in HIV-infected patients with fat redistribution clinical infectious diseases. Clin Infect Dis. 2003;36:909–916. | ||
Knobel H, Jericó C, Montero M, et al. Global cardiovascular risk in patients with HIV infection: concordance and differences in estimates according to three risk equations (Framingham, SCORE, and PROCAM). AIDS Patient Care STDS. 2007;21(7):452–457. | ||
Law MG, Friis-Moller N, El-Sadr WM, et al; D:A:D Study Group. The use of the Framingham equation to predict myocardial infarctions in HIV-infected patients: comparison with observed events in the D:A:D Study. HIV Med. 2006;7(4):218–230. | ||
Temu TM, Kirui N, Wanjalla C, et al. Cardiovascular health knowledge and preventive practices in people living with HIV in Kenya. BMC Infect Dis. 2015;15:421. | ||
Bloomfield GS, Hogan JW, Keter A, et al. Hypertension and obesity as cardiovascular risk factors among HIV seropositive patients in Western Kenya. PLoS One. 2011;6(7):e22288. | ||
Natarajan P, Ray KK, Cannon CP. High-density lipoprotein and coronary heart disease current and future therapies. J Am Coll Cardiol. 2010;55(13):1283–1299. | ||
Lloyd-Sherlock P, Ebrahim S, Grosskurth H. Is hypertension the new HIV epidemic? Int J Epidemiol. 2014;43(1):8–10. | ||
Armstrong C, Liu E, Grinspoon S, et al. Dyslipidemia in an HIV-positive, antiretroviral treatment-naïve population in Dar es Salaam, Tanzania. J Acquir Immune Defic Syndr. 2011;57(2):141–145. | ||
Stein JH, Hadigan CM, Brown TT, et al. Prevention strategies for cardiovascular disease in HIV-infected patients. Circulation. 2008;118:e54–e60. | ||
Aberg JA. Lipid management in patients who have HIV and are receiving HIV therapy. Endocrinol Metab Clin North Am. 2009;38(1):207–222. | ||
Grinspoon S, Carr A. Cardiovascular risk and body-fat abnormalities in HIV-infected adults. N Engl J Med. 2005;352:48–62. | ||
Lo J. Dyslipidemia and lipid management in HIV-infected patients. Curr Opin Endocrinol Diabetes Obes. 2011;18(2):144–147. | ||
Malvestutto CD, Aberg JA. Management of dyslipidemia in HIV-infected patients. Clin Lipidol. 2011;6(4):447–462. | ||
Song P, Xu J, Song Y, Jiang S, Yuan H, Zhang X. Association of plasma myeloperoxidase level with risk of coronary artery disease in patients with type 2 diabetes. Dis Markers. 2015;2015:761939. | ||
Baldus S, Heeschen C, Meinertz T, et al; CAPTURE Investigators. Myeloperoxidase serum levels predict risk in patients with acute coronary syndromes. Circulation. 2003;108(12):1440–1445. | ||
Pfützner A, Forst T. High-sensitivity C-reactive protein as cardiovascular risk marker in patients with diabetes mellitus. Diabetes Technol Ther. 2006;8(1):28–36. |
Supplementary material
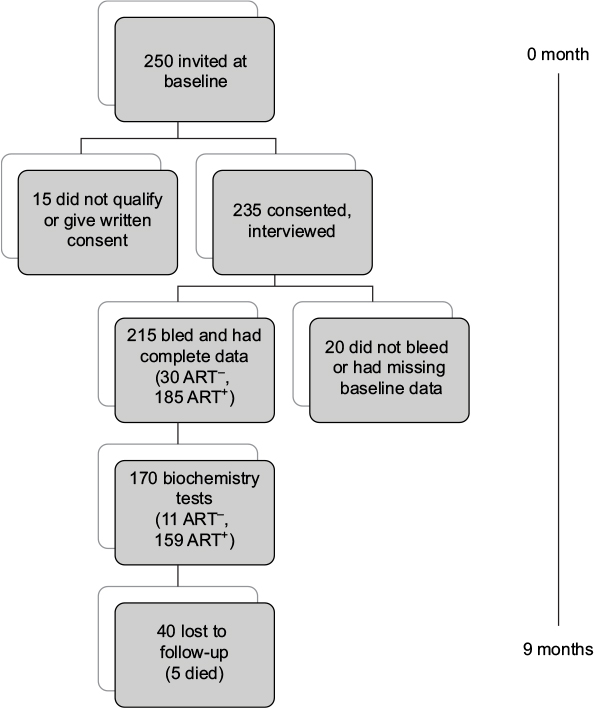 | Figure S1 Flowchart of recruitment and subsequent activities. Abbreviation: ART, antiretroviral therapy. |
 © 2016 The Author(s). This work is published and licensed by Dove Medical Press Limited. The full terms of this license are available at https://www.dovepress.com/terms.php and incorporate the Creative Commons Attribution - Non Commercial (unported, v3.0) License.
By accessing the work you hereby accept the Terms. Non-commercial uses of the work are permitted without any further permission from Dove Medical Press Limited, provided the work is properly attributed. For permission for commercial use of this work, please see paragraphs 4.2 and 5 of our Terms.
© 2016 The Author(s). This work is published and licensed by Dove Medical Press Limited. The full terms of this license are available at https://www.dovepress.com/terms.php and incorporate the Creative Commons Attribution - Non Commercial (unported, v3.0) License.
By accessing the work you hereby accept the Terms. Non-commercial uses of the work are permitted without any further permission from Dove Medical Press Limited, provided the work is properly attributed. For permission for commercial use of this work, please see paragraphs 4.2 and 5 of our Terms.