")
Back to Journals » Diabetes, Metabolic Syndrome and Obesity » Volume 13
Changes in Body Composition and FTO Whole Blood DNA Methylation Among Japanese Women: A Randomized Clinical Trial of Weight-Loss Program
Authors Nishida H, Onishi K, Kurose S, Tsutsumi H, Miyauchi T, Takao N, Yoshiuchi S, Fujii A, Kimura Y
Received 9 February 2020
Accepted for publication 27 May 2020
Published 23 June 2020 Volume 2020:13 Pages 2157—2167
DOI https://doi.org/10.2147/DMSO.S248769
Checked for plagiarism Yes
Review by Single anonymous peer review
Peer reviewer comments 3
Editor who approved publication: Prof. Dr. Muthuswamy Balasubramanyam
Haruhiko Nishida,1 Katsuko Onishi,1 Satoshi Kurose,1 Hiromi Tsutsumi,1 Takumi Miyauchi,2 Nana Takao,2 Sawako Yoshiuchi,2 Aya Fujii,2 Yutaka Kimura1,2
1Department of Health Science, Kansai Medical University, Osaka, Japan; 2Health Science Center, Kansai Medical University, Osaka, Japan
Correspondence: Haruhiko Nishida
Department of Health Science, Kansai Medical University, 2-5-1 Shinmachi, Hirakata, Osaka 573-1010, Japan
Tel +81 72 804 2334
Fax +81 72 804 2548
Email [email protected]
Objective: DNA methylation is an epigenetic mechanism that regulates gene expression. The obesity-related (FTO) gene is the first gene found to be associated with fat mass and obesity. However, no studies have examined the relationship between weight-loss intervention effect and FTO methylation in obese individuals with whole blood DNA. The purpose of this study was to quantify FTO whole blood DNA methylation and investigate the relationship between body composition, exercise capacity, and blood parameters with a 6-month weight-loss program intervention.
Participants and Methods: Eighteen female participants (mean age, 50.6 ± 12.1 years, body mass index (BMI), 33.5 ± 6.2 kg/m2) who completed a 6-month weight-loss program at the obesity outpatient department at the Health Science Center of Kansai Medical University Hospital from March 2017 to October 2018 were included in the analysis. Participants were randomized into a normal treatment group (NTG) and a group with additional resistance training (RTG). Body composition, exercise tolerance and metabolic index were measured in each participant. DNA methylation status in whole blood samples was determined using pyrosequencing. All measurements were taken during the first visit and at the 6-month post-intervention visit.
Results: The methylation rate was significantly decreased in the NTG in CpG1 (p=0.011) and total value of CpG (p=0.011), whereas in the treatment group containing resistance training (RTG), CpG3 (p=0.038) was increased significantly. Furthermore, the independent factors that determine %CpG3 of RTG were visceral fat area change rate (%VFA) (β = − 0.568, P = 0.007, R2 = 0.527) and resistance training (β = 0.517, P = 0.012, R2 = 0.527), which have been extracted.
Conclusion: A 6-month weight-loss program, including resistance training, may be associated with decreased visceral fat area changes and increased RTG CpG3 methylation changes. However, further replication studies with larger sample sizes are warranted to verify the findings of this study.
Keywords: epigenetics, obesity, body composition, resistance training
Plain Language Summary
Obesity is a multifactorial disease that includes both genetic and environmental factors and varies among individuals. Thus, the response to weight-loss programs is greatly influenced by individual differences and is not well understood. The fat mass and obesity-related (FTO) gene was the first gene found to be associated with body fat and obesity. Promoting FTO causes DNA decreased methylation, which leads to increased fat mass due to overeating. Conversely, increased DNA represses the FTO gene. However, the effects of weight-loss intervention programs on obesity in FTO DNA methylation and the relationship between body composition, metabolic index and physical fitness index are unknown. As a new index for assessing weight loss, we extracted DNA from blood to quantify FTO methylation and investigated the relationship between body composition and physical parameters. Eighteen women who completed a 6-month weight-loss program at the Obesity Outpatient Center at the Kansai Medical University Hospital Health Sciences Center were randomly divided into two groups: a normal treatment group (NTG) and a resistance training + treatment group (RTG). Only RTG increased the methylation rate of cytosine guanine dinucleotide 3 site (CpG3 site). Furthermore, there was a significant association between a decrease in the visceral fat area change rate and an increase in the CpG3 site methylation change rate. Therefore, the 6-month weight-loss program including resistance training may be associated with a decrease in visceral fat area change rate and an increase in CpG3 methylation change rate.
Introduction
The number of cases of type 2 diabetes (T2D), an obesity-related disease, is expected to increase to 593 million by 2035, and thus the increase in the proportion of people with obesity worldwide represents a global health problem.1 Health disorders caused by obesity range from T2D, dyslipidemia, hypertension, and hyperuricemia to coronary artery disease, cerebral infarction, sleep apnea syndrome, osteoarthritis, and kidney disease.2,3 Elimination/prevention of obesity is vital for reducing the incidence of such lifestyle-related diseases, for which dietary intervention and exercise therapy have been reported.4–6 However, the response to weight-loss programs is greatly affected by individual differences, which are not well-understood.
In 2007, the fat mass and obesity-associated (FTO) gene, a genetic factor indicative of the susceptibility to obesity, was identified.7 FTO is associated with overeating, body fat mass, and obesity, with the strongest correlation observed with body mass index (BMI).8,9 Polymorphic risk allele homozygotes have been shown to have a 1.67-fold higher risk of developing obesity than those without these alleles.10 Studies also showed that physical activity can reduce the genetic risk of obesity by 30–40%.11,12 However, genetic polymorphisms are not thought to play an important role in obesity.13
Obesity is a multifactorial disease involving both genetic and environmental factors which vary between individuals.14 As a molecular mechanism that mediates the interactions of these factors, studies have focused on epigenetics as the gene expression control mechanism.15–17 Epigenetics regulates gene function without affecting the genomic sequence. This reversible phenomenon is controlled primarily by DNA methylation, histone modifications, and miRNAs.18 The most prominent feature of epigenetics is that it is affected by environmental factors and can be modified by intervention.19 Typically, increased methylation suppresses gene expression, whereas decreased methylation promotes gene expression.15–20 Epigenetics is also tissue-specific; tissue types associated with obesity-related gene expression include the hypothalamus, liver, and adipose tissue.21,22 However, in the case of FTO, it is difficult to obtain DNA from the arcuate nucleus of the pituitary gland, which shows the highest expression level of this gene. There are a few reports of subcutaneous fat biopsies,23 but adipose tissue shows a high degree of cell-type heterogeneity, and changes in cell composition during weight loss can affect DNA methylation levels.24 However, it was recently verified that DNA methylation can be analyzed in the blood rather than in tissues.22,24–28 Thus, DNA was extracted and analyzed from the blood, which is easily accessible, to evaluate the clinical situation of participants before and after an intervention treatment for obesity. We extracted DNA from blood samples and analyzed CpG at the nucleotide sequence position five prime untranslated region (5ʹUTR) (53704013–53704036) downstream of the promoter region of the FTO gene on chromosome 16.
The purpose of this study was to quantify FTO whole blood DNA methylation and to investigate its relationship with Body composition, Exercise capacity, and Blood parameters of a 6-month weight-loss program intervention.
Participants and Methods
Study Participants
A total of 112 obese individuals attending the outpatient department at the Health Science Center of Kansai Medical University Hospital from March 2017 to October 2018 were included in the study. Individuals who consumed antidiabetic drugs or had secondary obesity, heart disease, cerebrovascular disease, other uncontrolled metabolic diseases, and orthopedic diseases that did not allow for exercise were excluded from the study. Women with a BMI of ≥25 kg/m2 were selected after providing written informed consent for participation in the study and were evaluated by a doctor for exercise. Subjects were randomized to the NTG or RTG at the first visit. This study was conducted with the approval of the Kansai Medical University Ethics Committee (approval number: 2016708).
NTG and RTG Program
Subjects in the NTG exercised twice per month under the supervision of an exercise leader for six months. These activities consisted of 30 min of aerobic exercise (bicycle ergometer or treadmill) and full-body stretching.29,30 In addition, subjects exercised at home at the same level as in the supervised program, aiming for three sessions per week (150–180 min/week). Once per month, nutritionists provided education on dietary behavior, and psychologists provided counseling on cognitive behavioral therapy based on self-monitoring and self-efficacy.31
In RTG, the normal training program included additional weight-bearing RT. Additional RTs were typically performed on the trunk and limb muscle groups (calf, squat, leg lift, trunk curl, knee lift, backcross, front bridge, back bridge, and twist). The protocol consisted of 2–4 events per day and 10–15 repetitions for two sets, with the exercises changed every month. The exercise frequency was more than 5 days per week, and exercise intensity was set at 11–13 using the Borg scale. The break between the event and the set was 30s. Once per month, the instructor provided individual guidance and ran the program at home. The exercise was recorded in the Weight Loss Achievement File, and guidance was provided on added or changed events after the instructor reviewed the rate of implementation during individual guidance. The “weight loss achievement file” provided to the subjects consisted of a description of the effects of weight-bearing RT, daily exercise program, and achievement record.
Body Composition
The height was measured in 0.1mm units using a height gauge, and the body weight was measured in 0.1g units using a body fat measuring device (DC-430A pole type, Nippon Tanita, Tokyo, Japan). The formula used to calculate BMI was weight (kg)/[height (m)]2. Body composition was determined using dual energy X-ray absorption (DPX-NT, GE Healthcare, Buckinghamshire, UK) and analyzed for fat mass (ratio), lean body mass, and skeletal muscle mass. Computed tomography (CT; GE Healthcare) and fat scan analysis software (East Japan Technology Tokyo Laboratory, Tokyo, Japan) for umbilical level visceral fat area (VFA) and subcutaneous fat area (SFA) were calculated. The measurements were taken during the first visit and at the 6-month post-intervention visit.31
Calorie Intake
In the dietary survey, a nutritionist calculated the caloric intake of staple foods, caloric intake of snacks, and total caloric intake by the one-week recall method. The survey was conducted at the time of the first visit and at the time of the visit after 6 months of intervention.31
Lower Limb Muscle Strength
Lower extremity muscle strength was measured twice using Strength Ergo (Mitsubishi Electric Corporation, Tokyo, Japan), based on uniform rotating leg strength. The maximum value was recorded and the weight (Nm/kg) correction value was used. The measurements were taken at the first visit and at the 6-month post-intervention visit.31
Cardiopulmonary Exercise Test
A cardiopulmonary exercise test (232C-XL; Combi Inc., Tokyo, Japan) was conducted to determine exercise tolerance. Scoring included 4 points of rest, 4 minutes of warm-up, and approximately 10 minutes of running under ramp load. Respiratory gas analysis was performed using the AE-300 system (Minato Medical Science, Osaka, Japan). Anaerobic threshold (AT) was determined using the V-gradient method. Peak maximum oxygen uptake (VO2) was defined as the maximum load at which AT and VO2 were recorded. The measurements were taken at the first visit and at the 6-month post-intervention visit.31
Hematological Parameters
Blood samples were obtained from the anterior cubital vein early morning prior to any food or drink consumption. Following centrifugation (at 25° C, 3000 rpm for 5 minutes), LDL-C (mmol/L) was measured using surfactant-based homogeneous assay, while HDL-C (mmol/L) was measured using peroxidase method, and TG (mmol/L) was measured using glycerol-3-phosphate oxidase (GPO) and peroxidase (POD) methods.
Plasma glucose (whole blood measurement) was measured by an amperometry method (Fully automatic glucose measuring device GA1170, GA1172, Arkray Japan) using a GOD-immobilized enzyme membrane and a hydrogen peroxide electrode. The homeostatic model assessment of insulin resistance (HOMA-IR) was used as an indicator of insulin resistance and was derived from fasting blood insulin (immunoreactive insulin) levels and early morning fasting blood glucose levels. The formula used was HOMA-IR = (immunoreactive insulin x fasting blood glucose)/405.31 Genomic DNA was extracted from whole blood using the QIAamp DNA Blood Mini Kit (Qiagen, Hilden, Germany) according to manufacturer’s instructions. Blood was taken before and after the intervention.25,26
DNA Methylation Using Pyrosequencing
All target samples were analyzed before and after PyroSequence (PyroMark Q24 D; Qiagen) intervention.25,26,32-35 PCR and sequencing primers were designed using PyroMark Assay Design 2.0 software (Qiagen), according to the recommended protocols. The primer sequences were designed by the primer design program “PSQ Assay” (Biotage, Uppsala, Sweden), using the gene sequences obtained from the NCBI GenBank entry. The primers were designed using a five prime untranslated region (5ʹUTR) near the transcription start site of the gene and in a region without single nucleotide polymorphisms downstream of the promoter region.25,26,36 The FTO primers were designed on chromosome 16: 53704013–53704036. Table 1 shows the primer information and a summary of specific CpG positions. Bisulfite conversion of 200 ng of genomic DNA was performed using the EpiTect kit (Qiagen). The bisulfite-converted DNA was amplified by polymerase chain reaction (PCR) using the PyroMark® PCR Master Mix Kit (Qiagen) with a reverse primer biotinylated at the 5ʹend. Biotinylated PCR products were immobilized on streptavidin-coated beads (GE Healthcare) and DNA strands were separated using denaturing buffer. After washing and neutralizing on a PyroMark Q24 vacuum workstation, the PyroMark Q24 system (Qiagen) was used to analyze the sequencing primers for high-quantity bisulfite pyrosequencing. Using the Genome Reference Consortium Human Build 38/hg38, we identified a CpG at the nucleotide sequence position 5ʹUTR (53704013–53704036) downstream of the promoter region of the FTO gene on chromosome 16.
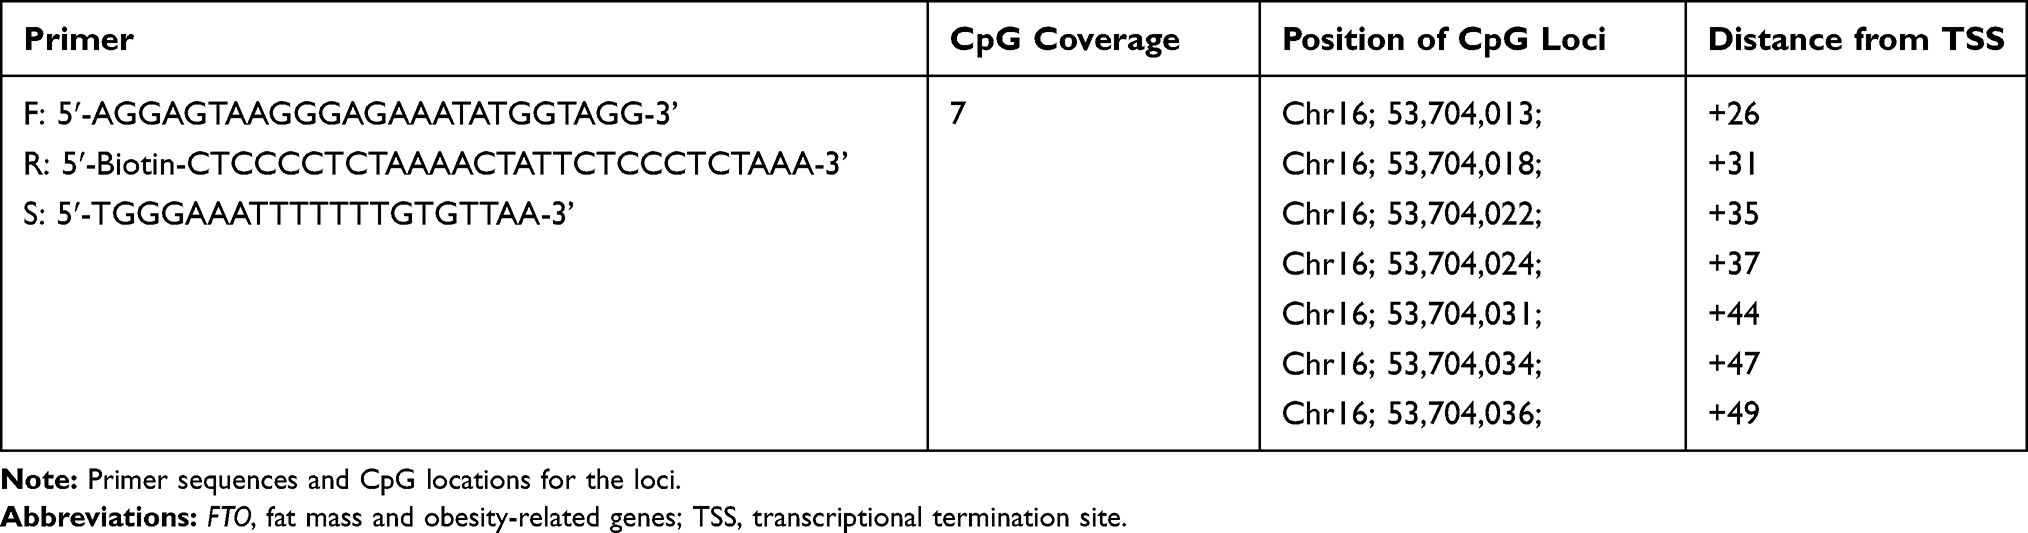 |
Table 1 Primer and FTO Infomation |
Statistical Analysis
Clinical data were expressed as mean ± standard deviation or median (25–75% quartile). Normality was confirmed using the Shapiro–Wilk test. Parametric tests (paired t-test, independent sample t-test, Pearson’s correlation coefficient) were used for the values showing the normal distribution. Nonparametric tests (Wilcoxon signed rank test, Mann Whitney U-test, Spearman rank correlation coefficient) were used for non-normal numbers. The methylation change rate (%CpG) was calculated from the data before and after the intervention (Table 2). In stepwise multiple regression analysis, the methylation change rate (%CpG) that was significant before and after the inter-group intervention was the dependent variable, and a factor having a significant correlation with each methylation change rate (%CpG) was used as an independent variable, while age and the presence or absence of resistance training were analyzed as adjustment factors (Table 3, Table 4). The statistical software used was SPSS Statistics Grad Pack ver 26 for Windows (SPSS, Inc. Chicago, Illinois, USA) and the significance level was set to less than 5%.
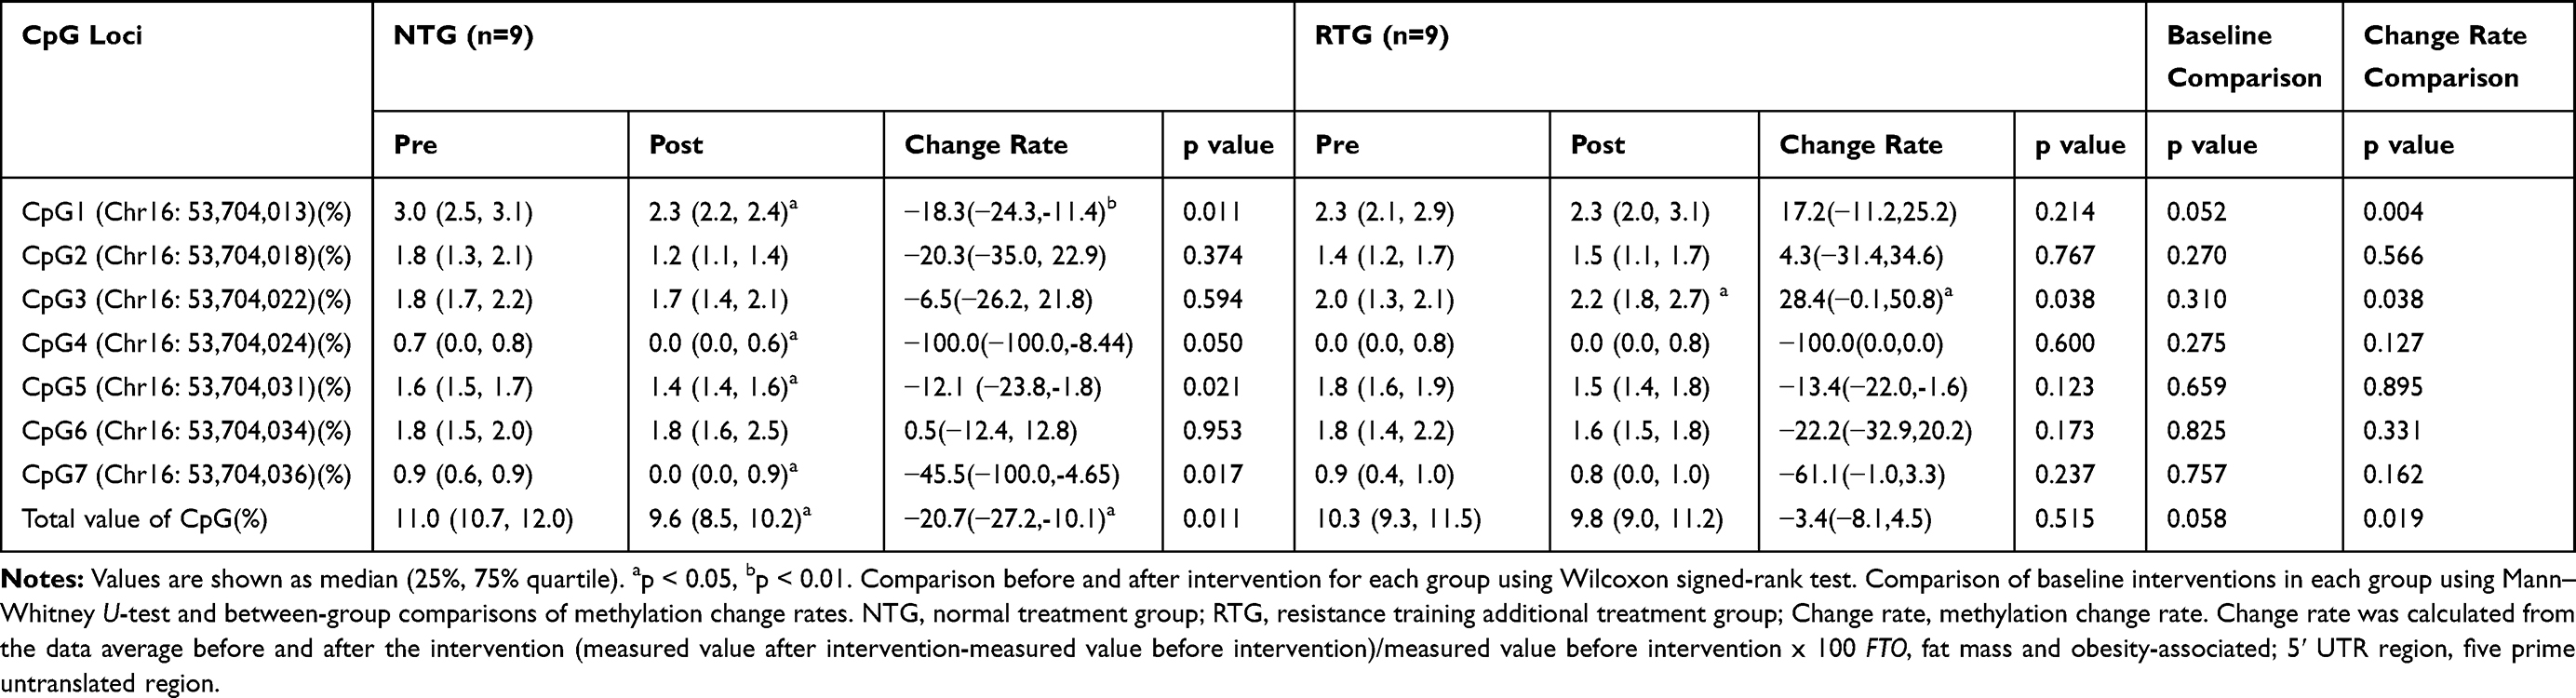 |
Table 2 Methylation Rate and Methylation Change Rate of the FTO 5ʹ UTR Region |
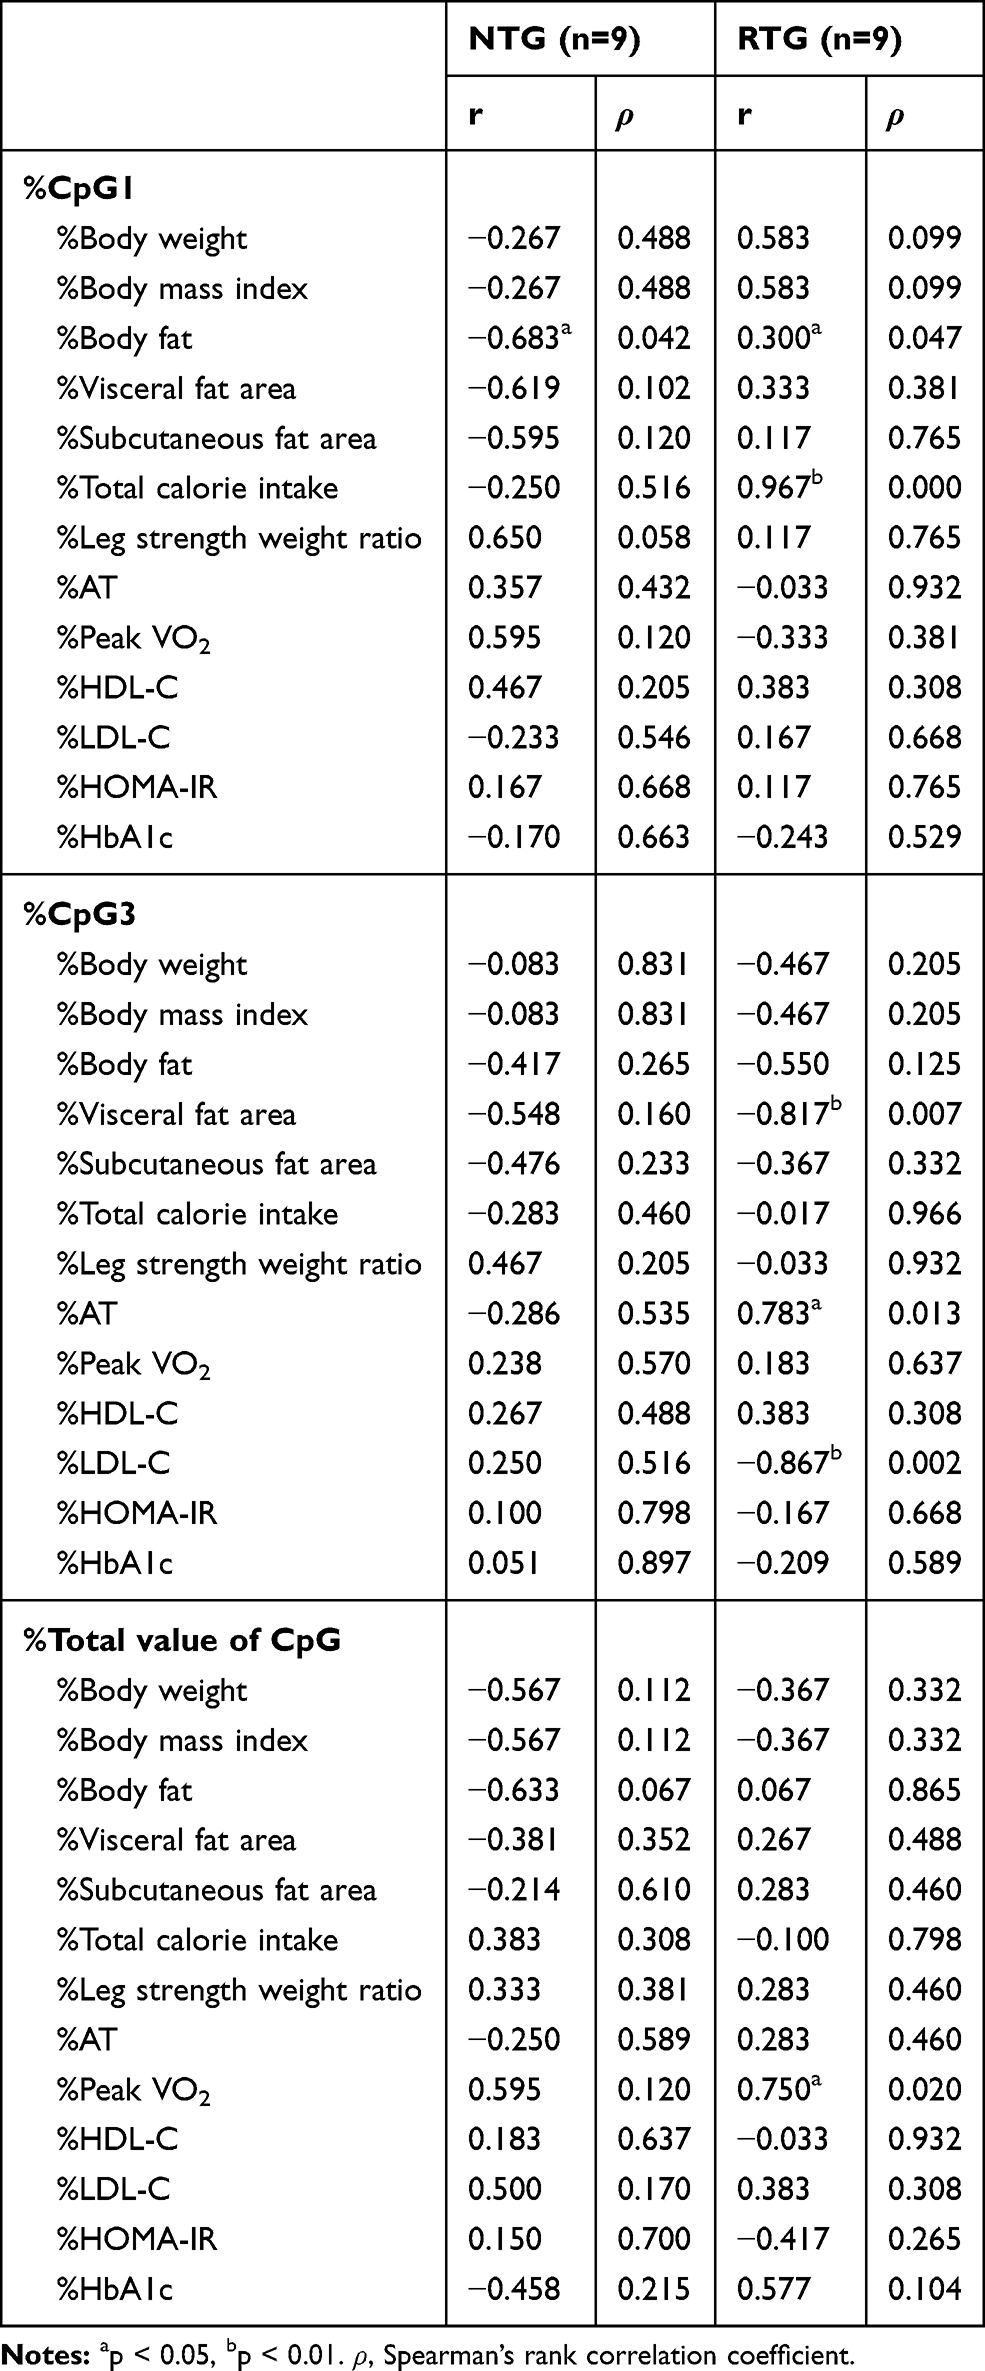 |
Table 3 Correlation Between Methylation Change Rate and Various Parameters |
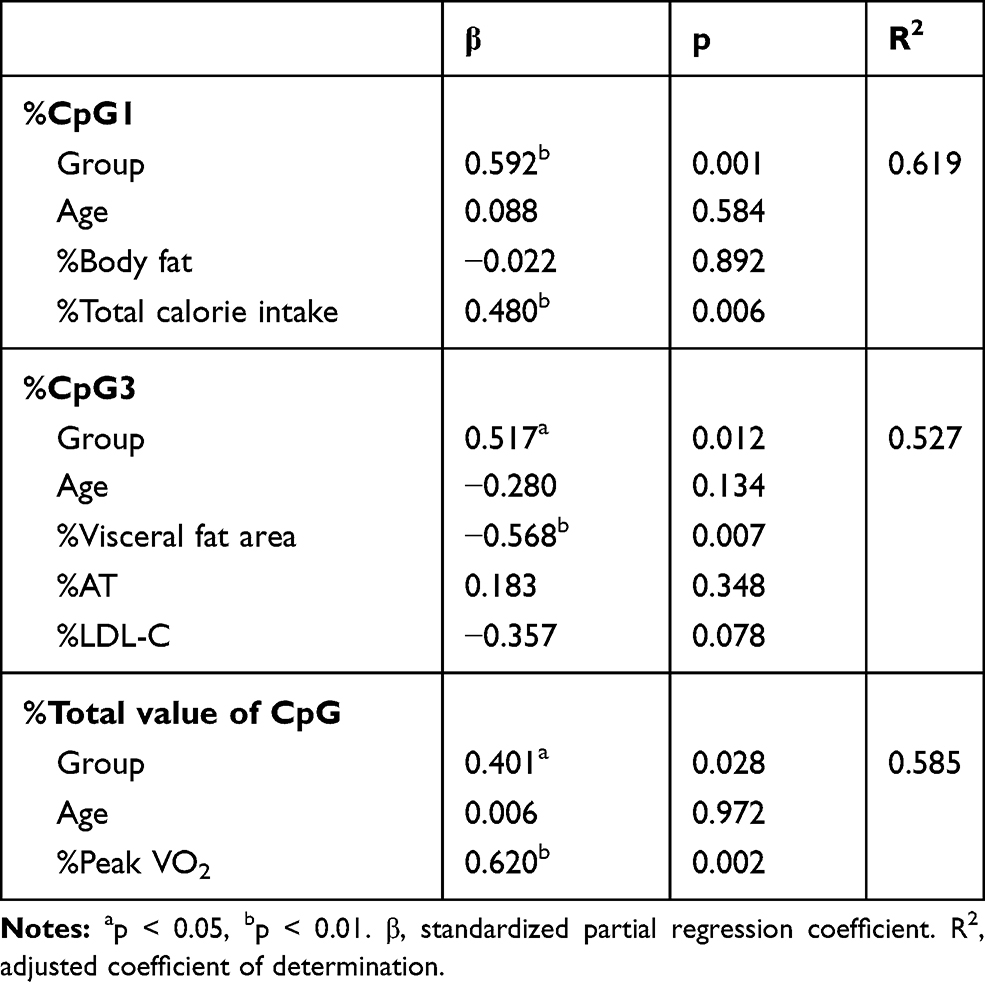 |
Table 4 Independent Factors of %cpg1, %cpg3, and %Total Value of CpG Using Stepwise Multiple Regression Analysis |
Results
Adherence to the Exercise Training Program
Out of the 31 participant enrolled in this study, 13 had dropped out of the 6-month weight-loss program prior to completion, while the remaining 18 (50.6 ± 12.1 years old, BMI 33.5 ± 6.2 kg/m2) were analyzed (Figure 1). The remaining subjects participated in supervised exercise therapy twice a month and performed home exercise therapy. Exercise time (walking) three times a week at home was 105.6 ± 55.5 min/week for NTG and 102.2 ± 44.4 min/week for RTG (p <0.876). The retention rate (Number of program finishers/program participants) for the 6-month weight-loss program was 47% for NTG and 75% for RTG (p <0.244). Additional RT programs were conducted 2–4 times a day, more than 5 days a week. The RT program achievement rate (RT program achievement rate (days)/prescribed number of programs (days)) was 89.0 ± 15.0%.
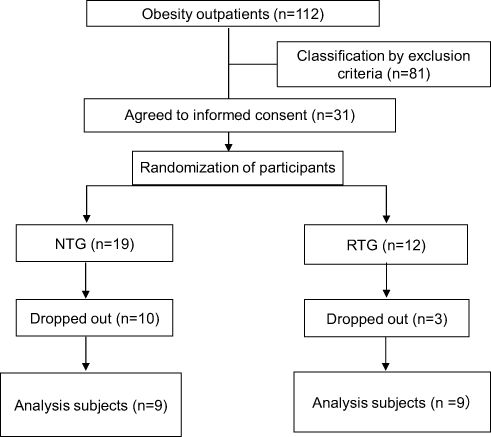 |
Figure 1 Flow chart of parallel randomized controlled trial between groups. Subjects were randomized into the normal treatment group (NTG) and the RT additional treatment group (RTG). |
Changes in Body Composition, Physical Fitness, and Blood Parameters
The body weight of NTG and RTG participants was significantly reduced by 6% (p=0.015) and 7% (p=0.011), respectively. VFA decreased by 15.4% (p=0.083) in NTG and 13.4% (p=0.058) in RTG. NTG SFA was significantly reduced by 11.0% (p=0.003) and RTG was reduced by 13.5% (p=0.030). The skeletal muscle mass of the extremities did not differ between groups (p=0.515). The leg strength weight ratio decreased 9.8% for NTG (p=0.515) and increased 2.7% for RTG (p=0.086), but the difference was not significant. As a result of a food analysis by a nutritionist at the time of the first medical examination and at the time of medical examination after 6 months of intervention, the NTG showed that the calories intake was 14.5% (p=0.096), and 53.8% (p=0.120), respectively, and that the total calorie intake was decreased by 20.6% (p=0.094); while the RTG decreased staple food intake calorie by 10.7% (p=0.368), snack intake calorie 29.1% (p=0.198), and total calorie intake by 14.0% (p=0.278). Although a decreasing trend was seen in both groups, it was not significant. PeakVO2 of NTG increased by 4.7% (p=0.375) and that of RTG increased by 7.1% (p=0.138), but it was not significant. Each group showed similar weight loss, but there were no significant differences between groups in terms of body composition, exercise capacity, and blood parameters (Table 5).
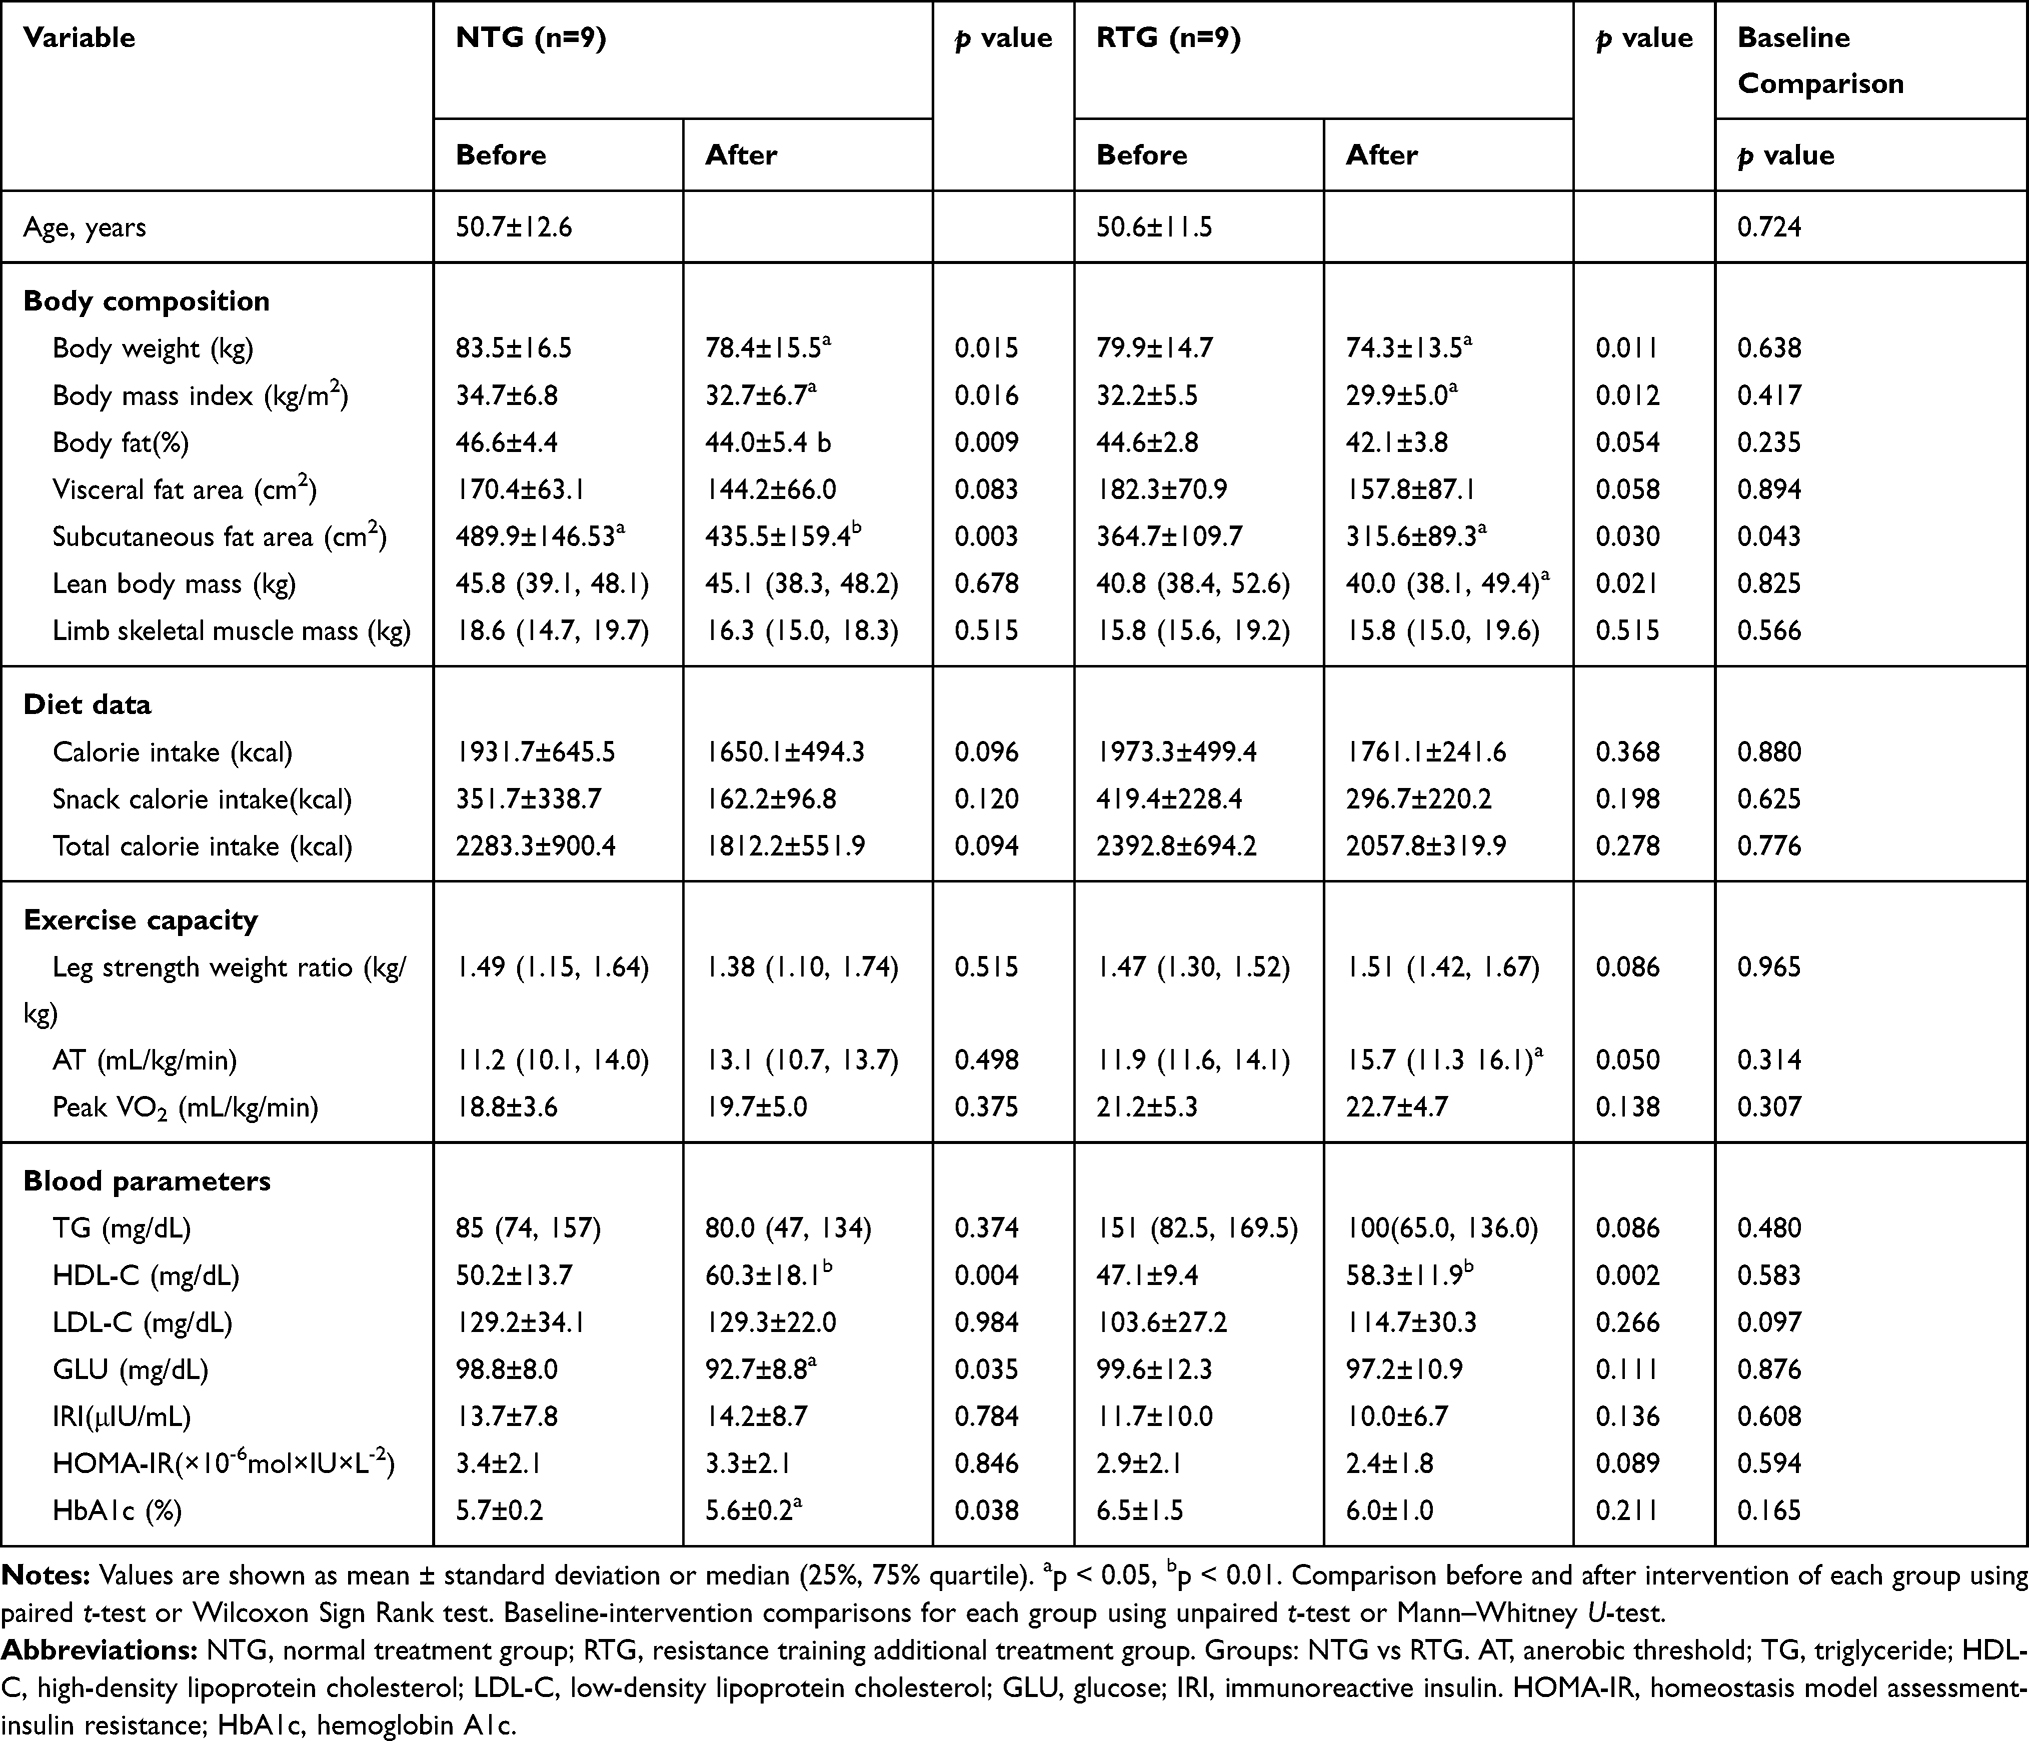 |
Table 5 Changes of Parameters from Baseline to 6-Month Following Weight Reduction Intervention in All Participants |
Differences in DNA Methylation Between Patient Groups
Comparing median methylation rates, NTG showed that CpG1 (p=0.011), CpG4 (p=0.050), CpG5 (p=0.021), CpG7 (p=0.017), and total value of CpG (p=0.011), which was a decline. In contrast, RTG had an increased CpG3 (p=0.038). Next, in comparison to the methylation change rate calculated from the average value of the data before and after the intervention, NTG showed a decrease in the CpG1 methylation change rate (p=0.004) and the total value of CpG (p=0.019). The rate of change in methylation of RTG was significantly increased only in CpG3 (p=0.038). The mean values consider all the data, so the rate of change was calculated from the mean values before and after the intervention. As a result, the significant differences between the groups were the values of %CpG1, %CpG3, and %total value of CpG (Table 2). As a factor showing a significant correlation with this methylation change rate, in NTG, a negative correlation was observed between %CpG1 and %Body fat (r=−0.683, p=0.042). RTG showed a positive correlation between %CpG1 and %Body fat (r=0.300, p=0.047) and %total calorie intake (r=0.967, p=0.000). Only RTG, %CpG3 was found to have a negative correlation with %VFA (r=−0.817, p=0.007) and %LDL-C (r=−0.867, p=0.002), and %AT (r=0.783, p=0.013) and a positive correlation was recognized. Only RTG showed a positive correlation between %total value of CpG and %PeakVO2 (r=0.750, p=0.020) (Table 3). In stepwise multiple regression analysis, the methylation change rate (%CpG) that was significant before and after the intervention between groups was used as the dependent variable, and the factors that were significantly correlated with each methylation change rate were used as the independent variables. As a result the independent factors that determine %CpG1 was the presence or absence of resistance training (β=0.592, p=0.001) and %total calories consumed (β=0.480, p=0.006).%CpG3 was the presence or absence of resistance training (β=0.517, p=0.012) and %VFA (β=−0.568, p=0.007). %Total value of CpG was the presence or absence of resistance training (β=0.401,p=0.028) and %PeakVO2 (β=0.620,p=0.002) (Table 4).
Discussion
This study quantified FTO whole blood DNA methylation and investigated its relationship to body composition, exercise capacity, and blood parameters with a 6-month weight-loss program intervention. We extracted FTO DNA from whole blood at the time of blood collection and analyzed the 5ʹUTR of the non-promoter genomic region. As a result, the methylation rate of NTG CpG1, CpG4, CpG5 and CpG7 was decreased, and the methylation rate of RTG CpG3 was increased. We predicted that decreases in body weight and fat mass increased DNA methylation rates in both groups. However, the decrease in the methylation rate of NTG showed the opposite result as expected. Luo et al reported that the CpG density in the 5ʹUTR region was high, but the DNA methylation level was relatively low and was negatively correlated with gene expression.36 It has also been reported that hypomethylation of the FTO non-promoter region is an early marker of T2D.26 Church et al found that reduced methylation (hypomethylation) induces overeating, fat accumulation, and obesity. It has been reported that increased methylation suppresses gene expression and decreased methylation promotes gene expression.15–20 The methylation of 4 cytosine guanine dinucleotide site (CpG sites) of NTG was decreased and the methylation of 1 CpG site of RTG was increased.
Next, the percent change in methylation calculated from the mean before and after the intervention to assess subjects’ methylation profile was significantly reduced of %CpG1 and %total value of CpG in NTG. RTG significantly increased %CpG3. We extracted the variables that showed a significant correlation with these change rates. A stepwise multiple regression analysis, adjusted for age and presence or absence of resistance training, showed that an independent factor defining RTG %CpG1 was positively correlated with %total calories and resistance training.
This suggests that resistance training may increase the rate of change in CpG methylation due to weight loss, even when eating well; in other words, it may suppress FTO. The independent factors that define %CpG3 of RTG were %VFA and the presence or absence of resistance training. The negative association with %VFA was shown only in RTG, which suggests that the decrease in visceral fat area change rate and the increase in CpG3 methylation change rate associated with weight loss may be related to FTO suppression. It has been reported that VFA is more sensitive to lipolysis and has higher metabolic activity than SFA.37 However, the absolute value of VFA showed a decreasing trend, but no significant difference was observed. The reason for the insignificant changes was due to low exercise intensity and duration. The independent factors that determine the %Total value of CpG of RTG were %PeakVO2 and the presence or absence of resistance training. The positive association with PeakVO2 was shown only in RTG since the increase in PeakVO2 change rate with weight loss was associated with the increase in %Total value of CpG change rate. Tables 3 and 4 show that the PeakVO2 had an increasing tendency, but no significant change was observed. The reason why the absolute value of peakVO2 did not increase was that no significant increase was obtained due to low exercise intensity and duration. However, AT showed a significant increase. This indicates that even if the dose is low, continuing resistance training for 6-month may contribute to improving aerobic capacity. As described above, similar weight reduction effects were observed in the body composition parameters of each group. The significant rate of change in RTG DNA level was associated with an independent factor.
In this study, the changes in the methylation rate before and after the intervention were subtle. Rönn et al reported that the changes in DNA methylation observed in response to exercise intervention may be modest, yet the affected sites may combine to contribute to the physiological response. Furthermore, significant changes in methylation are not necessarily sites of high methylation changes. Even in regions with low methylation changes (non-promoter region) such as 5ʹuntranslated region (5ʹUTR) and 3ʹuntranslated region (3ʹUTR), significant changes can occur within 0.2–10.9%.23,35 Aronica et al meta-analysis reported that the magnitude of DNA methylation changes identified was less than 5%, the smallest change reproducibly detectable on most platforms.24 In addition, in a report in which hypomethylation of the FTO non-promoter region is an early marker of T2D, a methylation rate of 0.4–7.2% has been reported.19,26,27 Based on these reports, considering the fact that are significant changes in obesity-related methylation due to differences in exercise interventions, such as this time, body composition, even if there is a certain weight-reducing, effect the parameters and blood properties, if methylation is significantly decreased, it may indicate the direction of promoting FTO gene expression, that is, the possibility of future T2D.
Many studies of CpG sites that show altered methylation rates indicate that these sites are essential for gene regulation. However, the function of the CpG site remains unknown, and little is known regarding the rate of change in CpG methylation in mammals and the environmental factors that influence changes in DNA methylation patterns.38 Regulation of gene expression is an important factor in the associated individual differences. The mechanism by which epigenetic alterations cause obesity at specific loci is unknown.39 Aronica et al meta-analysis reported that altered methylation at the identified CpG sites was the result rather than the cause of obesity, and altered BMI was responsible for the altered methylation. Long-term observations that obesity precedes changes in DNA methylation report that DNA methylation levels are likely to mediate obesity and health effects.24 However, it is currently unknown what phase of BMI changes CpG and in which region, and how methylation kinetics changes when obesity is eliminated. It is important to manage obesity to prevent or eliminate obesity-based diseases. To that end, lifestyle interventions have been reported to be effective, delay or prevent the onset of complications, and significantly reduce the burden on individuals with diabetes and public health.40 Irwin et al encourage moderate exercise as a way to reduce obesity and prevent chronic illness.41 This exercise program set low intensity resistance training that can be practiced at home for a relatively long period of time. To obtain a significant weight reduction effect on the body composition, exercise capacity, and blood parameters, it is an issue to continue the exercise with moderate intensity.
This study has some limitations. First, the study group contained only 18 participants, which may be too small to detect differences in DNA methylation and characterize participants. We believe that stratified randomization is necessary to minimize potential confounders and random variations that affect reproducibility. Moreover, it is possible that this methylation kinetics is not related to a clear biological mechanism. Only NTG showed a significant difference in SFA because participants had severe subcutaneous fat obesity at baseline. Second, the level of activities of daily living could not be quantified. Both groups achieved similar weight loss, but daily activities outside the program may have affected body composition and exercise tolerance. In the future, monitoring physical activity in daily life should be considered. Third, in this study, DNA analysis was performed using whole blood as an easily accessible method at the time of blood sampling in consideration of ethical issues and invasiveness. However, whole blood also has a high level of cell-type heterogeneity, and in view of tissue specificity, it has been pointed out that the blood methylation profile may not necessarily reflect the epigenetic status of other tissues.24,28 In the future, samples will need to be examined both in blood and tissue and other obesity-related candidate gene analyses. Additionally, areas and methods of analysis and intervention programs should be revaluated.
Conclusions
The methylation rate of NTG was significantly decreased at four CpG sites, and RTG was significantly increased at one CpG site. Decreased methylation promotes gene expression and increased methylation suppresses gene expression. In the methylation change rate, %CpG3 of RTG was significantly increased. In addition, %CpG3 was negatively associated with %VFA. This indicates that the rate of change in visceral fat area with weight loss may increase the rate of change in CpG3 methylation. Therefore, the reduction in visceral fat area, caused by the weight-loss program that included resistance training, may be associated with increased methylation of CpG3 in the non-promoter region of whole blood FTO. However, this study is merely a proof of concept, and further replication studies with larger sample sizes are warranted.
Abbreviations
FTO, fat mass and obesity-associated gene; RT, resistance training; NTG, normal treatment group; RTG, RT-added group; BMI, body mass index; VFA, visceral fat area; SFA, subcutaneous fat area; AT, anaerobic threshold; VO2, peak maximum oxygen uptake; HOMA-IR, homeostasis model assessment of insulin resistance; CpG, cytosine guanine dinucleotide; UTR, untranslated region; TG, triglyceride; T2D, type 2 diabetes; Mets, metabolic syndrome.
Acknowledgments
The authors thank all patients who took role in this study.
Ethics approval and informed consent
This study was conducted with approval from the Kansai Medical University Ethics Committee. All participants provided written, informed consent for participation in the study. This study was conducted in accordance with the Declaration of Helsinki.
Disclosure
The authors report no conflicts of interest related to this work.
References
1. Guariguata L, Whiting DR, Hambleton I, Beagley J, Linnenkamp U, Shaw JE. Global estimates of diabetes prevalence for 2013 and projections for 2035. Diabetes Res Clin Pract. 2014;103(2):137–149. doi:10.1016/j.diabres.2013.11.002
2. Wilborn C, Beckham J, Campbell B, et al. Obesity: prevalence, theories, medical consequences, management, and research directio ns. J Int Soc Sports Nutr. 2005;2(2):4–31. doi:10.1186/1550-2783-2-2-4
3. Knight JA. Diseases and disorders associated with excess body weight. Ann Clin Lab Sci. 2011;41(2):107–121.
4. Carnero EA, Amati F, Pinto RS, Valamatos MJ, Mil-Homens P, Sardinha LB. Regional fat mobilization and training type on sedentary, premenopausal overweight and obese women. Obesity. 2014;22(1):86–93. doi:10.1002/oby.20568
5. Xiao T, Fu Y. Resistance training vs. aerobic training and role of other factors on the exercise effects on visceral fat. Eur Rev Med Pharmacol Sci. 2015;19(10):1779–1784.
6. Sigal RJ, Kenny GP, Boulé NG, et al. Effects of aerobic training, resistance training, or both on glycemic control in type 2 diabetes: a randomized trial. Annal Intern Med. 2007;147:357–369.
7. Frayling TM, Timpson NJ, Weedon MN, et al. A common variant in the FTO gene is associated with body mass index and predisposes to childhood and adult obesity. Science. 2007;316(5826):889–894. doi:10.1126/science.1141634
8. McCaffery JM, Papandonatos GD, Peter I, et al. Obesity susceptibility loci and dietary intake in the Look AHEAD Trial. Am J Clin Nutr. 2012;95(6):1477–1486. doi:10.3945/ajcn.111.026955
9. Yang Q, Xiao T, Guo J, Su Z. Complex relationship between obesity and the fat mass and obesity locus. Int J Biol Sci. 2017;13(5):615–629. doi:10.7150/ijbs.17051
10. Rankinen T, Rice T, Teran-Garcia M, Rao DC, Bouchard C. FTO genotype is associated with exercise training-induced changes in body composition. Obesity. 2010;18(2):322–326. doi:10.1038/oby.2009.205
11. Li S, Zhao JH, Luan J, et al. Physical activity attenuates the genetic predisposition to obesity in 20,000 men and women from EPIC-Norfolk prospective population study. PLoS Med. 2010;7(8):e1000332. doi:10.1371/journal.pmed.1000332
12. Kilpeläinen TO, Qi L, Brage S, et al. Physical activity attenuates the influence of FTO variants on obesity risk: a meta-analysis of 218,166 adults and 19,268 children. PLoS Med. 2011;8(11):e1001116. doi:10.1371/journal.pmed.1001116
13. Cheung WW, Mao P. Recent advances in obesity: genetics and beyond. ISRN Endocrinol. 2012;2012:536905.
14. Qi L, Cho YA. Gene-environment interaction and obesity. Nutr Rev. 2008;66(12):684–694. doi:10.1111/j.1753-4887.2008.00128.x
15. Klose RJ, Bird AP. Genomic DNA methylation: the mark and its mediators. Trends Biochem Sci. 2006;31(2):89–97. doi:10.1016/j.tibs.2005.12.008
16. Miranda TB, Jones PA. DNA methylation: the nuts and bolts of repression. J Cell Physiol. 2007;213(2):384–390. doi:10.1002/jcp.21224
17. Gibney E, Nolan C. Epigenetics and gene expression. Heredity. 2010;105(1):4–13. doi:10.1038/hdy.2010.54
18. Robst AV, Dunleavy E, Almouzni G. Epigenetic inheritance during the cell cycle. Nat Rev Mol Cell Biol. 2009;10(3):192–206. doi:10.1038/nrm2640
19. Kwak SH, Park KS. Recent progress in genetic and epigenetic research on type 2 diabetes. Exp Mol Med. 2016;48:e220.
20. Church C, Moir L, McMurray F, et al. Overexpression of Fto leads to increased food intake and results in obesity. Nat Genet. 2010;42(12):1086–1092. doi:10.1038/ng.713
21. Yeo GS, O’Rahilly S. Uncovering the biology of FTO. Mol Metab. 2012;1(1–2):32–36. doi:10.1016/j.molmet.2012.06.001
22. Lu Q, Kang K, Zhang C, et al. Fat mass- and obesity-associated (FTO) gene variant is associated with obesity. Diabetes. 2008;57(11):3145–3151. doi:10.2337/db08-0006
23. Rönn T, Volkov P, Davegårdh C, et al. A six months exercise intervention influences the genome-wide DNA methylation pattern in human adipose tissue. PLoS Genet. 2013;9:e1003572.
24. Aronica L, Levine JA, Brennan K, et al. A systematic review of studies of DNA methylation in the context of a weight loss intervention. Epigenomics. 2017;9(5):769–787. doi:10.2217/epi-2016-0182
25. Toperoff G, Aran D, Kark JD, et al. Genome-wide survey reveals predisposing diabetes type 2-related DNA methylation variations in human peripheral blood. Hum Mol Genet. 2012;21(2):371–383. doi:10.1093/hmg/ddr472
26. van Otterdijk SD, Binder AM, Szarc Vel Szic K, Schwald J, Michels KB. DNA methylation of candidate genes in peripheral blood from patients with type 2 diabetes or the metabolic syndrome. PLoS One. 2017;12(7):e0180955. doi:10.1371/journal.pone.0180955
27. Slieker RC, Bos SD, Goeman JJ, et al. Identification and systematic annotation of tissue-specific differentially methylated regions using the Illumina 450k array. Epigenetics Chromatin. 2013;6(1):26. doi:10.1186/1756-8935-6-26
28. Crujeiras AB, Diaz-Lagares A, Sandoval J, et al. DNA methylation map in circulating leukocytes mirrors subcutaneous adipose tissue methylation pattern: a genome-wide analysis from non-obese and obese patients. Sci Rep. 2017;7:41903.
29. Kurose S, Tsutsumi H, Yamanaka Y, et al. Improvement in endothelial function by lifestyle modification focused on exercise training is associated with insulin resistance in obese patients. Obes Res Clin Pract. 2014;8(1):e106–e114. doi:10.1016/j.orcp.2012.10.005
30. Saito H, Kimura Y, Tashima S, et al. Psychological factors that promote behavior modification by obese patients. Biopsychosoc Med. 2009;3(1):9. doi:10.1186/1751-0759-3-9
31. Fukushima Y, Kurose S, Shinno H, et al. Importance of lean muscle maintenance to improve insulin resistance by body weight reduction in female patients with obesity. Diabetes Metab J. 2016;40(2):147–153. doi:10.4093/dmj.2016.40.2.147
32. Boulé NG, Haddad E, Kenny GP, Wells GA, Sigal RJ. Effects of exercise on glycemic control and body mass in type 2 diabetes mellitus: a meta-analysis of controlled clinical trials. JAMA. 2001;286(10):1218–1227. doi:10.1001/jama.286.10.1218
33. Tost J, Gut IG. DNA methylation analysis by pyrosequencing. Nat Protoc. 2007;2(9):2265–2275. doi:10.1038/nprot.2007.314
34. Wang X, Zhu H, Snieder H, et al. Obesity related methylation changes in DNA of peripheral blood leukocytes. BMC Med. 2010;8(1):87. doi:10.1186/1741-7015-8-87
35. Rönn T, Volkov P, Gillberg L, et al. Impact of age, BMI and HbA1c levels on the genome-wide DNA methylation and mRNA expression patterns in human adipose tissue and identification of epigenetic biomarkers in blood. Hum Mol Genet. 2015;24(13):3792–3813. doi:10.1093/hmg/ddv124
36. Luo R, Bai C, Yang L, et al. Correction to ‘DNA methylation subpatterns at distinct regulatory regions in human early embryos’. Open Biol. 2018;8:12.
37. Liu FX, Latt SW, Nichols JF, et al. Factors associated with visceral fat loss in response to a multifaceted weight loss intervention. J Obes Weight Loss Ther. 2017;7(4):346.
38. Li E, Zhang Y. DNA methylation in mammals. Cold Spring Harb Perspect Biol. 2014;6(5):a019133. doi:10.1101/cshperspect.a019133
39. Triantaphyllopoulos KA, Ikonomopoulos I, Bannister AJ. Epigenetics and inheritance of phenotype variation in livestock. Epigenetics Chromatin. 2016;9:31.
40. Knowler WC, Barrett-Connor E, Fowler SE, et al. Reduction in the incidence of type 2 diabetes with lifestyle intervention or metformin. N Engl J Med. 2002;346(6):
41. Irwin ML, Yasui Y, Ulrich CM, et al. Effect of exercise on total and intra-abdominal body fat in postmenopausal women: A randomized controlled trial. JAMA. 2003;289(3):323–330. doi:10.1001/jama.289.3.323
 © 2020 The Author(s). This work is published and licensed by Dove Medical Press Limited. The full terms of this license are available at https://www.dovepress.com/terms.php and incorporate the Creative Commons Attribution - Non Commercial (unported, v3.0) License.
By accessing the work you hereby accept the Terms. Non-commercial uses of the work are permitted without any further permission from Dove Medical Press Limited, provided the work is properly attributed. For permission for commercial use of this work, please see paragraphs 4.2 and 5 of our Terms.
© 2020 The Author(s). This work is published and licensed by Dove Medical Press Limited. The full terms of this license are available at https://www.dovepress.com/terms.php and incorporate the Creative Commons Attribution - Non Commercial (unported, v3.0) License.
By accessing the work you hereby accept the Terms. Non-commercial uses of the work are permitted without any further permission from Dove Medical Press Limited, provided the work is properly attributed. For permission for commercial use of this work, please see paragraphs 4.2 and 5 of our Terms.