")
Back to Journals » Diabetes, Metabolic Syndrome and Obesity » Volume 15
Cerebral Small Vessel Disease is Associated with Mild Cognitive Impairment in Type 2 Diabetes Mellitus
Authors Teng Z, Feng J, Liu R, Dong Y, Chen H, Xu J, Jiang X, Li R, Lv P
Received 5 April 2022
Accepted for publication 29 June 2022
Published 2 July 2022 Volume 2022:15 Pages 1985—1994
DOI https://doi.org/10.2147/DMSO.S368725
Checked for plagiarism Yes
Review by Single anonymous peer review
Peer reviewer comments 2
Editor who approved publication: Professor Jing Sun
Zhenjie Teng,1,2 Jing Feng,3 Ronghui Liu,4 Yanhong Dong,2 Huifang Chen,2 Jing Xu,2 Xin Jiang,2 Rui Li,2 Peiyuan Lv1,2
1Department of Neurology, Hebei Medical University, Shijiazhuang, Hebei Province, People’s Republic of China; 2Department of Neurology, Hebei General Hospital, Shijiazhuang, Hebei Province, People’s Republic of China; 3Department of Endocrinology, Hebei General Hospital, Shijiazhuang, Hebei Province, People’s Republic of China; 4Department of Radiology, Hebei General Hospital, Shijiazhuang, Hebei Province, People’s Republic of China
Correspondence: Peiyuan Lv, Department of Neurology, Hebei General Hospital, 348 Heping West Road, Shijiazhuang, Hebei Province, 050051, People’s Republic of China, Tel/Fax +86 31185988906, Email [email protected]
Objective: Type 2 diabetes mellitus (T2DM) is associated with cognitive impairment, but the underlying cerebral small vessel disease (CSVD)-related structural brain correlates are unclear. The aim of this study was to investigate the relationship between various imaging markers of CSVD and mild cognitive impairment (MCI) in patients with T2DM.
Methods: A total of 228 eligible participants with T2DM who were divided into MCI group and normal cognitive group based on neuropsychological assessment were enrolled in this retrospective study. White matter hyperintensity (WMH), lacunes, cerebral microbleeds (CMBs) and enlarged perivascular spaces (EPVS) were evaluated based on brain magnetic resonance imaging (MRI). The total CSVD burden score was calculated by combining the above four markers of CSVD. Binary logistic regression analysis was used to evaluate the relationship between different imaging markers of CSVD and MCI in patients with T2DM. Kruskal–Wallis test and Jonckheere–Terpstra test were used to compare mean MoCA scores among individuals with varying CSVD markers.
Results: In the multivariate binary logistic regression analyses, moderate or severe total CSVD burden (OR: 3.29, 95% CI: 1.63– 7.38, P=0.004; OR: 10.97, 95% CI: 4.94– 24.34, P< 0.001, respectively), moderate dWMH (OR: 3.26, 95% CI: 1.43– 7.41, P=0.005), extensive lacunes (OR: 4.97, 95% CI: 1.79– 13.81, P=0.002), and moderate BG-EPVS (OR: 3.84, 95% CI: 1.81– 8.13, P< 0.001) were associated with MCI in patients with T2DM related to MCI after adjusting for potential confounders. There was a trend for significant decrease in MoCA scores with increase severity of dWMH, pWMH, lacunes, BG-EPVS, deep CMBs, or total CSVD burden (P for trend < 0.05).
Conclusion: Different imaging markers of CSVD, particularly total CSVD burden, were associated with an increased risk of MCI and decline in MoCA scores in patients with T2DM. These findings may provide clues for future studies to explore early diagnostic imaging markers of cognitive impairment in relation to T2DM.
Keywords: type 2 diabetes mellitus, mild cognitive impairment, cerebral small vessel disease
Introduction
Type 2 diabetes mellitus (T2DM) is a highly prevalent disorder in middle or older population and a tremendous threat to global public health.1 T2DM-induced cognitive impairment, including mild cognitive impairment (MCI) and dementia, has become a serious health problem worldwide.2 People with T2DM have a 1.5–2.8-times increased risk of dementia compared with those without T2DM,3,4 and a high proportion of patients (up to 20%) older than 60 years with T2DM might have dementia.5 In particular, T2DM increases the risk of incident MCI6,7 and accelerates the progression from MCI to dementia.2,5,8 Moreover, cognitive impairment, especially dementia, may lead to poor self-management of T2DM, which in turn result in more cerebrovascular events and worse cognitive ability.1 Given that early detection and interventions for cognitive impairment are conducive to diabetes care and self-management, it is critical to identify effective diagnostic markers of MCI in patients with T2DM.
Cerebral small vessel disease (CSVD) is a disorder of small perforating arterioles, capillaries and small veins of the brain.9 Imaging markers of CSVD seen on neuroimaging include white matter hyperintensity (WMH), lacunes, cerebral microbleeds (CMBs) and enlarged perivascular spaces (EPVS).10 CSVD is a prominent cause of cognitive impairment and an independent risk factor for MCI.10,11 Total CSVD burden score, calculated by integrating above imaging markers, might better represent the severity of CSVD and predict cognitive impairment.12 In addition, the presence of brain abnormalities on magnetic resonance imaging (MRI), particularly markers of CSVD, are more common in people with T2DM.13,14 However, few studies have explored the association between different imaging markers of CSVD and MCI in patients with T2DM. In this study, we aimed to evaluate whether different imaging markers of CSVD (ie, total CSVD burden score, WMH, CMBs, lacunes, EPVS) are associated with an increased risk of MCI in patients with T2DM.
Participants and Methods
Study Population
This is a retrospective study of patients with T2DM who were hospitalized at Hebei General Hospital between October 2016 and October 2020 according to in-hospital records stored in electronic databases. Inclusion criteria for patients were as follows: (1) older than 50 years, (2) diagnosis of T2DM according to World Health Organization criteria,15 and (3) have complete MRI sequences for evaluating different imaging markers of CSVD. We excluded those with symptomatic vascular events within 3 months, dementia and other conditions that may be associated with cognitive function, such as brain injuries, epilepsy, anxiety, depression, hypothyroidism, hyperthyroidism or carbon monoxide poisoning. Finally, we included 228 eligible patients in the study.
Clinical Assessment
The following data on demographic and clinical characteristics were collected in our study: age, gender, years of education, body mass index, duration of T2DM, and history of smoking, alcohol drinking, hypertension, coronary heart disease, and stroke. Body mass index was calculated as weight (kg) divided by the square of height (m2). Hypertension was defined as blood pressure ≥140/90 mmHg, a previous diagnosis of hypertension, or treatment with antihypertensive drugs. Laboratory markers such as hemoglobin A1c (HbA1c), total cholesterol, triglyceride, low-density lipoprotein cholesterol, high-density lipoprotein cholesterol, serum total homocysteine and uric acid were evaluated after 8 hours of overnight fasting.
Brain MRI Data Acquisition and Evaluation
MRI examination was performed in all patients with 3.0 tesla magnetic resonance scanners (Signa, GE Healthcare, USA). The neuroimaging sequences included T1-weighted imaging (T1WI), T2-weighted imaging (T2WI), fluid-attenuated inversion recovery (FLAIR) and susceptibility weighted imaging (SWI). Full details of MR scanning parameters have been described previously.16
Imaging markers of CSVD were assessed independently by two readers according to the standard published criteria.10 In case of disagreement on any markers, a radiologist assessed the images in order to achieve consensus. All ratings were blinded to all patient data. WMH was displayed as hyperintensity on T2WI and FLAIR, without cavitation. The severity of periventricular WMH (pWMH) or the deep WMH (dWMH) was evaluated using Fazekas rating scale.17 We categorized WMH as mild (0–1 score), moderate (2 score) and severe (3 score). A lacune was classified as a round or ovoid, subcortical cavity, between 3 and 15 mm in diameter, with a similar signal of cerebrospinal fluid on T1WI or T2WI, following the territory of a perforating arteriole.10 The number of lacunes was recorded. The grades of lacunes were grouped as being absent, mild (1–3), extensive (≥4).18 CMBs were defined as a small (2–10 mm in diameter) area of signal void on SWI and graded using the Microbleed Anatomical Rating Scale.19 The number of CMBs in lobar or deep was recorded. EPVS was defined as a round or linear, cerebrospinal fluid filled cavity with a diameter generally smaller than 3 mm on all sequences and measured in two different regions: the basal ganglia (BG) and centrum semiovale (CSO). In line with previous studies, EPVS in CSO or BG was rated on a semi-quantitative scale from 0 to 4 (0 = none, 1 = 1–10, 2 = 11–20, 3 = 21–40 and 4 = >40).20 We categorized EPVS as mild (0–1 score), moderate (2 score) and severe (3–4 score). The total CSVD burden score was rated on an ordinal scale from 0 to 4. A point was awarded for each of the following: severe pWMH or moderate-to-severe dWMH, presence of lacune, any deep CMBs and moderate-to-severe EPVS in BG.21–23 We categorized the total CSVD burden as mild (0–1 score), moderate (2 score) and severe (3–4 score).24
Cognitive Function Assessment
The diagnosis of MCI was made according to the established criteria recommended by National Institute on Aging and Alzheimer’s Association workgroups.25 The criteria included 1) concern regarding a change in cognition (patients or their families); 2) objective evidence of impairment in one or more cognitive domains, which in our study, was assessed by standardized translated version of Montreal Cognitive Assessment (MoCA) Beijing version (www.mocatest.org); 3) preservation of independence in functional abilities according to basic and instrumental activities of daily living (ADL); 4) absence of dementia. According to a previously published protocol, the normal MoCA score is >13 for illiterate, >19 for individuals with 1–6 years of education, and >24 for individuals with 7 or more years of education for Chinese adults.26
Statistical Analysis
Continuous variables were expressed as mean (standard deviation) or median (interquartile range) as appropriate and analyzed by Mann–Whitney U-test or t test. Categorical variables were presented with case (percentage) and analyzed by chi-square test. Ordinal variables, such as the severity of different imaging markers of CSVD, were analyzed by the Kruskal–Wallis test based on grouping. Multivariate binary logistic regressions were performed to determine whether different imaging markers of CSVD were independent risk factors for MCI in patients with T2DM. To assess the relationships between MoCA scores and different imaging markers of CSVD, Kruskal–Wallis test and Jonckheere–Terpstra test were used to compare mean MoCA scores among individuals with varying CSVD markers (total CSVD burden, WMH, CMBs, lacunes, and EPVS). All above statistical analyses were performed using SPSS software package 21.0 (IBM corporation, Armonk, NY). Values of P<0.05 were considered statistically significant.
Results
Participants Characteristics
This retrospective study included 228 eligible patients with T2DM. The characteristics of all participants are presented in Tables 1 and 2. The mean age of the participants was 67.4±8.1 years and 55.3% were male. Frequencies of different imaging markers of CSVD: moderate-to-severe dWMH [115 (50.4%)], moderate-to-severe pWMH [140 (61.4%)], lacunes [135 (59.2%)], lobar CMBs [60 (26.3%)], deep CMBs [68 (29.8%)], moderate-to-severe BG-EPVS [133 (58.4%)], moderate-to-severe CSO-EPVS [165 (72.4%)], and moderate-to-severe total CSVD burden [138 (60.5%)]. All individuals were divided into normal cognitive group (n = 104) and MCI group (n = 124). Patients with MCI were significantly older and showed more history of stroke than those without cognitive impairment (P<0.05, Table 1). The MCI group presented higher HbA1c and serum tHcy levels than normal cognitive group (P<0.05, Table 1). On MRI, the presence of MCI in patients with T2DM was associated with more severe dWMH, pWMH, lacunes, deep CMBs, BG-EPVS, and total CSVD burden (P<0.05, Table 2).
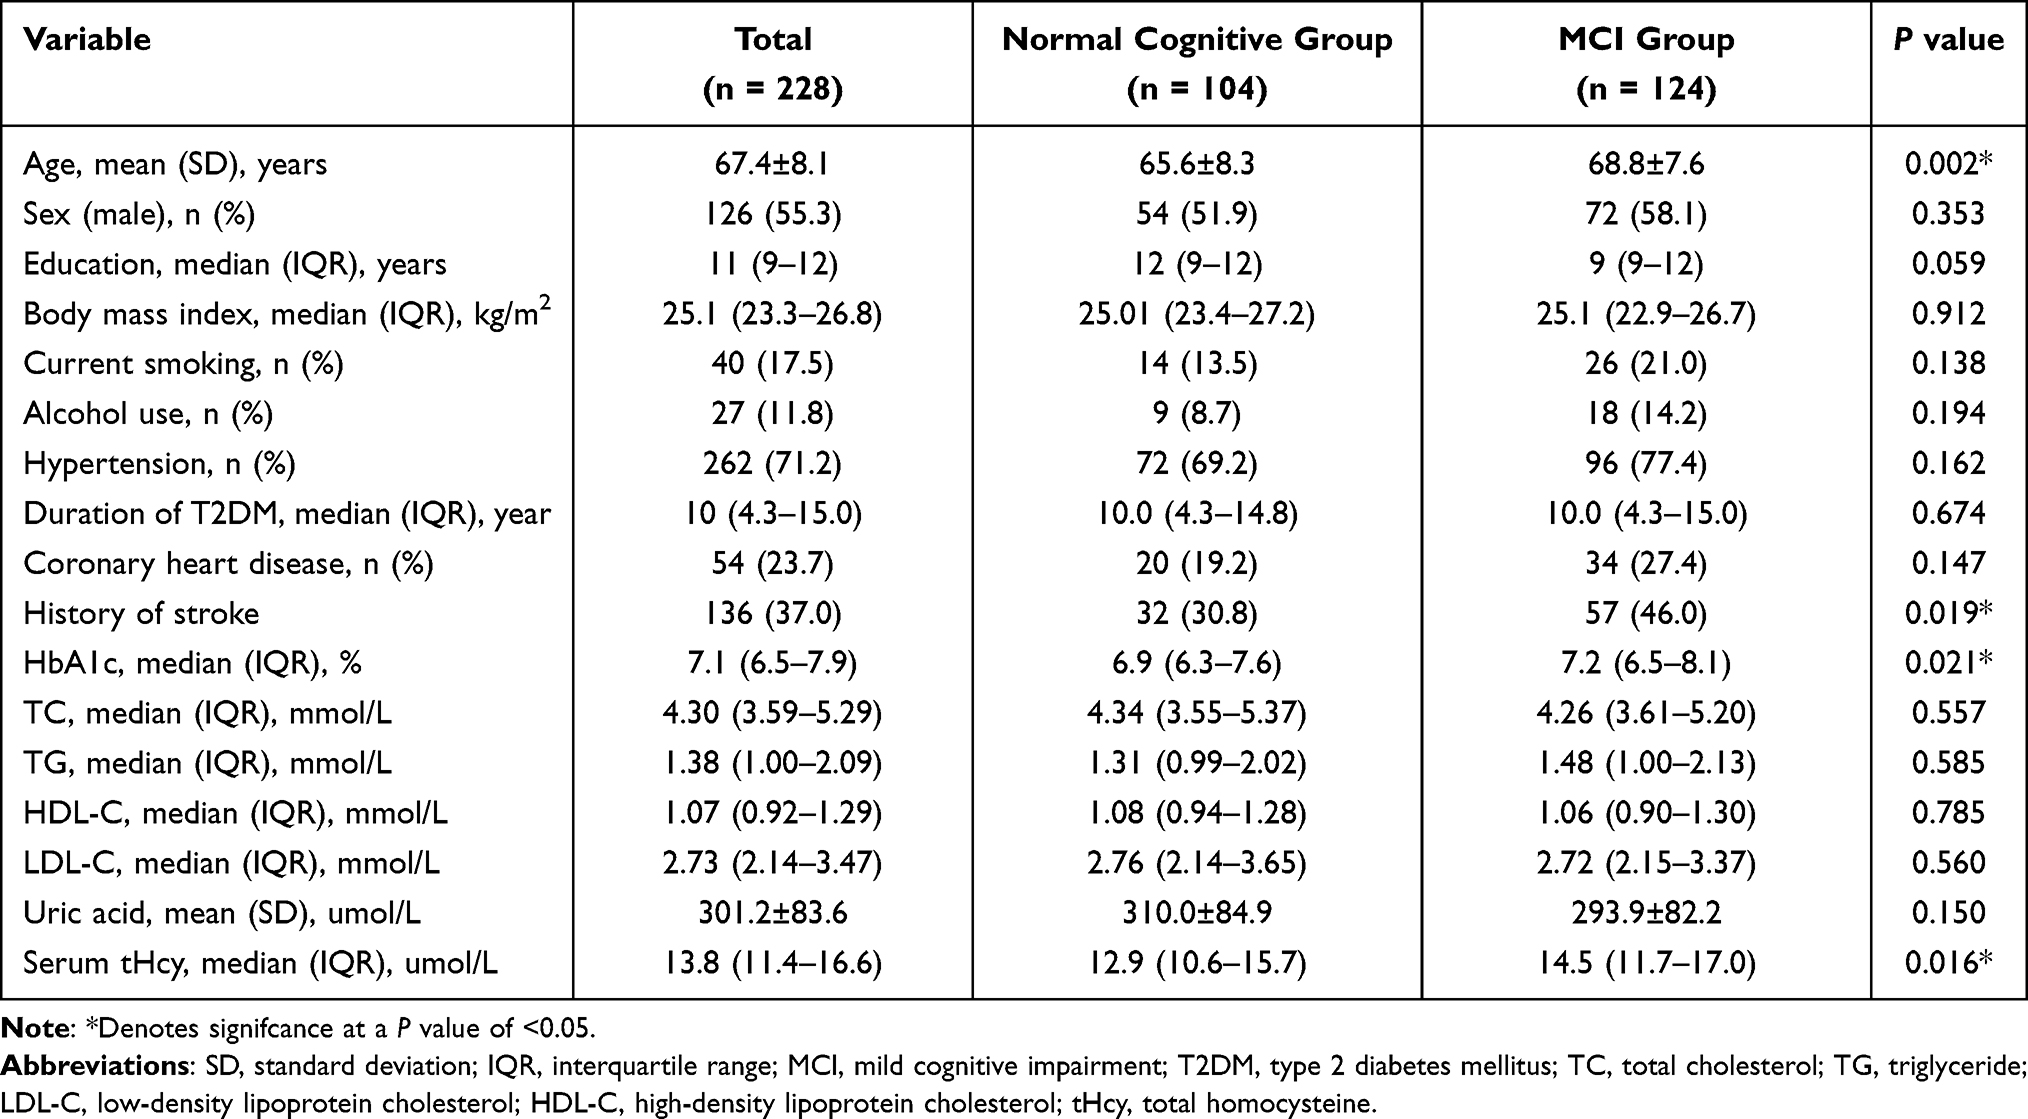 |
Table 1 Clinical Characteristics of All Participants with T2DM |
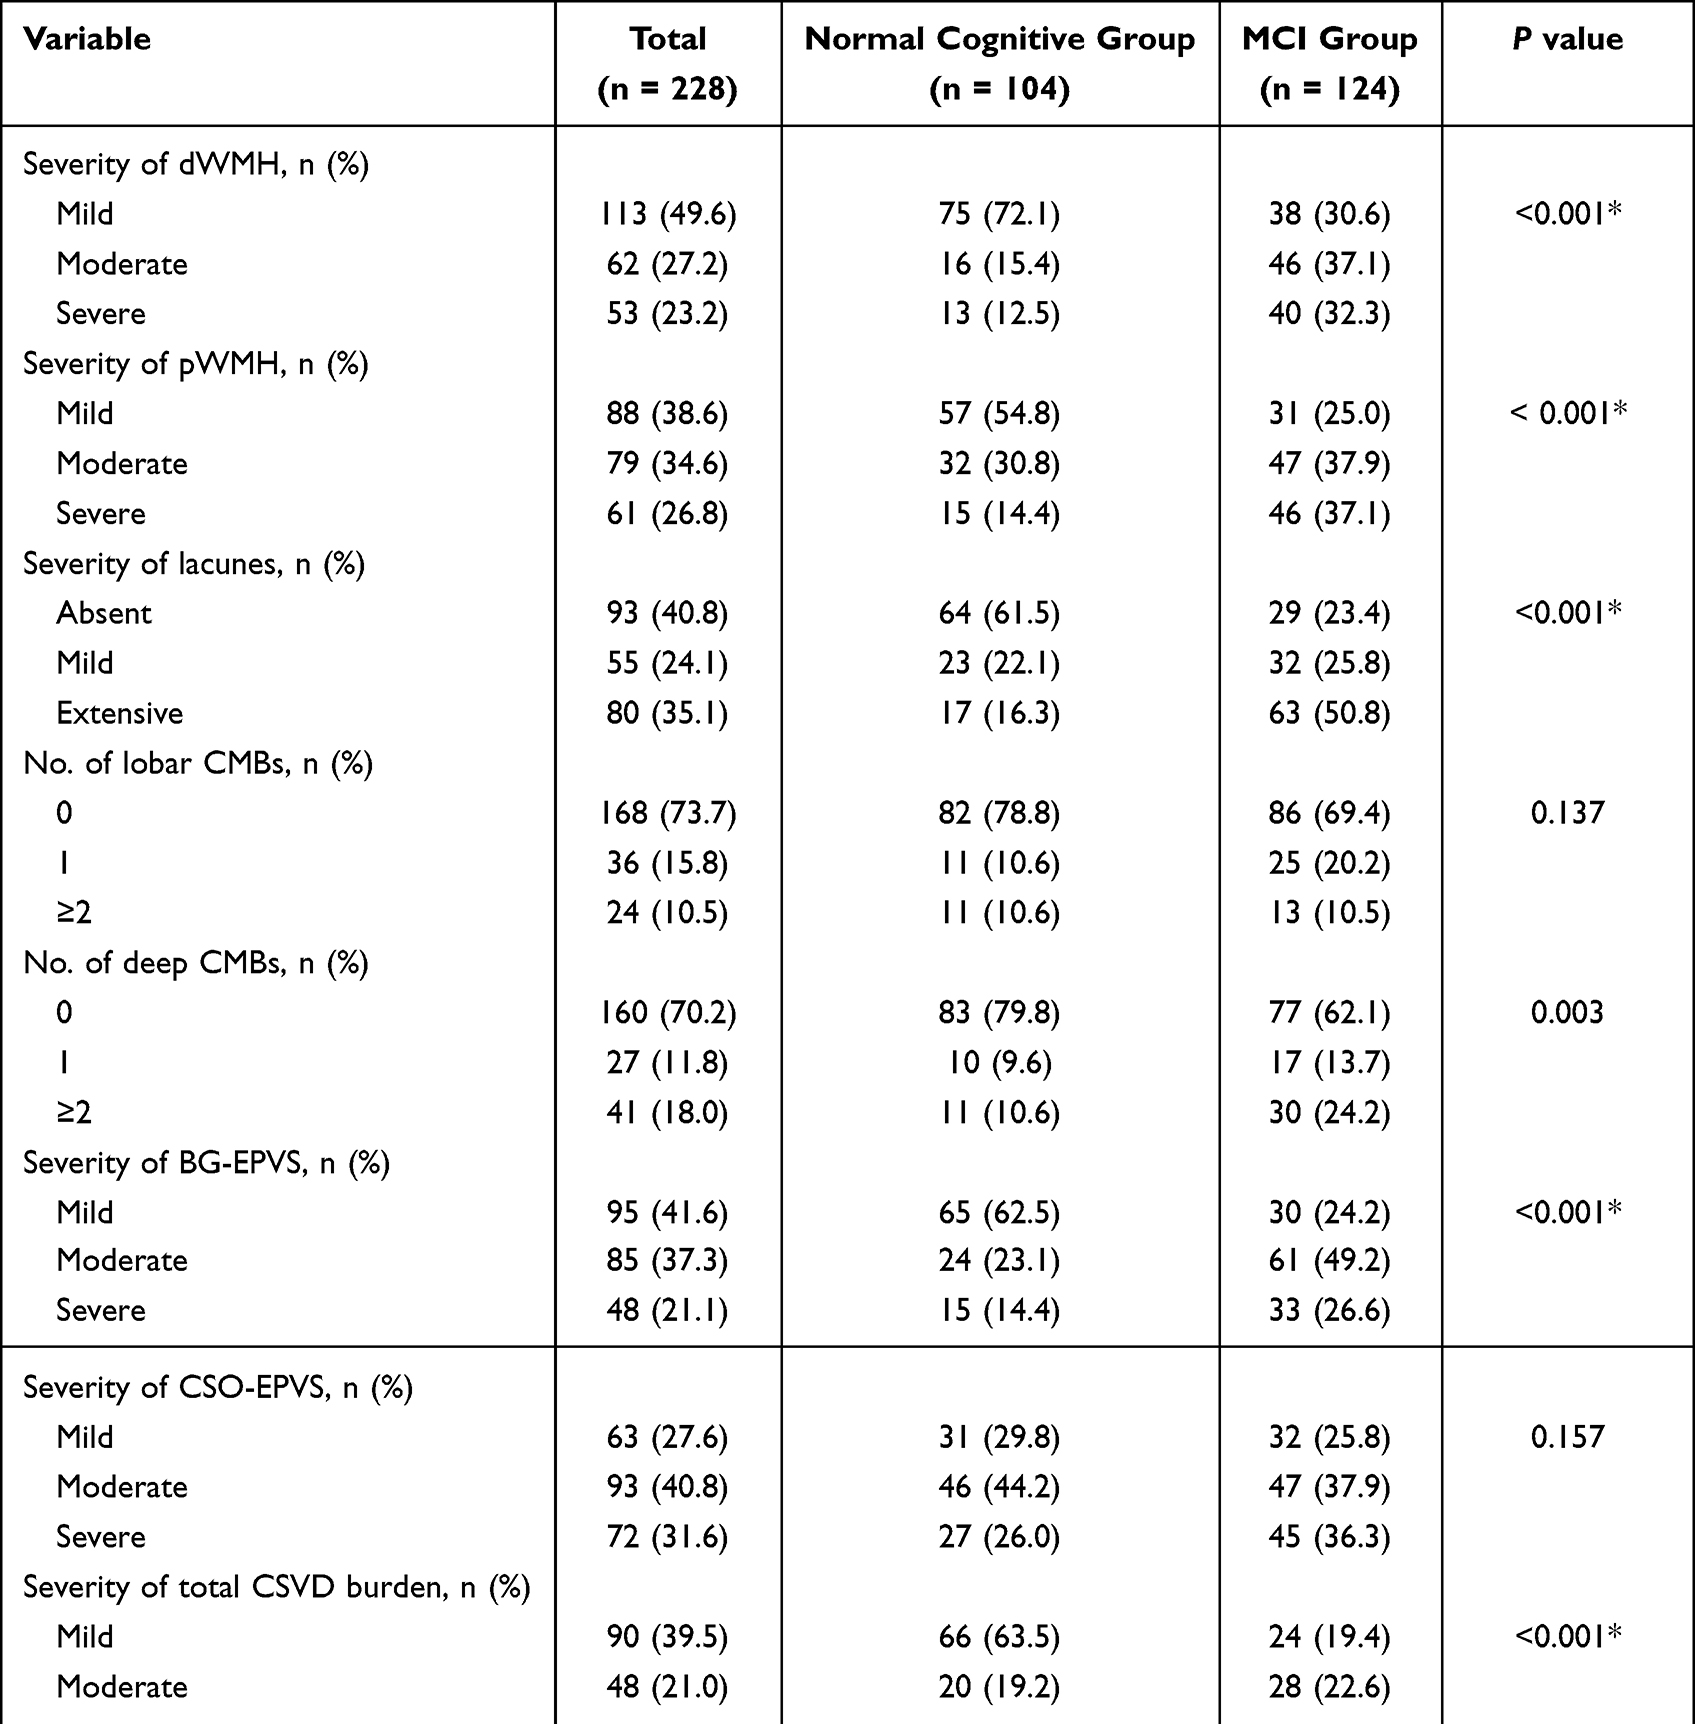 |
Table 2 Characteristics of Imaging Markers of CSVD of All Participants with T2DM |
Different Imaging Markers of CSVD and MCI in Patients with T2DM
Multivariate binary logistic regressions were performed to determine the association between different imaging markers of CSVD and MCI in patients with T2DM, as shown in Table 3. The moderate or severe total CSVD burden was associated with MCI (odds ratio [OR]: 3.29, 95% confidence interval [CI]: 1.63–7.38, P=0.004; OR: 10.97, 95% CI: 4.94–24.34, P<0.001, respectively) after adjusting for age, education, history of stroke, HbA1c and serum tHcy (Model 2). The moderate dWMH (OR: 3.26, 95% CI: 1.43–7.41, P=0.005), extensive lacunes (OR: 4.97, 95% CI: 1.79–13.81, P=0.002), and moderate BG-EPVS (OR: 3.84, 95% CI: 1.81–8.13, P<0.001) were all related to MCI after adjusting for age, education, history of stroke, HbA1c, serum tHcy and imaging markers of CSVD (ie, WMH, CMBs, lacunes, and EPVS) (Model 3). No significant correlations were found between other imaging markers of CSVD after adjusting for all confounders (Model 3), although they were significantly associated with MCI in Model 1.
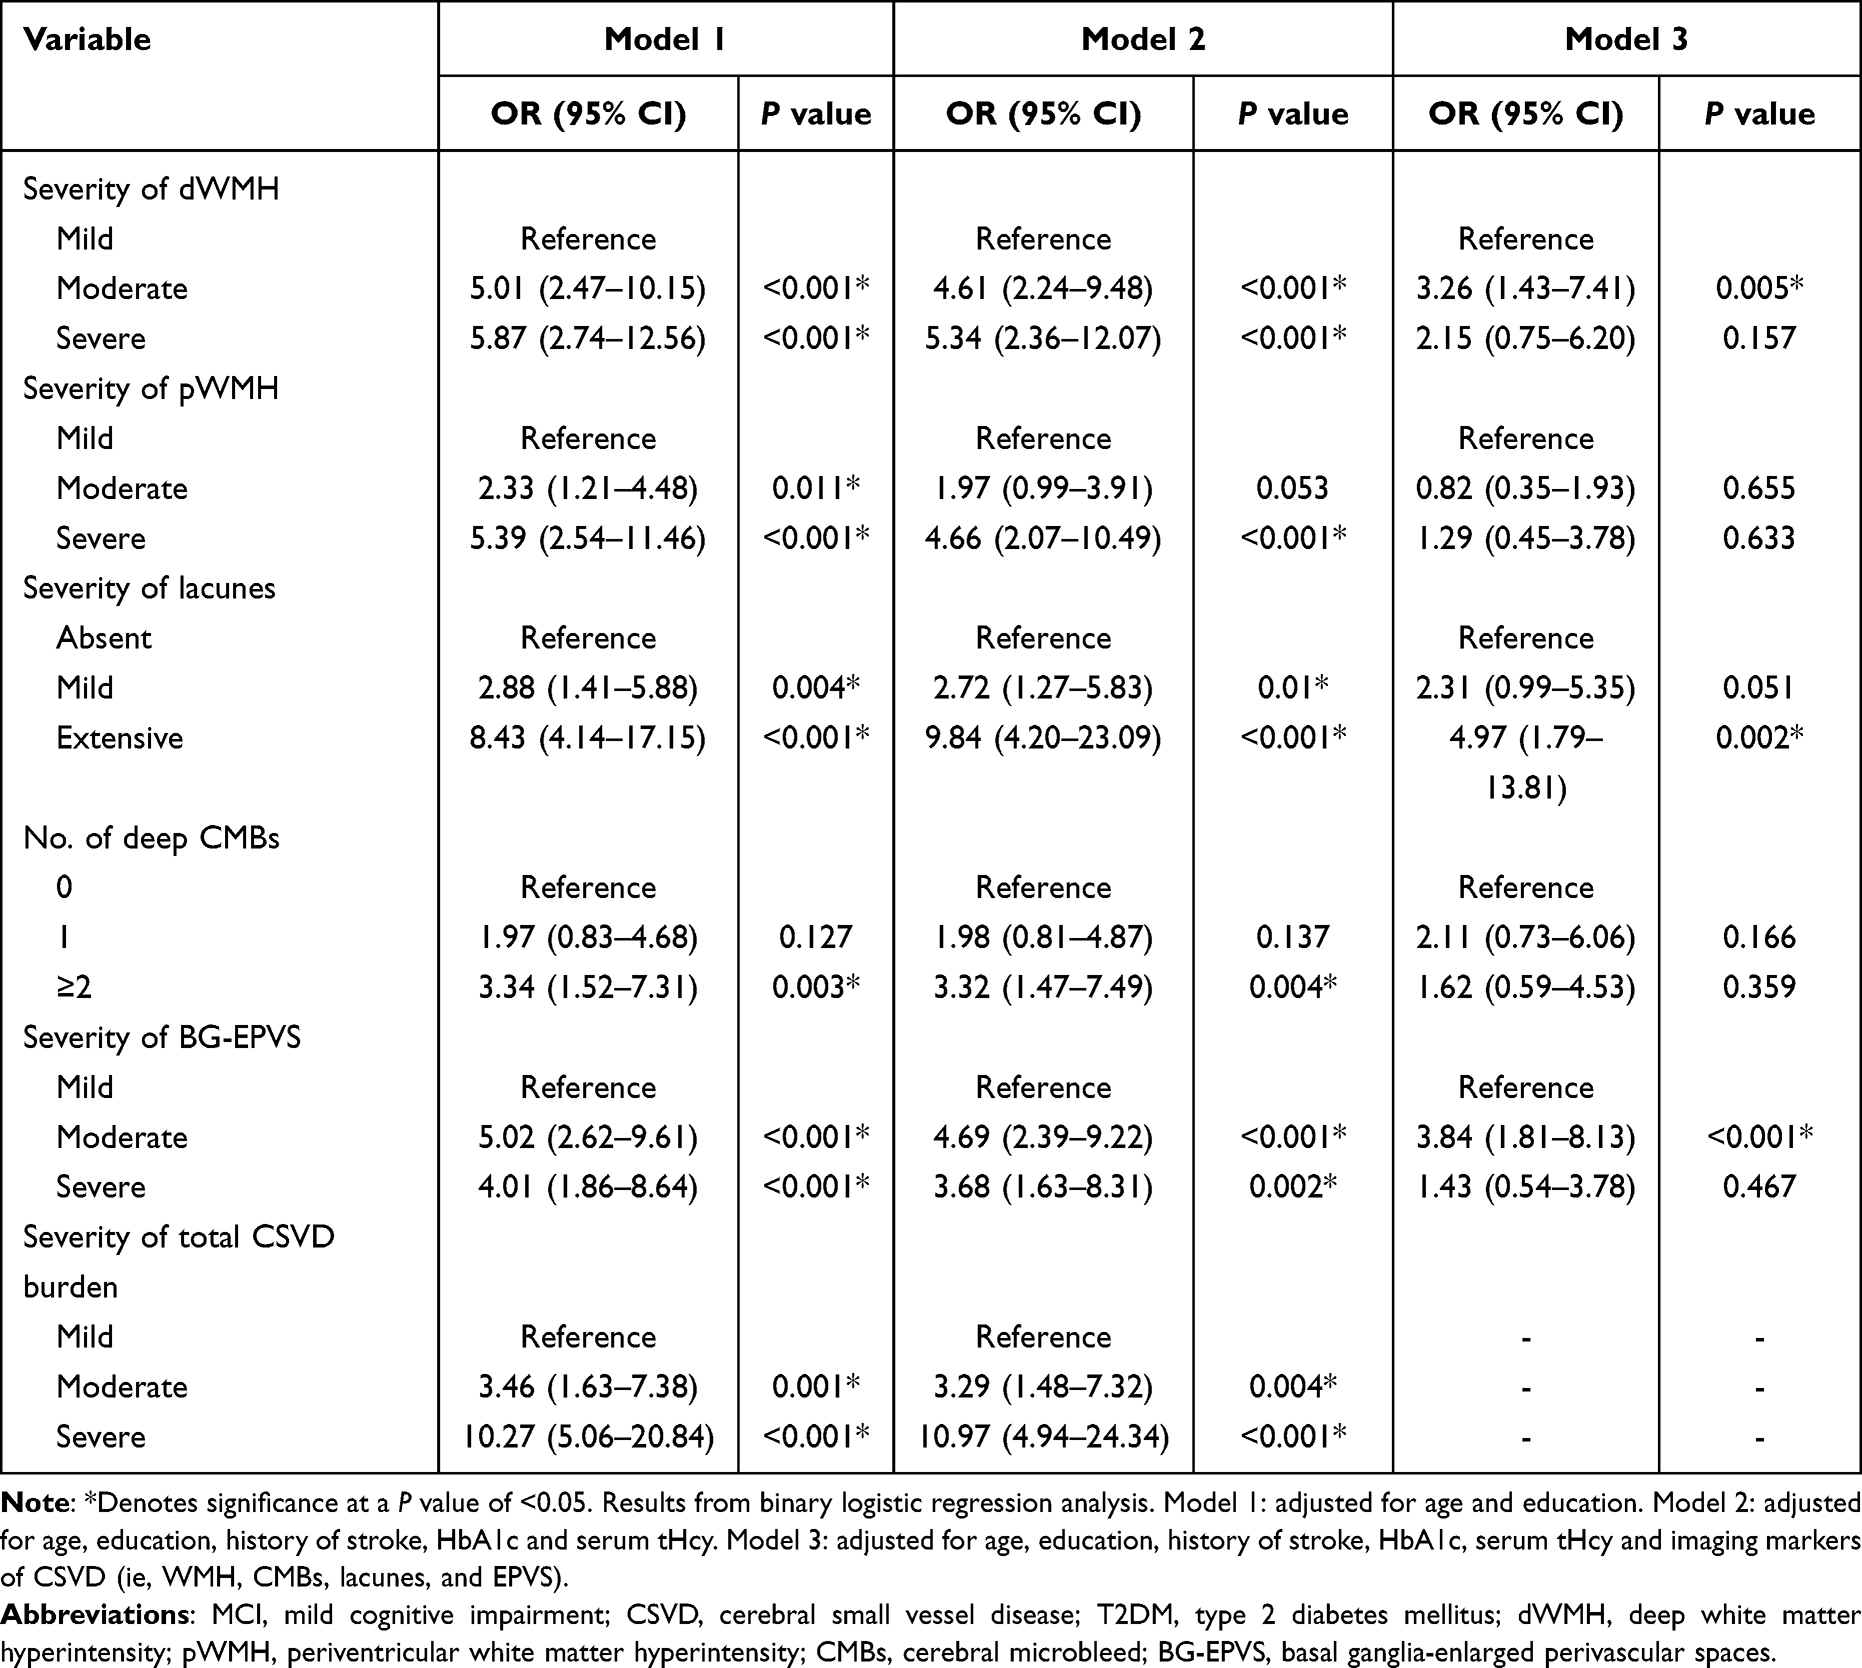 |
Table 3 Analysis of the Association Between Different Imaging Markers of CSVD and MCI in Patients with T2DM |
Different Imaging Markers of CSVD and MoCA Scores in Patients with T2DM
Assessment of the relationship between MoCA scores and the burdens of different imaging markers of CSVD revealed a negative correlation between MoCA scores and the severity of dWMH (P<0.001, P for trend <0.001) and pWMH (P<0.001, P for trend <0.001). MoCA scores displayed a close relationship with the severity of lacunes (P<0.001, P for trend <0.001), BG-EPVS (P<0.001, P for trend <0.001), and number of deep CMBs (P=0.007, P for trend =0.002). There was a trend for significant decrease in MoCA scores with increase in total CSVD burden (P<0.001, P for trend <0.001). There was no association between MoCA scores and lobar CMBs (P=0.552, p for trend =0.362) and CSO-EPVS (P= 0.093, P for trend =0.073) (Figure 1).
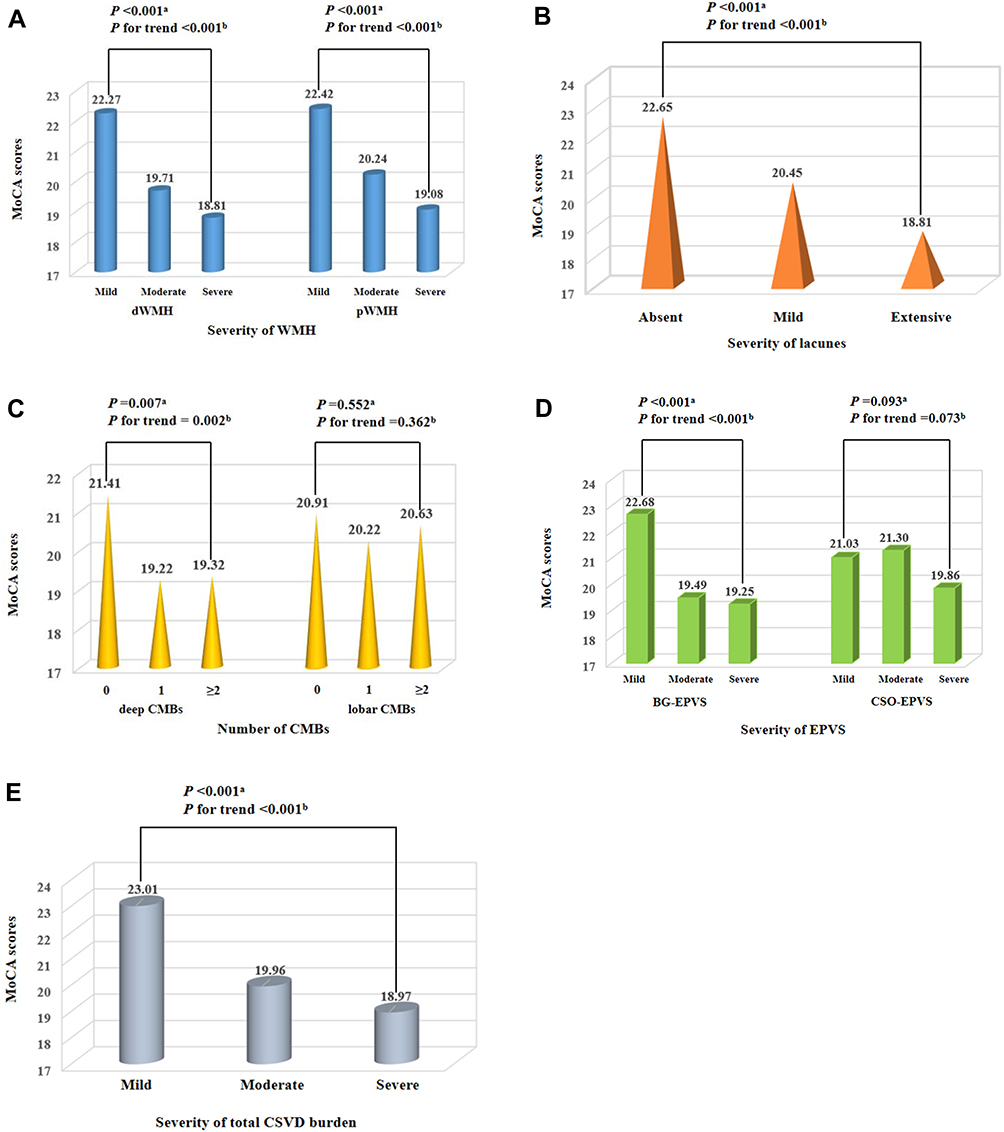 |
Figure 1 Distribution of mean values of MoCA scores according to WMH, lacunes, CMBs, EPVS and total CSVD burden. MoCA scores were negatively associated with the severity of WMH (both of dWMH and pWMH), lacunes, deep CMBs, BG-EPVS, and total CSVD burden ((A–E) respectively). Abbreviations: CSVD, cerebral small vessel disease; dWMH, deep white matter hyperintensity; pWMH, periventricular white matter hyperintensity; CMBs, cerebral microbleeds; BG-EPVS, basal ganglia-enlarged perivascular spaces; CSO-EPVS, centrum semiovale-enlarged perivascular spaces. Notes: aKruskal–Wallis test; bJonckheere–Terpstra test. |
Discussion
In this study, we investigated the association between individual imaging markers of CSVD, total CSVD burden and MCI in patients with T2DM. We found that moderate or severe total CSVD burden, moderate dWMH, extensive lacunes, and moderate BG-EPVS were associated with an increased risk of MCI in patients with T2DM after adjusting for potential confounders. In addition, the more severe imaging markers of CSVD (ie, total CSVD burden, WMH, lacunes, deep CMBs and BG-EPVS) were associated with lower MoCA scores in patients with T2DM. Taken together, these findings indicated that the severity of imaging markers of CSVD may be a potential biomarker of MCI in patients with T2DM. Moreover, our results may provide clues for future studies to explore early diagnostic imaging markers of cognitive impairment in patients with T2DM.
Although T2DM has been shown to increase the risk of cognitive impairment, the underlying mechanisms of this association are still uncertain.5,27 Underlying mechanisms proposed to explain the association between T2DM and cognitive impairment include endothelial dysfunction, blood–brain barrier dysfunction, inflammation, and insulin resistance.5,27–29 Interestingly, these mechanisms seem to be pivotal factors contributing to the pathogenesis and development of CSVD,9,30,31 which is a prominent cause of cognitive impairment.32 However, it should be noted that few studies have comprehensively explored the association between various CSVD components and cognitive dysfunction (particularly MCI) in relation to T2DM.
As suggested by previous studies, EPVS is an imaging marker of CSVD and an important component of the brain glymphatic system, which is known to be related to cognitive decline and dementia.33,34 And there is increasing evidence that T2DM could impair the brain glymphatic system and consequently provoke the development of cognitive impairment.35 A few recent studies have explored the association between EPVS and cognitive impairment in T2DM patients. Zhao et al suggested that subcortical EPVS is independently associated with cognitive impairment in patients with T2DM.36 Nevertheless, another study indicated that BG-EPVS severity, rather than CSO-EPVS, may be a potential imaging biomarker of cognitive impairment in T2DM patients.37 In this study, we also found BG-EPVS was associated with MCI after adjusting for potential confounders, which may provide further evidence for understanding the different pathologies between CSO-EPVS and BG-EPVS in patients with T2DM.
In line with the results of previous studies, we found that the severity of WMH or lacunes was associated with cognitive impairment in patients with T2DM.38,39 Moreover, the increase in WMH volume39,40 or integrity disruptions of WMH41 was related to worse cognition such as processing speed and executive function in T2DM. However, those studies did not further separately distinguish WMH location (pWMH or dWMH) and degree of cognitive impairment (MCI or dementia), although it is suggested different WMH locations may have different effects on MCI.42 More importantly, other markers of CSVD, such as CMBs or EPVS, were not discussed in those studies, although previous studies suggested that CMBs or EPVS may be involved in cognitive impairment in relation to T2DM.37,43 In our study, we found that both dWMH and pWMH were associated with MCI in patients with T2DM after adjusting for age and education. Additionally, we observed weaker associations between MCI and the severity of dWMH or pWMH after further controlling history of stroke, HbA1c and serum tHcy. Of note, when other imaging markers of CSVD were taken into account, the associations between MCI and pWMH or severe dWMH were not found in our study. Similar results were observed in our study between MCI and lacunes, CMBs, or EPVS, which suggested that there exist interactions among different imaging markers of CSVD.
In contrast to previous studies, an important strength of our study was that we assessed the association between total CSVD burden and MCI in patients with T2DM. To our knowledge, this is the first study to explore the association between total CSVD burden and MCI in the T2DM population. As mentioned above, there are interactions between various imaging markers of CSVD. Therefore, to better capture the overall effect of CSVD on the brain, a total CSVD burden score was mentioned and recommended in substantial literature.12,21 Additionally, lines of evidence suggest that the total CSVD burden score may be a pragmatic and useful predictor of cognitive impairment in older people.11,21 In the present study, we observed the severity of total CSVD burden was associated with MCI after adjustment for potential confounders, which suggested that total CSVD burden score may be a potential biomarker of MCI in patients with T2DM. In addition, we also found the severity of total CSVD burden was negatively associated with MoCA scores, which suggested that increased total CSVD burden may accelerate the progression of cognitive impairment, but this association requires more longitudinal studies to verify.
The main strength of our study is the detailed assessment of all components of CSVD, especially the total CSVD burden score. Another advantage is that the T2DM population with MCI, which is recognized as a transitional stage between normal cognition and dementia, was enrolled in our study. However, some limitations should be acknowledged in our study. Firstly, due to the cross-sectional design of this study, we were unable to investigate causality. Secondly, the study was conducted in a single center with a small sample size. Finally, other potential confounders, such as different antihyperglycemic drugs that may have an impact on cognitive impairment, were not taken into account. They may bias our analysis in the study. Future large prospective studies are needed to address these issues.
Conclusion
In summary, we found that different imaging markers of CSVD, especially total CSVD burden, were associated with MCI in patients with T2DM. In addition, we observed the severity of individual imaging markers of CSVD (ie, WMH, lacunes, deep CMBs and BG-EPVS) and total CSVD burden were negatively associated with MoCA scores. Our findings may provide clues for future studies to explore early diagnostic imaging markers of cognitive impairment in patients with T2DM.
Ethical Approval
The study followed the principles in the Declaration of Helsinki and was approved by the Ethical Committees of Hebei General Hospital (No. 2022051). We promised that the data of the participants were anonymized or maintained with confidentiality, and the rights or interests of participants were not invaded. Therefore, the requirement for informed consent in this study was waived in accordance with the national legislation and the institutional requirements.
Disclosure
The authors report no conflicts of interest in this work.
References
1. American Diabetes Association. 12. Older adults: standards of medical care in diabetes-2021. Diabetes Care. 2021;44(Suppl1):S168–S179. doi:10.2337/dc21-S012
2. Biessels GJ, Whitmer RA. Cognitive dysfunction in diabetes: how to implement emerging guidelines. Diabetologia. 2020;63(1):3–9. doi:10.1007/s00125-019-04977-9
3. Biessels GJ, Strachan MW, Visseren FL, Kappelle LJ, Whitmer RA. Dementia and cognitive decline in type 2 diabetes and prediabetic stages: towards targeted interventions. Lancet Diabetes Endocrinol. 2014;2(3):246–255. doi:10.1016/S2213-8587(13)70088-3
4. Schnaider BM, Goldbourt U, Silverman JM, et al. Diabetes mellitus in midlife and the risk of dementia three decades later. Neurology. 2004;63(10):1902–1907. doi:10.1212/01.wnl.0000144278.79488.dd
5. Srikanth V, Sinclair AJ, Hill-Briggs F, Moran C, Biessels GJ. Type 2 diabetes and cognitive dysfunction-towards effective management of both comorbidities. Lancet Diabetes Endocrinol. 2020;8(6):535–545. doi:10.1016/S2213-8587(20)30118-2
6. Rawlings AM, Sharrett AR, Albert MS, et al. The Association of late-life diabetes status and hyperglycemia with incident mild cognitive impairment and dementia: the ARIC study. Diabetes Care. 2019;42(7):1248–1254. doi:10.2337/dc19-0120
7. You Y, Liu Z, Chen Y, et al. The prevalence of mild cognitive impairment in type 2 diabetes mellitus patients: a systematic review and meta-analysis. Acta Diabetol. 2021;58(6):671–685. doi:10.1007/s00592-020-01648-9
8. Xu W, Caracciolo B, Wang HX, et al. Accelerated progression from mild cognitive impairment to dementia in people with diabetes. Diabetes. 2010;59(11):2928–2935. doi:10.2337/db10-0539
9. Wardlaw JM, Smith C, Dichgans M. Small vessel disease: mechanisms and clinical implications. Lancet Neurol. 2019;18(7):684–696. doi:10.1016/S1474-4422(19)30079-1
10. Wardlaw JM, Smith EE, Biessels GJ, et al. Neuroimaging standards for research into small vessel disease and its contribution to ageing and neurodegeneration. Lancet Neurol. 2013;12(8):822–838. doi:10.1016/S1474-4422(13)70124-8
11. Li X, Yuan J, Qin W, et al. Higher total cerebral small vessel disease burden was associated with mild cognitive impairment and overall cognitive dysfunction: a propensity score-matched case-control study. Front Aging Neurosci. 2021;13:695732. doi:10.3389/fnagi.2021.695732
12. Staals J, Makin SD, Doubal N, Dennis MS, Wardlaw JM. Stroke subtype, vascular risk factors, and total MRI brain small-vessel disease burden. Neurology. 2014;83(14):1228–1234.
13. Biessels GJ, Nobili F, Teunissen CE, Simo R, Scheltens P. Understanding multifactorial brain changes in type 2 diabetes: a biomarker perspective. Lancet Neurol. 2020;19(8):699–710. doi:10.1016/S1474-4422(20)30139-3
14. Gerstein HC, Smith EE, Ramasundarahettige C, et al. Diabetes, brain infarcts, cognition, and small vessels in the Canadian Alliance for Healthy Hearts and Minds Study. J Clin Endocrinol Metab. 2021;106(2):e891–e898. doi:10.1210/clinem/dgaa815
15. Alberti KG, Zimmet PZ. Definition, diagnosis and classification of diabetes mellitus and its complications. Part 1: diagnosis and classification of diabetes mellitus provisional report of a WHO consultation. Diabet Med. 1998;15(7):539–553. doi:10.1002/(SICI)1096-9136(199807)15:7<539::AID-DIA668>3.0.CO;2-S
16. Teng Z, Feng J, Qi Q, et al. Long-term use of metformin is associated with reduced risk of cognitive impairment with alleviation of cerebral small vessel disease burden in patients with Type 2 diabetes. Front Aging Neurosci. 2021;13:773797. doi:10.3389/fnagi.2021.773797
17. Fazekas F, Kleinert R, Offenbacher H, et al. Pathologic correlates of incidental MRI white matter signal hyperintensities. Neurology. 1993;43(9):1683–1689. doi:10.1212/wnl.43.9.1683
18. Lee SH, Bae HJ, Ko SB, et al. Comparative analysis of the spatial distribution and severity of cerebral microbleeds and old lacunes. J Neurol Neurosurg Psychiatry. 2004;75(3):423–427. doi:10.1136/jnnp.2003.015990
19. Gregoire SM, Chaudhary UJ, Brown MM, et al. The Microbleed Anatomical Rating Scale (MARS): reliability of a tool to map brain microbleeds. Neurology. 2009;73(21):1759–1766. doi:10.1212/WNL.0b013e3181c34a7d
20. Doubal FN, MacLullich AM, Ferguson KJ, Dennis MS, Wardlaw JM. Enlarged perivascular spaces on MRI are a feature of cerebral small vessel disease. Stroke. 2010;41(3):450–454. doi:10.1161/STROKEAHA.109.564914
21. Staals J, Booth T, Morris Z, et al. Total MRI load of cerebral small vessel disease and cognitive ability in older people. Neurobiol Aging. 2015;36(10):2806–2811. doi:10.1016/j.neurobiolaging.2015.06.024
22. Huijts M, Duits A, van Oostenbrugge RJ, et al. Accumulation of MRI markers of cerebral small vessel disease is associated with decreased cognitive function. a study in first-ever lacunar stroke and hypertensive patients. Front Aging Neurosci. 2013;5:72. doi:10.3389/fnagi.2013.00072
23. Lau KK, Li L, Schulz U, et al. Total small vessel disease score and risk of recurrent stroke: validation in 2 large cohorts. Neurology. 2017;88(24):2260–2267. doi:10.1212/WNL.0000000000004042
24. Kim JM, Park KY, Kim HR, et al. Association of bone mineral density to cerebral small vessel disease burden. Neurology. 2021;96(9):e1290–e1300. doi:10.1212/WNL.0000000000011526
25. Albert MS, DeKosky ST, Dickson D, et al. The diagnosis of mild cognitive impairment due to Alzheimer’s disease: recommendations from the National Institute on Aging-Alzheimer’s Association workgroups on diagnostic guidelines for Alzheimer’s disease. Alzheimers Dement. 2011;7(3):270–279. doi:10.1016/j.jalz.2011.03.008
26. Lu J, Li D, Li F, et al. Montreal cognitive assessment in detecting cognitive impairment in Chinese elderly individuals: a population-based study. J Geriatr Psychiatry Neurol. 2011;24(4):184–190. doi:10.1177/0891988711422528
27. Biessels GJ, Despa F. Cognitive decline and dementia in diabetes mellitus: mechanisms and clinical implications. Nat Rev Endocrinol. 2018;14(10):591–604. doi:10.1038/s41574-018-0048-7
28. Kullmann S, Kleinridders A, Small DM, et al. Central nervous pathways of insulin action in the control of metabolism and food intake. Lancet Diabetes Endocrinol. 2020;8(6):524–534. doi:10.1016/S2213-8587(20)30113-3
29. Chen YC, Lu BZ, Shu YC, Sun YT. Spatiotemporal dynamics of cerebral vascular permeability in Type 2 diabetes-related cerebral microangiopathy. Front Endocrinol. 2021;12:805637. doi:10.3389/fendo.2021.805637
30. Quick S, Moss J, Rajani RM, Williams A. A vessel for change: endothelial dysfunction in cerebral small vessel disease. Trends Neurosci. 2021;44(4):289–305. doi:10.1016/j.tins.2020.11.003
31. Low A, Mak E, Rowe JB, Markus HS, O’Brien JT. Inflammation and cerebral small vessel disease: a systematic review. Ageing Res Rev. 2019;53:100916. doi:10.1016/j.arr.2019.100916
32. Hamilton O, Backhouse EV, Janssen E, et al. Cognitive impairment in sporadic cerebral small vessel disease: a systematic review and meta-analysis. Alzheimers Dement. 2021;17(4):665–685. doi:10.1002/alz.12221
33. Mestre H, Kostrikov S, Mehta RI, Nedergaard M. Perivascular spaces, glymphatic dysfunction, and small vessel disease. Clin Sci (Lond). 2017;131(17):2257–2274. doi:10.1042/CS20160381
34. Rasmussen MK, Mestre H, Nedergaard M. The glymphatic pathway in neurological disorders. Lancet Neurol. 2018;17(11):1016–1024. doi:10.1016/S1474-4422(18)30318-1
35. Zhang L, Chopp M, Jiang Q, Zhang Z. Role of the glymphatic system in ageing and diabetes mellitus impaired cognitive function. Stroke Vasc Neurol. 2019;4(2):90–92. doi:10.1136/svn-2018-000203
36. Zhao H, Wang F, Luo GH, et al. Assessment of structural brain changes in patients with type 2 diabetes mellitus using the MRI-based brain atrophy and lesion index. Neural Regen Res. 2022;17(3):618–624. doi:10.4103/1673-5374.320996
37. Choi EY, Park YW, Lee M, et al. Magnetic resonance imaging-visible perivascular spaces in the basal ganglia are associated with the diabetic retinopathy stage and cognitive decline in patients With Type 2 diabetes. Front Aging Neurosci. 2021;13:666495. doi:10.3389/fnagi.2021.666495
38. Imamine R, Kawamura T, Umemura T, et al. Does cerebral small vessel disease predict future decline of cognitive function in elderly people with type 2 diabetes? Diabetes Res Clin Pract. 2011;94(1):91–99. doi:10.1016/j.diabres.2011.06.014
39. van Gennip A, Stehouwer C, van Boxtel M, et al. Association of Type 2 diabetes, according to the number of risk factors within target range, with structural brain abnormalities, cognitive performance, and risk of dementia. Diabetes Care. 2021;44(11):2493–2502. doi:10.2337/dc21-0149
40. Mankovsky B, Zherdova N, van den Berg E, Biessels GJ, de Bresser J. Cognitive functioning and structural brain abnormalities in people with Type 2 diabetes mellitus. Diabet Med. 2018;35(12):1663–1670. doi:10.1111/dme.13800
41. Zhang J, Wang Y, Wang J, et al. White matter integrity disruptions associated with cognitive impairments in type 2 diabetic patients. Diabetes. 2014;63(11):3596–3605. doi:10.2337/db14-0342
42. Jimenez-Balado J, Riba-Llena I, Abril O, et al. Cognitive impact of cerebral small vessel disease changes in patients with hypertension. Hypertension. 2019;73(2):342–349. doi:10.1161/HYPERTENSIONAHA.118.12090
43. Zhou H, Yang J, Xie P, et al. Cerebral microbleeds, cognitive impairment, and MRI in patients with diabetes mellitus. Clin Chim Acta. 2017;470:14–19. doi:10.1016/j.cca.2017.04.019
 © 2022 The Author(s). This work is published and licensed by Dove Medical Press Limited. The full terms of this license are available at https://www.dovepress.com/terms.php and incorporate the Creative Commons Attribution - Non Commercial (unported, v3.0) License.
By accessing the work you hereby accept the Terms. Non-commercial uses of the work are permitted without any further permission from Dove Medical Press Limited, provided the work is properly attributed. For permission for commercial use of this work, please see paragraphs 4.2 and 5 of our Terms.
© 2022 The Author(s). This work is published and licensed by Dove Medical Press Limited. The full terms of this license are available at https://www.dovepress.com/terms.php and incorporate the Creative Commons Attribution - Non Commercial (unported, v3.0) License.
By accessing the work you hereby accept the Terms. Non-commercial uses of the work are permitted without any further permission from Dove Medical Press Limited, provided the work is properly attributed. For permission for commercial use of this work, please see paragraphs 4.2 and 5 of our Terms.