")
Back to Journals » Diabetes, Metabolic Syndrome and Obesity » Volume 15
Central Obesity and Associated Factors Among Urban Adults in Dire Dawa Administrative City, Eastern Ethiopia
Authors Israel E, Hassen K, Markos M , Wolde K, Hawulte B
Received 21 November 2021
Accepted for publication 16 February 2022
Published 25 February 2022 Volume 2022:15 Pages 601—614
DOI https://doi.org/10.2147/DMSO.S348098
Checked for plagiarism Yes
Review by Single anonymous peer review
Peer reviewer comments 3
Editor who approved publication: Prof. Dr. Juei-Tang Cheng
Ephrem Israel,1 Kalkidan Hassen,2 Melese Markos,3 Kiber Wolde,4 Bahailu Hawulte5
1Dire Dawa Regional Health Bureau, Dire Dawa City Administration, Dire Dawa, Ethiopia; 2Department of Population and Family Health, Institute of Health Science, Jimma University, Jimma, Ethiopia; 3Department of Public Health, College of Health and Medical Science, Wachemo University Durame Campus, Durame, Ethiopia; 4Department of Public Health, College of Medicine and Health Science, Dire Dawa University, Dire Dawa, Ethiopia; 5School of Public Health, College of Medicine and Health Science, Haramaya University, Harar, Ethiopia
Correspondence: Ephrem Israel, Dire Dawa Regional Health Bureau, Dire Dawa City Administration, P. O. Box 1377, Dire Dawa, Ethiopia, Tel +251 913285488, Email [email protected]
Background: Central obesity (CO) is a medical problem in which extra fat is accumulated in the abdomen and stomach extent that it may harm health. Furthermore, previous studies in Ethiopia predominantly relied on body mass index used to measure obesity and do not show distribution of fat. However, there is a paucity of information on the measurement of central obesity using waist circumference and associated factors in Ethiopia particularly in the study area. Hence, the purpose of this study is to assess the prevalence of central obesity and associated factors among urban adults in Dire Dawa, administrative city, Eastern Ethiopia.
Methods: A community-based cross-sectional study was conducted among 633 adults in selected kebeles of administrative city from October 15 to November 15, 2020. A multistage and systematic sampling procedure was used to select study participants. Central obesity is defined as a condition with waist circumference ≥ 83.7 cm for men and ≥ 78 cm for women with or without general obesity (GO). Odds ratio along with 95% confidence interval was estimated to identify factors associated with central obesity using multiple logistic regression analysis.
Results: The overall prevalence of central obesity was 76.1%; at 95% CI (73%, 80%). Associated factors of central obesity were age 45 years and above [AOR = 3.75, 95% CI (1.86, 7.55)], being female [AOR = 2.52, 95% CI: (1.62, 3.94)], alcohol consumption [AOR = 2.61, 95% CI: (1.69, 4.05], physical inactivity [AOR = 2.05, 95% CI: (1.23, 3.42)], and two hour and more time spent on watching television [AOR = 3.30, 95% CI: (1.59, 6.82)].
Conclusion: The study shows central obesity was high in the study area. Age 45 years and above, being females, married, physically inactive, alcohol consumption, and spending a long time watching television was associated with central obesity. Having regular physical activity, limiting alcohol drinking, and limiting time spent watching television were recommended to prevent central obesity and associated risk among adults.
Keywords: central obesity, prevalence, associated factors, Eastern Ethiopia
Plain Language Summary
Central obesity (CO) is a health problem in which extra fat is collected in the abdomen and stomach extent that it may harm health and/or increase health complications. Obesity is now a worldwide epidemic, with an estimated 57.8% of adults, expected to be classified obese by 2030, according to the World Health Organization.
Participants were asked to report their frequency of consumption number of times consumed weekly. Household Food Insecurity access scale (HFIAS) was used to measure the reference period of four weeks to assess nutritional intake of individuals using FAO-FANTA III and the level of physical activity was measured from the Global Physical Activity Questionnaire analysis guide. The food frequency questionnaire (FFQ) was modified from the WHO-STEP wise approach to assessing the dietary habits of the study population. The FFQ consisted of 12 food groups.
Of the total 633 study participants, the data was collected from 611 study participants which yield a response rate of 96.5%. Of these, more than one-third of the study participants, 435 (71.2%) were females, and more than half of the study participants, 383 (62.7%) had family size 4 and more and with the mean (+SD) age of the respondents were 37.6 (+12.08).
The prevalence of central obesity was significantly higher among females than males (57.1% vs 19%) correlates of central obesity found to be Age 45 years and above, being female, alcohol consumption, physical inactivity, and two hours and more time spent on watching television.
In Conclusion, the results revealed a high prevalence of central obesity among adults of Dire Dawa. In this population. Promotion of having regular physical activity, limiting alcohol drinking, and time spent watching television was recommended to prevent central obesity and associated risk among adults.
Background
Central obesity (CO) also known as abdominal or visceral obesity is a medical problem in which excess fat has accumulated in the abdomen to the extent that it may harm health and/or increase medical problems.1
Obesity is nowadays a universal epidemic, with a probable 57.8% of adults, estimated to be classified obese by 2030, by the World Health Organization,2,3 and the prevalence in Africa is estimated at 20–50% by 2025.4
Ethiopia is also one of the lower-income countries in Africa experiencing a double burden including malnutrition and moving from underweight to overweight/obesity especially in urban Setting.5 According to the 2014 estimation of WHO, 1.2% of men and 6.0% of females were either overweight or obese in Ethiopia. Between 1997 and 2016, the collective prevalence in the country increased significantly from 2.6 to 6.9% in females and, from 0.6 to 1.9% in males,6 and according to the EDHS 2011 found that the prevalence of overweight and obesity for urban settings was 12.1% and 2.8%, respectively.7
Worldwide have faced a growing “epidemic” of abdominal obesity (AO).8 The prevalence of this form of obesity is growing extremely in industrialized countries as well as in unindustrialized countries.9
In developed countries, the prevalence of abdominal obesity shows dramatically increasing for instance in Germany, Spain, and the United States of America it was found to be 33.9%,36%, and 56% respectively.10–12 Another different study shows, in the United States of America, an increase over time, 46.4% among men and females is 65.4%. In China, enlarged from 8.5 to 27.8% among males and from 27.8 to 45.9% females, in Nigeria increased from 3.2 among males to 39.2 among females.12–14
Whereas central obesity ranges from 24.4% in Dilla, to 41.7% in Mekelle. It is 33.5%, 37.6% in Addis Ababa and Gondar respectively.15–18
Several factors are associated with central obesity. These include genetic factors, socio-economic factors, behavioral and environmental factors.8 Disbursement of body fat is known to be a more independent and potent factor of disease and death, than total adiposity.
Obesity is known to be associated with many health circumstances.19 However, central obesity is directly associated with increased Visceral abdominal fat and associates highly with hypertension, diabetes, dyslipidemia, metabolic syndrome, and coronary heart disease independent of body mass index (BMI) and it is a significant predictor.20
Central obesity is related to death and illness, bigger disability, reduced quality of life, and increased health expenses.21–25
Sedentary lifestyle, energy-reach diets, increasing urbanization, and changing modes of transportation are driving factors for a growing of abdominal obesity, which is associated with an increased cardiovascular risk.6,26
Validated measures of obesity and body fat include; Body mass index (BMI), the waist-height ratio (WHtR), waist-hip ratio (WHpR), and waist circumference (WC),27 and Advanced highly sensitive diagnostic tools like Computed tomography (CT), Magnetic resonance and Dual Energy X-ray Absorption (DEXA) are available, due to high cost and technical difficulties, this is not feasible method to be used for the general population as an epidemiological tool.28 Neck Circumference (NC) emerges as a novel, simple, and discrete upper body measurement which differentiates between obese and non-obese.27 Moreover, several studies demonstrated the validity of NC as a measure of metabolic syndrome (MetS), as it correlates positively with the classical anthropometric indices such as BMI, WC, and WHtR.29
A comparative evaluation of waist circumference, weight-to-hip ratio, and BMI showed that waist circumference was presuming to both weight-to-hip ratio and BMI in the estimate of single and various cardiovascular illness risk factors.30
Like many developing countries, Ethiopia is facing the costs of epidemiologic, demographic, financial, and nutrition changes which continue to favor the emergence of an epidemic of chronic non-communicable diseases.31
Studies in Ethiopia show that the increasing occurrence of hypertension, diabetes, and death from chronic NCDS stated supports the evidence that Ethiopia is facing the disease burden observed in other Sub-Saharan African countries.32
Even though some studies which were conducted in different parts of Ethiopia represent the presence of high prevalence of overnutrition (overweight or obesity) among adults, predominantly relied on BMI as a measure of obesity or overweight among adults, however, BMI does not distinguish weight gain due to extra fat accumulation or high muscle mass in the body.33
Moreover, central obesity alone can help to determine the risk of getting obesity-related disorders/cardiometabolic risks. However, to the best of our knowledge, there has been little literature about the prevalence of central obesity and associated factors in Ethiopia.
Hence, this study aims to assess the prevalence of central obesity and factors among urban adults in Dire Dawa, administrative city, Eastern Ethiopia.
Methods and Materials
Study Setting and Design
A community-based cross-sectional study was used in Dire Dawa city Administration from October 15 to November 15, 2020.
Dire Dawa is located at a distance of 550 Km from Addis Ababa, the capital city of Ethiopia. The Dire Dawa administrative council consists of nine urban and thirty-eight rural kebeles. According to Central Statistical Agency34 in 2013, the total population of the administration was 405,444 of which 263,827 were urban population, and Adult is 52% out of the urban population.35
Population and Eligibility Criteria
All adults aged 18 years and above who live in Dire Dawa urban kebeles were the source population. Adults aged 18 and above who were living in randomly selected urban kebeles in Dire Dawa were the study population. Adults aged 18 years and above who existed in Dire Dawa for greater than six months before the survey were included in the study. Those adults critically ill, pregnant women, adults with complicated medical problems, and who were physically disabled were excluded from the study since it could lead to difficulty in the measure anthropometry.
Sample Size Determination and Sampling Procedure
The sample size was calculated using both single and double population proportion formula,

Then with the following assumptions; 50% expected prevalence of central obesity among adults, Confidence level to be 1.96 and level of significance (α=5%), degree of precision (d) 0.05, and 10% for non-response, and design effect 1.5. Hence, yielding the final sample size of 633. While the sample size for the double population proportion was estimated using the sample size for a cross-sectional study to compare the risk of central obesity for factors under Epi-info version 7.3.2 software. We assumed a 95% confidence level, 80% power, exposed to an unexposed sample ratio of 1. Finally taking the larger sample size estimated based on the above calculations, a total of 633 adults sample were required for these study.
The multistage sampling procedure was used in this research; at stage one, four kebeles were randomly selected from the entire nine urban kebeles using the lottery method; at stage two, the household was selected after obtaining sampling frame from each kebeles administration, and a total of 633 households were allocated to four selected kebele based on proportional to their household size.
Then, a systematic sampling technique was used to choose households to be visited for data collection. Interval (kth) for choosing households was determined by dividing the number of households by the entire sample size. After determining the kth interval i’e k=53, then the starting households between 1 and 53 is further selected by lottery methods and finally, the next households were identified by systematically every 53th households from each kebele and if there is above one suitable respondent were found in the selected household, only one respondent was chosen by lottery method. In cases where suitable will be not found in the selected household, a revisit was done a minimum of three times, and finally if they were not present considered as non-respondent.
Data Collection and Measurements
The data were collected through face-to-face interviewer-administered pretested structured questionnaires from an adult living in sampled households. About information on sociodemographic characteristics, behavioral, nutritional, and lifestyle characteristics, and health-related factors. The questionnaire was adapted from WHO-Step wise approach to chronic disease risk factor surveillance, used after minor modifications for study environments,36 and other reviewed literature. Data were collected in the morning, afternoon on works days, and weekend during which time eligible adults were expected to be at home.
Data were collected by eight health care profession holding at least a BSc degree (trained health extension worker and there was one supervisor assigned per two kebele).
Two days of intensive training were given for data collectors and supervisors on the questionnaire, interview techniques, objective of the study, and how to keep privacy and confidentiality of the data gained from participants.
Household Food Insecurity access scale (HFIAS) was used to measure the reference period of four weeks to assess nutritional intake of individuals using FAO-FANTA III37 and the level of physical activity was measured using the Global Physical Activity Questionnaire analysis guide.38 The food frequency questionnaire (FFQ) was adapted from the WHO-STEP wise approach to assessing the dietary habits of the study population. The FFQ consisted of 12 food groups. Respondents were questioned to report their frequency of consumption of food items weekly. One usual week was evaluated from the last 12 months.36 For dietary diversity, a simple sum of the number of food items has been considered.39
A Dietary Diversity Score (DDS) was built by including the intake of the food groups for one week based on the definition that it is the sum of food groups consumed over the reference period.
For instance, respondents who eat one item from each of the food groups at least once during the week would have a high DDS.40
A minimum of two meters were kept between interviewers and interviewees. All participants put on their face masks during an interview. Sanitizer and clean gloves were used while taking anthropometric data and before any forms of contact with the study participants.
Anthropometric measurement was performed using the standards of the WHO protocol for computing waist circumference. Waist circumference was measured using a non-stretchable fiber measuring tape.
The participants were requested to stand straight in a relaxed position with both feet together on a flat surface; one layer of clothing was allowed.
Waist circumference was taken approximately at the center between the lower margin of the last palpable rib and the top of the iliac crest measurements were done in triplicates, and the average was used to represent the WC of an individual, with the subject standing at the end of gentle expiration.4
Operational/Standard Definition and Measurements
Central Obesity defined as specific for Ethiopian males and females is defined as a waist circumference (WC) ≥ 83.7 cm for men and ≥ 78 cm for women with or without general obesity (GO).41 Physically activity level: If the total physical activity metabolic equal min/week is at least 600 metabolic equivalent of task (MET)-minutes were considered as active, and if the entire physical activity metabolic equivalent min/week is less than 600 MET minutes were considered as inactive.38
Wealth Index was a combined measure of a household’s accumulative living standards and calculated based on the assumption of Principal component analysis (PCA), and those variables having a communality value >0.5 were used to produce a factor score. Accordingly, households were categorized into three wealth terciles for further analysis.
Ever Smoking: Individuals considered cigarette smoking at least once or daily in their lifetime.42 Current Alcohol intake is defined as having consumed alcohol at least once in the past 30 days.43
Khat Chewing is defined as individually considered chewing khat at least once in the 30 days preceding44 High DDS is defined as the highest tertile of the one-week count intake food group, and Low DDS is defined as the lower two tertiles of the one-week count intake food group.40
Self-reported NCD is defined as Doctor has told you that suffered from this disease and/or advised treatment for the same.45
Data Processing and Analysis
The data’s Completeness and consistency were checked manually. Then data were entered into Epi- data version v3.1 statistical software; after the data were cleaned by checking for errors, impossible or doubtful values, and inconsistencies that might be due to coding or data entry errors were exported to SPSS version 20.0 software packages for analysis. Frequency distribution was generated in which the outliers and missing data were identified before further analysis.
Preliminary data analysis included descriptive statistics, ie, means and standard deviations for continuous variables and frequencies, tables, graphs, and percentages for categorical variables which describe the population characteristics.
Simple logistic regression analyses were done to identify the association between the independent variable and the outcome variable then-candidate variables were selected for the final model at p-value ≤ 0.25. Finally adjusted odds ratio (AOR) along with 95% CI were estimated to identify predictors of central obesity using multiple logistic regression analysis. The level of statistical significance was declared at a p-value < 0.05.
Ethical Consideration
Ethical approval was obtained from the Research Ethical Review Committee of Dire Dawa University. Then, to get the required support, a formal letter was written from the college of medicine and health science to the Dire Dawa administrative health bureau.
To get permission for starting data collection in the community, a further supportive letter was obtained from the Dire Dawa regional health bureau for each kebele. Voluntary written and signed consent was obtained from each study participant after informing the objective, confidentiality, right to withdrawal, benefit, and risks of the study and that this study was conducted following the Declaration of Helsinki.
The interviewers were wearing face masks. Reasonable physical distance was kept between the involved individual during data collection.
Results
Sociodemographic Characteristics
A total of 633 study participants, the data were obtained from 611 study participants which yield a response rate of 96.5%. Of those, more than one-third of the study respondents, 435 (71.2%) were females, and more than half of the study respondents, 383 (62.7%) had family size 4 and more and with the mean (+SD) age of the respondents was 37.6 (+12.08). Nearly half of the study participants 297 (48.6%) were Amhara ethnic group. Three hundred - ninety six of the participants were the marital status of married and nearly half of study participants 308 (504.4%) were Orthodox religious followers.
Almost half of the study respondents 287 (47%) were attended college and above level education, more than one-third of study.
Respondents were high-level wealth index tercile 292 (47.8%), and around one third 210 (34.4%) of the study participants were the low level of wealth tercile, more than half of study participant 444 (72.7%) were food secured and 180 (29.5%), were daily laborer (Table 1).
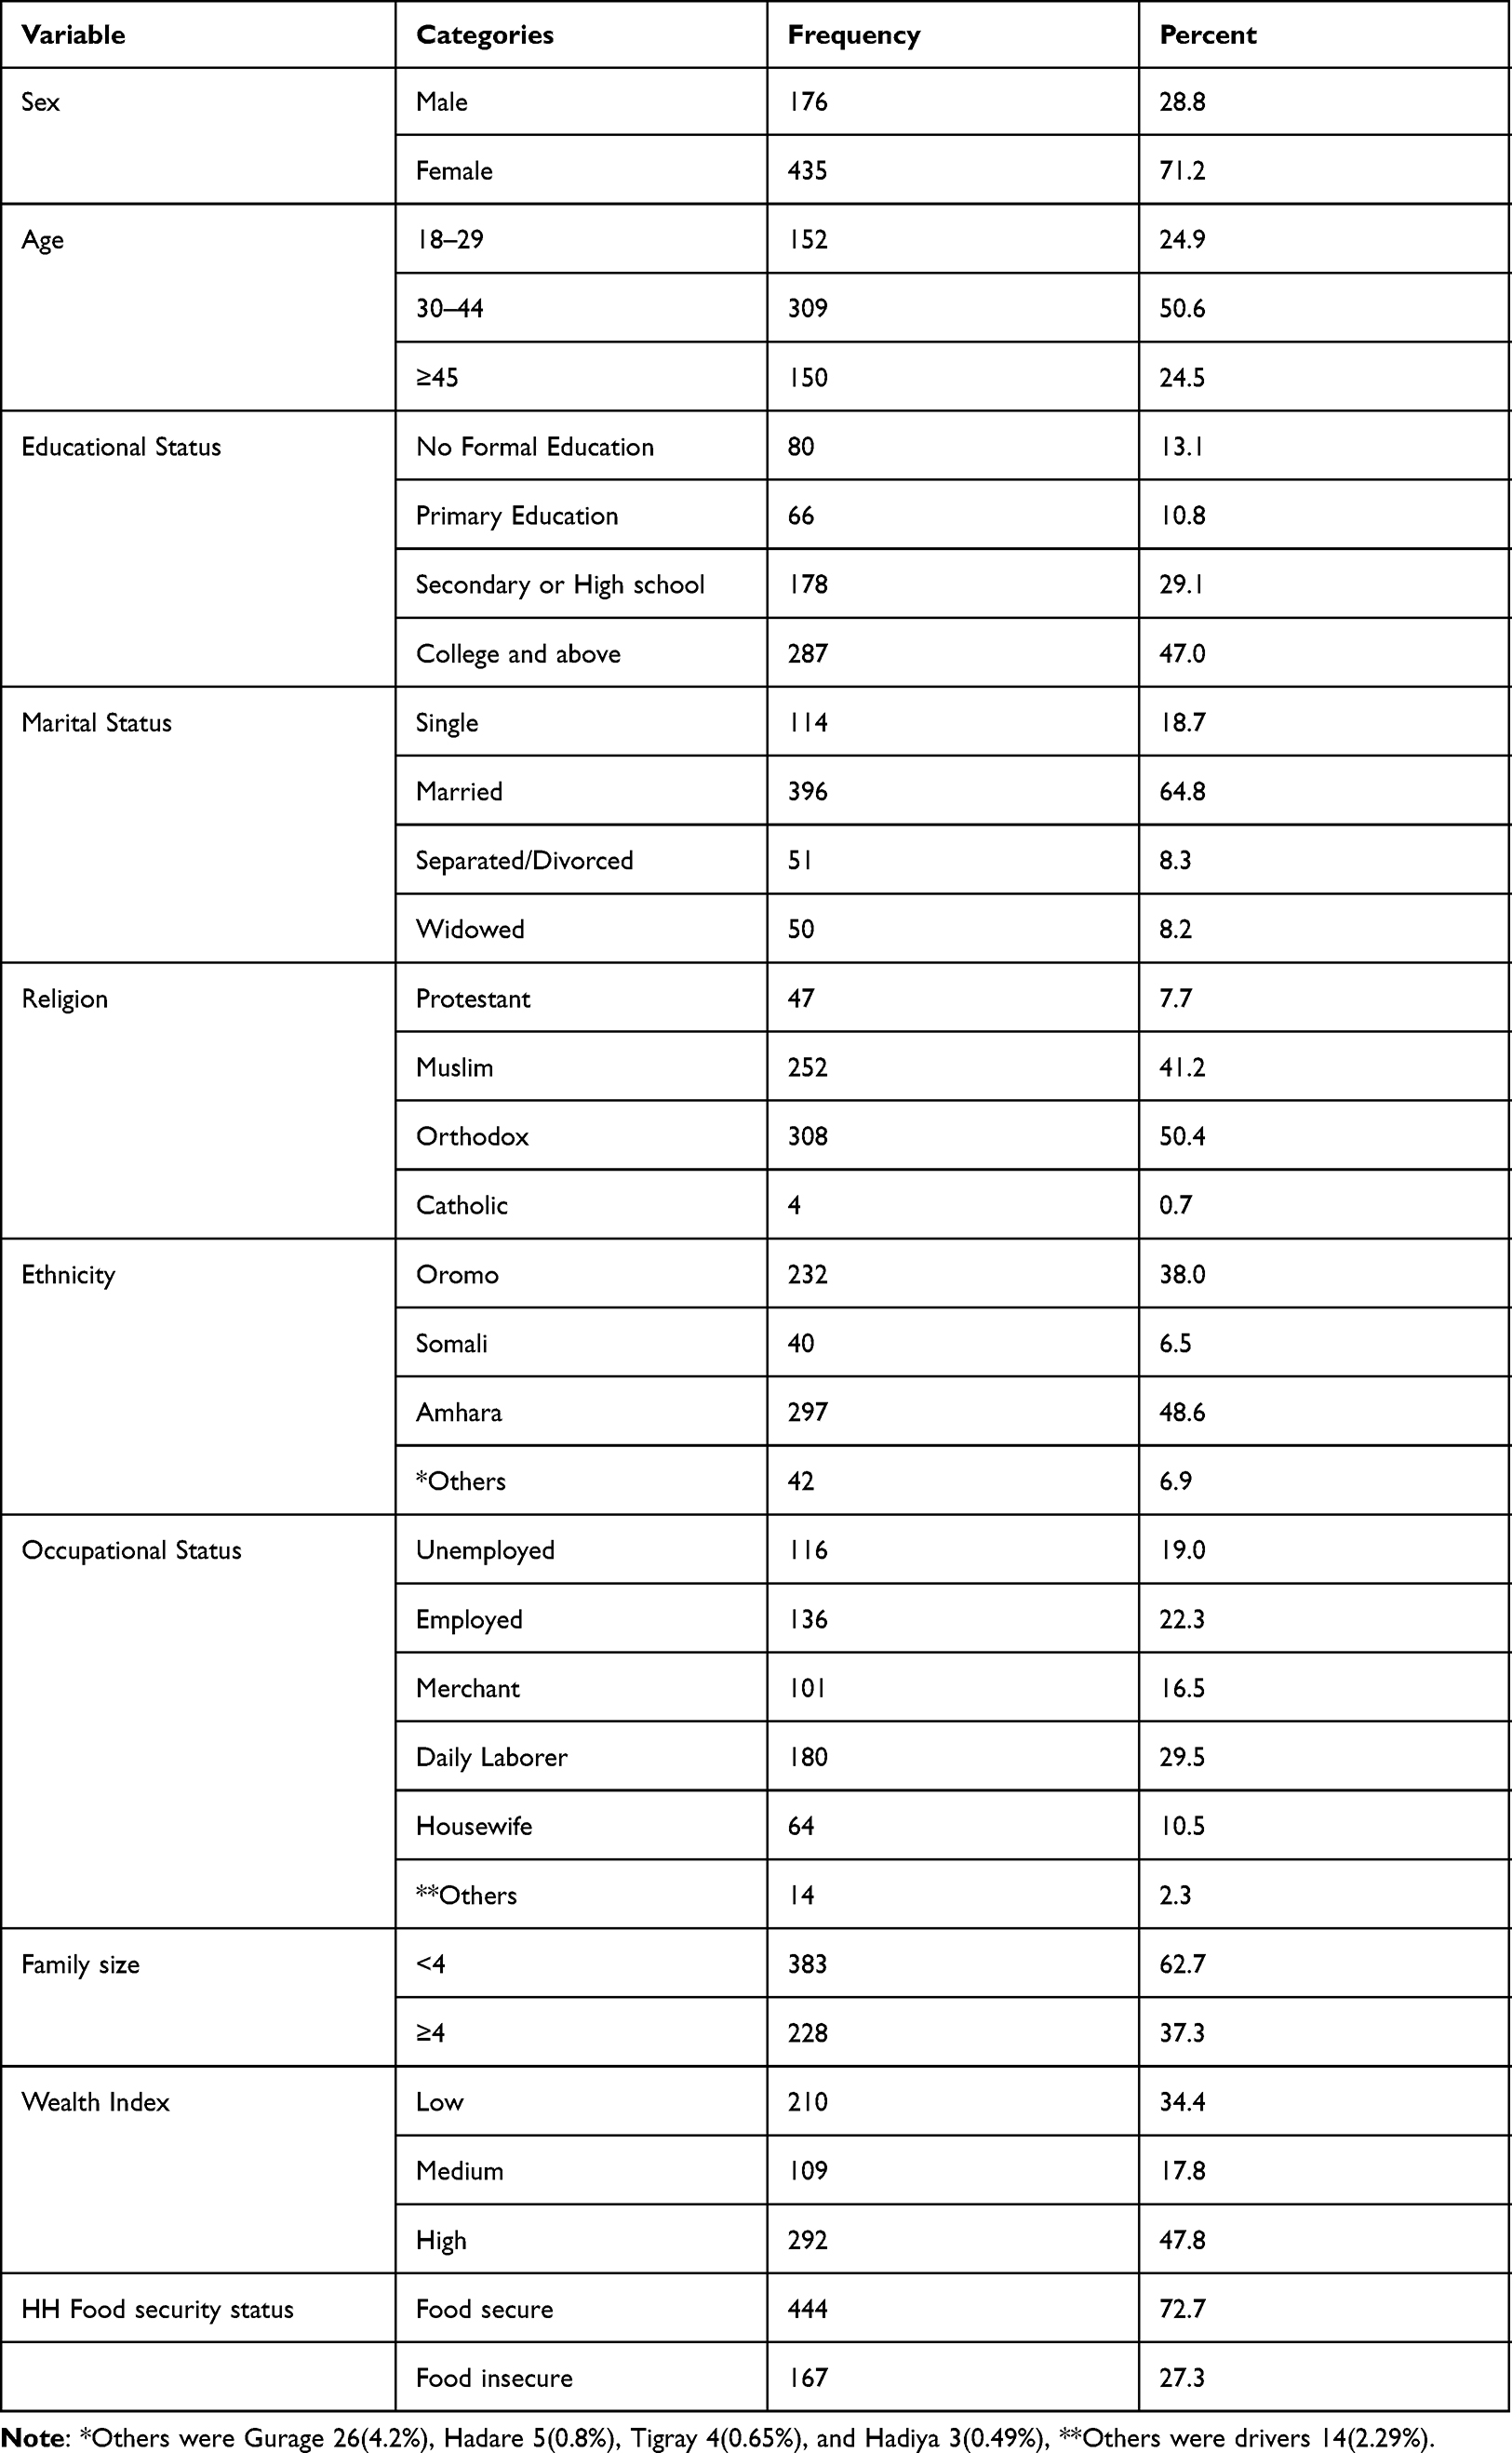 |
Table 1 Sociodemographic and Economic Characteristics of the Respondents Among Adults in Dire Dawa, Eastern Ethiopia, 2020 (n=611) |
Prevalence of Central Obesity
The overall prevalence of central obesity was found to be 76.1%; at 95% CI: (73%, 80%).
The prevalence of central obesity was significantly higher among female than male (57.1% (95% CI: 53–61% vs 19% (95% CI: 15%, 22%), respectively), and the difference is statistically significant (X2 (df)= 14.1310 (1), p< 0.001) (Figure 1).
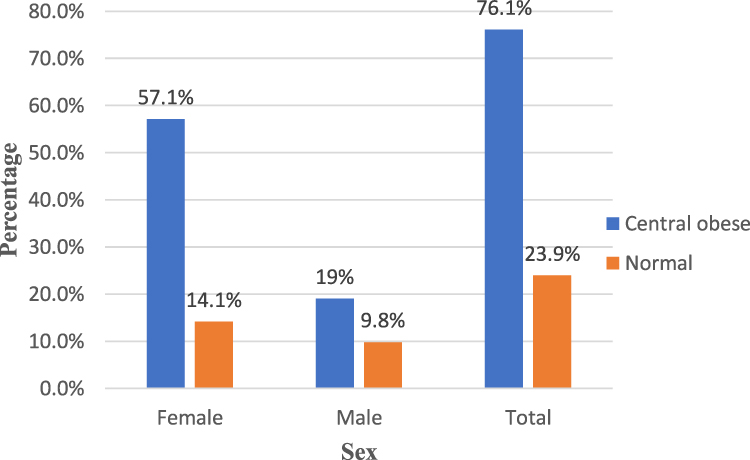 |
Figure 1 Prevalence of central obesity by sex among adults in Dire Dawa City, Eastern Ethiopia. (n = 611). |
Factors Associated with Central Obesity
Age, sex, marital status Alcohol Consumption, watching television, physical activities, wealth index, and occupational status were significantly associated factors with central obesity in binary analysis at p≤0.25. Of these variables, age, sex, marital status, Alcohol Consumption, watching television, and physical activities were statistically significant in multivariate analysis at p<0.05 (Table 2). The results of multivariable logistic regression analysis:- age above 45 years, were 3.75 times more likely to be centrally obese than those younger18–29 age [AOR=3.75, 95% CI (1.86,7.55)], female participants were 2.52 times more likely to be centrally obese than males [AOR=2.52, 95% CI (1.62, 3.94)], participants who consumed alcohol are 2.61 times more likely to be centrally obese than who do not consume alcohol [(AOR=2.61,95% CI (1.68, 4.05)]. Marital status, being married were 2.07 times more likely to develop centrally obese as compared to single [(AOR=2.07,95% CI (1.23, 3.49), Physically inactive individuals were 2.05 times more likely to have central obesity than physically active [AOR=2.05,95% CI (1.23, 3.42)]. Participants who spent 2 hours and above time watching television were 3.30 times more likely to be centrally obese than those who never watch [(AOR=3.30, 95% CI (1.59, 6.82)] (Table 3).
 |
Table 2 Factors Associated with Central Obesity Among Adults on Simple Logistic Regression Analyses, Dire Dawa, Eastern Ethiopia, 2020. (n=611) |
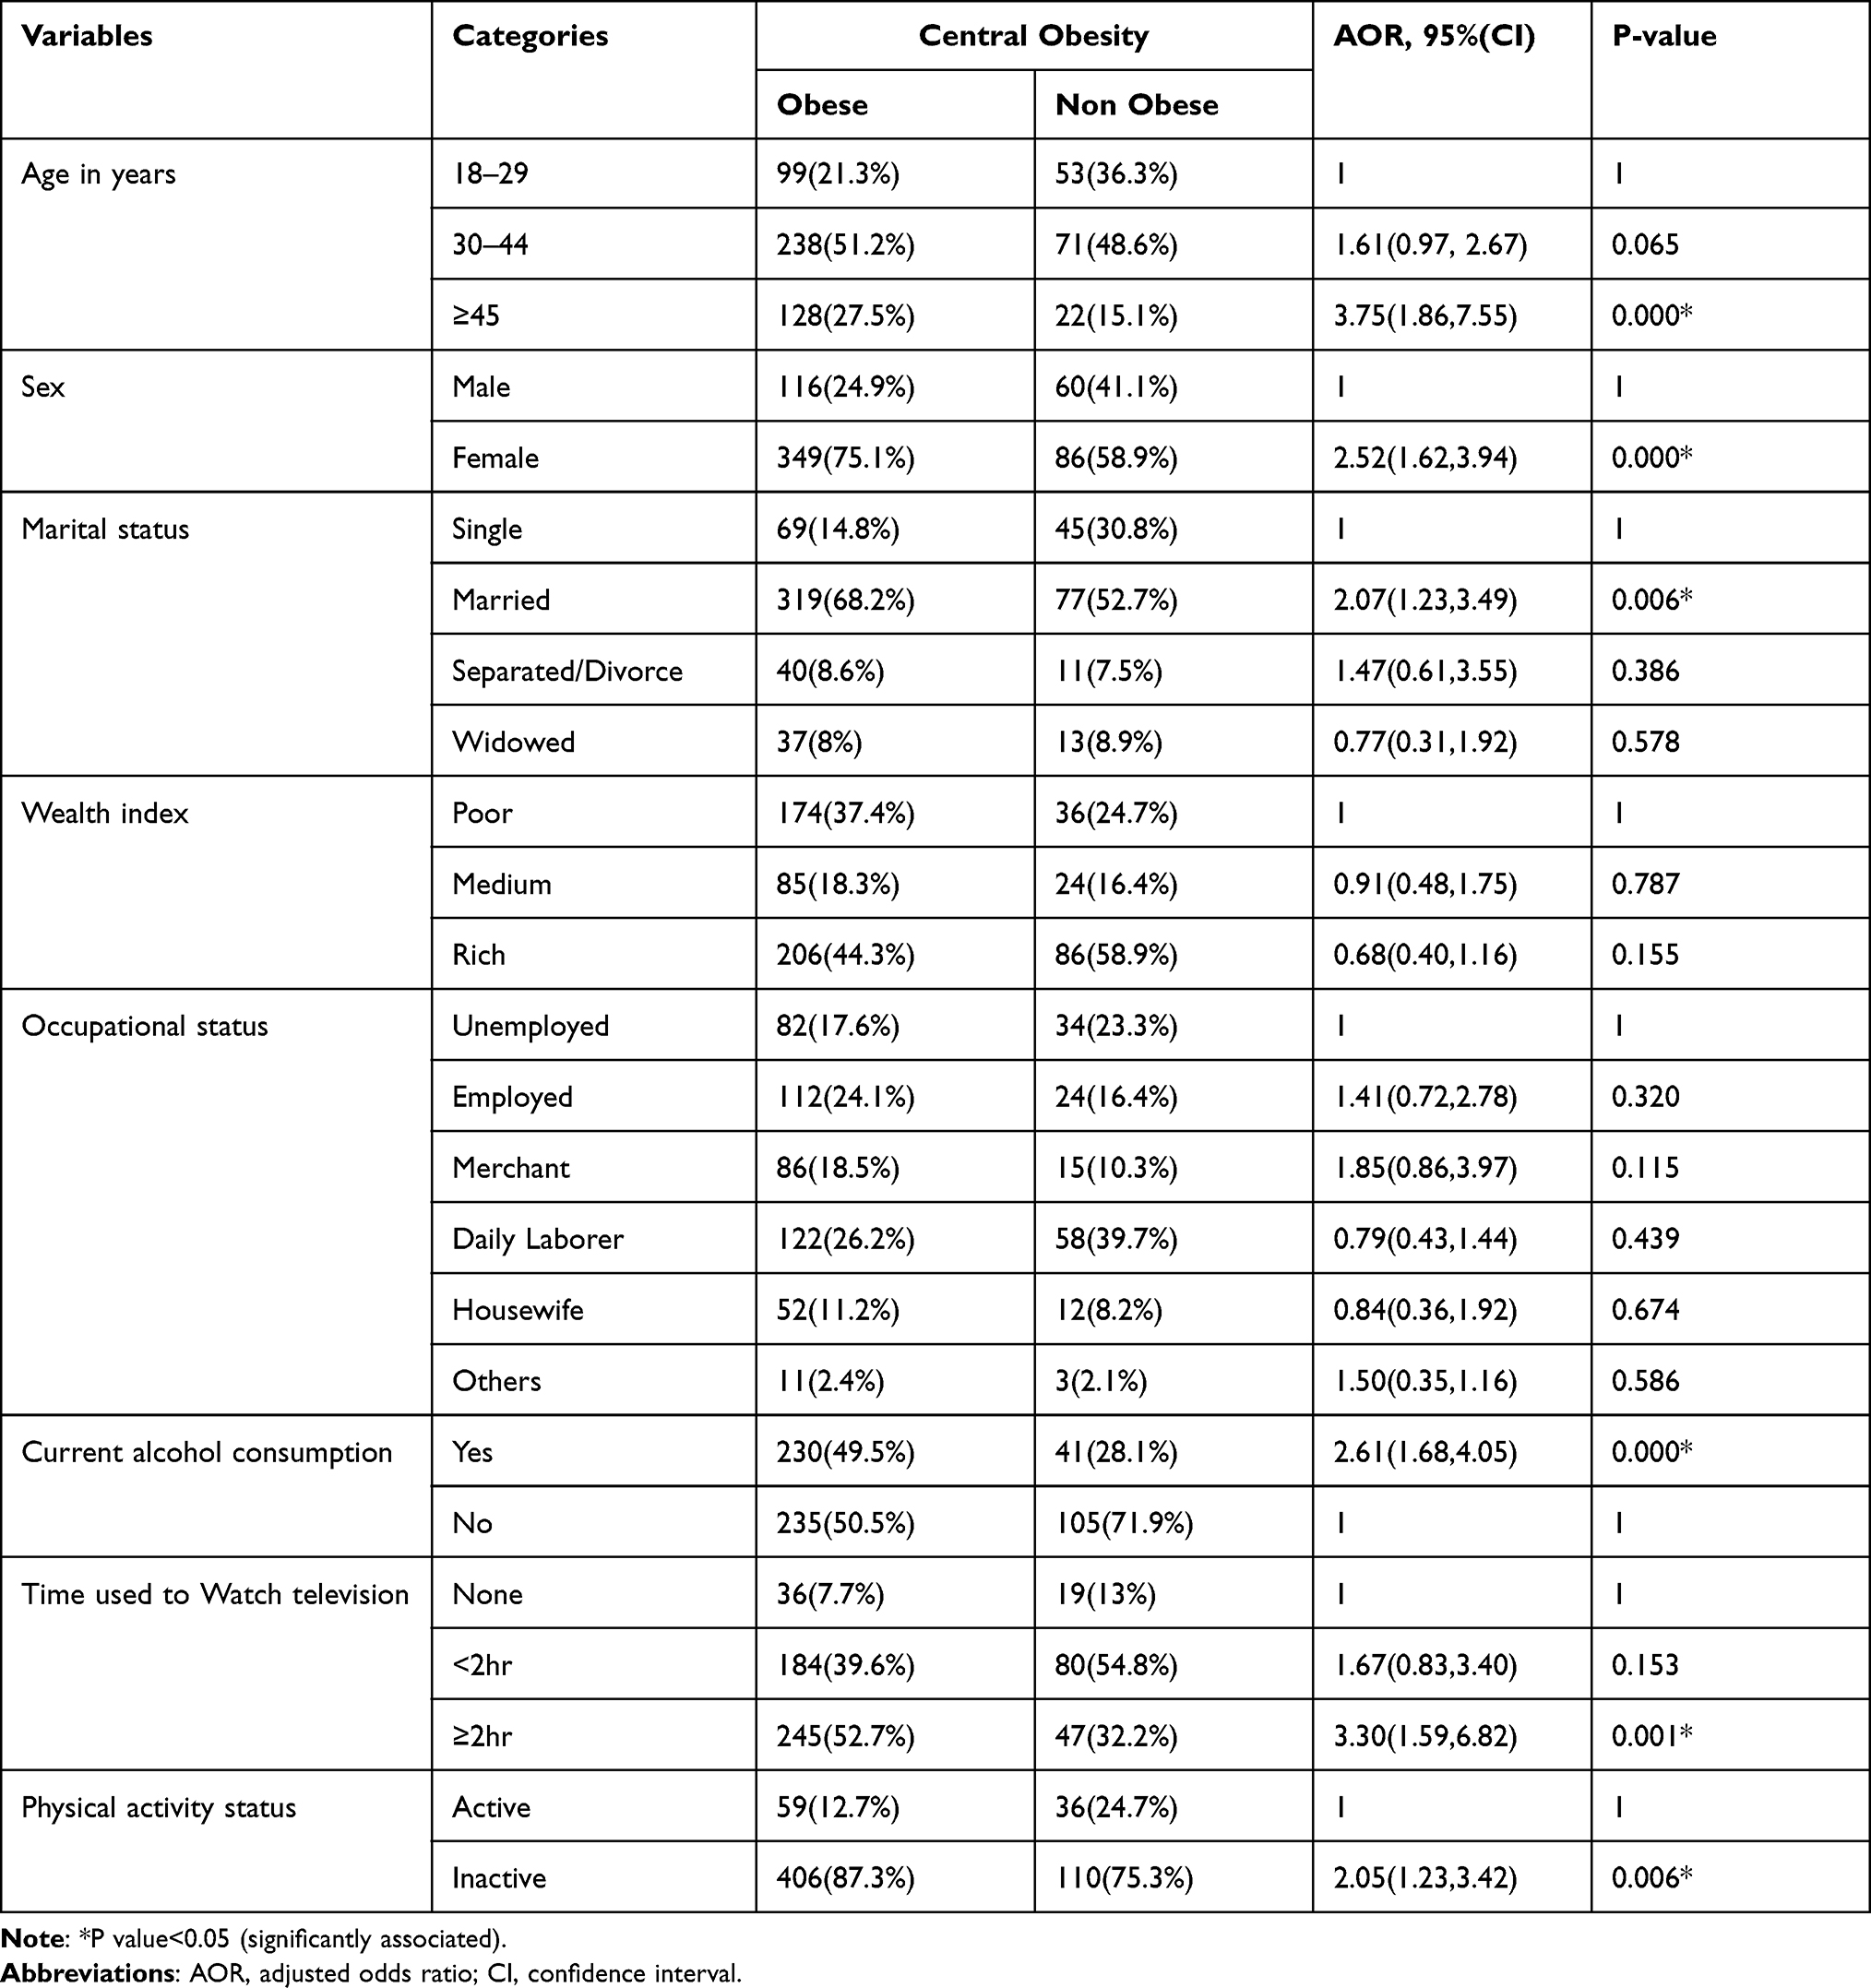 |
Table 3 Factors Associated with Central Obesity Among Adults on Multiple Logistic Regression Analyses, Dire Dawa, Eastern Ethiopia, 2020. (n=611) |
Discussion
The prevalence of central obesity in this study was 76.1%. Our study found that age, gender, alcohol consumption, physical inactivity, marital status, time used to watch Television, were a predictor of central obesity. This shows a high burden of unapparent illness related to central obesity which increases the risk of a consequent problem. The prevalence of central obesity reported in this study was higher than the results of the study conducted in Ethiopia, like northwest Gondar,15 Addis Ababa,16 Dila,17 Mekelle,18 India,46 Eastern Sudan,47 Tanzania,48 Uganda,49 West Africa,50 southeastern Nigeria51 Spain,52 South China,53 and North China.54 This finding is in line with a study done in Northwestern Iran,55 the possible justification for these discrepancies might be attributed to the sociodemographic difference of the study population.56,57 Besides, the residence of the participants might also be one possible reason for the discrepancy in the study findings. This means that individuals who existed in urban areas and industrialized countries are at higher risk of getting central obesity due to their overconsumption of processed and energy-dense foods more frequently than that of the rural peoples.57,58
As an individual eats high energy containing diet, the metabolic pathway shifts into an anabolic process, including fat biosynthesis, and in turn leads to an increase of fats in the circulatory system and the need to store it to maintain the metabolic activities,58,59 Then, the extra fat will be accumulated in adipose tissue with the limitless manner and will influence people into the risk of becoming centrally obese.59
Moreover, the majority of the study respondents were female in the current study area. This may increase the magnitude of central obesity in the current study. Another possible justification for the discrepancy may be the difference of the cut-of-point reference for measurement of central obesity between the current and previous studies.56
Scholars reported that the international diabetes Federation (IDF) and Third Adult Treatment Panel (ATP III) central obesity definition criteria are the best cut-off point for Sub-Saharan Africa and Asian population to reveal the higher treat of cardiometabolic risk. However, the international cut-off value for WC underestimates obesity (central obesity) among Ethiopian adults.41 That means, the current study uses the optimum anthropometric cut-offs for detecting obesity and markers of metabolic syndrome classification criteria in Ethiopia, which takes a cut-off point of WC circumference ≥83.3 cm for men and ≥78.0 cm for women.41
In this study, being female was 2.52 times were more likely to have centrally obese than male. This finding is consistent with the studies done in.15,16,47,48,50,53–55 This might be explained by studies about the differences in fat distribution in males and females where a female was found to have a larger abdominal subcutaneous adipose tissue area, and sedentary lifestyle and practice of less physical activity since most females who live in developing countries, including Ethiopia are housewives. Thus, they may spend more time at home with poor physical activities and the difference between the setting and the genetic susceptibility of the accumulation of fat between men and women postmenopausal redistribution of body fat in the abdominal area.60–63
In this study, age 45 years and above were 3.75 times more likely to have centrally obese as compared to 18–29 years. A finding that is consistent with the study done in.48,50,54,55,61,62 The possible explanation for this might be due to reduced basal metabolism and reduced physical activities due to age. Lower metabolic activity leads to more storage of fat in the body even with a low intake of diet. Also, besides, as people get older, the distribution and accumulation of fat shifts into the abdominal region and will have a chance to develop central obesity.64
The results reveal that more time consumed on looking television was 3.3 times were more likely to have centrally obese than those who never watch television. A finding supported by a study done in.48,65 The possible explanation for this might be, Sedentary lifestyle inhabit people’s time of doing physical activities, which may increase the risk of developing obesity (central obesity),48,65 and also this discrepancy could be attributed to lifestyle changes because the residents are likely to more readily adopt western lifestyle like increased television viewing, sedentary lifestyles. Such as reduced walking due to the availability of motorized transport, nutritional transition that predispose people to the risk of becoming obese.66,67
This study reveals that consuming alcohol increases the risk of central obesity by 2.61 times more likely as compared to non-consumer. However, it is similar to the finding from other studies.16,51 The possible explanation might be due to the high energy content of alcohol makes its consumption a potential contributor to the obesity epidemics, furthermore, drinking is shown to be associated with an increase in food intake; and this eventually leads to weight gain.68,69 There appears to be no doubt about the inverse relationship existing between physical activity and obesity, and the benefit and its preventive effect by acting on the control of fats and cholesterol.70,71
In this study, being centrally obese is 2.05 times among those physically inactive individuals compared to that found in those physically active ones. The finding of this study is similar to other studies done in.16,70,71 In this study, we also found that participants who were married 2.07 times were more likely to have abdominally obese than single. The finding of the study is consistent with a study done.49 The literature on the association between marital status and abdominal obesity is inconsistent.48 But some researchers have reported similar positive associations between being married or formerly married and weight gain.72
The possible justification may be married people being more abdominally obese has been attributed to a change of dietary patterns after marriage and increased social support. Married people are more likely to have a more stable eating pattern and the social support that comes from the responsibility of eating together.73
Since the cross-sectional type of study could not show cause and effect relationship between different factors with the outcome variable.
The usage of self-reporting surveys such as information on sociodemographic factors, physical activities, healthy risky behavior, and health-related factors may have been resulting in under-reporting or over-reporting of the lifestyle behaviors.
Recall and social desirability bias are some of the limitations of the study; this was tried to minimize by probing the respondents about the event.
An anthropometric measurement error is also another limitation to minimize this; data collectors were well trained; standardization of anthropometric measures was done and the instrument was calibrated. Moreover, available research on central obesity and associated factors among adults was limited in the country.
Conclusion
This study reveals a high prevalence of central obesity among study respondent, which is relatively high related to respective studies and demonstrates a major Public health problem.
Central obesity is significantly influenced by a number of factors: - increased age, being female, time spent on television, being ever married, alcohol consumption, and physical inactivity. These results may, hence, call for corresponding stakeholders to plan suitable protective measures that will prevent further health problems that are associated with central obesity, furthermore in future studies, since this is a cross-sectional study the specific cause and effect relationship may not be established.
Thus, further studies with a strong study design should be considered for further justification.
Abbreviations
AO, Abdominal Obesity; AOR, Adjusted Odds Ratio; BMI, Body Mass Index; CO, Central Obesity; CSA, Central Statistical Agency; EDHS, Ethiopian Demographic and Health Survey; FFQ, Food Frequency Questionnaire; WC, Waist Circumference; WHR, Waist to Hip Ratio; WHtR, Waist to Height Ratio; WHO, World Health Organization.
Data Sharing Statement
All data concerning this result can be obtained from the corresponding author at any time on reasonable request.
Acknowledgments
We would like to thank Dire Dawa University. Furthermore, I would like to thank the Administrative bodies of the Dire Dawa Health office and kebeles for their full cooperation, and I would like to thank the communities of Dire Dawa for their full participation, the study participants for their commitment to respond to questions by sacrificing their time, data collectors, translators and data supervisors for their commuted activities.
Author Contributions
EI participated in the conception, designing of the study, and analyzed and interpreted the data. KH, MM, and KW participated in the designing of the study, analysis, write-up, and drafting of the manuscripts. KH and MM and BH critically reviewed and drafted the manuscript. All authors read and approved the final draft. All authors made a significant contribution to the work reported, whether that is in the conception, study design, execution, acquisition of data, analysis and interpretation, or in all these areas; took part in drafting, revising, or critically reviewing the article; gave final approval of the version to be published; have agreed on the journal to which the article has been submitted, and agree to be accountable for all aspects of the work.
Disclosure
The authors declare that they have no conflicts of interest for this work.
References
1. Scott A, Ejikeme CS, Clottey EN, Thomas JG. Obesity in Sub-Saharan Africa: development of an ecological theoretical framework. Health Promot Int. 2013;28(1):4–16. doi:10.1093/heapro/das038
2. Esmaili H, Bahreynian M, Qorbani M, et al. Prevalence of general and abdominal obesity in a nationally representative sample of Iranian children and adolescents: the CASPIAN-IV study. Iran J Pediatr. 2015;25(3). doi:10.5812/ijp.25(3)2015.401.
3. World Health Organization. Waist circumference and waist-hip ratio: report of a WHO expert consultation: report of a WHO expert consultation. Geneva: WHO; 2008:8–11.
4. World Health Organization. Obesity: preventing and managing the global epidemic. World Health Organization; 2000.
5. Teshome T, Singh P, Moges D. Prevalence and associated factors of overweight and obesity among high school adolescents in urban communities of Hawassa, Southern Ethiopia. Curr Res Nutr Food Sci. 2013;1(1):23–36. doi:10.12944/CRNFSJ.1.1.03
6. World Health Organization. Obesity and overweight. Fact sheet No. 311. 2015. WHO Media centre; 2015. Available from: http://www.who.int/mediacentre/factsheets/fs311/en/.
7. Abrha S, Shiferaw S, Ahmed KY. Overweight and obesity and its socio-demographic correlates among urban Ethiopian women: evidence from the 2011 EDHS. BMC Public Health. 2016;16(1):636. doi:10.1186/s12889-016-3315-3
8. Olinto MTA, Theodoro H, Canuto R. Epidemiology of Abdominal Obesity. In: Adiposity-Epidemiology and Treatment Modalities; 2017.
9. Ford ES, Maynard LM, Li C. Trends in mean waist circumference and abdominal obesity among US adults, 1999–2012. JAMA. 2014;312(11):1151–1153. doi:10.1001/jama.2014.8362
10. Gutiérrez‐Fisac J, Guallar‐Castillón P, León‐Muñoz L, Graciani A, Banegas J, Rodríguez‐Artalejo F. Prevalence of general and abdominal obesity in the adult population of Spain, 2008–2010: the ENRICA study. Obes Rev. 2012;13(4):388–392. doi:10.1111/j.1467-789X.2011.00964.x
11. Schienkiewitz A, Mensink GB, Scheidt-Nave C. Comorbidity of overweight and obesity in a nationally representative sample of German adults aged 18–79 years. BMC Public Health. 2012;12(1):658. doi:10.1186/1471-2458-12-658
12. Beltrán-Sánchez H, Harhay MO, Harhay MM, McElligott S. Prevalence and trends of metabolic syndrome in the adult US population, 1999–2010. J Am Coll Cardiol. 2013;62(8):697–703. doi:10.1016/j.jacc.2013.05.064
13. Ijezie IC, Chuku A, Onyeonoro UU, et al. Prevalence of abdominal obesity in Abia State, Nigeria: results of a population-based house-to-house survey. Diabetes Metab Syndr Obes. 2013;6:285. doi:10.2147/DMSO.S43545
14. Xi B, Liang Y, He T, et al. Secular trends in the prevalence of general and abdominal obesity among Chinese adults, 1993–2009. Obes Rev. 2012;13(3):287–296. doi:10.1111/j.1467-789X.2011.00944.x
15. Molla MD, Wolde HF, Atnafu A. Magnitude of central obesity and its associated factors among adults in urban areas of Northwest Ethiopia. Diabetes Metab Syndr Obes. 2020;13:4169. doi:10.2147/DMSO.S279837
16. Teklemariam W. Magnitude of central obesity and associated factors among adults in Addis Ababa Ethiopia; 2020.
17. Tesfaye TS, Zeleke TM, Alemu W, Argaw D, Bedane TK. Dietary diversity and physical activity as risk factors of abdominal obesity among adults in Dilla town, Ethiopia. PLoS One. 2020;15(7):e0236671. doi:10.1371/journal.pone.0236671
18. Gebrehiwot GG, Belachew T, Mehari K, Tamiru D Magnitude of metabolic syndrome and its components among adult residents of Mekelle city, Northern Ethiopia, community-based cross-sectional study; 2020.
19. Jacobs EJ, Newton CC, Wang Y, et al. Waist circumference and all-cause mortality in a large US cohort. Arch Intern Med. 2010;170(15):1293–1301. doi:10.1001/archinternmed.2010.201
20. Hoefle G, Saely C, Aczel S, et al. Impact of total and central obesity on vascular mortality in patients undergoing coronary angiography. Int J Obes. 2005;29(7):785–791. doi:10.1038/sj.ijo.0802985
21. Goon D, Maputle M, Olukoga A, Lebese R, Khoza L, Mothiba T. Anthropometrically determined abdominal obesity among nurses in Vhembe and Capricorn Districts, Limpopo, South Africa; 2014.
22. Perez M, Warren CS. The relationship between quality of life, binge‐eating disorder, and obesity status in an ethnically diverse sample. Obesity. 2012;20(4):879–885. doi:10.1038/oby.2011.89
23. Moriarty JP, Branda ME, Olsen KD, et al. The effects of incremental costs of smoking and obesity on health care costs among adults: a 7-year longitudinal study. J Occup Environ Med. 2012;54(3):286–291. doi:10.1097/JOM.0b013e318246f1f4
24. Misganaw A, Mariam DH, Araya T, Aneneh A. Validity of verbal autopsy method to determine causes of death among adults in the urban setting of Ethiopia. BMC Med Res Methodol. 2012;12(1):1–9. doi:10.1186/1471-2288-12-130
25. Bentley TG, Palta M, Paulsen AJ, et al. Race and gender associations between obesity and nine health-related quality-of-life measures. Qual Life Res. 2011;20(5):665–674. doi:10.1007/s11136-011-9878-7
26. World Health Organization. Fact sheet: obesity and overweight; 2016. Available from: http://www.who.int/dietphysicalactivity/publications/facts/obesity/en/.
27. World Health Organization. Waist circumference and waist-hip ratio: report of a WHO expert consultation, Geneva, 8–11 December 2008; 2011.
28. Fox CS, Massaro JM, Hoffmann U, et al. Abdominal visceral and subcutaneous adipose tissue compartments: association with metabolic risk factors in the Framingham Heart Study. Circulation. 2007;116(1):39–48. doi:10.1161/CIRCULATIONAHA.106.675355
29. Fantin F, Comellato G, Rossi AP, et al. Relationship between neck circumference, insulin resistance and arterial stiffness in overweight and obese subjects. Eur J Prev Cardiol. 2017;24(14):1532–1540. doi:10.1177/2047487317721655
30. Ng M, Fleming T, Robinson M, et al. Global, regional, and national prevalence of overweight and obesity in children and adults during 1980–2013: a systematic analysis for the Global Burden of Disease Study 2013. Lancet. 2014;384(9945):766–781. doi:10.1016/S0140-6736(14)60460-8
31. Association EPH. Emerging public health problems in Ethiopia and chronic non-communicable diseases. EPHA; 2012.
32. Wai WS, Dhami RS, Gelaye B, et al. Comparison of measures of adiposity in identifying cardiovascular disease risk among Ethiopian adults. Obesity. 2012;20(9):1887–1895. doi:10.1038/oby.2011.103
33. Park J, Lee ES, Lee DY, et al. Waist circumference as a marker of obesity is more predictive of coronary artery calcification than body mass index in apparently healthy Korean adults: the Kangbuk Samsung Health Study. Endocrinol Metab. 2016;31(4):559–566. doi:10.3803/EnM.2016.31.4.559
34. CSACEaI. Ethiopia demographic and health survey. Addis Ababa, Ethiopia, and Rockville, Maryland, USA: CSA and ICF; 2016.
35. The Federal Democratic Republic of Ethiopia Srotnlfs. National labour force survey in Statistical Bulletin, Addis Ababa: central Statistical Agency, Ethiopia, 2013; 2013.
36. World Health Organization. The WHO STEPwise approach to noncommunicable disease risk factor surveillance; 2017.
37. Coates J, Swindale A, Bilinsky P. Household Food Insecurity Access Scale (HFIAS) for measurement of food access: indicator guide: version 3. 2007.
38. World Health Organization. Global physical activity questionnaire (GPAQ) analysis guide. Geneva; 2012.
39. Kennedy G, Ballard T, Dop M. Guidelines for Measuring Individual and Household Dietary Diversity. Rome: Nutrition and Consumer Protection Division, FAO; 2011.
40. Belachew T, Lindstrom D, Gebremariam A, et al. Food insecurity, food based coping strategies and suboptimal dietary practices of adolescents in Jimma zone Southwest Ethiopia. PLoS One. 2013;8(3):e57643. doi:10.1371/journal.pone.0057643
41. Sinaga M, Worku M, Yemane T, et al. Optimal cut-off for obesity and markers of metabolic syndrome for Ethiopian adults. Nutr J. 2018;17(1):109. doi:10.1186/s12937-018-0416-0
42. Ryan H, Trosclair A, Gfroerer J. Adult current smoking: differences in definitions and prevalence estimates—NHIS and NSDUH, 2008. J Environ Public Health. 2012;2012:1–11. doi:10.1155/2012/918368
43. Roba HS, Beyene AS, Mengesha MM, Ayele BH. Prevalence of hypertension and associated factors in Dire Dawa City, Eastern Ethiopia: a community-based cross-sectional study. Int J Hypertens. 2019;2019:1–9. doi:10.1155/2019/9878437
44. Meressa K, Mossie A, Gelaw Y. Effect of substance use on academic achievement of health officer and medical students of Jimma University, Southwest Ethiopia. Ethiop J Health Sci. 2009;19(3). doi:10.4314/ejhs.v19i2.69419
45. Camacho PA, Gomez-Arbelaez D, Otero J, et al. Self-reported prevalence of chronic non-communicable diseases in relation to socioeconomic and educational factors in Colombia: a community-based study in 11 departments. Glob Heart. 2020;15(1). doi:10.5334/gh.792.
46. Undavalli VK, Ponnaganti SC, Narni H. Prevalence of generalized and abdominal obesity: india’s big problem. Int J Community Med Public Health. 2018;5(4):1311–1316. doi:10.18203/2394-6040.ijcmph20180984
47. Omar SM, Taha Z, Hassan AA, Al-Wutayd O, Adam I. Prevalence and factors associated with overweight and central obesity among adults in the Eastern Sudan. PLoS One. 2020;15(4):e0232624. doi:10.1371/journal.pone.0232624
48. Munyogwa MJ, Mtumwa AH. The prevalence of abdominal obesity and its correlates among the adults in Dodoma Region, Tanzania: a community-based cross-sectional study. Adv Med. 2018;2018. doi:10.1155/2018/6123156
49. Kabwama SN, Kirunda B, Mutungi G, Wesonga R, Bahendeka SK, Guwatudde D. Prevalence and correlates of abdominal obesity among adults in Uganda: findings from a national cross-sectional, population based survey 2014. BMC Obes. 2018;5(1):40. doi:10.1186/s40608-018-0217-1
50. Malik SK, Kouame J, Gbane M, Coulibaly M, Ake MD, Ake O. Prevalence of abdominal obesity and its correlates among adults in a peri-urban population of West Africa. AIMS Public Health. 2019;6(3):334. doi:10.3934/publichealth.2019.3.334
51. Raimi TH, Odusan O, Fasanmade O. High prevalence of central obesity in rural South-Western Nigeria: need for targeted prevention; 2015.
52. Aranceta-Bartrina J, Pérez-Rodrigo C, Alberdi-Aresti G, Ramos-Carrera N, Lázaro-Masedo S. Prevalence of general obesity and abdominal obesity in the Spanish adult population (aged 25–64 years) 2014–2015: the ENPE study. Rev Esp Cardiol. 2016;69(6):579–587. doi:10.1016/j.rec.2016.02.009
53. Yu S, Xing L, Du Z, et al. Prevalence of obesity and associated risk factors and Cardiometabolic comorbidities in rural Northeast China. Biomed Res Int. 2019;2019. doi:10.1155/2019/6509083
54. Hu L, Huang X, You C, et al. Prevalence of overweight, obesity, abdominal obesity and obesity-related risk factors in southern China. PLoS One. 2017;12(9):e0183934. doi:10.1371/journal.pone.0183934
55. Tabrizi JS, Sadeghi-Bazargani H, Farahbakhsh M, Nikniaz L, Nikniaz Z. Prevalence and associated factors of overweight or obesity and abdominal obesity in Iranian population: a population-based study of Northwestern Iran. Iran J Public Health. 2018;47(10):1583.
56. Lear S, James P, Ko G, Kumanyika S. Appropriateness of waist circumference and waist-to-hip ratio cutoffs for different ethnic groups. Eur J Clin Nutr. 2010;64(1):42–61. doi:10.1038/ejcn.2009.70
57. Blüher M. Obesity: global epidemiology and pathogenesis. Nat Rev Endocrinol. 2019;15(5):288–298. doi:10.1038/s41574-019-0176-8
58. Speakman JR. Body size, energy metabolism and lifespan. J Exper Biol. 2005;208(9):1717–1730. doi:10.1242/jeb.01556
59. Atkinson DE. Cellular energy metabolism and its regulation; 1977.
60. Derby CA, Zilber S, Brambilla D, Morales KH, McKinlay JB. Body mass index, waist circumference and waist to hip ratio and change in sex steroid hormones: the Massachusetts male ageing study. Clin Endocrinol. 2006;65(1):125–131. doi:10.1111/j.1365-2265.2006.02560.x
61. Lasky D, Becerra E, Boto W, Otim M, Ntambi J. Obesity and gender differences in the risk of type 2 diabetes mellitus in Uganda. Nutrition. 2002;18(5):417–421. doi:10.1016/S0899-9007(01)00726-2
62. Toth M, Tchernof A, Sites C, Poehlman E. Effect of menopausal status on body composition and abdominal fat distribution. Int J Obes. 2000;24(2):226–231. doi:10.1038/sj.ijo.0801118
63. Norafidah A, Azmawati M, Norfazilah A. Factors influencing abdominal obesity by waist circumference among normal BMI population. Malaysian J Public Health Med. 2013;13(1):37–47.
64. Tchernof A, Després J-P. Pathophysiology of human visceral obesity: an update. Physiol Rev. 2013;93(1):359–404. doi:10.1152/physrev.00033.2011
65. Kim D, Hou W, Wang F, Arcan C. Peer reviewed: factors affecting obesity and waist circumference among US adults. Preventing chronic disease; 2019: 16.
66. Mfinangai S, Kivuyo S, Ezekiel L, Ngadaya E, Mghamba J, Ramaiya K. Public health concern and initiatives on the priority action towards non-communicable diseases in Tanzania. Tanzan J Health Res. 2011;13(5 Suppl 1):365.
67. Misra A, Singhal N, Khurana L. Obesity, the metabolic syndrome, and type 2 diabetes in developing countries: role of dietary fats and oils. J Am Coll Nutr. 2010;29(sup3):289S–301S. doi:10.1080/07315724.2010.10719844
68. Sayon-Orea C, Martinez-Gonzalez MA, Bes-Rastrollo M. Alcohol consumption and body weight: a systematic review. Nutr Rev. 2011;69(8):419–431. doi:10.1111/j.1753-4887.2011.00403.x
69. Traversy G, Chaput J-P. Alcohol consumption and obesity: an update. Curr Obes Rep. 2015;4(1):122–130. doi:10.1007/s13679-014-0129-4
70. Jalambo MO, Kanoa B, Ellulu MS, Younis S, El-Kariri M. Dietary and lifestyles assessment among obese women in Gaza City, Palestine; 2018.
71. Petersen L, Schnohr P, Sørensen T. Longitudinal study of the long-term relation between physical activity and obesity in adults. Int J Obes. 2004;28(1):105–112. doi:10.1038/sj.ijo.0802548
72. Sobal J, Rauschenbach BS, Frongillo EA
73. Janghorbani M, Amini M, Rezvanian H, et al. Association of body mass index and abdominal obesity with marital status in adults; 2008.
 © 2022 The Author(s). This work is published and licensed by Dove Medical Press Limited. The full terms of this license are available at https://www.dovepress.com/terms.php and incorporate the Creative Commons Attribution - Non Commercial (unported, v3.0) License.
By accessing the work you hereby accept the Terms. Non-commercial uses of the work are permitted without any further permission from Dove Medical Press Limited, provided the work is properly attributed. For permission for commercial use of this work, please see paragraphs 4.2 and 5 of our Terms.
© 2022 The Author(s). This work is published and licensed by Dove Medical Press Limited. The full terms of this license are available at https://www.dovepress.com/terms.php and incorporate the Creative Commons Attribution - Non Commercial (unported, v3.0) License.
By accessing the work you hereby accept the Terms. Non-commercial uses of the work are permitted without any further permission from Dove Medical Press Limited, provided the work is properly attributed. For permission for commercial use of this work, please see paragraphs 4.2 and 5 of our Terms.