")
Back to Journals » International Journal of Nanomedicine » Volume 11
Cellular uptake and fate of fibroin microspheres loaded with randomly fragmented DNA in 3T3 cells
Received 7 January 2016
Accepted for publication 12 March 2016
Published 13 May 2016 Volume 2016:11 Pages 2069—2079
DOI https://doi.org/10.2147/IJN.S103830
Checked for plagiarism Yes
Review by Single anonymous peer review
Peer reviewer comments 4
Editor who approved publication: Dr Thomas Webster
Supplementary video presented by Lee and Hur.
Views: 326
Jin Sil Lee, Won Hur
Department of Bioengineering and Technology, Kangwon National University, Chuncheon, South Korea
Abstract: Purified fibroin protein can be obtained in large quantities from silk fibers and processed to form microscopic particles as delivery vehicles for therapeutic agents. In this study, we demonstrated that fibroin microspheres were taken up by 3T3 cells, localized in the nonlysosomal compartment, and secreted from the cytoplasm after medium replenishment. DNA-loaded microspheres were taken up by >95% of 3T3 cells. DNA cargo had no influence on the intracellular trafficking of microspheres, while fluorescently labeled cargo DNA was observed in the lysosomal compartment and in the microspheres. These results indicate that fibroin microspheres can travel through 3T3 cells without making any contact with the lysosomal compartments. The amount of DNA loaded in the microspheres taken up by 3T3 cells was estimated up to 831.0 pg/cell. Thus, fibroin microspheres can deliver a large amount of randomly fragmented DNA (<10 kb) into the cytoplasmic compartment of 3T3 cells.
Keywords: microspheres, DNA delivery, transcellular transport, fibroin
Introduction
Cells take up microspheres made of natural1 or synthetic polymers.2,3 Thus, microspheres have been developed as vehicles not only for gene transfection4 but also for small interfering RNAs (siRNAs)5 and decoy DNA.6 However, gene transfection and siRNA delivery largely rely on nanoparticles, for example, a biodegradable arginine-based polymer showing an enhanced transfection efficiency7 and a cationic core and lipid shell providing a long-circulating nanoparticle platform.8 Although nanoparticles are considered to be better candidates for nonviral gene delivery because of their enhanced cellular internalization and endosomal escape,5 micron-scale spheres may have advantages in terms of delivering large and multiple cargoes, including not only genetic materials but also mixtures of macromolecules that may modulate cellular metabolism.
Endocytosed polymeric molecules are subject to lysosomal degradation unless endosomal escape occurs,9 whereas the fate of microspherical vehicles varies, depending on the size and host cells. Microparticles phagocytosized by macrophages were trafficked to phagolysosomes.10 Disulfide-stabilized poly(methacrylic acid) capsules underwent lysosomal degradation by colon cancer cells.11 However, latex particles of 500 nm in diameter were not localized in the lysosomal compartment in murine melanoma cell line B16-F10.12 Thus, understanding the intracellular trafficking and fate of microspheres is important to design delivery system.
In a previous report, fibroin microspheres were fabricated without any chemical modification or cross-linking in order not to disturb the proteinous surface of the fibroin shell.13 These microspheres are efficiently taken up by 3T3 cells with no significant loss of cell viability.1 However, little is known about the intracellular fate and DNA delivery capability of fibroin microspheres. In this study, we investigated the cellular uptake and fate of fibroin microspheres in 3T3 cells. We also investigated the subcellular localization of fibroin microspheres loaded with and without randomly fragmented DNA.
Materials and methods
Fibroin microspheres
Aqueous fibroin solution was prepared from silk fibers using hot CaCl2 solutions as reported previously.13 Fluorescein isothiocyanate (FITC)–dextran (40 kDa), Span 80, Tween 80, and other reagents were purchased from Sigma-Aldrich Co. (St Louis, MO, USA). Salmon testis chromosomal DNA (D1626 41.2% GC; Sigma-Aldrich Co.) was used to prepare randomly fragmented DNA using a probe-type sonicator set at 500 W (VC505; Sonics & Materials Inc., Newtown, CT, USA) for 0–60 seconds in pulse mode and at an amplitude of 40%. FITC-labeled DNA was prepared by sonication of DNA fragments (20 mg) solubilized in 4 mL of NaHCO3 buffer (0.1 M, pH 9) for 60 seconds and reacted with 120 μL of FITC (1 mg/mL prepared in dimethyl sulfoxide) for 1 hour at 4°C in the dark, followed by Sephadex G25 chromatography to separate unreacted FITC.
Microspheres were prepared from aqueous fibroin solution (2% w/v) or that supplemented with fragmented DNA, FITC-labeled DNA, or FITC–dextran. An 8 mL of fibroin solution was mixed with an organic phase prepared by dissolving a surfactant mixture of 2.2 mL of Span 80 and 1.8 mL of Tween 80 in 16 mL of n-decane (decane) at 40°C, followed by emulsification of the oil phase using a handheld homogenizer (Polytron PT2100; Kinematica, Lucerne, Switzerland) at 30,000 rpm for 60 seconds. The resulting translucent emulsion was dried using a rotary vacuum evaporator (JP/N 1000S-W; Eyela, Tokyo, Japan) at 40°C for 30 minutes. The microspheres that formed in the emulsion were harvested by centrifugation at 4,000 rpm for 5 minutes, washed several times with ethanol to remove decane, and dried at room temperature (Figure S1). The microspheres were characterized using scanning electron microscopy (S-4800; Hitachi Ltd, Tokyo, Japan) and transmission electron microscopy (JEM-2100F; JEOL, Tokyo, Japan). The zeta potential of fibroin microspheres was measured using an electrophoretic light-scattering spectrophotometer (ELS-8000; Otsuka, Tokyo, Japan). Electrophoresis was carried out in 1% agarose gel. Microspheres were mixed with loading buffer (0.3% bromophenol blue and 20% glycerol) and directly loaded into the wells of a precast gel.
3T3 cell culture and microsphere uptake
The BALB/3T3 clone A31 cell line was purchased from American Type Culture Collection (Manassas, VA, USA) and maintained in Dulbecco’s Modified Eagle’s Medium containing 4.5 g/L glucose and 4 mM L-glutamine (Lonza, Walkedrsville, MD, USA) and supplemented with 10% fetal bovine serum (Lonza) at 37°C in a humidified atmosphere consisting of 5% CO2 in air. Microspheres were added at a final concentration of 0.33 mg/mL (unless otherwise described) to a monolayer of 3T3 cells grown for 24 hours in six-well culture plates seeded with 105 cells per well or in a 60 mm culture dish seeded with 106 cells. The cells were further incubated for a given amount of time and then washed twice with phosphate-buffered saline (PBS). Cells were detached by trypsin–ethylenediaminetetraacetic acid treatment for flow cytometric analysis.
Fluorescence microscopy
Cells were cultured with microspheres in a 12-well culture plate containing coverslips. The coverslips were recovered from the culture wells and incubated with a fixing solution (4% formaldehyde). Fluorescence images of the samples were obtained using confocal laser scanning microscopy (CLSM; FluoView FV300; Olympus Corporation, Tokyo, Japan). For lysosome staining, cells were replenished with medium (1 mL) containing LysoTracker Red DND-99 (50 nM; Molecular Probes Inc., Eugene, OR, USA) and further incubated for 30 minutes at room temperature. Cells were washed with PBS and fixed with formaldehyde prepared in PBS for 30 minutes at room temperature.
Flow cytometric analysis
Trypsinized cell suspensions were washed with PBS to remove extracellular microspheres and cell debris and then fixed in 4% formaldehyde. Cells were washed with cold PBS and resuspended in PBS for flow cytometric analysis using a FACSCalibur flow cytometer (BD Biosciences, San Jose, CA, USA). Matlab software (Mathworks, Natick, MA, USA) was used to analyze raw data and to generate scatter dot plots of forward scatter, side scatter, and FL1 signals. The percentage of cells with internalized microspheres was calculated by the number of fluorescence events of FL1-height signals above a threshold level of background fluorescence. A specified volume of spent culture medium was also used for fluorescence-activated cell sorting to monitor extracellular secretion of microspheres or fluorescent cargoes. The results were expressed as the mean ± standard error. Statistical difference in the fluorescence intensity was determined using one-way analysis of variance with Dunnett’s post hoc test. Differences were considered statistically significant at P<0.05.
Results
Preparation and cellular uptake of fibroin microspheres
Regenerated fibroin was mixed with FITC–dextran (2.5%) to prepare core–shell morphology microspheres. The resulting microspheres were smooth and spherical with number- and weight-averaged diameters of 0.73 μm and 1.63 μm, respectively (Figure 1). The zeta potential was determined to be 6.09±1.44 mV. CLSM showed that the microspheres had fluorescent cores, indicating the formation of a core–shell structure with FITC–dextran core surrounded by fibroin, consistent with a previous report.13 The microspheres were added to the culture medium in which 3T3 cells were cultured for 24 hours. During subsequent incubation, microspherical bodies being localized in the cytoplasm of cells were observed using an inverted phase-contrast microscope (Video S1). Confocal microscopy confirmed that the cytoplasm contained fluorescent foci, the sizes of which were comparable to those of fibroin microspheres, indicating the uptake of multiple FITC–dextran-containing microspheres (Figure 2). Transmission electron microscopy also confirmed the cytoplasmic localization of these microspheres in 3T3 cells (Figure 2B). The microspheres remained in the cytoplasm for up to 7 days, unless the culture medium was not replenished.
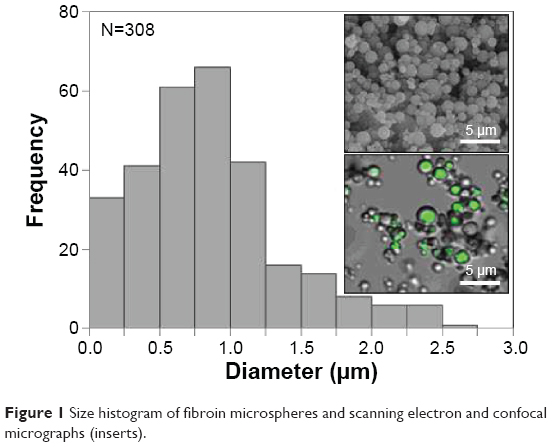 | Figure 1 Size histogram of fibroin microspheres and scanning electron and confocal micrographs (inserts). |
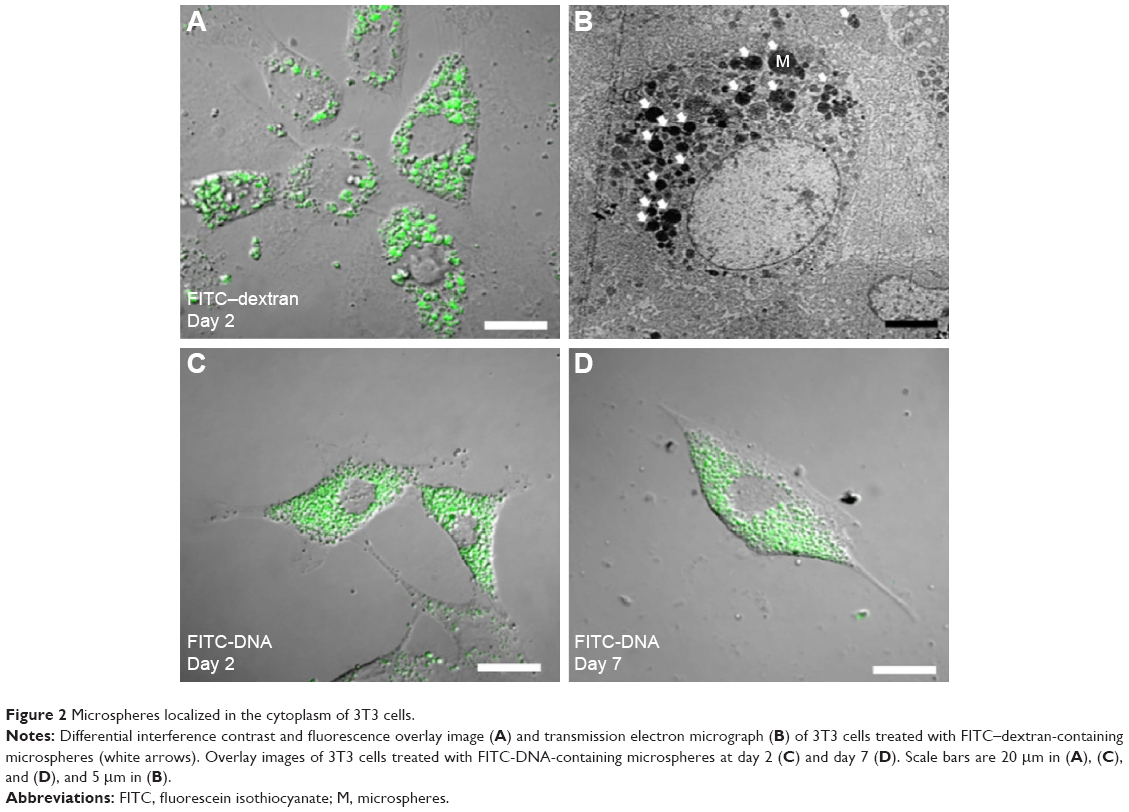 | Figure 2 Microspheres localized in the cytoplasm of 3T3 cells. |
As soon as the culture medium was replenished, disappearance of the spherical bodies in the cytoplasm was observed by inverted microscopy (Figure 3A, Figure S2, and Video S2). Flow cytometry was used to quantify cells that had taken up fluorescent microspheres and to trace FITC fluorescence (Figure 3B). Cells treated with FITC–dextran-containing microspheres (0.1 mg/mL) were incubated for 24 hours, after which the medium was replenished. The relative fluorescence intensity of the replenished culture medium increased with time and reached a plateau after 2 hours (Figure 3C). The relative fluorescence intensity of the spent culture medium corresponded to up to ~15% of that of the cells. Flow cytometry also showed that most cells remained fluorescent after medium replenishment. Thus, cells were treated with a low dose of microspheres (0.01 mg/mL), incubated with daily medium replenishment, and subjected to flow cytometric analysis. The percentage of fluorescent cells was 66.0%±4.1%, 22.5%±5.9%, 13.5%±3.0%, and 6.9%±1.6% after the medium was replenished one, two, three, and four times, respectively (Figure 3D). The spent culture medium was also analyzed by flow cytometry to detect fluorescence. The fluorescence intensity of the spent culture medium was gated based on the microsphere size to determine the fluorescence intensity of microspheres secreted by cells. The fluorescence intensity of the first, second, third, and fourth spent culture medium to be collected was corresponded to 21.0%±6.7%, 4.32%±1.8%, 0.51%±0.10%, and 0.88%±0.3%, respectively, of the fluorescence intensity of microspheres added to the culture medium. Accordingly, the cumulative fluorescence intensity increased with each change and reached a plateau of 26.7%.
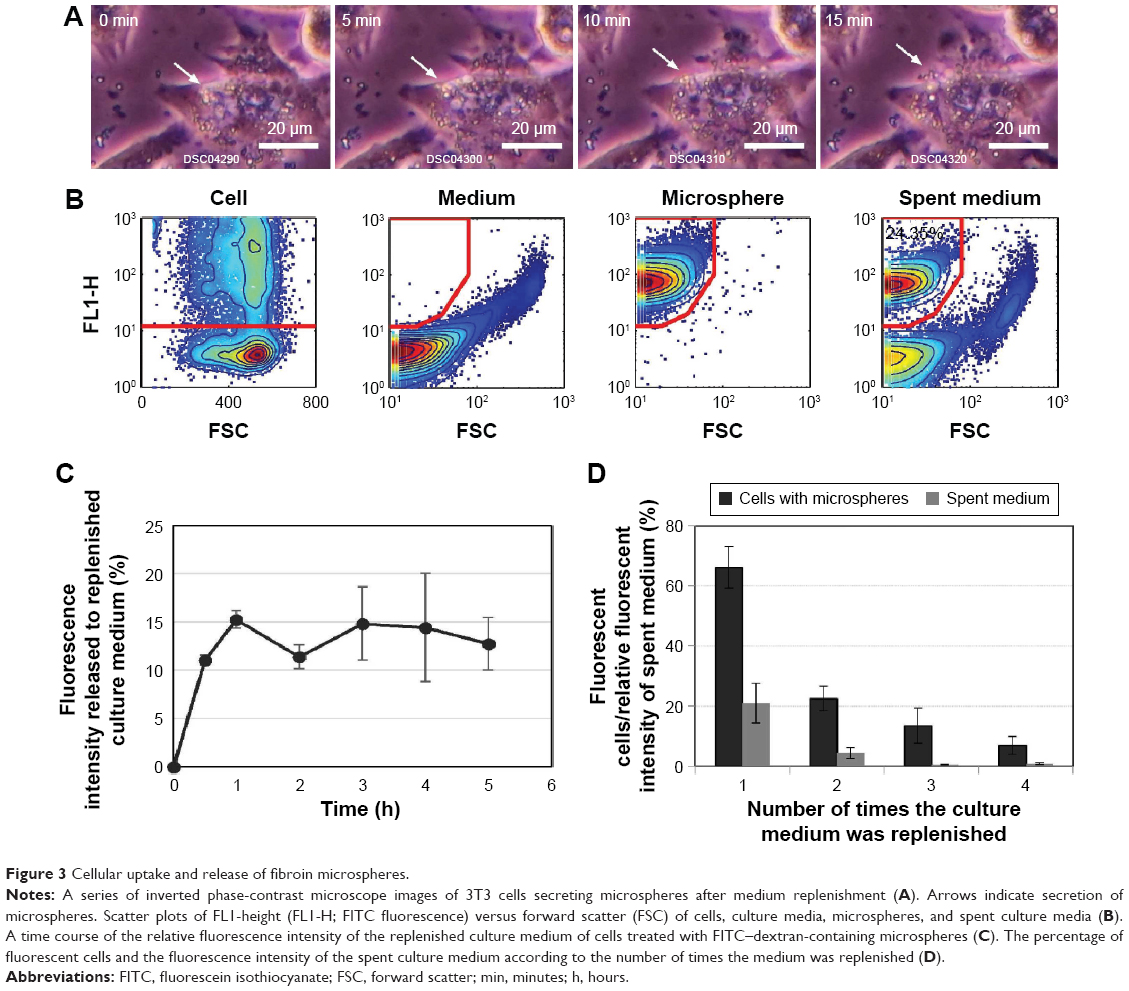 | Figure 3 Cellular uptake and release of fibroin microspheres. |
Qualitative and quantitative estimation of microspheres that were taken up and secreted by cells were determined by microscopic observations and flow cytometry. These results clearly indicate that fibroin microspheres are taken up by 3T3 cells and secreted upon medium replenishment. The microspheres are retained in the cytoplasm as far as the culture medium contains microspheres at a high concentration. Accordingly, it suggests a possibility that ingested microspheres are in dynamic equilibrium with those in the culture medium.
Effect of DNA cargo on cellular uptake and secretion of microspheres
Fibroin microspheres were prepared to contain a mixture of randomly fragmented salmon testis DNA. The fibroin microspheres loaded with DNA fragments were stained with FITC and ethidium bromide. CLSM revealed that the DNA fragments were evenly distributed throughout the microspheres (Figure 4A). The size distributions of DNA fragments eluted from microspheres were significantly different from those of DNA fragments that were used to prepare microspheres, indicating that DNA fragments >10 kb could not be released from the microspheres by electrophoresis (Figure 4B). Densitometry analysis using image J software indicated that the percentage of DNA released by electrophoresis was 52.6%.
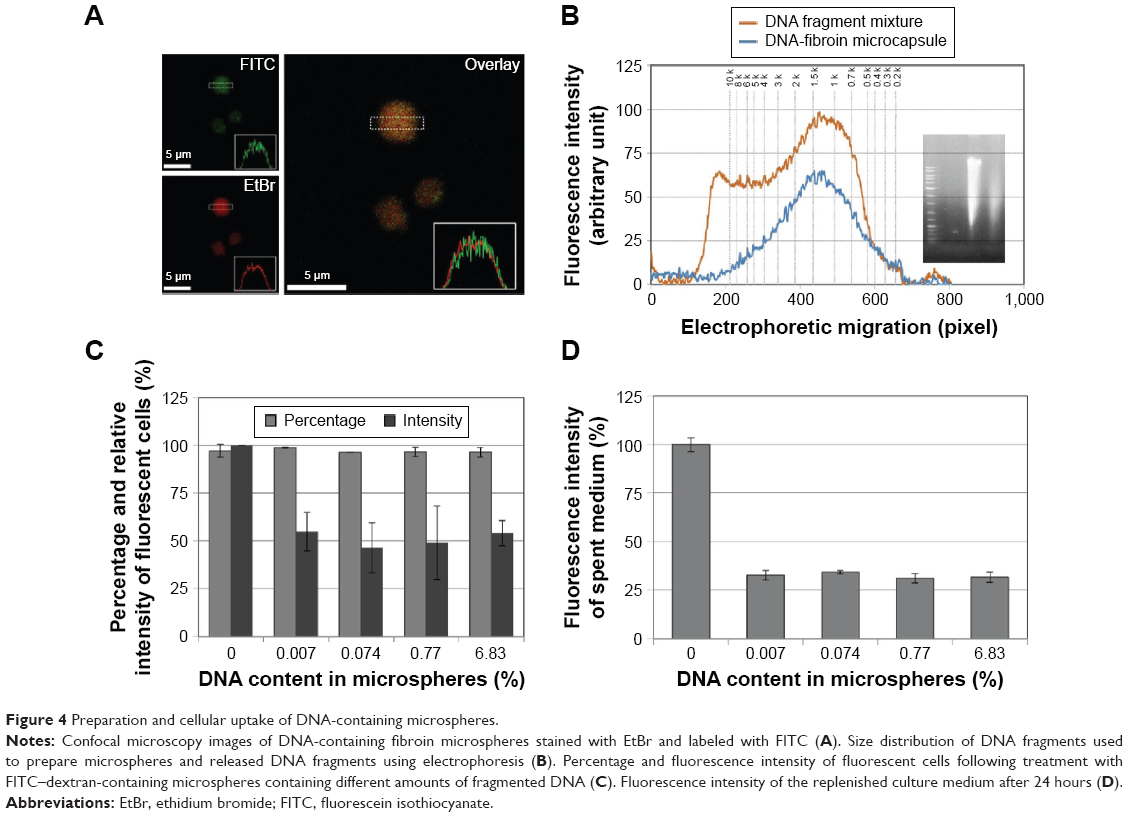 | Figure 4 Preparation and cellular uptake of DNA-containing microspheres. |
The effect of cargo DNA on the cellular uptake and secretion of fibroin microspheres was investigated using FITC–dextran-containing microspheres loaded with different amounts of fragmented DNA. Since fibroin and DNA molecules were dissolved in aqueous droplets in water-in-oil emulsion in the process of microsphere preparation, DNA molecules are quantitatively retained in the microspheres. These were added to 3T3 cells, the cells were incubated for 24 hours, and then the medium was replenished. After 24 hours, the cells and spent culture medium were harvested and analyzed by flow cytometry. Most cells were fluorescent indicating uptake of fluorescent microspheres (Figure 4C). However, cellular fluorescence intensity was decreased to 55.4%±19.5%, 47.9%±22.6%, 36.3%±9.4%, and 53.1%±6.2% in the cells treated with microspheres loaded with 0.007%, 0.074%, 0.71%, and 6.82% fragmented DNA, respectively. Flow cytometry also estimated the amount of DNA loaded in the microspheres taken up by cells, which were 0.27 pg/cell, 5.1 pg/cell, 66.3 pg/cell, and 831.0 pg/cell. DNA loading also decreased the fluorescence intensity of the spent culture medium by approximately threefold in comparison to that of the control (Figure 4D). These results demonstrate that cellular uptake and extracellular secretion of microspheres were inhibited by the presence of DNA molecules in microspheres.
We further investigated the effect of DNA fragment size on the uptake and secretion of microspheres. FITC–dextran-containing microspheres were fabricated to contain fragmented DNA that was prepared by differential sonication (Figure 5A). More than 90% of DNA was fragmented to shorter than 10 kb and 3 kb by sonication for 30 seconds and 60 seconds, respectively. FITC–dextran-containing microspheres containing this fragmented DNA (6.8%) were prepared and added to 3T3 cells. Flow cytometry determined that most cells became fluorescent (Figure 5B); however, fluorescence intensity was significantly higher in cells treated with microspheres containing shorter DNA fragments (sonicated for 60 seconds) than in cells treated with microspheres containing longer DNA fragments (sonicated for 30 seconds) (Figure 5C). The fluorescence intensity of the spent culture media was decreased from 11.76%±1.44% to 9.15%±1.93% and 8.30%±0.77% following the treatment of cells with microspheres containing DNA that had been sonicated for 30 seconds and 60 seconds, respectively (Figure 5D). Accordingly, shorter DNA fragments facilitated the cellular uptake of microspheres and inhibited the extracellular removal of microspheres themselves and/or released FITC–dextran. These results show that the fluorescence of the spent medium is not always proportional to the number of microspheres taken up by the cells.
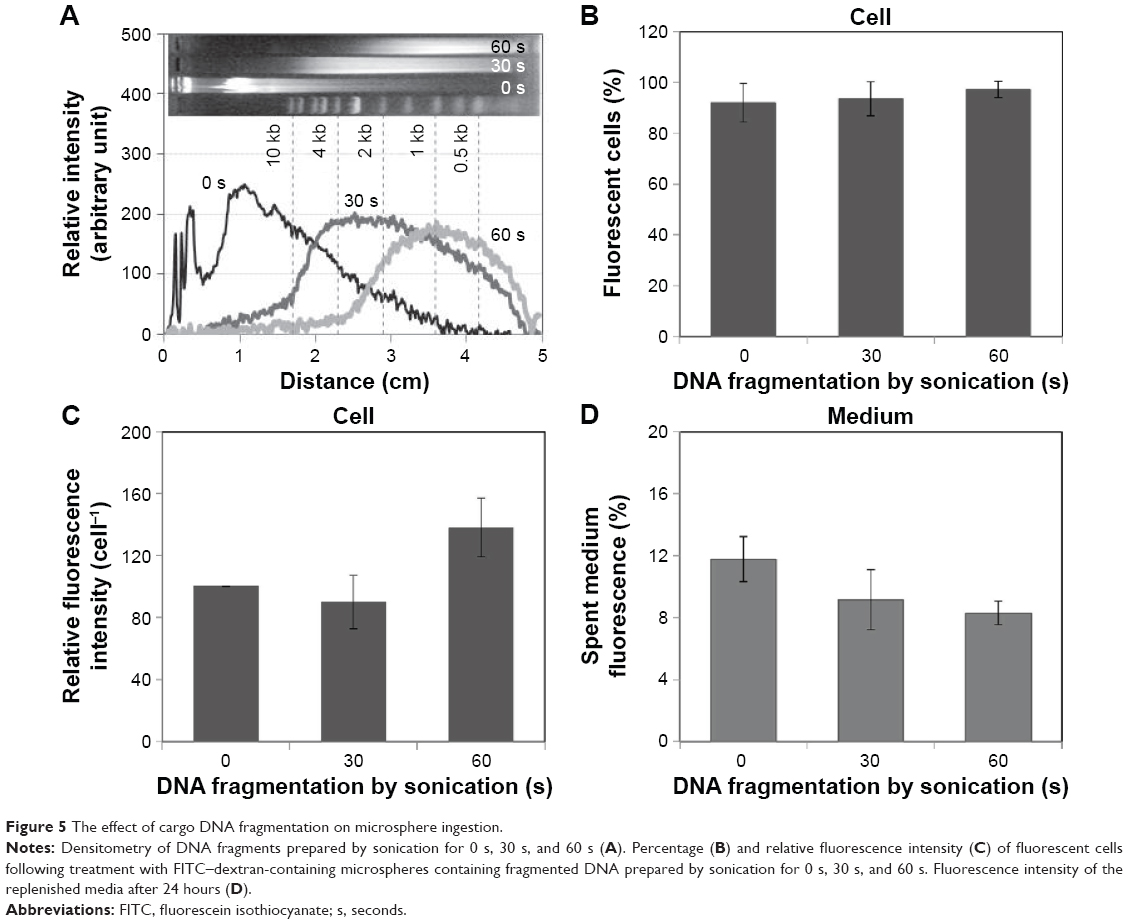 | Figure 5 The effect of cargo DNA fragmentation on microsphere ingestion. |
The effect of DNA cargo on the subcellular localization of microspheres
Cells treated with microspheres (0.1 mg/mL) were harvested and stained with LysoTracker Red, a pH-sensitive dye that emits red fluorescence in lysosomes, to trace the subcellular localization of microspheres. CLSM images in the respective wavelength channels (FITC and LysoTracker Red) and the overlay of these images on to representative cell images are shown in Figure 6. The overlay image of 3T3 cells treated with FITC–dextran-containing microspheres with and without DNA shows green and red fluorescent foci in cytoplasmic compartments (top and middle row of Figure 6). This result indicates that fibroin microspheres were localized in the nonlysosomal compartment. Thus, DNA cargo does not seem to affect the subcellular localization of fibroin microspheres. Fibroin microspheres containing only FITC-labeled fragmented DNA were prepared and added to cells. CLSM showed that the cells contained orange-colored foci and green foci (bottom row of Figure 6), indicating the lysosomal localization of FITC-DNA. This suggests that a portion of FITC-DNA was released from microspheres and transported to the endocytic lysosomal compartment. Accordingly, these results demonstrate that, following cellular uptake, fibroin microspheres were not routed to the lysosomal compartment.
 | Figure 6 Fluorescence and overlay images of 3T3 cells stained with LysoTracker Red following treatment with FITC–dextran-containing microspheres without DNA (top row), FITC–dextran-containing microspheres with DNA (middle row), and FITC-DNA-containing microspheres (bottom row). |
Discussion
Fibroin microspheres were taken up and resided in the nonlysosomal compartment of 3T3 cells. The observation is similar to large latex particles (500 nm) that were internalized by caveolae-mediated endocytosis and were not directed to the lysosomal compartment in nonphagocytic cells.12 The authors also showed that small latex particles (<200 nm) were subjected to lysosomal degradation. Some bacterial pathogens enter cells via caveolae-mediated endocytosis, thereby escaping degradation in the lysosomal compartment.14 Similarly, in this study, internalized fibroin microspheres were not routed to lysosomes. However, internalized nanoparticles mostly proceed through the endocytic pathway toward lysosomal compartments. Accordingly, size seems to be a critical factor that determines the endocytic pathway. Further investigations are needed to confirm that the entry pathway of fibroin microspheres underlies the delivery of these particles to the cytoplasm, not to lysosomes.
Cellular secretion of micron-sized particles has been seldom investigated, whereas nanoparticle exocytosis has been extensively studied. Internalized nanoparticles can be actively transported to the periphery of cells and exocytosed or fused with lysosomes and other cytoplasmic compartments that have a slow turnover.15,16 The localization of nanoparticles into organelles is a key factor in exocytosis.17 In this study, fibroin microspheres were secreted into the culture media upon medium replenishment and were eventually removed by repeated medium changes. Taken together, microsphere secretion may have a different trafficking pathway to secretion.
Fragmented DNA molecules were distributed evenly throughout microspheres, and >50% was released by electrophoresis. Thus, DNA cargo can be released to cytoplasm and subjected to lysosomal degradation. Exogenous double-stranded DNA is recognized by Toll-like receptor 9 and is transported to lysosomes for degradation.18,19 This is similar to the innate immune responses that eliminate viruses and other intracellular microbes via endolysosomal trafficking and degradation.20 Thus, we can expect that DNA fragments released from microspheres have certain effects on cellular uptake and secretion of microspheres.
This study also showed that the size of cargo DNA influenced the cellular uptake and secretion of microspheres; small DNA fragments facilitated microsphere uptake and inhibited their extracellular secretion by 3T3 cells. Microspheres contained an identical amount of differentially fragmented salmon testis DNA; therefore, the number of small DNA fragments was significantly higher than that of less fragmented DNA. Diffusion of large DNA fragments is much slower than that of smaller DNA fragments in the crowded cytosol with actin networks.21 Thus, a large amount of small DNA fragments easily released from microspheres might be responsible for the effects of cargo DNA size on microsphere uptake and secretion; however, the detailed mechanism was not elucidated.
Conclusion
This study demonstrated that fibroin microspheres were taken up by 3T3 cells, retained in the nonlysosomal cytoplasmic compartment, and secreted into the culture medium. The intracellular trafficking was not influenced by the presence of cargo DNA in the microspheres. Cargo DNA decreased the amounts of microspheres taken up and secreted by 3T3 cells but had no effect on the percentage of cells that ingested microspheres.
Accordingly, fibroin microspheres have the potential to be developed as a means to modulate and monitor intracellular physiology. Because of their micron-scale size, fibroin microspheres can be developed as an intracellular delivery vehicle for complicated cargoes such as mixtures of nucleases and DNA that continuously release decoy molecules, siRNA or microRNA sponges for gene expression control, and unmethylated CpG DNA for activating immune cells. Since fibroin microspheres travel through cells without undergoing lysosomal degradation, secreted microspheres may contain some cytoplasmic molecules that enable us to monitor intracellular physiology.
Acknowledgment
This research was supported by the Basic Science Research Program through the National Research Foundation of Korea (NRF) funded by the Ministry of Education, Science, and Technology (NRF-2013R1A1A2074373).
Disclosure
The authors report no conflicts of interest in this work.
References
Go NK, Lee LS, Lee JH, Hur W. Growth, cell cycle progression, and morphology of 3T3 cells following fibroin microsphere ingestion. J Biomed Mater Res A. 2015;103(4):1325–1331. | ||
Alexander LM, Pernagallo S, Livigni A, Sánchez-Martín RM, Brickman JM, Bradley M. Investigation of microsphere-mediated cellular delivery by chemical, microscopic and gene expression analysis. Mol Biosyst. 2010;6(2):399–409. | ||
Palamà IE, Coluccia AML, della Torre A, et al. Multilayered polyelectrolyte capsules and coated colloids: cytotoxicity and uptake by cancer cells. Sci Adv Mater. 2010;2:138–150. | ||
Putnam D. Polymers for gene delivery across length scales. Nat Mater. 2006;5(6):439–451. | ||
Présumey J, Salzano G, Courties G, et al. PLGA microspheres encapsulating siRNA anti-TNFalpha: efficient RNAi-mediated treatment of arthritic joints. Eur J Pharm Biopharm. 2012;82(3):457–464. | ||
De Stefano D, De Rosa G, Maiuri MC, et al. Oligonucleotide decoy to NF-κB slowly released from PLGA microspheres reduces chronic inflammation in rat. Pharmacol Res. 2009;60(1):33–40. | ||
Wu J, Yamanouchi D, Liu B, Chu CC. Biodegradable arginine-based poly (ether ester amide)s as a non-viral DNA delivery vector and their structure–function study. J Mater Chem. 2012;22:18983–18991. | ||
Zhu X, Xu Y, Solis LM, et al. Long-circulating siRNA nanoparticles for validating Prohibitin1-targeted non-small cell lung cancer treatment. Proc Natl Acad Sci U S A. 2015;112(25):7779–7784. | ||
Varkouhi AK, Scholte M, Storm G, Haisma HJ. Endosomal escape pathways for delivery of biological. J Control Release. 2011;151(3):220–228. | ||
Jay SM, Skokos EA, Zeng J, Knox K, Kyriakides TR. Macrophage fusion leading to foreign body giant cell formation persists under phagocytic stimulation by microspheres in vitro and in vivo in mouse models. J Biomed Mater Res A. 2010;93(1):189–199. | ||
Yan Y, Johnston AP, Dodds SJ, et al. Uptake and intracellular fate of disulfide-bonded polymer hydrogel capsules for doxorubicin delivery to colorectal cancer cells. ACS Nano. 2010;4(5):2928–2936. | ||
Rejman J, Oberle V, Zuhorn IS, Hoekstra D. Size-dependent internalization of particles via the pathways of clathrin- and caveolae-mediated endocytosis. Biochem J. 2004;377(Pt 1):159–169. | ||
Kim EJ, Lee SY, Hur W. Preparation of core-shell microcapsules using nanodispersed fibroin. J Appl Polym Sci. 2011;121:3460–3465. | ||
Shin JS, Abraham SN. Caveolae as portals of entry for microbes. Microbes Infect. 2001;3(9):755–761. | ||
Panyam J, Labhasetwar V. Dynamics of endocytosis and exocytosis of poly (D, L-lactide-co-glycolide) nanoparticles in vascular smooth muscle cells. Pharm Res. 2003;20(2):212–220. | ||
Cartiera MS, Johnson KM, Rajendran V, Caplan MJ, Saltzman WM. The uptake and intracellular fate of PLGA nanoparticles in epithelial cells. Biomaterials. 2009;30(14):2790–2798. | ||
Sakhtianchi R, Minchin RF, Lee KB, Alkilany AM, Serpooshan V, Mahmoudi M. Exocytosis of nanoparticles from cells: role in cellular retention and toxicity. Adv Colloid Interface Sci. 2013;201:18–29. | ||
Krug A, Luker GD, Barchet W, Leib DA, Akira S, Colonna M. Herpes simplex virus type 1 activates murine natural interferon-producing cells through toll-like receptor 9. Blood. 2004;103(4):1433–1437. | ||
Lund J, Sato A, Akira S, Medzhitov R, Iwasaki A. Toll-like receptor 9-mediated recognition of Herpes simplex virus-2 by plasmacytoid dendritic cells. J Exp Med. 2003;198(3):513–520. | ||
Kawai T, Akira S. Innate immune recognition of viral infection. Nat Immunol. 2006;7(2):131–137. | ||
Dauty E, Verkman AS. Actin cytoskeleton as the principal determinant of size-dependent DNA mobility in cytoplasm. J Biol Chem. 2005;280(9):7823–7828. |
Supplementary materials
Video S1 The movie shows inverted phase-contrast time-lapse microscopic images of 3T3 cells in a six-well culture plate fed with fibroin microspheres. Arrows indicate cellular uptake of microspheres. The time-lapse covers a period of 29.7 minutes (AVI 400×400; 4.61 MB).
Video S2 The movie shows inverted phase-contrast time-lapse microscopic images of microsphere-ingested 3T3 cells in a six-well culture plate after medium replenishment. Arrows indicate cellular secretion of microspheres. The time-lapse covers a period of 172 minutes (AVI 400×400; 3.97 MB).
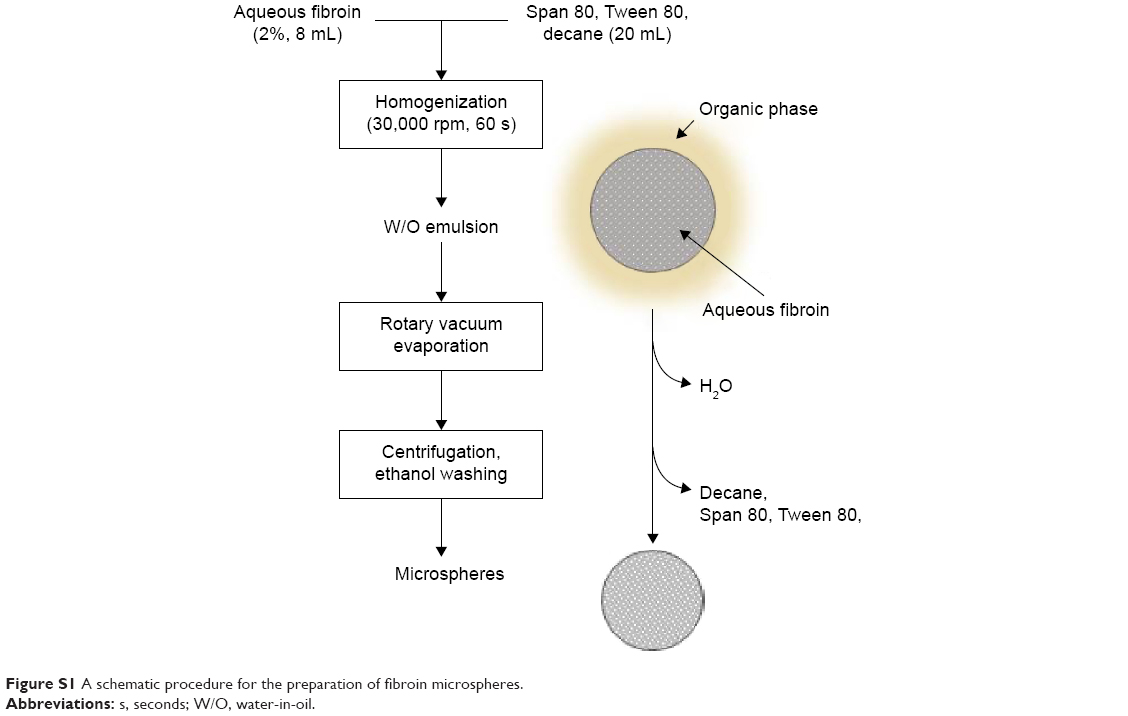 | Figure S1 A schematic procedure for the preparation of fibroin microspheres. |
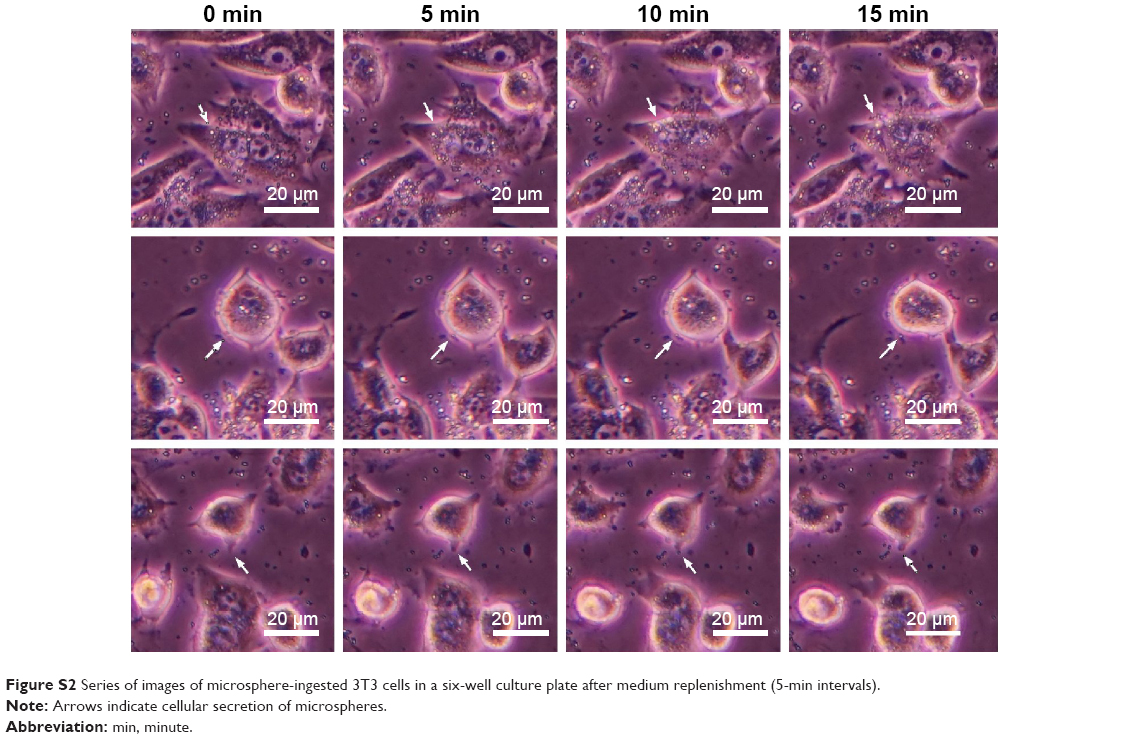 | Figure S2 Series of images of microsphere-ingested 3T3 cells in a six-well culture plate after medium replenishment (5-min intervals). |
 © 2016 The Author(s). This work is published and licensed by Dove Medical Press Limited. The full terms of this license are available at https://www.dovepress.com/terms.php and incorporate the Creative Commons Attribution - Non Commercial (unported, v3.0) License.
By accessing the work you hereby accept the Terms. Non-commercial uses of the work are permitted without any further permission from Dove Medical Press Limited, provided the work is properly attributed. For permission for commercial use of this work, please see paragraphs 4.2 and 5 of our Terms.
© 2016 The Author(s). This work is published and licensed by Dove Medical Press Limited. The full terms of this license are available at https://www.dovepress.com/terms.php and incorporate the Creative Commons Attribution - Non Commercial (unported, v3.0) License.
By accessing the work you hereby accept the Terms. Non-commercial uses of the work are permitted without any further permission from Dove Medical Press Limited, provided the work is properly attributed. For permission for commercial use of this work, please see paragraphs 4.2 and 5 of our Terms.