")
Back to Journals » International Journal of Nanomedicine » Volume 10 » Issue 1
CdTe quantum dots induce activation of human platelets: implications for nanoparticle hemocompatibility
Authors Samuel S, Santos-Martinez M , Medina C, Jain N, Witold Radomski M, Prina-Mello A, Volkov Y
Received 27 November 2014
Accepted for publication 15 February 2015
Published 2 April 2015 Volume 2015:10(1) Pages 2723—2734
DOI https://doi.org/10.2147/IJN.S78281
Checked for plagiarism Yes
Review by Single anonymous peer review
Peer reviewer comments 4
Editor who approved publication: Dr Thomas Webster
Stephen P Samuel,1 Maria J Santos-Martinez,2–4 Carlos Medina,2,3 Namrata Jain,1 Marek W Radomski,2,3 Adriele Prina-Mello,1,5 Yuri Volkov1,5
1Department of Clinical Medicine, Institute of Molecular Medicine, Trinity College Dublin, Dublin, Ireland; 2School of Pharmacy and Pharmaceutical Sciences, Trinity College Dublin, Dublin, Ireland; 3Trinity Biomedical Sciences Institute, Trinity College Dublin, Dublin, Ireland; 4School of Medicine, Trinity College Dublin, Dublin, Ireland; 5AMBER and CRANN, Trinity College Dublin, Dublin, Ireland
Abstract: New nanomaterials intended for systemic administration have raised concerns regarding their biocompatibility and hemocompatibility. Quantum dots (QD) nanoparticles have been used for diagnostics, and recent work suggests their use for in vivo molecular and cellular imaging. However, the hemocompatibility of QDs and their constituent components has not been fully elucidated. In the present study, comprehensive investigation of QD–platelet interactions is presented. These interactions were shown using transmission electron microscopy. The effects of QDs on platelet function were investigated using light aggregometry, quartz crystal microbalance with dissipation, flow cytometry, and gelatin zymography. Platelet morphology was also analyzed by phase-contrast, immunofluorescence, atomic-force and transmission electron microscopy. We show that the QDs bind to platelet plasma membrane with the resultant upregulation of glycoprotein IIb/IIIa and P-selectin receptors, and release of matrix metalloproteinase-2. These findings unravel for the first time the mechanism of functional response of platelets to ultrasmall QDs in vitro.
Keywords: platelets, quantum dots, aggregometry, flow cytometry, zymography, quartz crystal microbalance, transmission electron microscopy
Introduction
Nanomedicine pursues the use of nanoparticles (NPs) in advancement of both diagnostic and therapeutic agents.1 Semiconductor quantum dots (QDs), an important class of emerging nanomaterial in the nanotechnology toolbox, are widely anticipated to find application in many consumer and clinical products in the near future.2 The diverse potential applications of QDs are attributed to their unique optoelectronic properties such as size-tunable narrow emission spectra, high quantum yields, broad-range excitation, and high photostability.3 QDs are being developed for a variety of biologically oriented applications, including immunoassays, biomedical imaging, drug delivery, and photodynamic therapy.4 However, for biological applications, QDs must be surface passivated with other materials allowing dispersion and preventing leakage of toxic heavy metals.5 Studies have shown that both negatively and positively charged QDs can be endocytosed,6 and there is evidence that QDs exploit the cell’s active-transport machineries for cytoplasmic and intranuclear delivery.7
The major routes of human exposure to NP are transcutaneous, oral (enteric), or parenteral. Systemic delivery of NP-based therapeutic or diagnostic agents implies the interactions of NP with constituents of blood. Platelets are anucleate megakaryocyte-derived cell elements measuring 1.5–3.0 microns and constitute one of the major components of the hemostatic system besides plasma and endothelial cells. Platelets conserve asymmetric orientation of membrane phospholipids like all eukaryotic cells. Platelet activation leads to rapid disruption of this asymmetry leading to calcium-dependent exposure of anionic phospholipids at the outer platelet surface.8 Platelets possess a negative surface charge, and a decrease in negative charge leads to increased platelet reactivity.9 Platelets are highly granulated discoid blood elements that circulate in a quiescent state until activation. Upon activation, platelets undergo shape change, leading to pseudopodia formation and the release of platelet-dense and alpha-granule content.10 The vascular damage and endothelial denudation leads to platelet adhesion to subendothelial proteins such as collagen and von Willebrand factor. Platelet adhesion receptors, including glycoprotein (GP)Ib, are involved in these interactions. The platelet–platelet interactions and aggregation are mediated through various GP receptors, in particular GPIIb/IIIa, leading to a cascade of events resulting in a hemostatic plug.11 GPIIb/IIIa plays a central role in primary hemostasis by establishing platelet aggregates using fibrinogen as a bridging molecule.12,13
P-selectin is yet another important receptor involved in platelet function. P-selectin constitutively resides in platelet alpha granules and is translocated to the platelet surface upon aggregation. This translocation ensures platelet–leukocyte interactions. Therefore, both GPIIb/IIIa and P-selectin represent platelet activation markers.14 Activated platelets also release a proaggregatory gelatinase matrix metalloproteinase (MMP)-2 that is translocated to the platelet surface from the cytoplasm upon activation.15 Its molecular effects involve upregulation of GPIIb/IIIa and GPIb/V/IX receptors.16 Although platelets serve an important role in the control of physiological hemostasis, they also participate in pathological thrombosis, which is associated with vascular diseases such as myocardial infarction and stroke.17
The pharmacological responses of platelets to NPs such as Ag,18 Au,19 SiO2,20 carbon,21 QDs,22 diesel particles,23 particulate matter,24 and cetyl alcohol/polysorbate NPs25 have been studied. However, to date molecular mechanisms involved in the interactions between platelet and QDs have not been systematically investigated. Therefore, we have studied the effects of negatively and positively charged cadmium–telluride QDs (CdTe QDs) on human platelet function in the presence or absence of plasma. We have found that QDs have the ability to stimulate platelet aggregation in both no-flow and underflow conditions.
Materials and methods
Chemicals and materials
CdTe QDs with a negative or positive surface charge were synthesized and characterized at the School of Chemistry, Trinity College Dublin as reported previously.26 Thioglycolic acid provides a negative surface charge, and cysteamine provides a positive surface charge to the QDs. Hereinafter, they are referred to as “negatively” and “positively” charged CdTe QDs. A UV-1601 UV-Visible Spectrophotometer (Shimadzu Corporation, Kyoto, Japan) was used to measure QDs’ absorption. The concentration of particles was determined using Beer’s law and the Brus equation. A Varian Cary Eclipse Fluorescence Spectrophotometer (Agilent Technologies, Santa Clara, CA, USA) was used to determine the fluorescence emission/photoluminescence spectra of QDs. The excitation wavelength was 480 nm and the emission was detected in the 490–700 nm range. The quantum yields were calculated from the photoluminescence spectra using Rhodamine 6G as a reference. Zeta potential of NPs was measured on a Malvern Zetasizer (V5.10) (Malvern Instruments, Malvern, UK). The concentration of samples used for these measurements was typically corresponding to absorbance ~0.2 in the plasmon band. Three measurements were taken for each sample, by collecting 10–20 acquired data points for each measurement. QD characteristics are presented in Table 1.
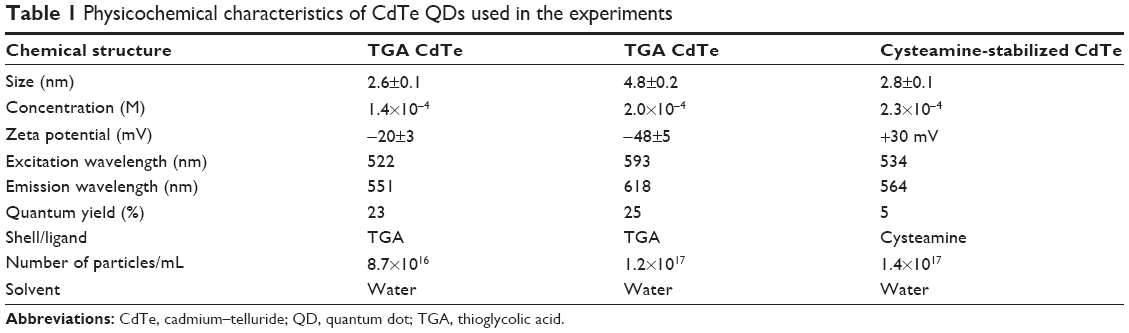 | Table 1 Physicochemical characteristics of CdTe QDs used in the experiments |
All reagents were from Sigma-Aldrich (Dublin, Ireland) unless otherwise indicated. Collagen was from Chrono-log (Labmedics [UK] LLP, Abingdon on Thames, UK). Alexa Fluor (AF)®546-phalloidin and AF®488-phalloidin were from Molecular probes (Thermo Fisher Scientific, Waltham, MA, USA). P-selectin and PAC1 (activated GPIIb/IIIa) antibodies were from BD Biosciences (BD Biosciences, Oxford, UK). Aqueous mounting medium was from DakoCytomation (Glostrup, Denmark). All plasticware was from Nunc (Thermo Fisher Scientific).
Blood preparation
Blood was collected using trisodium citrate (3.15%, 9:1 v/v) from healthy volunteers who had not taken any drugs known to affect platelet function for 14 days prior to the study. Platelet rich plasma (PRP) was obtained by centrifugation at 240× g for 20 minutes at room temperature. Washed platelets (WPs) were isolated in the presence of prostacyclin as described before.27 Platelets were counted using a Coulter counter (Beckman Coulter Inc. Brea, CA, USA). Afterwards, the final platelet number (2.5×10⁸ platelets per mL) in PRP/WP was adjusted using Tyrode’s solution.27 The study was approved by the Research Ethics Committee (Faculty of Health Sciences, Trinity College Dublin).
Light transmission aggregometry
Aggregation was measured using a four-channel Chrono-log whole blood Lumi-Aggregometer (Chrono-log Corporation, Havertown, PA, USA) linked to Aggro-link data-reduction systems.21 PRP and WP samples were incubated in the presence or absence of negatively or positively charged CdTe QDs (0.1–5.0 μM) and aggregation was monitored for 20 minutes. Nonaggregated (resting) or collagen-aggregated (10 μg/mL) PRP/WP samples were taken as negative and positive controls, respectively. The results were expressed as percentage of light transmission, where 100% transmission (platelet-poor plasma [PPP] or Tyrode’s solution) were taken as maximal aggregation.
Flow cytometry
Flow cytometry was used to analyze the expression of receptors on the surface of platelets as an index of aggregation. PRP and WPs were treated with negatively charged 2.6 nm or 4.8 nm CdTe QDs in the aggregometer. PRP samples were treated with 3 μM CdTe QDs, and WP samples were analyzed at concentrations ranging from 0.1–5.0 μM CdTe QDs. Resting and collagen-aggregated platelets were taken as negative and positive controls, respectively; 10 μL of samples were taken from the cuvettes when collagen-induced platelet aggregation reached 50% as positive control. The samples were then incubated in equal volume of P-selectin antibody (CD62P-APC [allophycocyanin] from BD Biosciences) in the dark for 5 minutes at room temperature. Following incubation, samples were diluted in FACSFlow™ sheath fluid (BD Biosciences) and analyzed within 5 minutes using BD FACSArray (BD Biosciences). Samples were excited with 635 nm and the instrument was set up to measure the size (forward scatter), granularity (side scatter), and cell fluorescence. Antibody binding was measured by analyzing activated platelets for fluorescence.
Zymography
Samples of WPs were treated with negatively or positively charged CdTe QDs (1–5 μM) in the aggregometer. Afterwards, platelets were pelleted by centrifugation (1,400× g for 5 minutes, at room temperature) in the presence of prostacyclin (1 μM) and the supernatant stored at −80°C until assayed. Conditioned medium from phorbol 12-myristate 13-acetate (100 nM)-stimulated human fibrosarcoma HT1080 cells was used as gelatinase standard. Resting and collagen-aggregated platelets were also pelleted and the supernatant thus obtained taken as negative and positive controls, respectively. The activity of MMP-2 was measured by zymography as described previously.21 Briefly, platelet supernatants were subjected to 8% sodium dodecyl sulphate–polyacrylamide gel electrophoresis in which the separating gels were copolymerized with 2 mg/mL gelatin. Gels were washed with 2.5% Triton X-100 to remove sodium dodecyl sulphate and then incubated in incubation buffer (0.15 M NaCl, 5 mM CaCl2, 0.05% NaN3, and 50 mM TRIS-HCl buffer, pH 7.5) for 5 days. After incubation, the gels were stained with 0.05% Coomassie brilliant blue and destained in destaining solution (methanol 10%, acetic acid 10%, and distilled water 80%). The gelatinolytic activities were detected as transparent bands against the background of Coomassie blue-stained gel under ultraviolet light and quantified using ChemiDoc MP Imaging System (Bio-Rad Life Sciences, Hercules, CA, USA). MMP-2 was identified by its molecular weight when compared to standards.
Quartz crystal microbalance with dissipation
Quartz crystal microbalance with dissipation (QCM-D; Q-Sense™ E4 system, Q-Sense AB, Goteborg, Sweden) was used to measure changes in frequency and energy dissipation of quartz crystals in response to adhesion of platelets under flow conditions.28 For the study of platelet aggregation, polystyrene-coated quartz crystals (5 MHz) were used as sensors following coating with fibrinogen. For fibrinogen coating, sensors were placed in fibrinogen dissolved in phosphate-buffered saline (PBS) (100 μg/mL) for 1 hour at room temperature. Samples of PRP (2.5×10⁸ platelets per mL) or PPP were perfused in the presence or absence of negatively charged 2.6 nm CdTe QDs at 37°C and at a flow rate of 100 μL/minute for 30 minutes. Changes in frequency and dissipation were recorded in real time using Q-Sense software (QSoft401, Q-Sense AB). The sensors were then subjected to microscopic analysis (phase contrast, fluorescent and atomic force microscopy).
Phase-contrast microscopy
The morphology of platelet aggregates adherent on quartz crystals were studied using Zeiss microscope (Axiovert 200M; Carl Zeiss, Cambridge, UK).29 Briefly, untreated PRP or negatively charged 2.6 nm CdTe QD-treated PRP suspensions were perfused on fibrinogen-coated polystyrene-coated quartz crystals for 30 minutes through QCM-D. The crystals were then subjected to phase-contrast microscopy examination using a 20x objective. Photomicrographs were captured and analyzed by using Zeiss microscope system and software (Axiovision 4.7; Carl Zeiss Meditec AG).
Fluorescent microscopy and immunostaining
Fluorescent microscopy was used to visualize both QDs and platelet activation markers. For this study, negatively charged 2.6 nm or 4.8 nm CdTe QD-induced WP aggregates were used at 50% aggregation. Following centrifugation, pellets were washed with PBS and then treated with either P-selectin or PAC-1 (recognizing activated GPIIb/IIIa receptor) antibodies conjugated with fluorescein isothiocyanate or allophycocyanin for 30 minutes at room temperature in the dark. The pellets were then fixed with 2% paraformaldehyde for 30 minutes at room temperature, stained with AF®546 phalloidin actin (red) (1:200 dilution) for 1 hour at room temperature, and allowed to air dry on a glass slide. Samples were then covered with a cover slip using mounting medium. For the study of resting platelets, platelets were treated with antibodies in suspension and mounted on a glass slide afterwards. Since QDs are fluorescent, the actin cytoskeleton was not stained in QD-induced platelet aggregates. In both cases, confocal images were taken using a 63x oil immersion objective, with a numerical aperture of 1.4, on a Zeiss LSM 510 Meta system (Carl Zeiss Meditec AG). The samples were visualized using 488 nm and 561 nm excitation filters and emission filters with band-passes of 505–550 nm and >575 nm, respectively.
Atomic-force microscopy
Atomic-force microscopy (AFM) of QCM-D crystal substrates enables mapping of different platelet responses29 in the presence or absence of QDs. For this study, untreated or 2.6 nm CdTe QD-treated PRP was perfused through the QCM-D device for 30 minutes. The crystals with adhered platelets were then retrieved and fixed with prewarmed 2.5% gluteraldehyde for 30 minutes at 37°C. Platelets were subsequently dehydrated through ascending grades of ethanol (from 60% up to 100%), and crystals were mounted onto glass slides with platelets facing upwards. The crystal-on-slide was mounted onto the microscope and images were taken using an Ntegra Spectra (NT-MDT, Moscow, Russia) AFM/Raman system. Imaging was carried out in dry-phase, semicontact AFM with a silicon–nitride tip (NSG10, “Golden” Silicon Probes; NT-MDT). The resonance frequency of the tip was found to be 280 KHz. Height AFM images were taken around the central area of the crystal, at 0.55 Hz. Image analysis was carried out on the height images using the NT-MDT-NOVA software (NT-MDT).
Transmission electron microscopy
Samples of WPs were treated with negatively charged 2.6 nm or 4.8 nm CdTe QDs in the aggregometer. The aggregatory reaction was stopped with prewarmed 2.5% glutaraldehyde when platelets reached 20% aggregation and left for 30 minutes at 37°C. Untreated (resting) platelets and collagen-treated platelets were taken as controls. Following centrifugation, platelet pellets were washed with PBS and further processed for transmission electron microscopy (TEM) imaging. Briefly, samples were post fixed for 1 hour in 1% osmium tetroxide in deionized water. After dehydration in increasing concentrations of EtOH (from 70% up to 100%), the samples were immersed in an ethanol/Epon (1:1 vol/vol) mixture for 1 hour before being transferred to pure Epon and embedded at 37°C for 2 hours. The final polymerization was carried out at 60°C for 24 hours. Ultrathin sections, obtained with a diamond knife using a Leica U6 ultramicrotome, were mounted on 300-mesh Cu grids and stained with uranyl acetate before being examined with a TEM microscope.
Statistical analysis
Light aggregometry results were expressed as a percentage of maximal aggregation. QCM-D results were expressed as a percentage of frequency and dissipation from the third overtone, where the maximal changes in frequency and dissipation at 30 minutes of perfusion for the control (2.5×10⁸ platelets per mL) were considered as 100% for each donor. At least three independent experiments were analyzed using GraphPad Prism (GraphPad Software, Inc., La Jolla, CA, USA). One-way analysis of variance and Dunnett’s or Tukey–Kramer’s or Bonferroni multiple comparisons posttest were performed where appropriate. Results were statistically significant at P<0.05. All data points represent mean values ± standard error of the mean.
Results
QDs aggregate human platelets in the absence of plasma
Using light transmission aggregometry (LTA),30 we found that both positively charged 2.8 nm and negatively charged 2.6 nm or 4.8 nm QDs (Figure 1A and C) did not cause significant activation of platelets in PRP. By contrast, a significant increase in aggregation was observed when WPs were treated with 0.1 μM, 1 μM, 3 μM, and 5 μM of positively charged QDs (Figure 1B) or 1 μM, 3 μM, and 5 μM of negatively charged QDs (Figure 1D). The results demonstrate that the QDs induce activation of platelets in the absence of plasma. Since maximum platelet aggregation was observed at the 3 μM concentration, this concentration was used for further experiments unless otherwise specified.
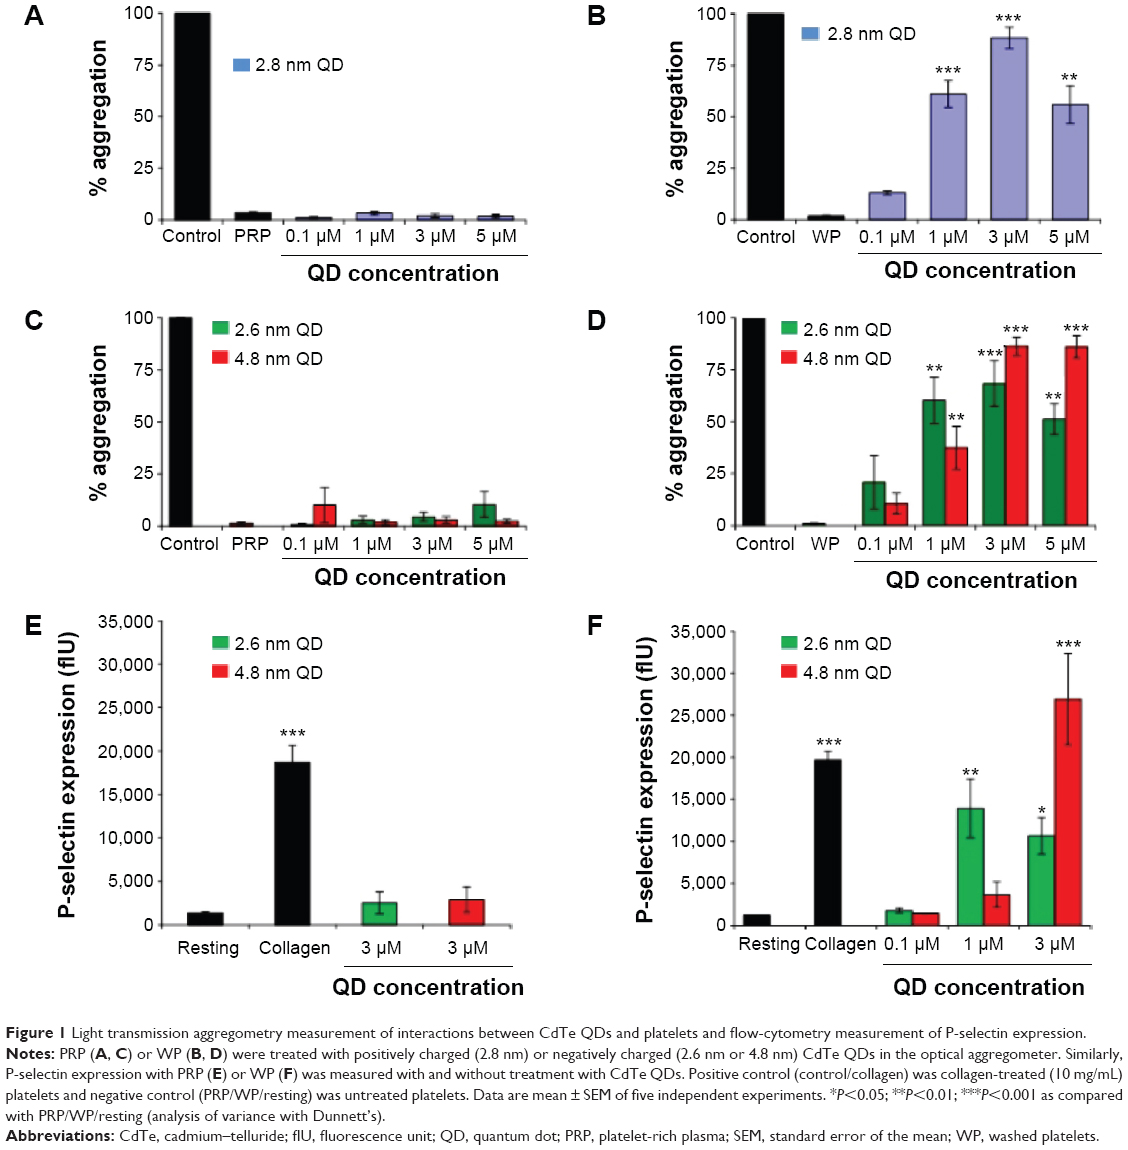 | Figure 1 Light transmission aggregometry measurement of interactions between CdTe QDs and platelets and flow-cytometry measurement of P-selectin expression. |
QDs upregulate surface expression of P-selectin and GPIIb/IIIa receptors
Platelet activation is associated with the surface translocation of P-selectin and activation of GPIIb/IIIa receptors. Therefore, we used flow cytometry and confocal microscopy to study the surface expression of these receptors on QD-treated platelets both in PRP and WP. The flow cytometry results are shown in Figure 1E and F. Treatment of PRP samples 1) with 3 μM QDs did not show significant increase in P-selectin expression compared to untreated platelets. However, samples of WP 2) showed a significant increase in P-selectin expression when treated with 1 μM and 3 μM QDs. The confocal images (maximal projection) demonstrating the expressions of P-selectin and activated GPIIb/IIIa receptors are shown in Figure 2A and B, respectively. Resting platelets did not express P-selectin receptors (Figure 2a–c). Minimal expression of activated GPIIb/IIIa receptors (Figure 2m–o) was observed under the same conditions. Confocal images (maximal projection) demonstrate that collagen (Figure 2d–f, p–r), and both 2.6 nm (Figure 2g–i, s–u) and 4.8 nm (Figure 2j–l, v–x) CdTe QD-induced platelet aggregates showed surface expression of P-selectin and activated GPIIb/IIIa.
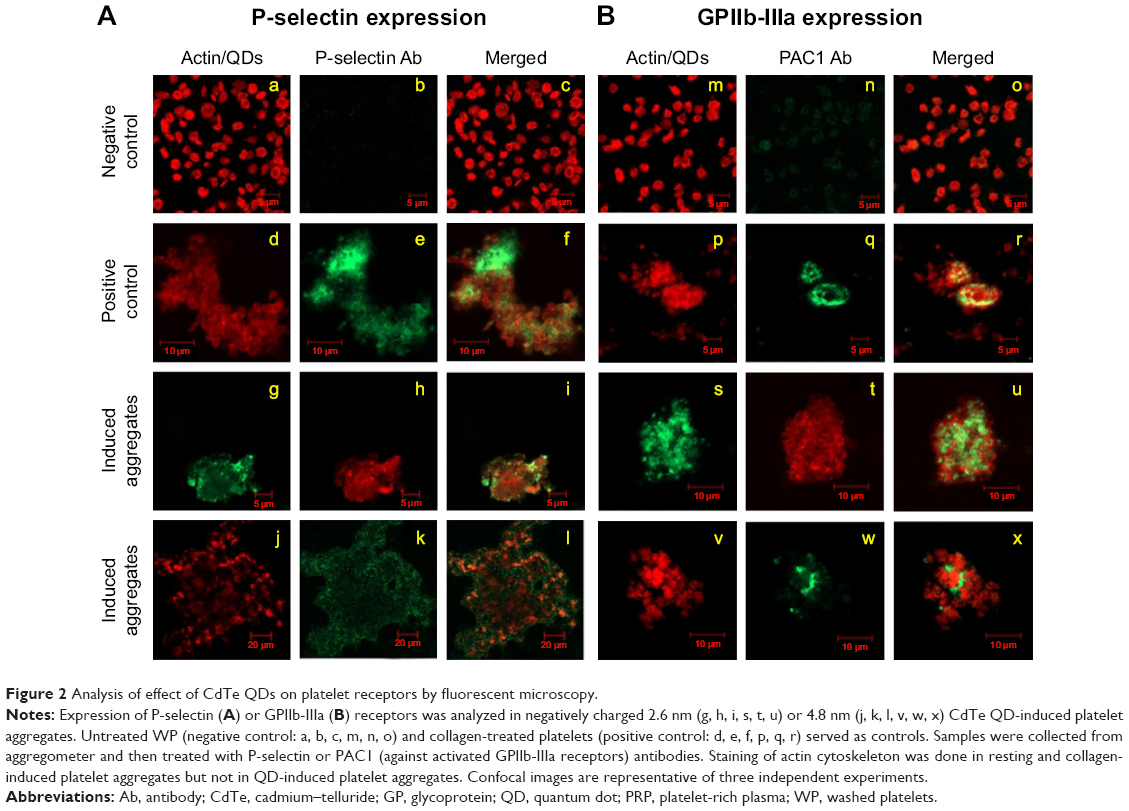 | Figure 2 Analysis of effect of CdTe QDs on platelet receptors by fluorescent microscopy. |
QDs induce MMP-2 release from platelets
Platelets contain and release MMP-2, a gelatinase, which acts as a stimulator31 of aggregation. Therefore, we studied the gelatinolytic activity of MMP-2 released from QD-activated platelets by gelatin gel zymography (Figure 3A) and quantified the resultant bands (Figure 3B). Releasates from 2.6 nm or 4.8 nm negatively charged QD-treated WPs showed a significant increase in MMP-2 activity compared to resting platelets for 1 μM and 3 μM. Positively charged 2.8 nm QDs induced a significant increase in MMP-2 activity for all the concentrations tested.
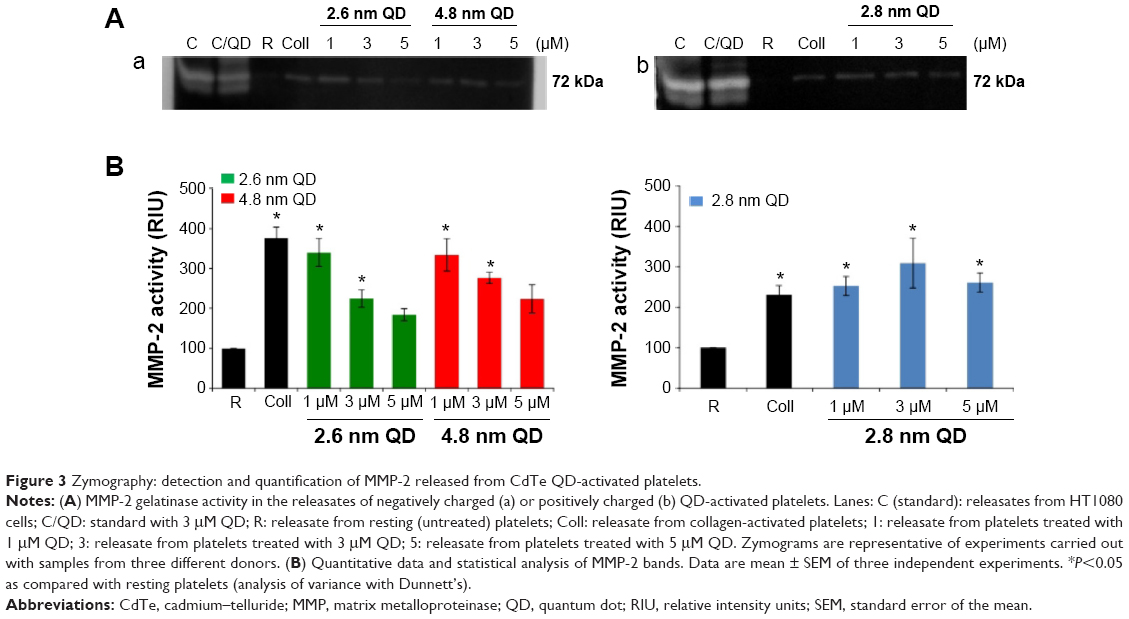 | Figure 3 Zymography: detection and quantification of MMP-2 released from CdTe QD-activated platelets. |
Ultramicroscopic study of QD-induced platelet activation
QDs are beyond the diffraction limit of resolution for conventional microscopy (~200 nm).32 Therefore, to study in depth the structure of QD-induced platelet–platelet interactions, TEM was used. TEM images of platelets are shown in Figure 4. Resting platelets (Figure 4A) did not show any pseudopodia, and the organelles were found randomly distributed throughout the cytoplasm. The microtubules in the resting platelets were localized in the periphery of the platelet. However, collagen-aggregated platelets (Figure 4B) showed formation of pseudopodia, and the organelles were concentrated in the center of the platelet. Both 2.6 nm (Figure 4C) and 4.8 nm (Figure 4D) QD-treated platelets showed degranulated intracellular granules and pseudopodia formation, and the QDs were clearly associated with the outer membrane of activated platelets.
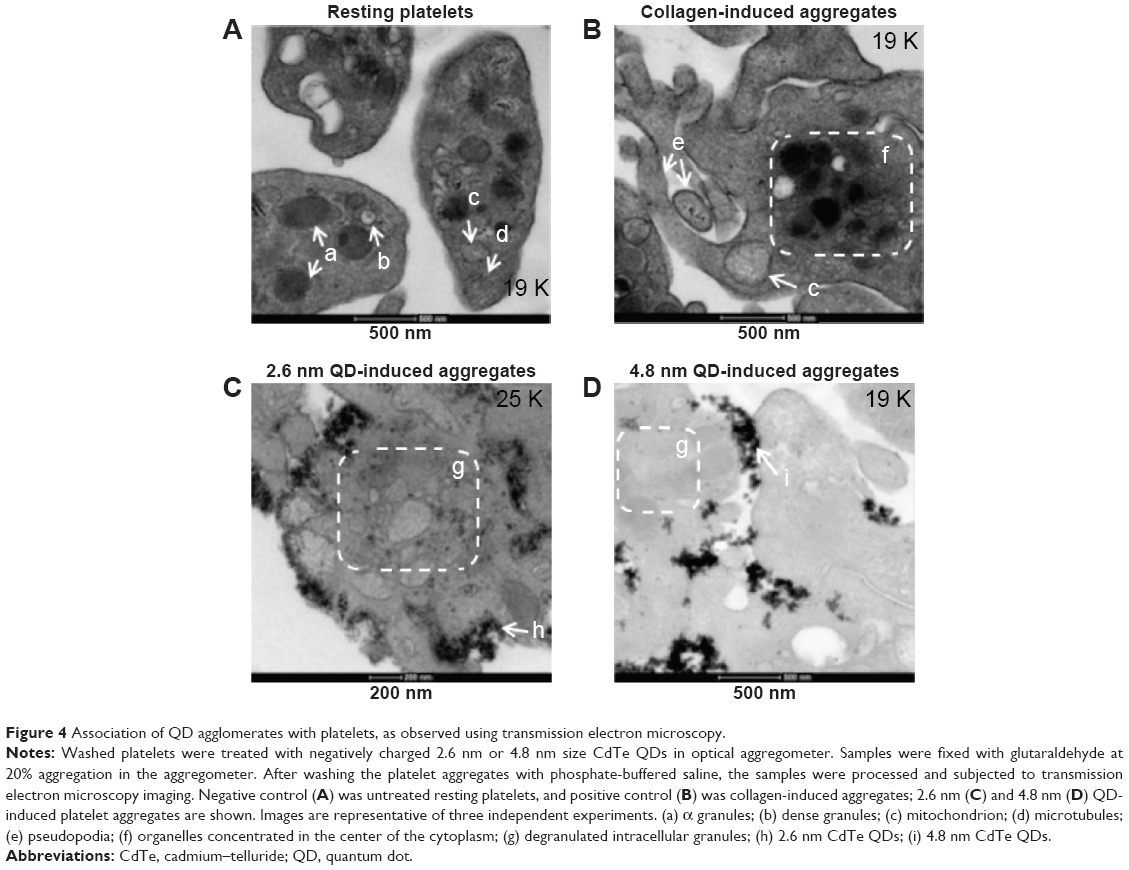 | Figure 4 Association of QD agglomerates with platelets, as observed using transmission electron microscopy. |
QDs induce platelet activation in the presence of plasma under flow conditions
Results obtained from our LTA and flow cytometry studies demonstrated that the presence of plasma was able to prevent platelets from being activated by QDs. However, LTA is performed under no-flow conditions, and the sensitivity of this method is low as it does not detect platelet microaggregates.33 Therefore, QCM-D was used to investigate the influence of negatively charged 2.6 nm CdTe QDs on platelet microaggregation. The results obtained are shown in Figure 5. PPP samples (Figure 5A and B) did not show any difference in frequency and dissipation when treated with QDs. However, significant changes in frequency and dissipation were observed in QD-treated PRP samples, consistent with generation of platelet microaggregates (Figure 5C and D). The platelet activation was further confirmed by the microscopic analysis of the crystals.
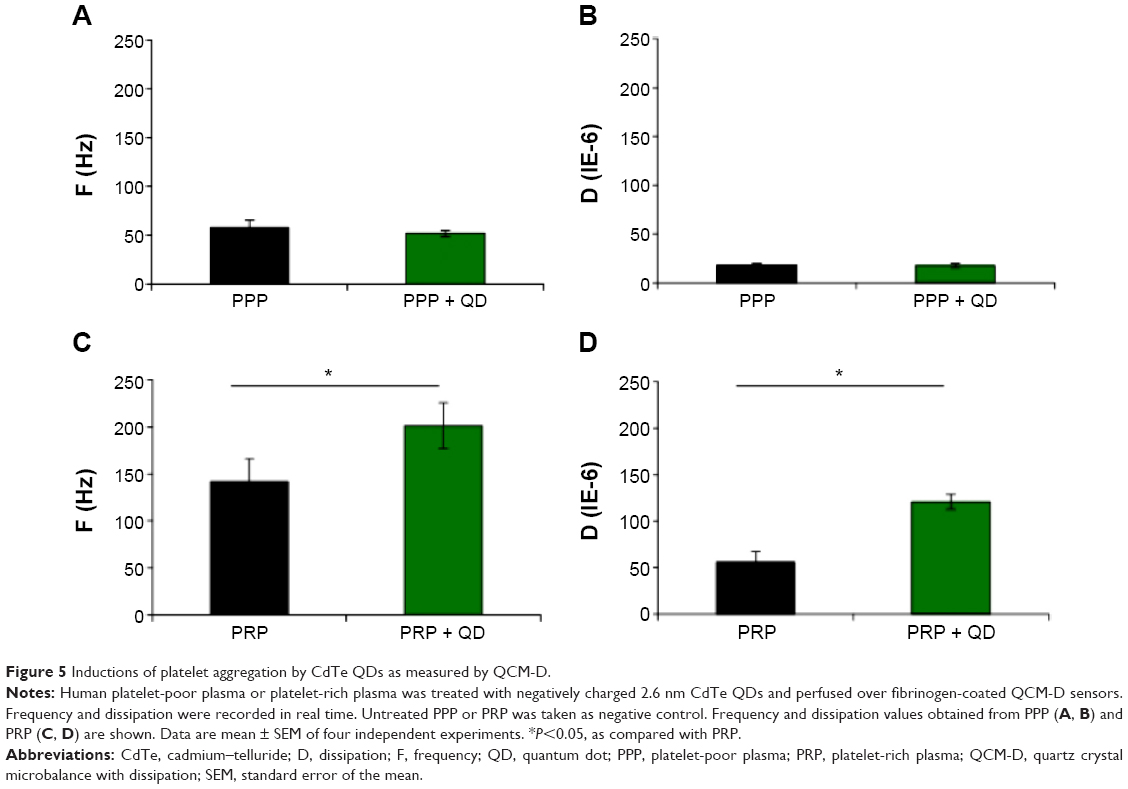 | Figure 5 Inductions of platelet aggregation by CdTe QDs as measured by QCM-D. |
Phase-contrast and AFM were used to visualize the morphology of flow-induced platelet microaggregates formed on the surface of fibrinogen-coated crystals. Phase-contrast images of platelets adhering on crystals are shown in Figure 6A. Images showed large platelet aggregates in PRP samples treated with QDs compared to the untreated PRP samples (n=4). Dry-phase images taken by AFM are shown in Figure 6B. Image analysis demonstrated the presence of platelet aggregates on crystals perfused with QD-treated PRP samples compared to discrete platelets on crystals perfused with untreated PRP.
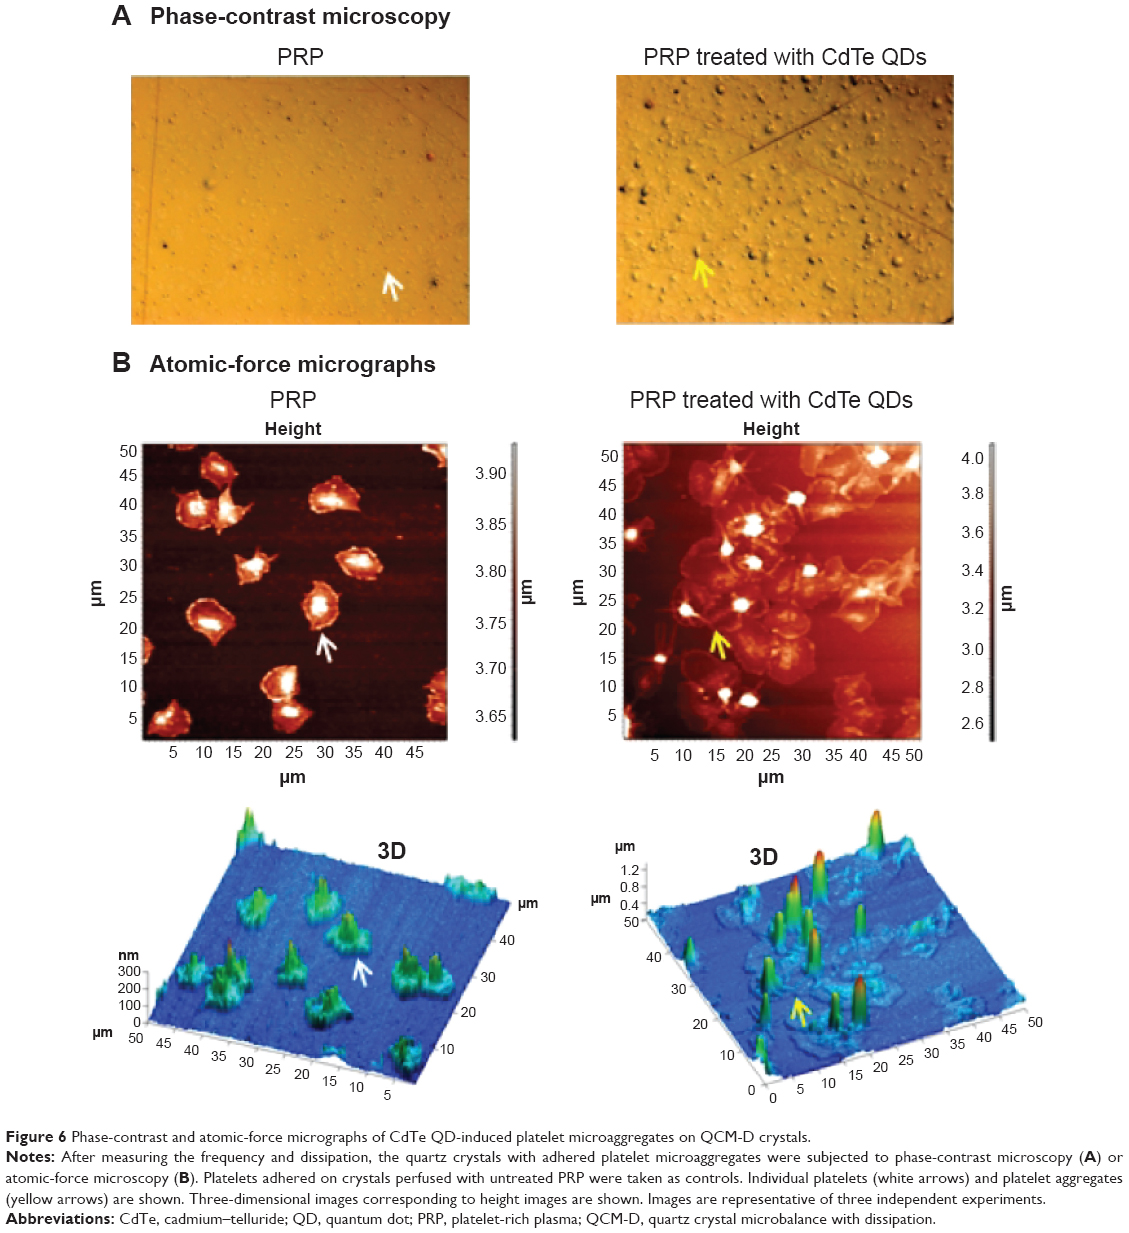 | Figure 6 Phase-contrast and atomic-force micrographs of CdTe QD-induced platelet microaggregates on QCM-D crystals. |
Discussion
Nanoparticle formulations designed for systemic administration have raised concerns regarding their biocompatibility. In addition, the kinetics and the efficacy of NP-based diagnostic and imaging tools may depend on the interactions of the vascular microenvironment with the particles. The NPs, after entering the blood stream, encounter a complex environment of plasma proteins and the cellular components of hemostasis. Indeed, we have demonstrated previously that NPs interacted with endothelial cells, and shear stress plays a critical role in the uptake and localization of QDs under flow conditions.34 Furthermore, thrombogenicity, the propensity of a material to induce blood clotting, is relevant to the safety of the NPs. The higher the circulation half-life values for the NPs in blood, the larger the chances for platelet–NP interactions.35 In this study, we investigated the effects of CdTe QDs on human platelets under quasi-dynamic and flow conditions using LTA and QCM-D. We analyzed the surface expression of platelet activation markers using flow cytometry and immunofluorescence studies. Gelatin zymography was used to detect the release of a proaggregatory enzyme MMP-2 from QD-activated platelets. In addition, we also analyzed the morphology of QD-induced platelet aggregates with AFM and TEM.
The influence of negatively or positively charged CdTe QDs on human platelet function in vitro was examined by LTA. These CdTe QDs did not induce platelet aggregation as measure by LTA. This is in agreement with a previous study done by Geys et al22 showing that CdSe/ZnS-QDs by themselves did not activate platelets in human PRP samples. The absence of platelet aggregation in the presence of plasma could be due to the adsorption of plasma proteins or lipids on the NPs, resulting in a biomolecular interface organization named “corona,” which determines the biological profile of the NP.36,37 Indeed, the binding of NPs with plasma proteins affects the interactions of NPs with cell membrane.38 In our study with WPs, QDs were found to cause significant aggregation. This response may be attributed to the absence of plasma proteins, which were washed off the platelets with Tyrode’s solution during platelet preparation. Interestingly, 2.6 nm QDs were found to cause aggregation at lower concentration than 4.8 nm QDs. This effect could be attributed to the larger surface-to-volume ratio39 available for QDs interaction with the suspended platelets. In addition, the extremely small size of QDs could allow for their direct interaction with the integrins on the platelet surface, leading to a significant functional response. Indeed, TEM showed QDs close interactions between particles and platelets. The ultrastructural examination of collagen and QD-treated platelet aggregates showed organelles concentrated in the center of platelets compared to resting platelets, and agglomerates of QDs were associated with the outer surface (plasma membrane) of the platelets. This suggests that QDs may most likely interact with the abundant surface GPIIb/IIIa, resulting in receptor activation and the aggregatory response.
The reduced aggregatory response observed at concentrations >3 μM could be due to the interference of QDs with the release of platelet granular content, thus limiting platelet activation. The positively charged CdTe QDs demonstrate a pattern of platelet aggregation that is similar to that of the negatively charged 2.6 nm QDs. Interestingly, Dobrovolskaia et al40 found that surface charge plays an important role in platelet aggregation induced by poly(amido amine) dendrimers. Indeed, large positively charged NPs induced aggregation while negatively charged and neutral particles were largely deprived of aggregatory effects. As QD-induced platelet aggregation in isolated platelets was stimulated both by positively and negatively charged particles, it is likely that in addition to platelet surface disruption,40 other molecular mechanisms are involved in proaggregatory effects of QD in plasma-free medium.
Recently, we have critically reviewed mechanisms involved in the interactions of nanomaterials with platelets.41 We proposed that nanomaterial-induced increases in intraplatelet calcium play a major role in NP-induced aggregation. This may result from direct physical breach of platelet membrane integrity or conformational changes of platelet receptors involved in aggregation, such as GPIIb/IIIa.
Platelet activation is associated with the upregulation of the surface receptors that play an important role in adhesion, aggregation, and platelet–leukocyte aggregation. The glycoprotein integrin receptor GPIIb/IIIa and P-selectin are established platelet activation markers. The activation of GPIIb/IIIa is crucial for platelet aggregation to occur.42 In addition, changes in the abundance of P-selectin on the platelet surface membrane underlie platelet–leukocyte aggregation and clot stabilization.21 Because QDs interfered with the flow cytometric measurement of GPIIb/IIIa antibodies, we measured the expression of P-selectin in samples of PRP and WPs. Data showed a significantly increased expression of P-selectin in WPs. The results observed by flow cytometry confirmed that the presence of plasma protects the platelets from activation under quasi-dynamic conditions. We used confocal imaging and showed QD-induced increase in these platelet receptors. The low expression level of these molecules on untreated resting platelets was probably due to cytoskeletal polymerization induced by platelet preparation.43
Gelatinases act as stimulators (MMP-2) or inhibitors (MMP-9) of aggregation, and their sequential release correlates with stimulation/inhibition of aggregation.44 MMP-2 has been shown to promote platelet adhesion to fibrinogen.45 Our zymography studies showed that QD-activated platelets released MMP-2, in agreement with previous studies involving NPs.20
The platelet activation observed in this study is in agreement with a number of previous studies performed using various NPs such as carbon,21 silver,18 gold,19 latex,46 silica,47 and particulate matter.48 Most of these studies were performed using LTA. We have shown that LTA may not be sensitive enough for studying platelet–NP interactions, and a more sensitive, flow-mimicking technique such as QCM-D29–33 may be preferred. In keeping with this notion, we detected QD-induced platelet aggregation in PRP using QCM-D but not LTA. As it is clear that NPs induce platelet activation and thrombus formation in animal models,21 the use of methodologies capable of measuring flow-induced platelet aggregation is recommended for studies on platelet–NP interactions.
Conclusion
In summary, this study demonstrates that QDs are able to activate platelets through complex mechanisms that may involve close interactions of QDs with platelet surface membranes, activation of GPIIb/IIIa, and release of a proaggregatory MMP-2. More experimental evidence is required to tease out the exact signaling pathways involved in QD-induced platelet activation. The data presented here necessitate the hemocompatibility testing of NPs prior to the design of parenteral/systemic nanomedicine.
Acknowledgments
This work was partly supported by the Higher Education Authority of Ireland, SFI-Ireland (SRC-Bionanointeract), EU FP7 projects: NAMDIATREAM (#246479) and MULTIFUN (#262943).
Disclosure
The authors report no conflicts of interest in this work.
References
Dobrovolskaia MA, Aggarwal P, Hall JB, McNeil SE. Preclinical studies to understand nanoparticle interaction with the immune system and its potential effects on nanoparticle biodistribution. Mol Pharm. 2008;5(4):487–495. | ||
Azzazy HM, Mansour MM. In vitro diagnostic prospects of nanoparticles. Clin Chim Acta. 2009;403(1–2):1–8. | ||
Rosenthal SJ, Chang JC, Kovtun O, McBride JR, Tomlinson ID. Biocompatible quantum dots for biological applications. Chem Biol. 2011;18(1):10–24. | ||
Azzazy HM, Mansour MM, Kazmierczak SC. From diagnostics to therapy: prospects of quantum dots. Clin Biochem. 2007;40(13–14):917–927. | ||
Weng J, Ren J. Luminescent quantum dots: a very attractive and promising tool in biomedicine. Curr Med Chem. 2006;13(8):897–909. | ||
Ryman-Rasmussen JP, Riviere JE, Monteiro-Riviere NA. Surface coatings determine cytotoxicity and irritation potential of quantum dot nanoparticles in epidermal keratinocytes. J Invest Dermatol. 2007;127(1):143–153. | ||
Nabiev I, Mitchell S, Davies A, et al. Nonfunctionalized nanocrystals can exploit a cell’s active transport machinery delivering them to specific nuclear and cytoplasmic compartments. Nano Lett. 2007;7(11):3452–3461. | ||
Lhermusier T, Chap H, Payrastre B. Platelet membrane phospholipid asymmetry: from the characterization of a scramblase activity to the identification of an essential protein mutated in Scott syndrome. J Thromb Haemost. 2011;9(10):1883–1891. | ||
Jung SM, Kinoshita K, Tanoue K, Isohisa I, Yamazaki H. Role of surface negative charge in platelet function related to the hyperreactive state in estrogen-treated prostatic carcinoma. Thromb Haemost. 1982;47(3):203–209. | ||
White JG, Burris SM. Morphometry of platelet internal contraction. Am J Pathol. 1984;115(3):412–417. | ||
Polanowska-Grabowska R, Simon CG Jr, Gear AR. Platelet adhesion to collagen type I, collagen type IV, von Willebrand factor, fibronectin, laminin and fibrinogen: rapid kinetics under shear. Thromb Haemost. 1999;81(1):118–123. | ||
Kamata T, Takada Y. Platelet integrin alphaIIbbeta3-ligand interactions: what can we learn from the structure? Int J Hematol. 2001;74(4):382–389. | ||
Wagner CL, Mascelli MA, Neblock DS, Weisman HF, Coller BS, Jordan RE. Analysis of GPIIb/IIIa receptor number by quantification of 7E3 binding to human platelets. Blood. 1996;88(3):907–914. | ||
Becker T, Jüttner B, Elsner HA, et al. Platelet P-selectin and GPIIb/IIIa expression after liver transplantation and resection. Transpl Int. 2004;17(8):442–448. | ||
Sheu JR, Fong TH, Liu CM, et al. Expression of matrix metalloproteinase-9 in human platelets: regulation of platelet activation in in vitro and in vivo studies. Br J Pharmacol. 2004;143(1):193–201. | ||
Radomski A, Stewart MW, Jurasz P, Radomski MW. Pharmacological characteristics of solid-phase von Willebrand factor in human platelets. Br J Pharmacol. 2001;134(5):1013–1020. | ||
Shrivastava S, Bera T, Singh SK, Singh G, Ramachandrarao P, Dash D. Characterization of antiplatelet properties of silver nanoparticles. ACS Nano. 2009;3(6):1357–1364. | ||
Stevens KN, Crespo-Biel O, van den Bosch EE, et al. The relationship between the antimicrobial effect of catheter coatings containing silver nanoparticles and the coagulation of contacting blood. Biomaterials. 2009;30(22):3682–3690. | ||
Wiwanitkit V, Sereemaspun A, Rojanathanes R. Gold nanoparticles and a microscopic view of platelets: a preliminary observation. Cardiovasc J Afr. 2009;20(2):141–142. | ||
Corbalan JJ, Medina C, Jacoby A, Malinski T, Radomski MW. Amorphous silica nanoparticles aggregate human platelets: potential implications for vascular homeostasis. Int J Nanomedicine. 2012;7:631–639. | ||
Radomski A, Jurasz P, Alonso-Escolano D, et al. Nanoparticle-induced platelet aggregation and vascular thrombosis. Br J Pharmacol. 2005;146(6):882–893. | ||
Geys J, Nemmar A, Verbeken E, et al. Acute toxicity and prothrombotic effects of quantum dots: impact of surface charge. Environ Health Perspect. 2008;116(12):1607–1613. | ||
Nemmar A, Nemery B, Hoet PH, Vermylen J, Hoylaerts MF. Pulmonary inflammation and thrombogenicity caused by diesel particles in hamsters: role of histamine. Am J Respir Crit Care Med. 2003;168(11):1366–1372. | ||
Wilson DW, Aung HH, Lame MW, et al. Exposure of mice to concentrated ambient particulate matter results in platelet and systemic cytokine activation. Inhal Toxicol. 2010;22(4):267–276. | ||
Koziara JM, Oh JJ, Akers WS, Ferraris SP, Mumper RJ. Blood compatibility of cetyl alcohol/polysorbate-based nanoparticles. Pharm Res. 2005;22(11):1821–1828. | ||
Byrne SJ, le Bon B, Corr SA, et al. Synthesis, characterisation, and biological studies of CdTe quantum dot-naproxen conjugates. Chem Med Chem. 2007;2(2):183–186. | ||
Radomski M, Moncada S. An improved method for washing of human platelets with prostacyclin. Thromb Res. 1983;30(4):383–389. | ||
Sinn S, Müller L, Drechsel H, et al. Platelet aggregation monitoring with a newly developed quartz crystal microbalance system as an alternative to optical platelet aggregometry. Analyst. 2010;135(11):2930–2938. | ||
Santos-Martínez MJ, Medina C, Prina-Mello A, et al. [A nanoscale resolution assay of flow-induced platelet microaggregation]. Kardiochirurgia i Torakochirurgia Polska. 2010;7(4):365–375. Polish. | ||
Cattaneo M. Light transmission aggregometry and ATP release for the diagnostic assessment of platelet function. Semin Thromb Hemost. 2009;35(2):158–167. | ||
Sawicki G, Sanders EJ, Salas E, Wozniak M, Rodrigo J, Radomski MW. Localization and translocation of MMP-2 during aggregation of human platelets. Thromb Haemost. 1998;80(5):836–839. | ||
Gibbs-Flournoy EA, Bromberg PA, Hofer TP, Samet JM, Zucker RM. Darkfield-confocal microscopy detection of nanoscale particle internalization by human lung cells. Part Fibre Toxicol. 2011;8(1):2. | ||
Santos-Martinez MJ, Inkielewicz-Stepniak I, Medina C, et al. The use of quartz crystal microbalance with dissipation (QCM-D) for studying nanoparticle-induced platelet aggregation. Int J Nanomedicine. 2012;7:243–255. | ||
Samuel SP, Jain N, O’Dowd F, et al. Multifactorial determinants that govern nanoparticle uptake by human endothelial cells under flow. Int J Nanomedicine. 2012;7:2943–2956. | ||
Sahli H, Tapon-Bretaudière J, Fischer AM, et al. Interactions of poly(lactic acid) and poly(lactic acid-co-ethylene oxide) nanoparticles with the plasma factors of the coagulation system. Biomaterials. 1997;18(4):281–288. | ||
Allémann E, Gravel P, Leroux JC, Balant L, Gurny R. Kinetics of blood component adsorption on poly(D,L-lactic acid) nanoparticles: evidence of complement C3 component involvement. J Biomed Mater Res. 1997;37(2):229–234. | ||
Monopoli MP, Aberg C, Salvati A, Dawson KA. Biomolecular coronas provide the biological identity of nanosized materials. Nat Nanotechnol. 2012;7(12):779–786. | ||
Lesniak A, Salvati A, Santos-Martinez MJ, Radomski MW, Dawson KA, Åberg C. Nanoparticle adhesion to the cell membrane and its effect on nanoparticle uptake efficiency. J Am Chem Soc. 2013;135(4):1438–1444. | ||
Klein J. Probing the interactions of proteins and nanoparticles. Proc Natl Acad Sci U S A. 2007;104(7):2029–2030. | ||
Dobrovolskaia MA, Patri AK, Simak J, et al. Nanoparticle size and surface charge determine effects of PAMAM dendrimers on human platelets in vitro. Mol Pharm. 2012;9(3):382–393. | ||
Tomaszewski KA, Radomski MW, Santos-Martinez MJ. Nanodiagnostics, nanopharmacology and nanotoxicology of platelet – vessel wall interactions. Nanomedicine. In press 2015. | ||
Coller BS. Blockade of platelet GPIIb/IIIa receptors as an antithrombotic strategy. Circulation. 1995;92(9):2373–2380. | ||
Estebanell E, Diaz-Ricart M, Lozano M, Mazzara R, Escolar G, Ordinas A. Cytoskeletal reorganization after preparation of platelet concentrates, using the buffy coat method, and during their storage. Haematologica. 1998;83(2):112–117. | ||
Fernandez-Patron C, Martinez-Cuesta MA, Salas E, et al. Differential regulation of platelet aggregation by matrix metalloproteinases-9 and -2. Thromb Haemost. 1999;82(6):1730–1735. | ||
Martinez A, Salas E, Radomski A, Radomski MW. Matrix metalloproteinase-2 in platelet adhesion to fibrinogen: interactions with nitric oxide. Med Sci Monit. 2001;7(4):646–651. | ||
Miyamoto M, Sasakawa S, Ozawa T, Kawaguchi H, Ohtsuka Y. Mechanisms of blood coagulation induced by latex particles and the roles of blood cells. Biomaterials. 1990;11(6):385–388. | ||
Nemmar A, Nemery B, Hoet PH, Van Rooijen N, Hoylaerts MF. Silica particles enhance peripheral thrombosis: key role of lung macrophage-neutrophil cross-talk. Am J Respir Crit Care Med. 2005;171(8):872–879. | ||
Nemmar A, Hoet PH, Dinsdale D, Vermylen J, Hoylaerts MF, Nemery B. Diesel exhaust particles in lung acutely enhance experimental peripheral thrombosis. Circulation. 2003;107(8):1202–1208. |
 © 2015 The Author(s). This work is published and licensed by Dove Medical Press Limited. The full terms of this license are available at https://www.dovepress.com/terms.php and incorporate the Creative Commons Attribution - Non Commercial (unported, v3.0) License.
By accessing the work you hereby accept the Terms. Non-commercial uses of the work are permitted without any further permission from Dove Medical Press Limited, provided the work is properly attributed. For permission for commercial use of this work, please see paragraphs 4.2 and 5 of our Terms.
© 2015 The Author(s). This work is published and licensed by Dove Medical Press Limited. The full terms of this license are available at https://www.dovepress.com/terms.php and incorporate the Creative Commons Attribution - Non Commercial (unported, v3.0) License.
By accessing the work you hereby accept the Terms. Non-commercial uses of the work are permitted without any further permission from Dove Medical Press Limited, provided the work is properly attributed. For permission for commercial use of this work, please see paragraphs 4.2 and 5 of our Terms.