")
Back to Journals » International Journal of General Medicine » Volume 15
CD56dim NK Cell is an Important Factor in T Cell Depletion of cART-Treated AIDS Patients
Authors Qian F, Hu S, Zhu Y, Wang Y, Liu J, Qiao J, Shu X, Gao Y, Sun B, Zhu C
Received 3 January 2022
Accepted for publication 14 April 2022
Published 3 May 2022 Volume 2022:15 Pages 4575—4583
DOI https://doi.org/10.2147/IJGM.S356771
Checked for plagiarism Yes
Review by Single anonymous peer review
Peer reviewer comments 2
Editor who approved publication: Dr Scott Fraser
Feng Qian,1– 3,* Song Hu,4,* Yueping Zhu,2,3 Yinling Wang,2,3 Jin Liu,2,3 Jialu Qiao,4 Xiji Shu,4 Yong Gao,5 Binlian Sun,4 Chuanwu Zhu1– 3
1Department of Infectious Diseases, The Second Affiliated Hospital of Soochow University, Suzhou, 215004, People’s Republic of China; 2Department of Infectious Diseases, The Affiliated Infectious Disease Hospital of Soochow University, Suzhou, 215131, People’s Republic of China; 3Department of Infectious Diseases, The Fifth People’s Hospital of Suzhou, Suzhou, 215131, People’s Republic of China; 4Wuhan Institute of Biomedical Sciences, School of Medicine, Jianghan University, Wuhan, 430056, People’s Republic of China; 5The First Affiliated Hospital, Department of Life Science and Medicine, University of Science and Technology of China, Hefei, 230001, People’s Republic of China
*These authors contributed equally to this work
Correspondence: Chuanwu Zhu; Binlian Sun, Tel/Fax +86 512 87806206 ; +86 27 84225149, Email [email protected]; [email protected]
Purpose: To investigate factors involved in T-cell depletion in combination antiretroviral therapy (cART)-treated human immunodeficiency virus 1 (HIV-1)-positive patients.
Patients and Methods: 29 HIV-1-positive patients were enrolled. The CD4+, CD8+ T cell subsets and CD56dim NK cells were detected by flow cytometry. The concentrations of cytokines were measured by enzyme-linked immunosorbent assay. Extraction, amplification, and viral load quantification of specimens were performed using the Roche Cobas Ampliprep/Cobas TaqMan HIV-1 test.
Results: Compared with IR group, the total number of red blood cells (RBCs) and lymphocytes (LCs) in INR group was significantly reduced, and there was a significant positive correlation between the number of RBCs and that of LCs. The overall production rates of T cells-related cytokines were lower in INR group. However, the cell-surface expression of programmed death-1 (PD-1) on CD4+ T and CD8+ T cells were markedly elevated in INR group. Moreover, it was found that the proportion and the killing ability of CD56dim NK cells significantly increased in INR patients, and significantly correlated with apoptosis of T lymphocytes.
Conclusion: A poor immune reconstitution in HIV-positive patients might result from multiple factors, including bone marrow suppression, high PD-1 expression on the surface of CD4+ T cells, and over-activation of T and NK cells. Besides, the activity of NK cells and RBCs count might be important auxiliary indicators for immune reconstitution and provided a reliable guidance for developing strategies to improve immune reconstitution.
Keywords: AIDS, T-cells, CD56dim NK cells, antiretroviral therapy, immune reconstitution
Introduction
Acquired immunodeficiency syndrome (AIDS) is caused by infection with the human immunodeficiency virus (HIV-1), which is a member of the retroviral family of the lentivirus family. It mainly attacks lymphocytes expressing CD4 molecules, causing damage to the immune system. Although combined antiretroviral therapy (cART) can well control virus replication, certain patients may experience very little or no T-cell reconstitution.1 According to the statistics about 20% of AIDS patients under cART cannot achieve satisfactory immune reconstitution.2,3 These patients are called immune non-responders (INRs). At present, there is some disagreement about the count standard of CD4+ T lymphocytes in INRs. One of them is that whose CD4+ T cells count is less than 200/μL after receiving cART treatment for two years.4–6 Severe changes in the immune function of the INR population, including decreased lymphocyte production, dysfunction of immune cells in tissues, changes in the proportion of regulatory T cells, and increased immune activation, immune senescence, and apoptosis.7
Although the specific mechanism leading to incomplete immune reconstitution is still unclear, a large number of studies have found that the possible cause is due to the decreased production and consumption of lymphocytes.4,8 In the course of HIV-1 infection, many factors affect bone marrow hematopoietic function, leading to a decrease in lymphocyte production.9 Antiviral therapy can control the viral load but usually the virus replicates at a low level in the body, and persistent infection can cause cell apoptosis. These may cause the immune system to be disordered, lymphocytes are difficult to recover, and ultimately affect the immune system rebuilding.10
In the aspect of bone marrow hematopoiesis, the main reports currently focus on the destruction of hematopoietic cells by HIV-1. In vitro experiments, it was found that HIV-1 can infect hematopoietic progenitor cells (HPCs) to be latent foci of HIV-1, which is not easy to be cleared and is easily damaged.11 In all stages of AIDS, patients often have anemia, lymphopenia, leukopenia, thrombocytopenia and other symptoms of bone marrow abnormalities.12 The study found that the Tat protein of HIV-1 can cause a reduction in the expansion of bone marrow cells and a reduction in the proportion of the original subpopulation of hematopoietic stem cells by down-regulating the expression of a series of hematopoietic cytokines.13 Bone marrow suppression can reduce the production of lymphocytes to affect the immune reconstitution of AIDS patients.
After HIV-1 infection, the immune system will be fully activated to clear the virus. The incomplete clearance of HIV-1 leads to the continuous activation of the immune system, and activated lymphocytes is consumed. Activated immune cells produce a large number of cytokines, which on the one hand promotes the activation and differentiation of immune cells, and on the other hand regulates the replication of HIV-1. The results showed that the level of IL-10 in the elderly AIDS patients’ serum increased, and the increased IL-10 could inhibit the replication of HIV-1.14 However, lymphocytes that excessively secrete cytokines can also cause the depletion of T cells through the activation-induced cell death (AICD) pathway. Chronic activation of T cells and related cytokines might be important factors to immune reconstitution of AIDS patients.15
As an immune checkpoint molecule, one role of programmed death 1 (PD-1) is to down-regulate T cells activity and prevent autoimmune tissue damage to maintain the homeostasis of the cell population.16 The expression of PD-1 molecules will slowly increase during early infection, and then gradually decrease after reaching a peak. During the progression of HIV-1 infection, the down-regulation of PD-1 has a positive effect on restoring the CD4+ T cells pool.17
Natural killer cells (NK cells), as innate immune lymphocytes, play an important role in eliminating virus-infected cells. According to the level of membrane marker CD56 molecules, NK cells can be further divided into CD56bright and CD56dim NK cells, which perform different functions.18 NK cells respond to viral infections without the need for clonal expansion, and can replace damaged CD8+ T cells during HIV-1 infection and kill the HLA down-regulated cells infected by virus.19 Compared with healthy controls, the proportion of NK cell CD56dim subgroups in HIV-1 D subtype-infected people has decreased, which may not be conducive to virus clearance.20 However, there is no clear description of the functional changes of the CD56dim subgroup in the INR population and its correlation with T lymphocytes.
In this study, we investigated the difference of immune cells and related factors between the patients of INR and IR. The results may provide feasible index recommendations for early, convenient, and rapid assessment of the immune reconstitution status of AIDS patients.
Materials and Methods
Study Population and Ethical Approval
From October 2015 to April 2019, 29 HIV-1-positive patients with CD4+ T-cell count < 100 cells/μL that subsequently underwent cART in our hospital for 24 months were enrolled in this study. The study was approved by the Ethics Committee of the Fifth People’s Hospital of Suzhou (China; Approval No. 2018003), and all the participants signed the written informed consent form prior to participating in the study. The study complies with the ethical guidelines of the 1975 Declaration of Helsinki.
Therapeutic Strategy
The antiviral regimen included tenofovir/zidovudine + lamivudine + efavirenz/nevirapine. After cART, the patients’ plasma viral load dropped below the limit of detection (<50 HIV-1 RNA copies/mL). According to the number of CD4+ T cells after 24 months of treatment, 15 and 14 patients with CD4+ T-cell count < 200 and > 200 cells/μL were assigned to INR and IR groups, respectively. The patients’ general data at baseline included gender, age, route of transmission, duration of treatment, and CD4+ T-cell count.
Flow Cytometry
The CD4+ T-cell count in peripheral blood mononuclear cells (PBMCs) was determined by flow cytometry. In brief, the cells were labeled with fluorochrome-conjugated antibodies raised against CD3, CD4, and CD8 for 30 min at 4 °C. The cells were then fixed and permeabilized with the fixation/permeabilization solution from the Cytofix/Cytoperm kit (BD Biosciences) as described by the manufacturer and labeled with fluorochrome-conjugated antibodies. We determined absolute and percentage values for T lymphocyte subsets CD3+, CD3+/CD4+T, CD3+/CD8+T, CD19+ B cells and CD3-/CD56+ NK cells in PBMCs using a flow cytometer (BD Biosciences, San Jose, CA, USA).17 Fluorescence was quantified using a BD Biosciences LSR Fortessa flow cytometer (BD Biosciences) and the FlowJo software package (FlowJo, LLC, Ashland, Oregon, USA).
COBAS AmpliPrep/COBAS TaqMan HIV-1 Test
The AmpliPrep/COBAS TaqMan HIV-1 test combines automated sample preparation for HIV-1 RNA purification using the AmpliPrep, and real-time polymerase chain reaction (PCR) amplification and detection using the COBAS TaqMan or the COBAS TaqMan analyzer. Extraction, amplification, and viral load quantification of specimens were performed using the Roche Cobas Ampliprep/Cobas TaqMan HIV-1 test (CAP/CTM) (Roche Molecular Systems, Branchburg, NJ). The TaqMan HIV-1 test was shown to have a linear dynamic range from 50 copies/mL to 1×10⁷ copies/mL.21
Determination of Serum Levels of Cytokines
The concentrations of cytokines (IL-2, IL-4, IL-6, IL-10, IL-17, and IFN-γ) of the AIDS patients’ serum were measured by enzyme-linked immunosorbent assay (ELISA) kits (R&D Systems, Minneapolis, MN, USA).
Statistical Analysis
Statistical analyses were performed by using SPSS 19.0 (IBM, Armonk, NY, USA) and GraphPad Prism 6.0 (GraphPad Software Inc. San Diego, CA, USA) software. The effect of treatment on erythrocytes and lymphocytes in INR and IR groups were analyzed by using paired t–tests. Comparisons between INR and IR groups were performed by using the unpaired t–test, and the correlation analysis using Spearman correlation coefficient.
Results
General Situation of the Research Object
The 29 HIV-1-positive patients were all male, and the HIV-1 infection route was homosexual sex. The patients’ mean age in INR and IR groups before cART was 49 and 41 years old, respectively, and the mean CD4+ T-cell count of those groups was 64.69 and 88.60 cells/μL, respectively (Table 1). After 24 months of treatment, their average number of CD4+ T lymphocytes became 143.9 and 530.0 cells/μL, respectively.
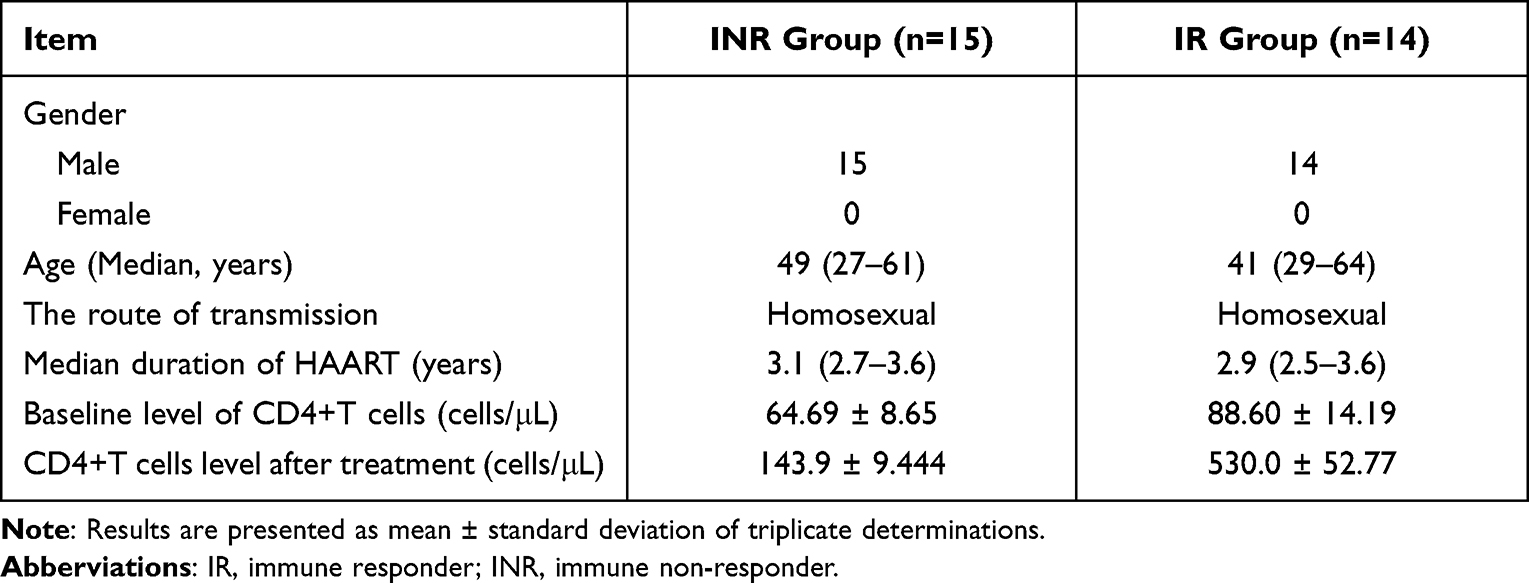 |
Table 1 Comparison of the General Information |
The Numbers of RBCs and LCs are Correlated to the Outcome of Immune Reconstitution
The results showed that the numbers of RBCs and LCs in IR group were markedly elevated after cART compared with the initial treatment (Figure 1A and B). The mean number of RBCs and LCs was elevated by about 20% and 55.6%, respectively. However, the same trend was not observed in INR group (Figure 1C and D). After 2 years of treatment, the numbers of RBCs and LCs in IR group were significantly higher than those in INR group (Figure 1E and F). Through correlation analysis of the numbers of RBCs and LCs in patients who underwent cART, we found that both groups showed a positive correlation (Figure 1G and H). Our findings suggest that RBCs count is closely correlated to LCs count after a systemic treatment, which may be related to changes in the hematopoietic environment.
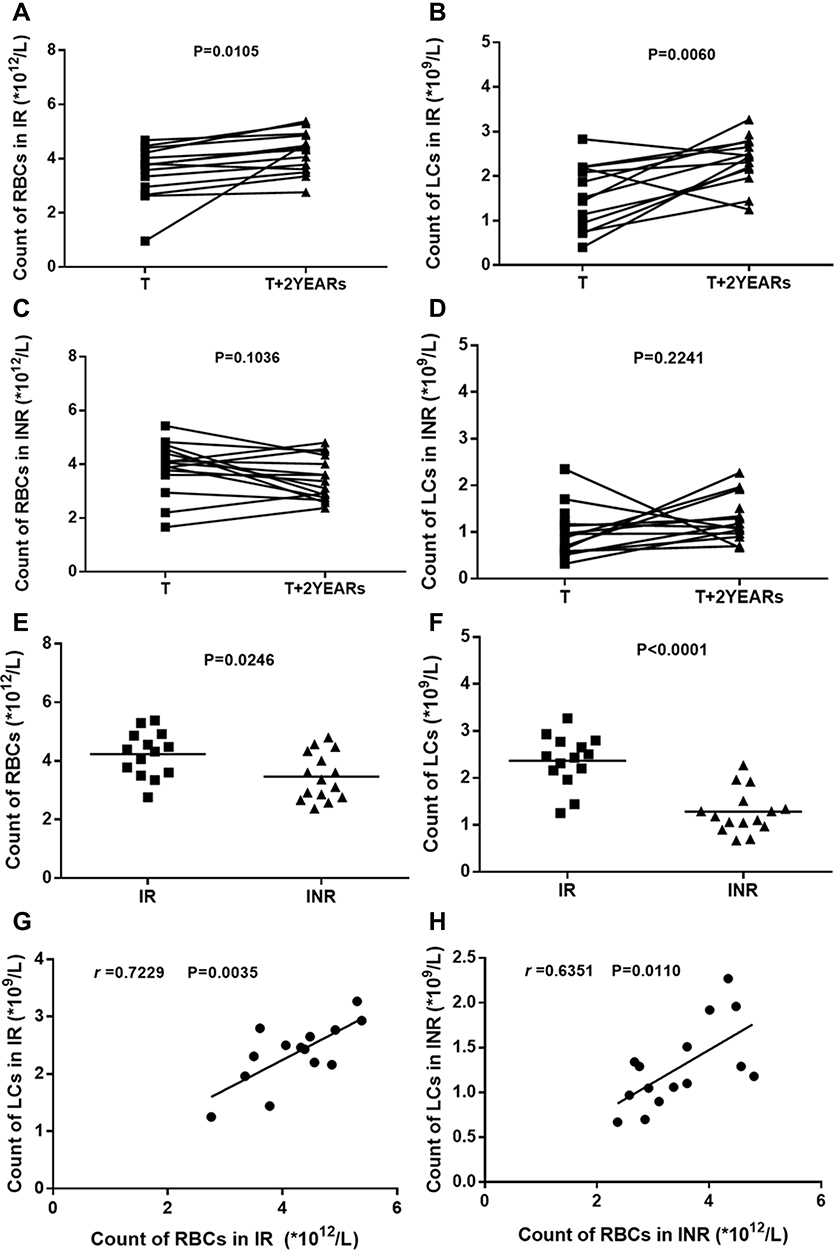 |
Figure 1 The numbers of RBCs and LCs are correlated to disease outcome. Detection of peripheral blood cells in INR and IR patients. Comparison of RBCs (A) and LCs (B) before and after 2 years’ treatment in IR patients. Comparison of RBCs (C) and LCs (D) before and after 2 years’ treatment in INR patients. Comparison of RBCs (E) and LCs (F) between IR and INR patients. The relationship between the counts of RBCs and LCs in IR (G) and INR (H) patients. All these counts were detected with FACS. |
Reduced Cytokine Secretion and Increased PD-1 Expression Suggest More Severe Immune Exhaustion in INR Patients
We further tested and compared the levels of T lymphocyte-related cytokines in the serum of INR and IR groups. The results showed that IL-2, IL-4, IL-10, IL-17 and IFN-γ in INR group were significantly lower than those in IR group (Figure 2A, P<0.05). The ratio of CD4+ T cells and CD8+ T cells in INR group was lower than that in IR group, respectively (Figure 2B and C; P<0.05). At the same time, the cell surface expression of PD-1 on CD4+ T and CD8+ T cells in INR group was significantly increased (Figure 2D and E; P<0.05). The decreased secretion of cytokines and the high expression of inhibitory immune checkpoint PD-1 indicated that the patients in INR group had more severe immune failure. This is not conducive to the rebuilding of the immune system.
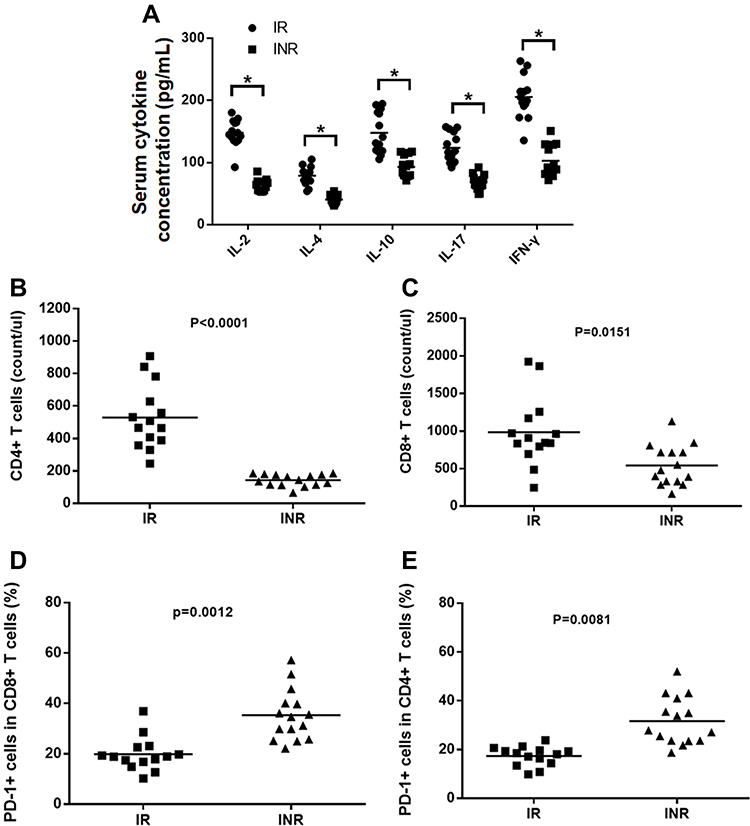 |
Figure 2 Reduced cytokine secretion and increased PD-1 expression suggest more severe immune exhaustion in INR patients Detection of cytokines produced by T lymphocytes in peripheral blood: (A) Cytokine production by T cells. The count of CD4+ T cells (B) and CD8+ T cells (C) between IR and INR patients. Percentage of PD-1+ cells in CD4+ T cells (D) and CD8+ T cells (E) between IR and INR patients. *P<0.05. |
CD56dim NK Cells in INR Patients May Inhibit Immune Reconstitution by Negatively Regulating PD-1+CD4+ T Lymphocyte Subsets
NK cells contribute to the resolution of adaptive immune responses via deletion of activated T cells, thus limit or exacerbate immune responses.22 In the present study, the results showed that there was no significant difference in the percentage of NK cells in PBMCs between the two groups (Figure 3A; P> 0.05). However, the proportion of CD56dim NK cells was significantly higher in INR group than that in IR group (Figure 3B; P< 0.05). We further assessed the killing capability of CD56dim NK cells by detecting the expression levels of CD107a, Granzyme B and Perforin in the cells. The results showed that these killing factors were surprisingly enhanced in INR group (Figure 3C-E; P< 0.05). These findings suggest that the increase in the number and function of CD56dim NK cells may be directly related to the lower number of T lymphocytes in INR group. We further analyzed the correlation between CD56dim NK cells with T lymphocytes, suggesting that CD56dim NK cells are negative correlation with the proportion of CD4+T and PD-1+CD4+T lymphocyte subsets in INR group (Figure 3F and G). However, in IR group, CD56dim NK cells showed no correlation with the proportion of CD4+T and PD-1+CD4+T lymphocyte subsets (Figure 3H and I). The above results suggest that the proportion of CD56dim NK cells in the INRs could be responsible for reduction in PD-1+ T cells and might play roles in the immune depletion.
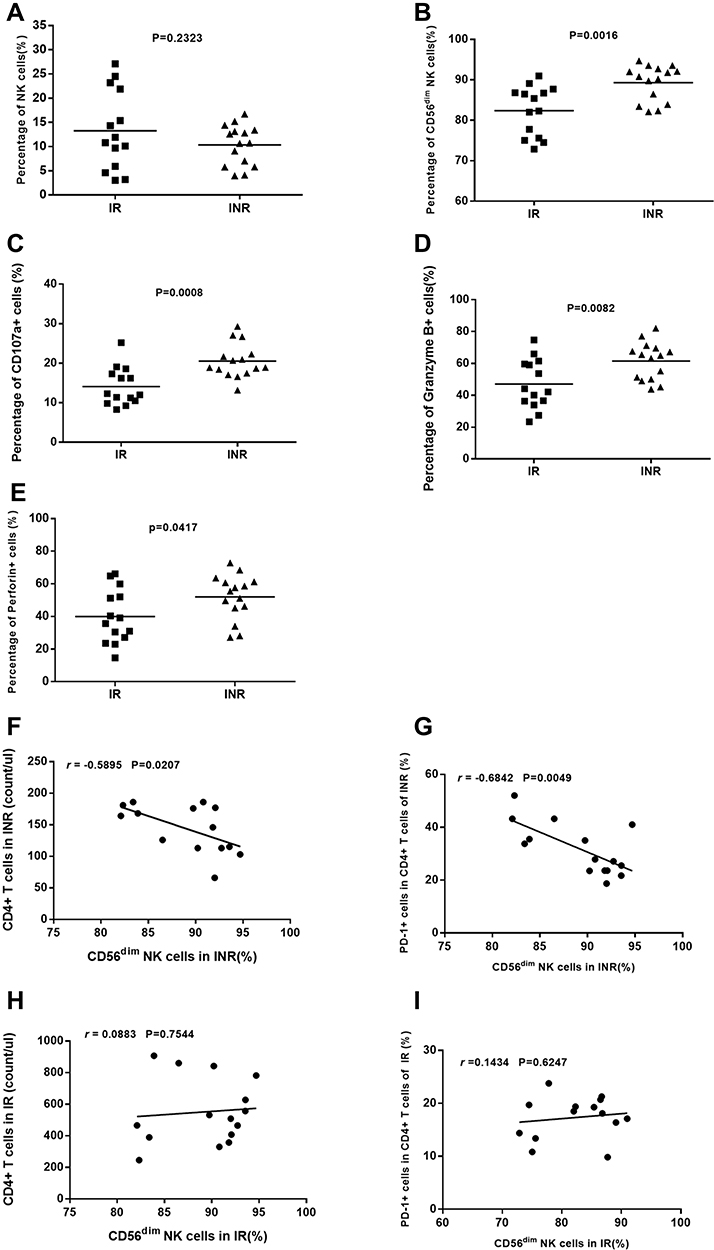 |
Figure 3 The proportion and the killing ability of CD56dim NK cells significantly increased in INR patient, and significantly correlated with T lymphocytes exhaust. NK cells and CD56 subsets detected by using flow cytometry, and the killing capability of CD56dim NK cells assessed by the related cellular molecules. Comparison of the percentages of NK cells (A), CD56dim NK cells (B), CD107a+ cells in CD56dim cells (C), Granzyme B+ cells in CD56dim cells (D), and Perforin+ cells in CD56dim cells (E) between IR and INR patients. Correlation between CD56dim NK cells and CD4+ T lymphocytes (F), and between CD56dim NK cells and PD-1+CD4+ T lymphocytes (G) in INR patients. Correlation between CD56dim NK cells and CD4+ T lymphocytes (H), and between CD56dim NK cells and PD-1+CD4+ T lymphocytes (I) in IR patients. |
Discussion
In this study, the average proportion of CD56dim NK cells in INR group was higher than that in IR group. We further detected the killing ability indicators (CD107a, perforin and granzyme B) of CD56dim NK cells, and found that their expression levels all increased significantly. These results suggest that the reason why CD56dim is not conducive to immune reconstitution in the INR population may be that despite a systemic therapy, virus components from HIV-1 latent infection continue to stimulate NK cells, resulting in an increased proportion of CD56dim NK cell subsets and enhanced killing capability, which might destroy more T lymphocytes and lead to the depletion of CD4+ T lymphocytes. Zhang’s study also pointed out that the CD56dim subgroup was found to be higher in INR patients than in IR patients.23 These findings implied that the increased proportion of CD56dim NK cells may not be conducive to immune reconstitution.
Transient PD-1 expression on cell surface is initiated upon T cell activation, while sustained PD-1 expression is a characteristic marker of T cell exhaustion.24 In this study, we found that bone marrow suppression and PD-1 overexpression on the surface of T lymphocytes were more severe in INR group, which might lead to depletion of T lymphocytes. Interestingly, we found that the proportion of CD56dim NK cells in AIDS patients was negatively correlated with the proportion of CD4+ and PD-1+CD4+T cells. Since PD-1 expression on CD4+T cells showed higher level in the late stage of HIV-1 infection,17 the increased and activated CD56dim NK cells might play roles in the immune depletion, resulting in the proportion of CD4+ T cells and PD-1+CD4+ T cells decreased in INR patients.
We also found that a lower level of certain cytokines in INR patients than that in IR patients, for example, IL-2, IL-4, IL-10, IL-17 and IFN-γ, which have proven to be closely correlated to the activation and proliferation of T lymphocytes.25–27 The reduction of cytokine production from lymphocytes indicates that in the INR patient population, the cytokine production capacity of lymphocytes is significantly reduced, eventually leading to T lymphocyte depletion.
The cART can significantly improve the numbers of RBCs (>20%) and LCs (>85%), which can be a positive indicator of immune condition improvement. The number of RBCs and LCs in the peripheral blood sample can partially reflect the function of bone marrow.28 There is a positive correlation between the number of RBCs and LCs after a systemic treatment. In the body, the cytokine levels are important to the hematopoietic environment.29 Our results implied that the low levels of T cell-related cytokines in INR group might be insufficient to stimulate the bone marrow hematopoiesis.
Conclusion
This study revealed that the poor immune reconstitution might be caused by multiple factors, such as myelosuppression, T cell destruction enhanced by PD-1 pathway, decreased cytokine production by lymphocytes, and the increased killing efficiency of CD56dim NK cells in INR patients. Among them, the red blood cell count may be an important auxiliary detection index for immune reconstitution, and the increased CD56dim NK cell subset further enhanced the depletion of CD4+ T lymphocytes. We also found that not only the proportion of CD56dim NK cells, but also their killing function are also enhanced in INR patients. These findings give us some clues to better understand the mechanisms of incomplete immune reconstitution in AIDS patients.
Abbreviations
cART, combination antiretroviral therapy; INR, immune non-responder; IR, immune responder; PD-1, programmed cell death protein 1; RBCs, red blood cells; LCs, lymphocytes; AICD, activation induced cell death.
Data Sharing Statement
The data that support the findings of this study are available from the study team but restrictions apply to availability of these data and so not publicly available. Data are however available from corresponding author upon reasonable request.
Ethics Approval and Informed Consent
Approval was obtained from the Fifth People’s Hospital of Suzhou, China (Approval number: 2018003).
Acknowledgments
The authors acknowledge with thanks the technical support from the affiliated infectious disease hospital of Soochow University and Suzhou Yueya Biotechnology Co. Ltd. Feng Qian and Song Hu are co-first authors for this study.
Author Contributions
Feng Qian and Song Hu: conception, study design, methodology execution and acquisition of data; Yue-ping Zhu, Yin-ling Wang, Jin Liu, Jia-lu Qiao, Xi-ji Shu and Yong Gao: formal analysis and interpretation; Bin-lian Sun and Chuan-wu Zhu: supervision and funding acquisition. All authors made substantial contributions to draft the manuscript, revise or critically review the article; gave final approval of the version to be published; have agreed on the current journal; and agree to be accountable for all aspects of the work.
Funding
This research was supported by Natural Science Foundation of Jiangsu Province (No: BK20181178) and Clinical Key Disease Diagnosis and Treatment Special Project of Suzhou Municipal Health and Family Planning Commission (No: LCZX201717).
Disclosure
The authors have no conflicts of interest to declare in this work.
References
1. Dion ML, Bordi R, Zeidan J, et al. Slow disease progression and robust therapy-mediated CD4+ T-cell recovery are associated with efficient thymopoiesis during HIV-1 infection. Blood. 2007;109(7):2912–2920. doi:10.1182/blood-2006-09-047308
2. Aiuti F, Mezzaroma I. Failure to reconstitute CD4+ T-cells despite suppression of HIV replication under HAART. AIDS Rev. 2006;8(2):88–97. doi:10.1089/aid.2006.22.367
3. Corbeau P, Reynes J. Immune reconstitution under antiretroviral therapy: the new challenge in HIV-1 infection. Blood. 2011;117(21):5582–5590. doi:10.1182/blood-2010-12-322453
4. Li CX, Li YY, He LP, et al. The predictive role of CD4 cell count and CD4/CD8 ratio in immune reconstitution outcome among HIV/AIDS patients receiving antiretroviral therapy: an eight-year observation in China. BMC Immunol. 2019;20:1–8. doi:10.1186/s12865-019-0311-2
5. Lapadula G, Chatenoud L, Gori A, et al. Risk of severe non AIDS events is increased among patients unable to increase their CD4+ T-cell counts >200+/μL despite effective HAART. PLoS One. 2015;10(5):e0124741. doi:10.1371/journal.pone.0124741
6. Ross E, Tanser F, Pei P, et al. The impact of the 2013 WHO antiretroviral therapy guidelines on the feasibility of HIV population prevention trials. HIV Clin Trials. 2014;15(5):185–198. doi:10.1310/hct1505-185
7. Lisco A, Wong CS, Lage SL, et al. Identification of rare HIV-1-infected patients with extreme CD4+ T cell decline despite ART-mediated viral suppression. JCI Insight. 2019;4(8):e127113. doi:10.1172/jci.insight.127113
8. Guo FP, Li YJ, Qiu ZF, et al. Baseline naive CD4+ T-cell level predicting immune reconstitution in treated HIV-infected late presenters. Chin Med J. 2016;129(22):2683–2690. doi:10.4103/0366-6999.193460
9. Nielsen SD, Sørensen TU, Ersbøll AK, et al. Decrease in immune activation in HIV-infected patients treated with highly active antiretroviral therapy correlates with the function of hematopoietic progenitor cells and the number of naive CD4+ cells. Scand J Infect Dis. 2000;32(6):597–603. doi:10.1080/003655400459487
10. Lewis DE, Gross KL, Diez MM, et al. CD8 apoptosis may be a predictor of T cell number normalization after immune reconstitution in HIV. J Transl Med. 2007;5(9):1–12. doi:10.1186/1479-5876-5-9
11. Carter CC, Onafuwa-Nuga A, McNamara LA, et al. HIV-1 infects multipotent progenitor cells causing cell death and establishing latent cellular reservoirs. Nat Med. 2010;16(4):446–451. doi:10.1038/nm.2109
12. Dhurve SA, Dhurve AS. Bone marrow abnormalities in HIV disease. Mediterr J Hematol Infect Dis. 2013;5(1):e2013033. doi:10.4084/mjhid.2013.033
13. Yuan Y, Zhou C, Yang Q, et al. HIV-1 Tat protein inhibits the hematopoietic support function of human bone marrow mesenchymal stem cells. Virus Res. 2019;273:197756. doi:10.1016/j.virusres.2019.197756
14. Andrade RM, Lima PG, Filho RG, et al. Interleukin-10-secreting CD4 cells from aged patients with AIDS decrease in-vitro HIV replication and tumour necrosis factor alpha production. AIDS. 2007;21(13):1763–1770. doi:10.1097/QAD.0b013e3282ca83fa
15. Levy Y, Sereti I, Tambussi G, et al. Effects of recombinant human interleukin 7 on T-cell recovery and thymic output in HIV-infected patients receiving antiretroviral therapy: results of a Phase I/IIa randomized, placebo-controlled, multicenter study. Clin Infect Dis. 2012;55(2):291–300. doi:10.1093/cid/cis383
16. Odorizzi PM, Pauken KE, Paley MA, Sharpe A, Wherry EJ. Genetic absence of PD-1 promotes accumulation of terminally differentiated exhausted CD8+ T cells. J Exp Med. 2015;212(7):1125–1137. doi:10.1084/jem.20142237
17. Rallon N, Garcia M, Garcia-Samaniego J, et al. Expression of PD-1 and Tim-3 markers of T-cell exhaustion is associated with CD4 dynamics during the course of untreated and treated HIV infection. PLoS One. 2018;13(3):e0193829. doi:10.1371/journal.pone.0193829
18. Bayigga L, Nabatanzi R, Sekiziyivu PN, et al. High CD56++CD16- natural killer (NK) cells among suboptimal immune responders after four years of suppressive antiretroviral therapy in an African adult HIV treatment cohort. BMC Immunol. 2014;15(2):1–8. doi:10.1186/1471-2172-15-2
19. Cohen GB, Gandhi RT, Davis DM, et al. The selective downregulation of class I major histocompatibility complex proteins by HIV-1 protects HIV-infected cells from NK cells. Immunity. 1999;10(6):661–671. doi:10.1016/S1074-7613(00)80065-5
20. Naluyima P, Eller MA, Laeyendecker O, et al. Impaired natural killer cell responses are associated with loss of the highly activated NKG2A(+)CD57(+)CD56(dim) subset in HIV-1 subtype D infection in Uganda. AIDS. 2014;28(9):1273–1278. doi:10.1097/QAD.0000000000000286
21. Zhang X, Lu X, Moog C, et al. KIR3DL1-negative CD8 T cells and KIR3DL1-negative natural killer cells contribute to the advantageous control of early human immunodeficiency virus type 1 infection in HLA-B Bw4 homozygous individuals. Front Immunol. 2018;9:1855. doi:10.3389/fimmu.2018.01855
22. Desimio MG, Covino DA, Doria M. Potential of the NKG2D/NKG2DL Axis in NK cell-mediated clearance of the HIV-1 reservoir. Int J Mol Sci. 2019;20:1–20. doi:10.3390/ijms20184490
23. Zhang QY, Zhang X, Su B, et al. Increased early activation of CD56dimCD16dim/- natural killer cells in immunological non-responders correlates with CD4+ T-cell recovery. Chin Med J. 2020;133(24):2928–2939. doi:10.1097/CM9.0000000000001262
24. Breton G, Chomont N, Takata H, et al. Programmed death-1 is a marker for abnormal distribution of naive/memory T cell subsets in HIV-1 infection. J Immunol. 2013;191(5):2194–2204. doi:10.4049/jimmunol.1200646
25. Shaw DM, Merien F, Braakhuis A, Dulson D. T-cells and their cytokine production: the anti-inflammatory and immunosuppressive effects of strenuous exercise. Cytokine. 2018;104:136–142. doi:10.1016/j.cyto.2017.10.001
26. Huang W, August A. The signaling symphony: t cell receptor tunes cytokine-mediated T cell differentiation. J Leukoc Biol. 2015;97(3):477–485. doi:10.1189/jlb.1RI0614-293R
27. Matsuzaki G, Umemura M. Interleukin-17 family cytokines in protective immunity against infections: role of hematopoietic cell-derived and non-hematopoietic cell-derived interleukin-17s. Microbiol Immunol. 2018;62(1):1–13. doi:10.1111/1348-0421.12560
28. Thulasi Raman R, Manimaran D, Rachakatla P, et al. Study of basic coagulation parameters among HIV patients in correlation to CD4 counts and ART status. J Clin Diagn Res. 2016;10(5):EC04–06. doi:10.7860/JCDR/2016/17459.7718
29. Jahandideh B, Derakhshani M, Abbaszadeh H, et al. The pro-inflammatory cytokines effects on mobilization, self-renewal and differentiation of hematopoietic stem cells. Hum Immunol. 2020;81(5):206–217. doi:10.1016/j.humimm.2020.01.004
 © 2022 The Author(s). This work is published and licensed by Dove Medical Press Limited. The full terms of this license are available at https://www.dovepress.com/terms.php and incorporate the Creative Commons Attribution - Non Commercial (unported, v3.0) License.
By accessing the work you hereby accept the Terms. Non-commercial uses of the work are permitted without any further permission from Dove Medical Press Limited, provided the work is properly attributed. For permission for commercial use of this work, please see paragraphs 4.2 and 5 of our Terms.
© 2022 The Author(s). This work is published and licensed by Dove Medical Press Limited. The full terms of this license are available at https://www.dovepress.com/terms.php and incorporate the Creative Commons Attribution - Non Commercial (unported, v3.0) License.
By accessing the work you hereby accept the Terms. Non-commercial uses of the work are permitted without any further permission from Dove Medical Press Limited, provided the work is properly attributed. For permission for commercial use of this work, please see paragraphs 4.2 and 5 of our Terms.