")
Back to Journals » International Journal of General Medicine » Volume 15
CD1B is a Potential Prognostic Biomarker Associated with Tumor Mutation Burden and Promotes Antitumor Immunity in Lung Adenocarcinoma
Authors Li Z, Feng Y, Li P, Wang S, Liu X, Xia S
Received 7 December 2021
Accepted for publication 21 March 2022
Published 7 April 2022 Volume 2022:15 Pages 3809—3826
DOI https://doi.org/10.2147/IJGM.S352851
Checked for plagiarism Yes
Review by Single anonymous peer review
Peer reviewer comments 2
Editor who approved publication: Dr Scott Fraser
Zhou Li, Yanqi Feng, Piao Li, Shennan Wang, Xinyue Liu, Shu Xia
Department of Oncology, Tongji Hospital, Tongji Medical College, Huazhong University of Science and Technology, Wuhan, People’s Republic of China
Correspondence: Shu Xia, Department of Oncology, Tongji Hospital, Tongji Medical College of Huazhong University of Science and Technology, No. 1095 Jiefang Avenue, Wuhan, 430030, People’s Republic of China, Tel +86 15827110062, Fax +86 27-83662834, Email [email protected]
Purpose: Tumor mutation burden (TMB) and tumor-infiltrating lymphocytes (TILs) have been well recognized as molecular determinants of immunotherapy responsiveness. In this study, we aimed to construct a TMB prognostic model and explore biomarkers that have predictive potential for prognosis and therapeutic effect in lung adenocarcinoma (LUAD).
Patients and Methods: The TCGA, GEO and Immport databases were used to analyze the mutation profiles and immune infiltration of LUAD. TMB scores were calculated and differential analysis was conducted to identify TMB-related genes. Then, Cox regression model and survival analysis were applied to identify the prognostic genes and construct a TMB prognostic model. The expression and prognostic value of CD1B were further verified by immunohistochemistry (IHC) in 92 patient tissue samples. GSEA was performed to analyze the signaling pathways associated with CD1B expression.
Results: High-TMB samples exhibited higher infiltration of CD8+ T cells, CD4+ memory T cells, and M1 macrophages. A total of 397 TMB-related differentially expressed genes were identified, of which 47 were immune-related genes. Cox regression analyses determined 3 hub TMB-related immune genes (CD1B, SCGB3A1, and VEGFD) with prognostic effects, and a TMB prognostic model was constructed. The model demonstrated robust predictive ability in both the training (TCGA) and testing (GEO) datasets. Notably, CD1B was identified as an independent prognostic factor. IHC of clinical samples showed that low expression of CD1B was related to poor overall survival and advanced pathological stages. In addition, there was a strong positive correlation between CD1B and most immune checkpoint molecules, including PD-L1. CD1B expression was associated with immune cell infiltration and immune activation in LUAD.
Conclusion: Our study constructed a TMB prognostic model that effectively predicted the prognosis of LUAD patients. CD1B expression is correlated with better prognosis and promotes antitumor immunity in LUAD, which may serve as a potential prognostic biomarker and immune-related therapeutic target for LUAD.
Keywords: lung adenocarcinoma, tumor mutation burden, CD1B, prognosis, immune infiltrates
Introduction
Lung cancer is the leading disease worldwide in terms of the threat to human life and health.1 Non-small cell lung cancer (NSCLC) accounts for approximately 85% of lung cancers, and lung adenocarcinoma (LUAD) is the most common pathological subtype.2 Due to the high percentage of lung cancer patients diagnosed at locally advanced or extensive metastatic stages, the prognosis in the majority of patients at the time of diagnosis is still poor.3 In recent years, advances in immunotherapy have significantly improved the survival outcomes of LUAD patients.4 Immune checkpoint inhibitors (ICIs) targeting programmed cell death 1/ligand 1 (PD-1/PD-L1) and cytotoxic T-lymphocyte antigen 4 (CTLA-4) exhibit a potent and durable antitumor activity in LUAD patients.5 However, the overall response rate of ICIs is relatively low, and only a fraction of LUAD patients could benefit from ICI treatment.6 Therefore, identifying effective biomarkers for prognostication and their application in combination with immunotherapy is of utmost importance.
To date, a series of biomarkers have been verified to predict the efficacy of ICI treatment including tumor mutation burden (TMB), PD-L1 expression level, neoantigen load, gut microbiota, and tumor-infiltrating lymphocytes (TILs).7 Programmed cell death ligand-1 (PD-L1) is expressed in many solid tumors, including lung cancer. A number of clinical trials revealed a positive association of PD-L1 expression levels with a better prognosis in lung cancer patients treated with ICI therapy.8 TMB is associated with somatic mutations and is affected by many factors such as smoking and ultraviolet radiation. Many studies have demonstrated that high TMB confers high response rates and sustainable response to ICI therapy and can be used to screen beneficial populations in many tumor types, including lung cancer.9 Higher TMB in tumors tends to form more neoantigens that make tumors harbor higher immunogenicity and thus lead to improved clinical response to immunotherapy.10 Immune checkpoint inhibitors (ICIs) are known to abrogate both T-cell exhaustion and peripheral inhibition, leading to T-cell activation and thereby restoring antitumor immunity.11 In the context of the cancer-immunity cycle,12 high TMB and ICIs are involved in multiple steps of the cycle; thus, their combination could theoretically promote antitumor immunity.
Nevertheless, both PD-L1 and TMB are still not perfect biomarkers for patient selection and the prediction of curative effects.13 The molecular mechanism of immunotherapy responsiveness is not yet clearly defined. Daniel et al14 proposed three immune profile phenotypes that correlate with patients’ responses to immunotherapy. Given the limitation of a single biomarker, prognostic molecules identified through integrated analysis of tumor mutation burden and immune infiltration may guide immunotherapy more precisely. In this study, we systematically analyzed somatic mutations with immune infiltration patterns in lung adenocarcinoma (LUAD) and constructed a TMB-related immune prognostic model to estimate the prognosis of LUAD patients. More importantly, we identified CD1B as a predictive biomarker and verified the expression and prognostic value of CD1B in clinical samples. We further elucidated the role of CD1B in tumor-immunity interactions and its potential prognostic mechanisms in LUAD. Our findings might provide promising biomarkers for prognostic stratification and immune-related therapeutic targets, which facilitate accurate management and appropriate personalized therapies for LUAD patients.
Materials and Methods
Acquisition of Public Data
We downloaded the somatic mutations, transcriptome profiles and clinical information of LUAD from the TCGA database. Somatic mutation data were available for 569 samples, and transcriptome RNA-seq data and corresponding clinical data (age, gender, TNM stage, and survival outcomes) were available for 594 samples. Then, 510 matched samples from mutation data, transcriptome data, and clinical data with the same sample ID were enrolled for subsequent analysis. Besides, we downloaded three Gene Expression Omnibus (GEO) datasets, GSE11969, GSE30219, and GSE72094, from the GEO database. In this study, TCGA data were applied as the training set, and GEO datasets were applied as the validation sets.
Tumor Mutation Burden Analysis and Immune Infiltrate Analysis
The mutation profiles of LUAD were analyzed and visualized by R software with the “maftools” package. TMB was defined as the total amount of nonsynonymous mutations per million bases of the genome examined, including coding errors of somatic genes, base substitutions, insertions, or deletions.15 To calculate the TMB value of each LUAD patient, the total number of mutations was divided by the length of the exome (38 million). Silent mutations failing to cause a change in an amino acid were excluded. We classified the LUAD cases into high- and low-TMB groups according to the median TMB value.
The CIBERSORT algorithm was used to estimate the proportion of tumor-infiltrating immune subsets by analyzing the gene expression data. Here we constructed the abundance profiles of 22 kinds of immune cells in each LUAD sample and divided the immune cell content matrix samples into low- and high-TMB subtypes according to the median TMB value. The Wilcoxon rank-sum test was used to compare the differential abundances of immune cell infiltrates between the two groups.
Identification of TMB-Related DEGs and Functional Pathway Analysis
Differentially expressed genes (DEGs) between the low- and high-TMB groups were screened using the Wilcoxon rank-sum test with |logFC|> 1 and False Discovery Rate (FDR) < 0.05 as the screening criterion. A heatmap was drawn to show the difference in gene expression between the two groups. To explore the functions and signaling pathways of these DEGs, Gene Ontology (GO) functional analysis and Kyoto Encyclopedia of Genes and Genomes (KEGG) pathway enrichment analysis were performed with the aid of the R language packages “clusterProfiler”, “enrichplot”, and “ggplot2”. Only terms with p.adjust (FDR) < 0.05 were considered significantly enriched.
Construction and Validation of the TMB-Related Immune Prognostic Model
We downloaded a list of 2483 immune-related genes from the Immunology Database and Analysis Portal (Immport) and selected the differentially expressed immune genes between the low- and high-TMB groups via the package “VennDiagram”. Univariate Cox regression analysis and Kaplan-Meier survival analysis were performed to screen the hub immune genes that were associated with survival outcomes. Multivariate Cox regression analysis was conducted to obtain the respective coefficients (β) of the hub prognostic genes. Then the TMB prognostic model was developed based on the hub prognostic genes, and the risk score of each patient was calculated based on the expression level of each prognostic gene and its corresponding coefficient. Kaplan-Meier survival analysis and receiver operating characteristic (ROC) curves were used to evaluate the accuracy of the prognostic model in predicting the outcomes of LUAD patients. Finally, the prognostic effect of the model and other clinicopathological factors were analyzed by Cox analyses.
To determine the feasibility and reliability of the TMB-related prognostic model, patients in three GEO testing datasets were divided into high- and low-risk groups according to the formula of risk score derived from the training dataset, with the same methods as above. Kaplan–Meier analysis and ROC curves were used to evaluate the predictive power of the gene signature.
Tissue Microarray and Immunohistochemistry (IHC)
The clinical significance of the hub immune genes was further validated in clinical tissue microarray samples. Tissue microarray slides (HLugA180Su04; Outdo Biotech, Shanghai, China) with 92 matched pairs of LUAD samples and adjacent normal tissues were purchased for immunohistochemistry (IHC) analysis. Specific primary antibodies against CD1B (1:100, ab173576; Abcam, Cambridge, UK) and PD-L1 (1:100, ab205921; Abcam, Cambridge, UK) were used for IHC. The expression levels of CD1B and PD-L1 in tissues were evaluated by the H-score. H-score = Σ π(i + 1), where i is the intensity of the stained cells (0 for negative staining, 1 for weak staining, 2 for moderate staining, and 3 for strong staining) and π is the percentage of stained cells with various intensities (0, <5% positive cells; 1, 6–25% positive cells; 2, 26–50% positive cells; 3, 51–75% positive cells; 4, >75% positive cells). The results were evaluated by two pathologists who were blinded to the clinical information, and disagreement was resolved by a third pathologist. The patients were divided into low- and high-expression groups based on the median level of expression.
R software and SPSS were used for all statistical analyses. The Wilcoxon rank-sum test and Student’s t test were used to compare the differences between two groups, while the Kruskal–Wallis test was suitable for three or more groups. The relationship between CD1B expression and clinicopathological features was analyzed by the chi-square test. The correlations between CD1B expression and PD-L1 were estimated using Pearson correlation analysis and linear regression analysis. Cox proportional regression models were performed to evaluate the prognostic potential of CD1B expression. A p value<0.05 was considered statistically significant. R scripts and original data for this study are available from Github page (https://github.com/Crystal5462).
Functional Enrichment Analysis of CD1B and Its Association with PD-L1 and Immune Cells
To further analyze the putative functional mechanisms of CD1B, gene set enrichment analysis (GSEA) was performed to obtain the functions and pathways enriched by CD1B. The correlations between CD1B expression and common immune checkpoints and immune-infiltrating cells were analyzed by the Wilcoxon test and Pearson test using the TCGA and TIMER databases.
Ethics Statement
This study was approved by the Institutional Review Board of Tongji Hospital (IRB ID: TJ-C20151236) in accordance with the ethical guidelines of the Declaration of Helsinki. Informed consent was obtained from all subjects.
Results
Landscape of Tumor Mutation Profiles in LUAD
Mutation files of the Simple Nucleotide Variation were available on 569 TCGA LUAD samples. The waterfall plot showed the mutation information of each gene in each LUAD sample (Figure 1A), in which the top three frequently mutated genes were TP53 (47%), TTN (41%), and MUC16 (40%). We further classified these mutations according to different categories and found that missense mutations occurred most frequently, followed by nonsense mutations (Figure 1B). Single nucleotide polymorphisms (SNPs) accounted for the largest fraction of such variants (Figure 1C), and C > A was the major type of single nucleotide variant (SNV) (Figure 1D). The number of mutated bases in each sample could be observed in the boxplot (Figure 1E and F). In addition, the detailed clinical information of the training cohort and validation cohorts are summarized in Table 1.
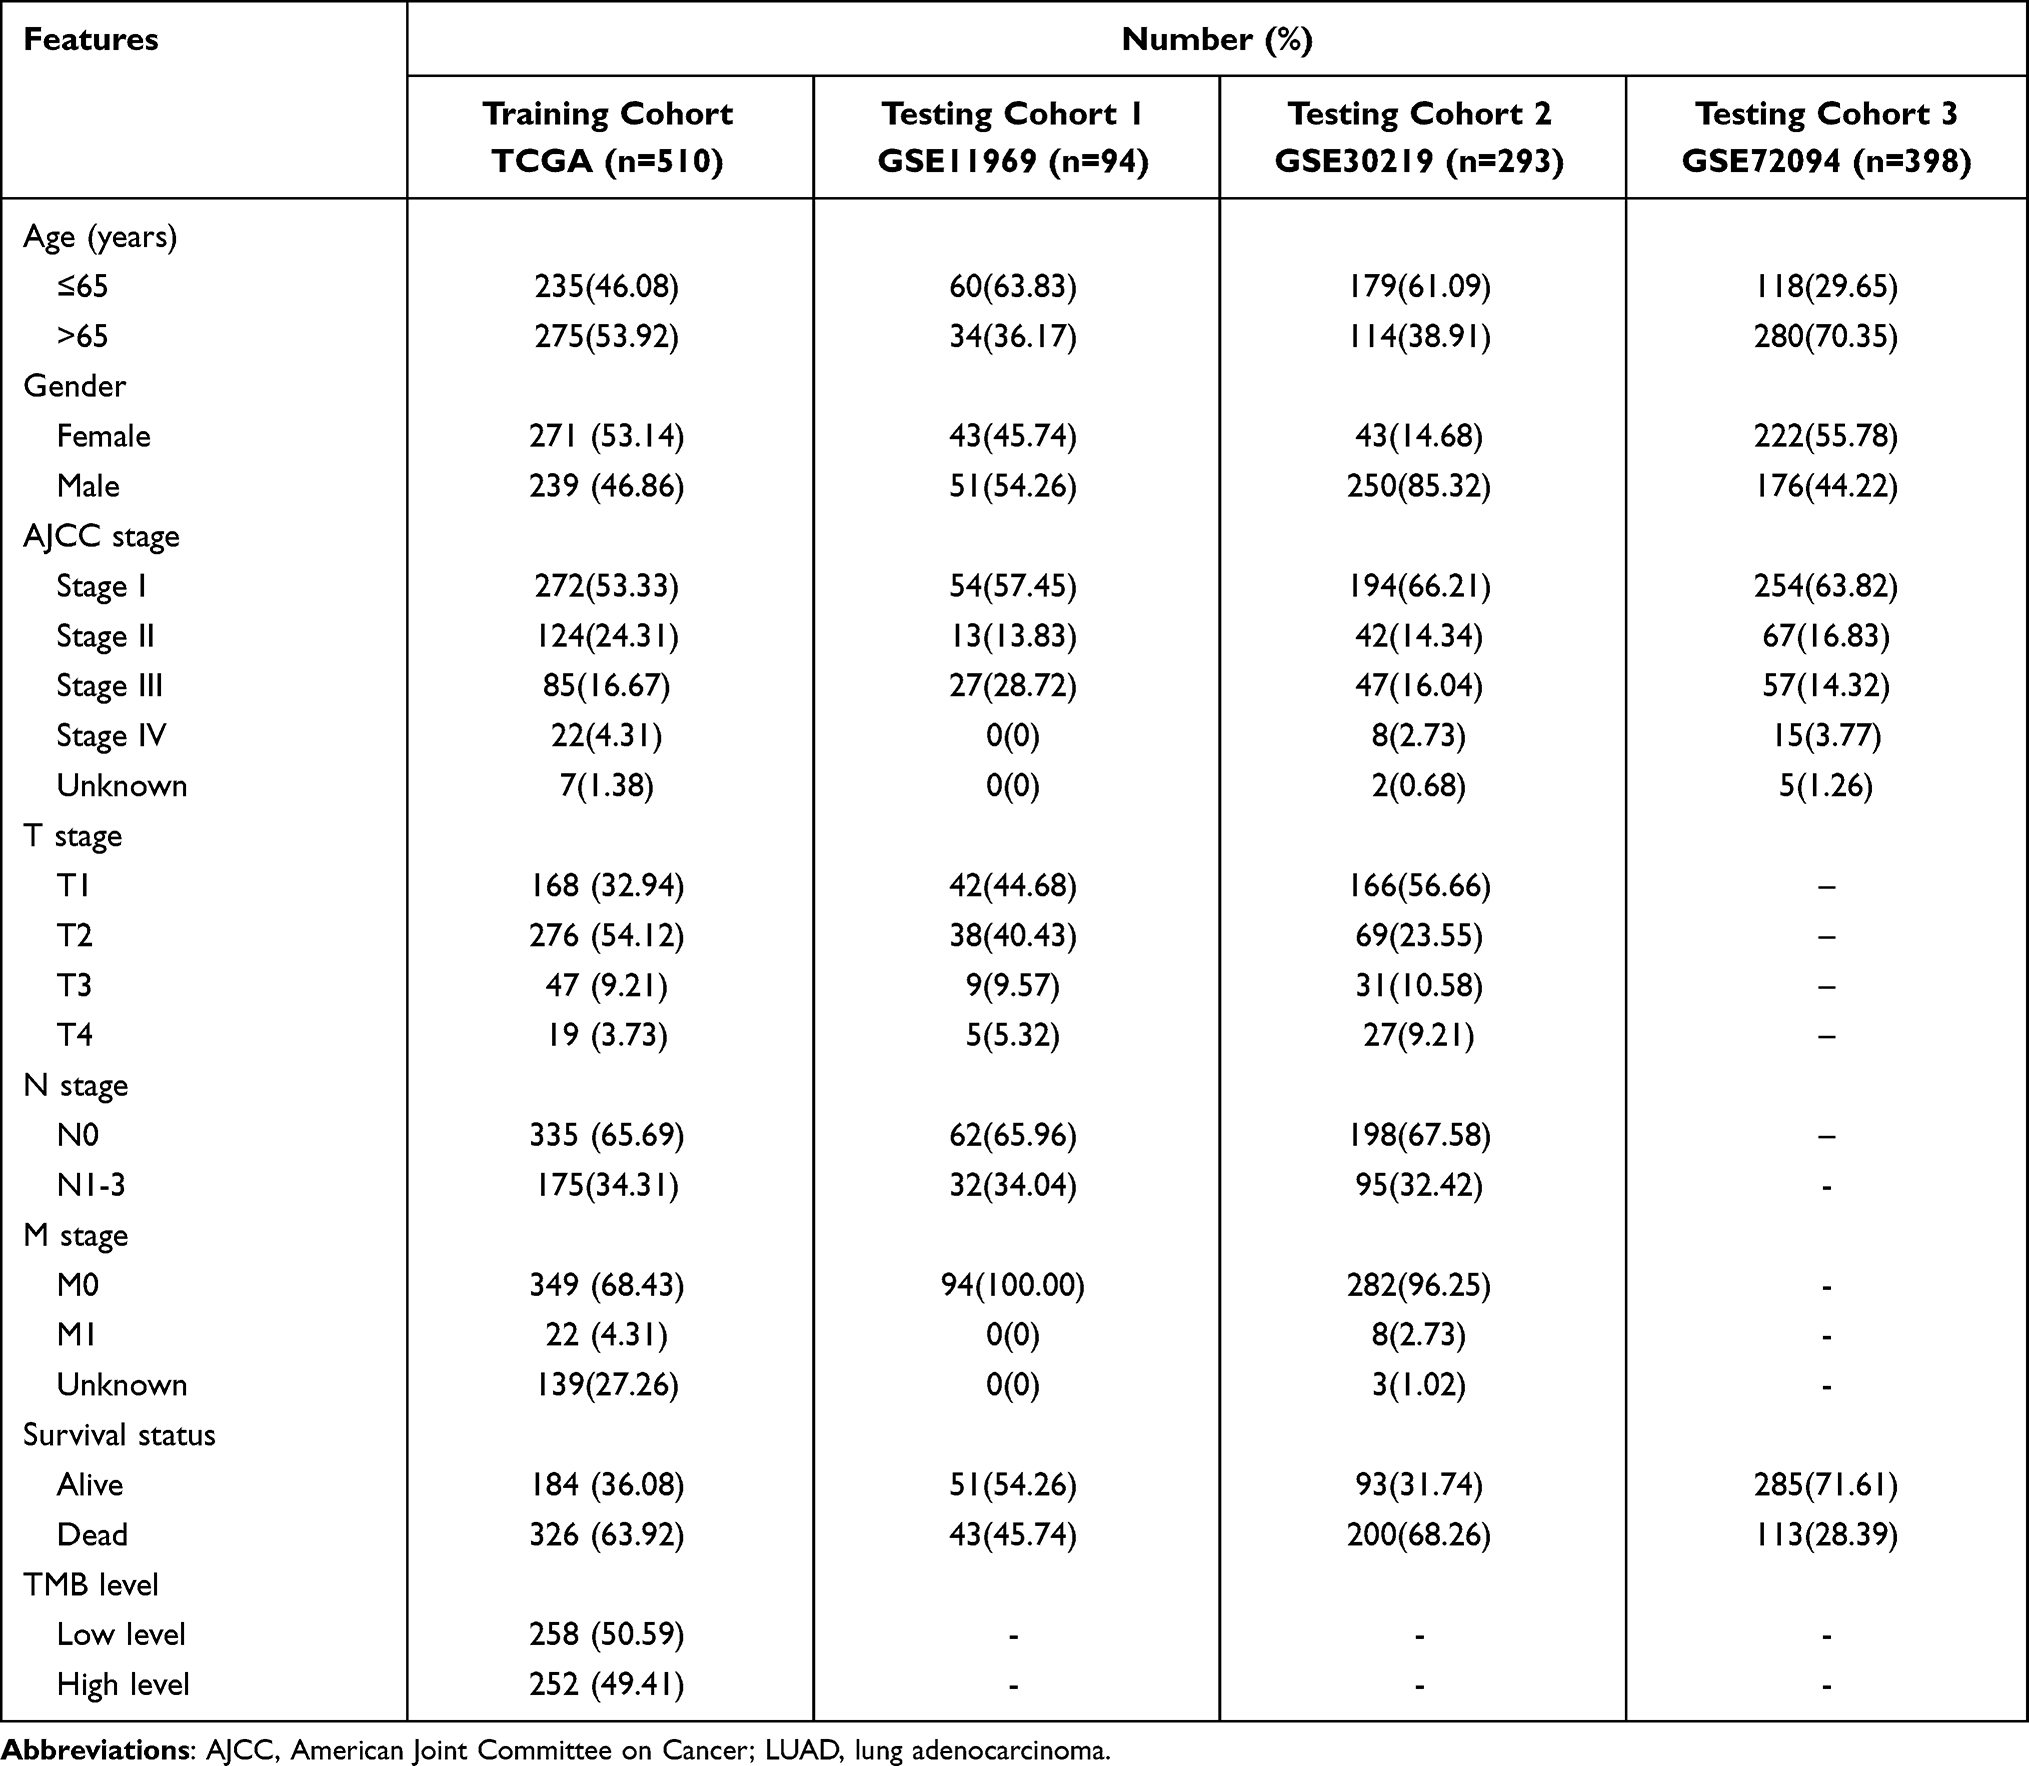 |
Table 1 Clinical Characteristics of LUAD Patients Included in This Study |
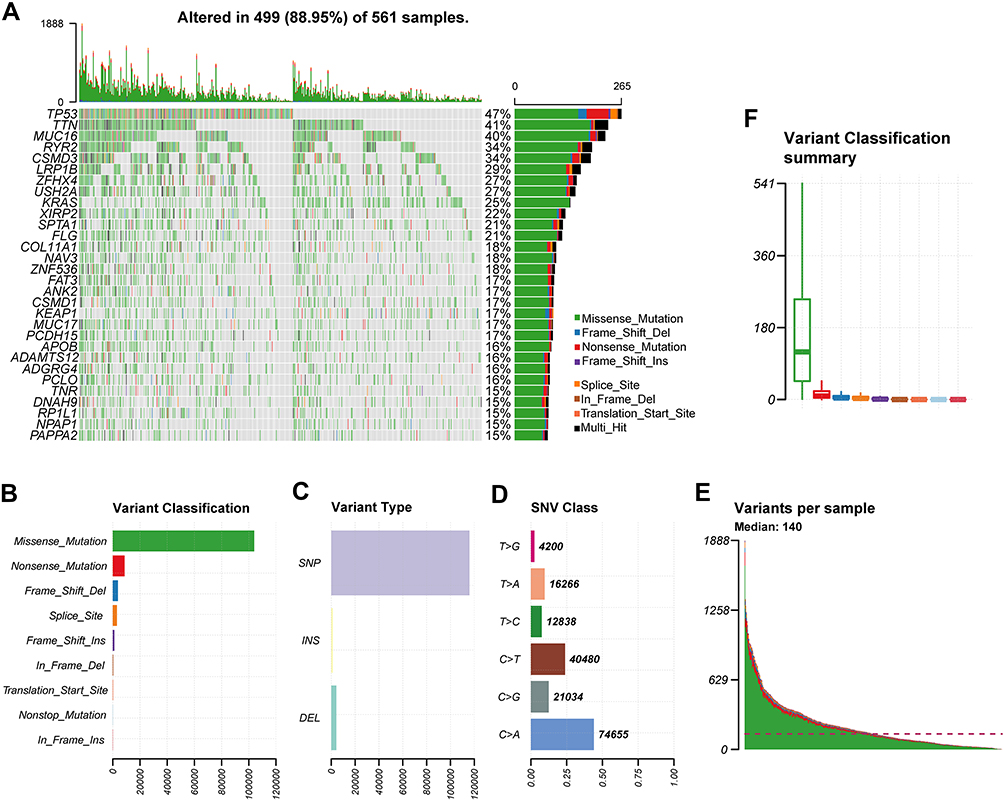 |
Figure 1 Landscape of mutation profiles in LUAD samples. (A) The waterfall shows the mutation information of the top 30 mutated genes, and the percentage represents the ratio of samples with this gene variation to total samples. Various colors with annotations at the bottom represent the different mutation types. (B–D) Classification of mutation types according to different categories. (E and F) Tumor mutation burden in each sample. |
Functional Enrichment Analysis of TMB-Related DEGs
The TMB score in LUAD ranged from 0.03 to 60 per megabase, with a median of 4.23 per megabase (Table S1). A total of 397 DEGs with FDR<0.05 and logFC>1 were identified by the differential analysis. The heatmap revealed that genes in high-TMB samples showed commonly lower expression levels than those in low-TMB samples (Figure 2A and B), which suggests that these DEGs were possibly determining factors for the status of TMB. GO pathway and KEGG enrichment analyses indicated that DEGs were involved in immune-related functions, such as leukocyte-mediated cytotoxicity and regulation of positive chemotaxis (Figure 2C and D). This suggested a potential correlation between the TMB level and the immune response process.
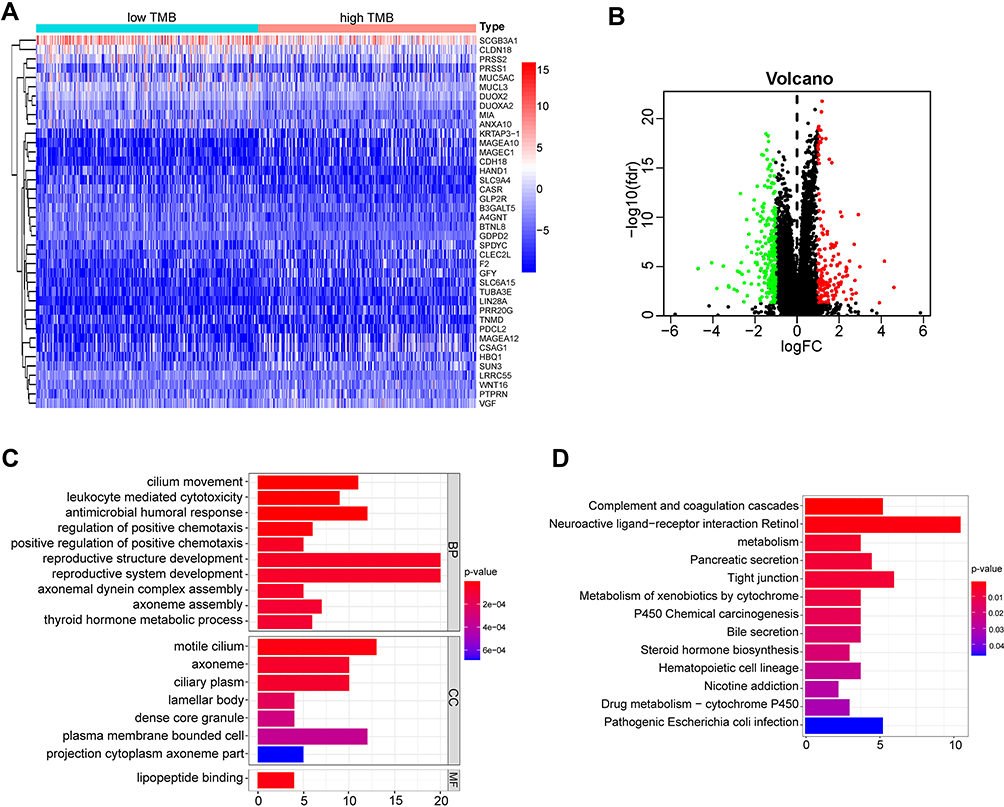 |
Figure 2 Functional enrichment analysis of differentially expressed genes (DEGs). (A) Heatmap for DEGs generated by comparison of the high TMB group versus the low TMB group. (B) Volcano plot showing the DEGs in LUAD. Red represents the up-regulated genes, and green represents the down-regulated genes. (C) GO enrichment analysis for DEGs. Terms with p and q <0.05 were believed to be enriched significantly. (D) Enrichment analysis of KEGG pathways. |
Differential Abundance of Immune Cells in the Low- and High-TMB Groups
To further explore the relationship between TMB and immune infiltration in LUAD, we analyzed the proportion of 22 kinds of immune cells in each sample using the CIBERSORT algorithm and displayed the results in a barplot (Figure 3A). Furthermore, the Wilcoxon rank-sum test revealed that the infiltration levels of 11 kinds of immune cells were significantly different between the low- and high-TMB groups (Figure 3B and C). The high-TMB group had a significantly higher proportion of CD8+ T cells, CD4+ memory activated T cells, follicular helper T cells, M1 macrophages and plasma cells than the low-TMB group, while the low-TMB group had a markedly higher proportion of memory B cells, resting memory CD4+ T cells, monocytes, resting dendritic cells, activated dendritic cells and resting mast cells. These results suggest that a high TMB promotes immune infiltration in patients with LUAD.
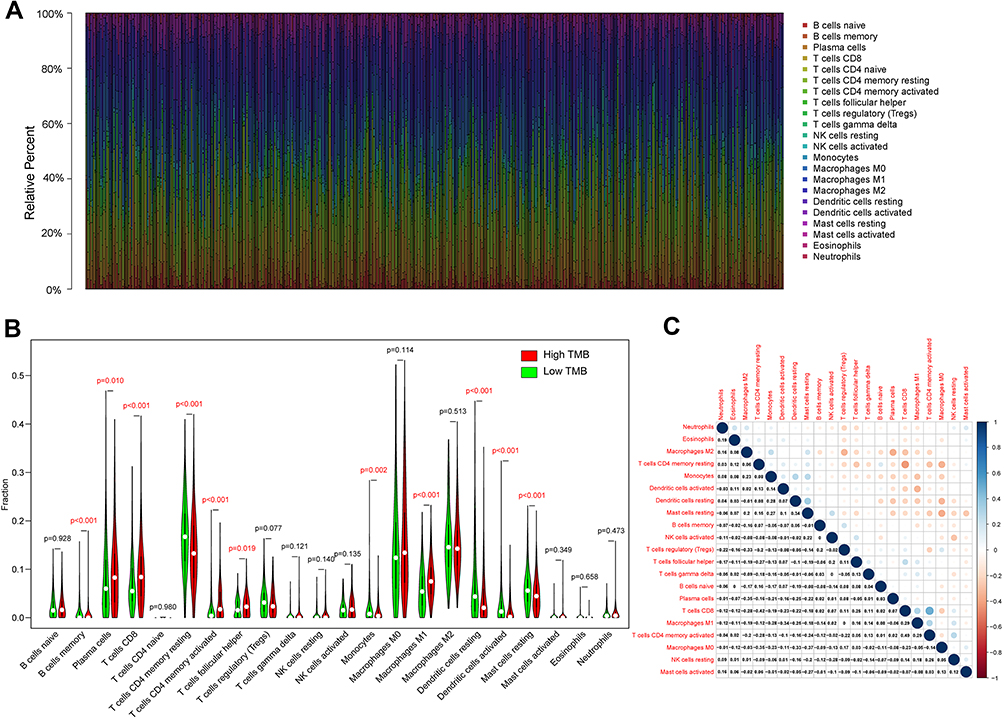 |
Figure 3 Relationship between TMB and immune cell infiltrates. (A) The barplot shows the proportion of 22 kinds of immune cells in each sample, where various colors with annotations represent the different immune cells. (B) Vioplot showing the differences of 22 kinds of immune cells between low-(green) and high-(red) TMB samples. The statistical significance is represented in red with p-value < 0.05. (C) Correlation between 22 kinds of immune cells. The numeric value in each tiny box indicates the p-value of the correlation between two kinds of cells. The Pearson coefficient was used for the significance test. |
Identification of Hub TMB-Related Immune Genes and Prognostic Analysis
Since we have demonstrated that the TMB correlated with immune cell infiltrates and immune-related pathways, we further identified 47 immune differential genes from the Immport database for subsequent analysis (Figure 4A). Through univariate Cox regression analysis, we obtained 11 immune genes associated with prognosis in terms of overall survival (Figure 4B). Three genes were found to be prognostic factors based on multivariate Cox analysis, and their risk coefficients were calculated (Table 2). Kaplan-Meier analysis revealed that the expression of the three hub genes correlated positively with prognosis (Figure 4C). Moreover, the expression of the three hub genes was positively correlated with the abundance of CD4+ T cells, CD8+ T cells, and macrophages (Figure S1) and diverse forms of mutations carried by hub genes commonly inhibit immune infiltrates (Figure S2).
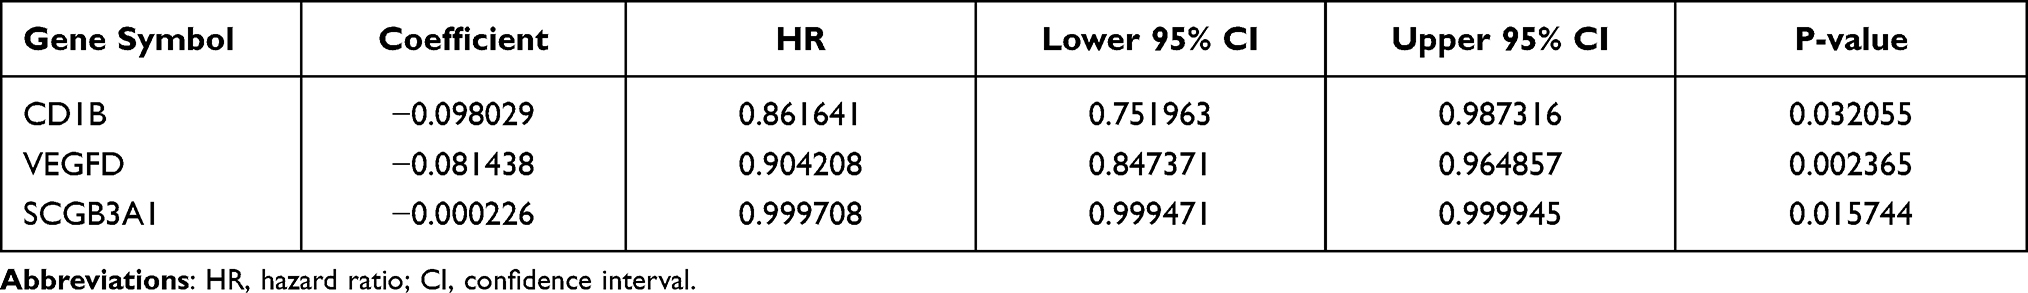 |
Table 2 Multivariate Cox Regression Analysis of Hub TMB-Related Immune Genes |
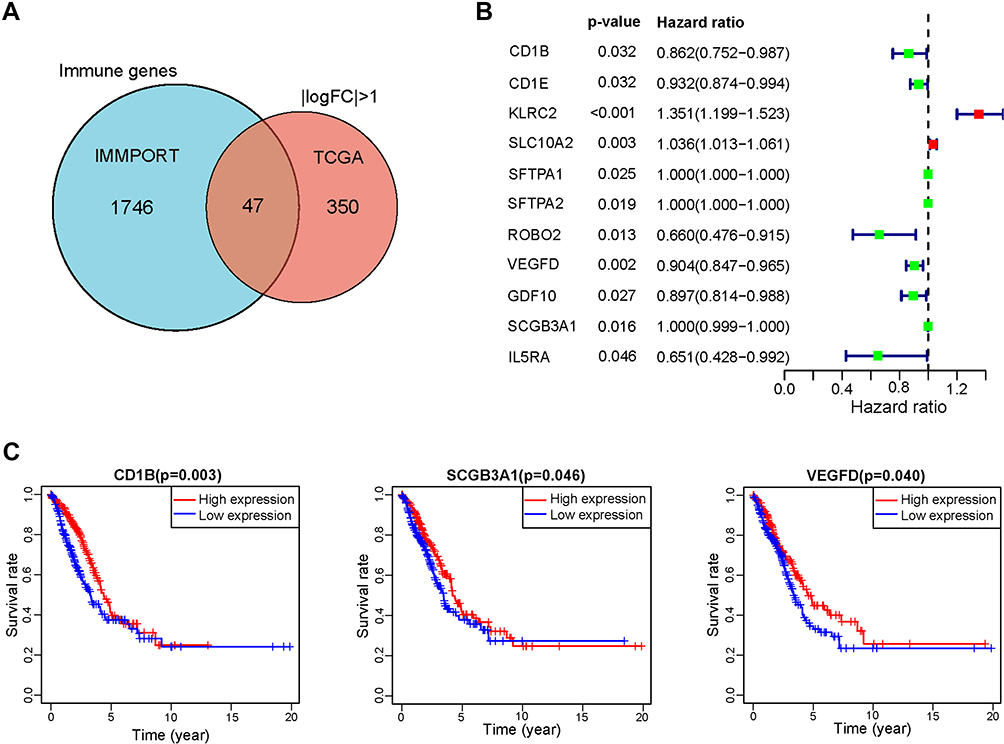 |
Figure 4 Identification of TMB-related immune genes. (A) Venn plot showing a total of 47 TMB-related immune genes shared by immune genes and DEGs. (B) The forest plot of 11 prognostic TMB-related immune genes screened out by univariate Cox analysis. (C) Kaplan-Meier survival curves of 3 hub TMB-related immune genes with a p-value of the Log rank test. |
Prognostic Value of the TMB-Related Immune Prognostic Model in the Training and Validation Cohorts
Based on the multivariate Cox regression model, we constructed the TMB-related prognostic model as follows: risk score=(−0.098029×EXPCD1B) + (−0.081438×EXPVEGFD) + (−0.000226×EXPSCGB3A1). Then, we calculated the risk score of each LUAD patient in the training cohort (n=510) and divided them into high-risk and low-risk groups according to the median risk score (cutoff value: 1.25). The Kaplan-Meier plot showed that patients with high risk scores had worse survival outcomes than those with low risk scores (p=0.002, Figure 5A). The area under the ROC curve (AUC) of 0.712 indicated that the model has a high prediction accuracy (Figure 5B). Additionally, the risk curve indicated that the high-risk-score group had higher mortality and worse prognosis than the low-risk-score group (Figure 5C). The heatmap shows the expression patterns of the 3 hub genes in patients with different risk scores (Figure 5D). Univariate Cox analysis showed that T, N, pathological staging, and risk score had statistical significance (Figure 5E), while multivariate Cox analysis showed that only pathological stage and risk score were independent prognostic factors (p < 0.05, Figure 5F).
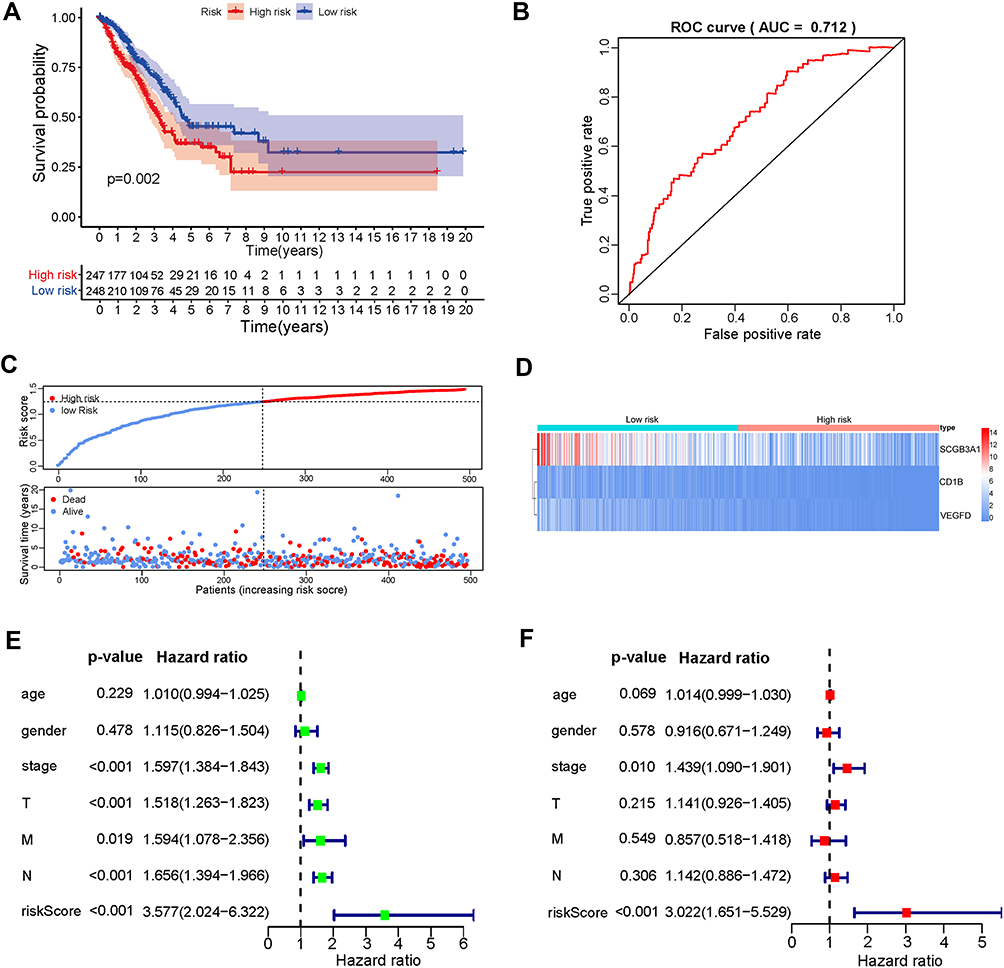 |
Figure 5 Construction and validation of the TMB prognostic model using the TCGA dataset. (A) Kaplan-Meier curves of overall survival for low- and high-risk groups stratified by the TMB prognostic model, where patients with higher risk scores conferred poor survival outcomes (P=0.002). (B) ROC curve for evaluating the prediction accuracy of the TMB prognostic model in LUAD. (C) The distribution of risk scores and the relationship between risk scores and survival times. (D) The expression patterns of 3 hub genes in the high- and low-risk score groups. (E) The prognostic effect analyses of the TMB prognostic model and commonly used prognostic factors using a univariate Cox regression model. (F) The independent prognostic effect analyses of the TMB prognostic model and common prognostic factors using a multivariate Cox regression model. |
In line with the results in the training cohort, the three-gene signature can well stratify the samples in the three GEO testing datasets into low-risk and high-risk groups. Patients in the low-risk group showed a significantly better prognosis than those in the high-risk group (p < 0.05) (Figure 6A–C). The AUCs for the three validation cohorts were 0.646, 0.700, and 0.651 (Figure 6D–F), respectively, indicating that the TMB prognostic model was robust in predicting the overall survival of LUAD patients.
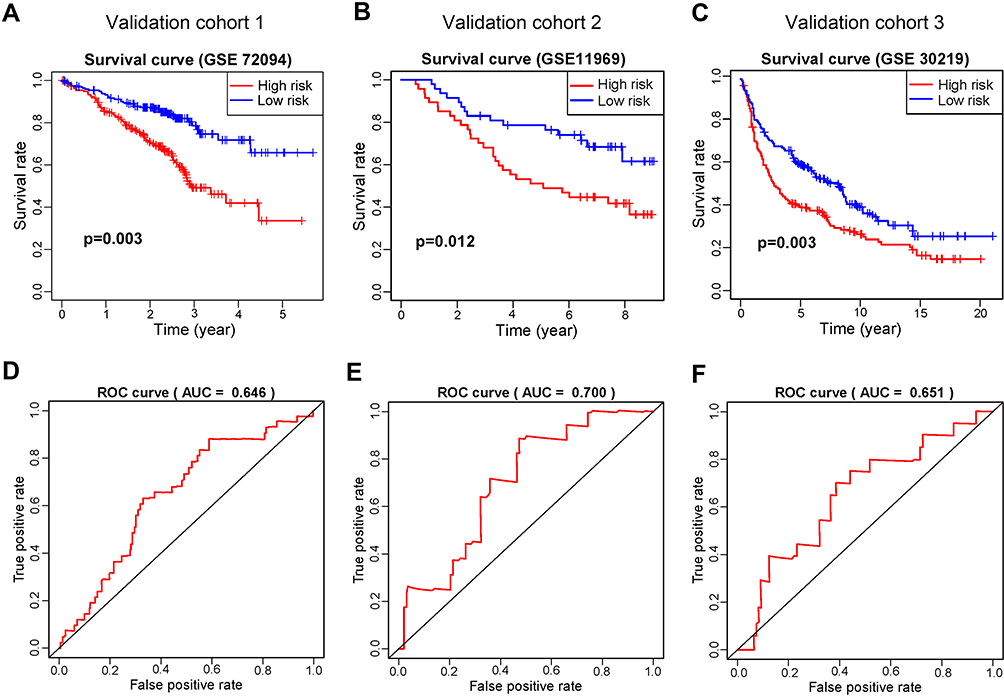 |
Figure 6 Validation of the TMB prognostic model in three GEO testing datasets. Kaplan–Meier survival curves showing overall survival outcomes of high- and low-risk groups in GSE72094 (A), GSE11969 (B), and GSE30219 (C). The ROC curves for judging the predictive accuracy of the model in GSE72094 (D), GSE11969 (E), and GSE30219 (F). |
CD1B Expression Was Correlated with LUAD Prognosis and Tumor Stage in Clinical Samples
From the above analysis, CD1B was found to be an independent prognostic factor. We further verified the expression of CD1B in clinical samples. IHC analysis was performed on tissue microarrays containing LUAD tissues and corresponding adjacent normal tissues from 92 patients. The results suggested that the expression level of CD1B in cancer tissues was significantly lower than that in adjacent normal tissues (p < 0.001) (Figure 7B). Similar results were observed in the pairing analysis between the normal and tumor tissues derived from the same patient (Figure 7C). Representative images showed the cancer tissues and corresponding adjacent normal tissues stained with CD1B (Figure 7A and D). Moreover, Kaplan-Meier survival analysis showed that patients with high CD1B expression had longer survival than those with low CD1B expression (p=0.037, Figure 7E), which was consistent with the results of the bioinformatics analysis. The chi-square test was used to analyze the association between CD1B and other clinicopathological factors (Table 3). In particular, the expression of CD1B declined with the progression of T stage (p=0.029) and clinical stage (p=0.021, Figure 7F). The univariate Cox regression model revealed that age, T stage, N stage, clinical stage, and CD1B expression were associated with the overall survival of LUAD patients, while multivariate analysis indicated that only age was an independent prognostic factor (Table 4). The above results indicated that the expression of CD1B was positively correlated with the prognosis of LUAD patients.
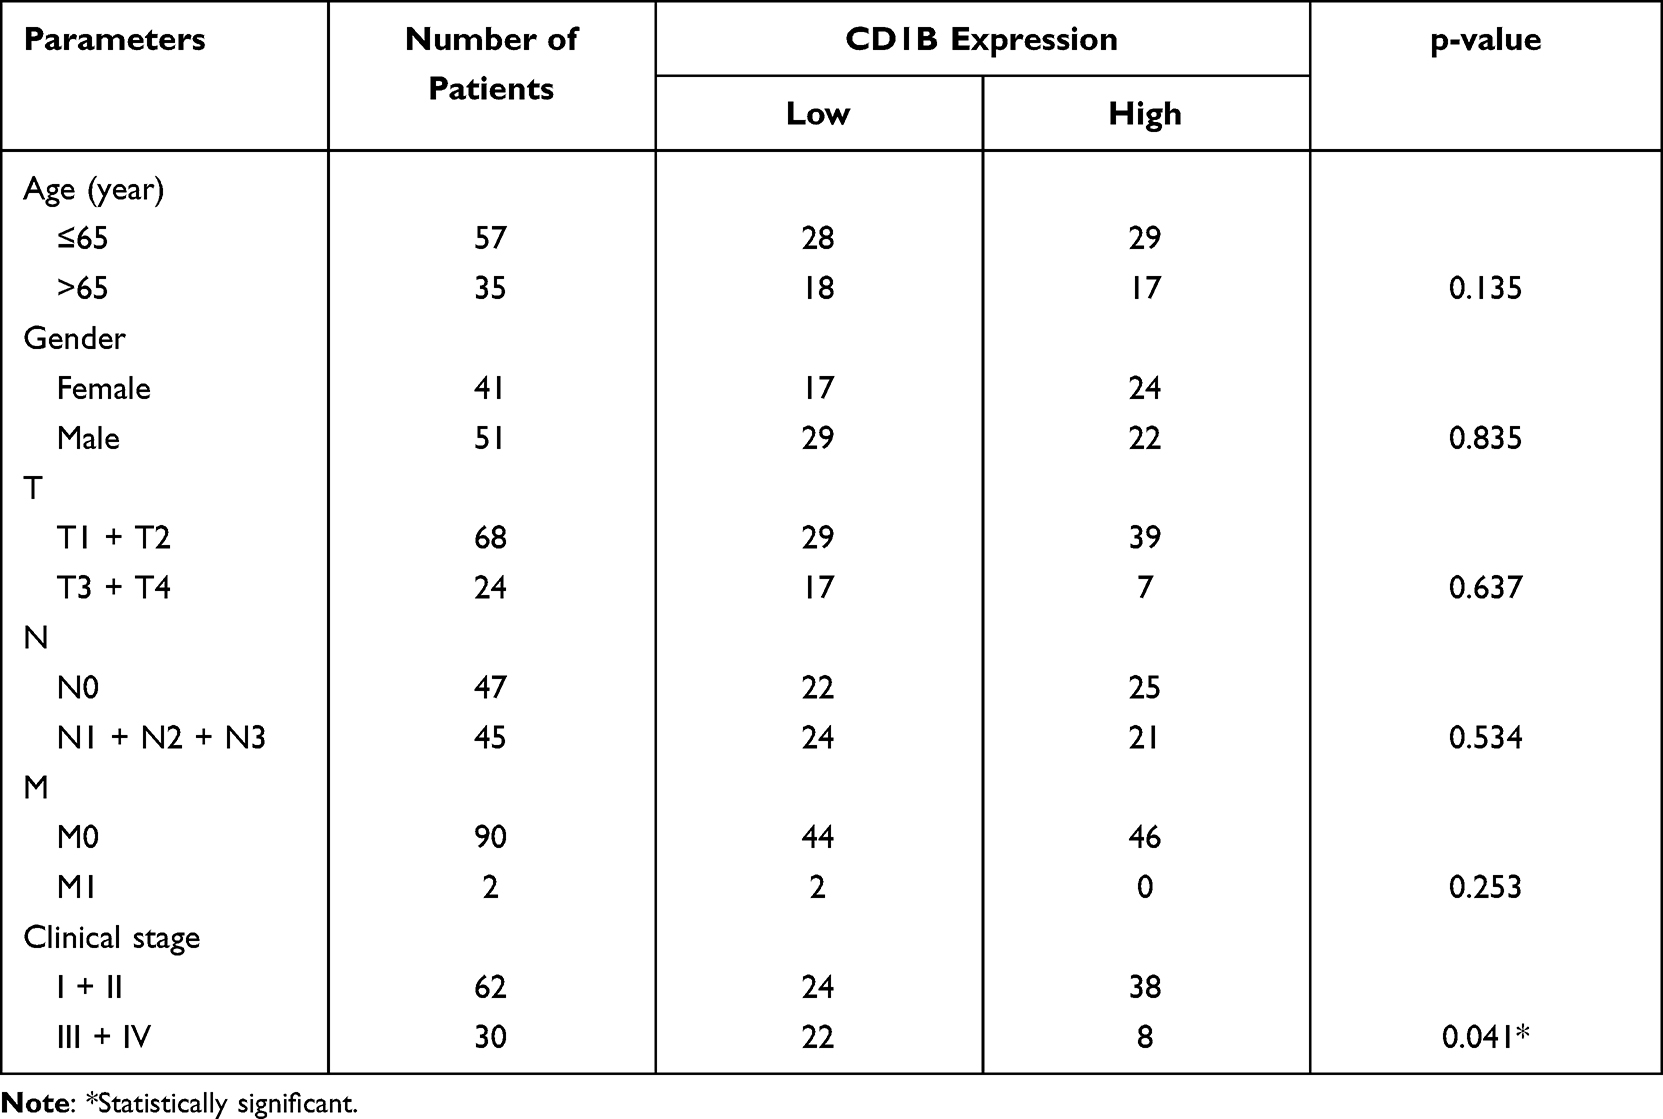 |
Table 3 Correlation of CD1B Expression with Clinicopathological Factors |
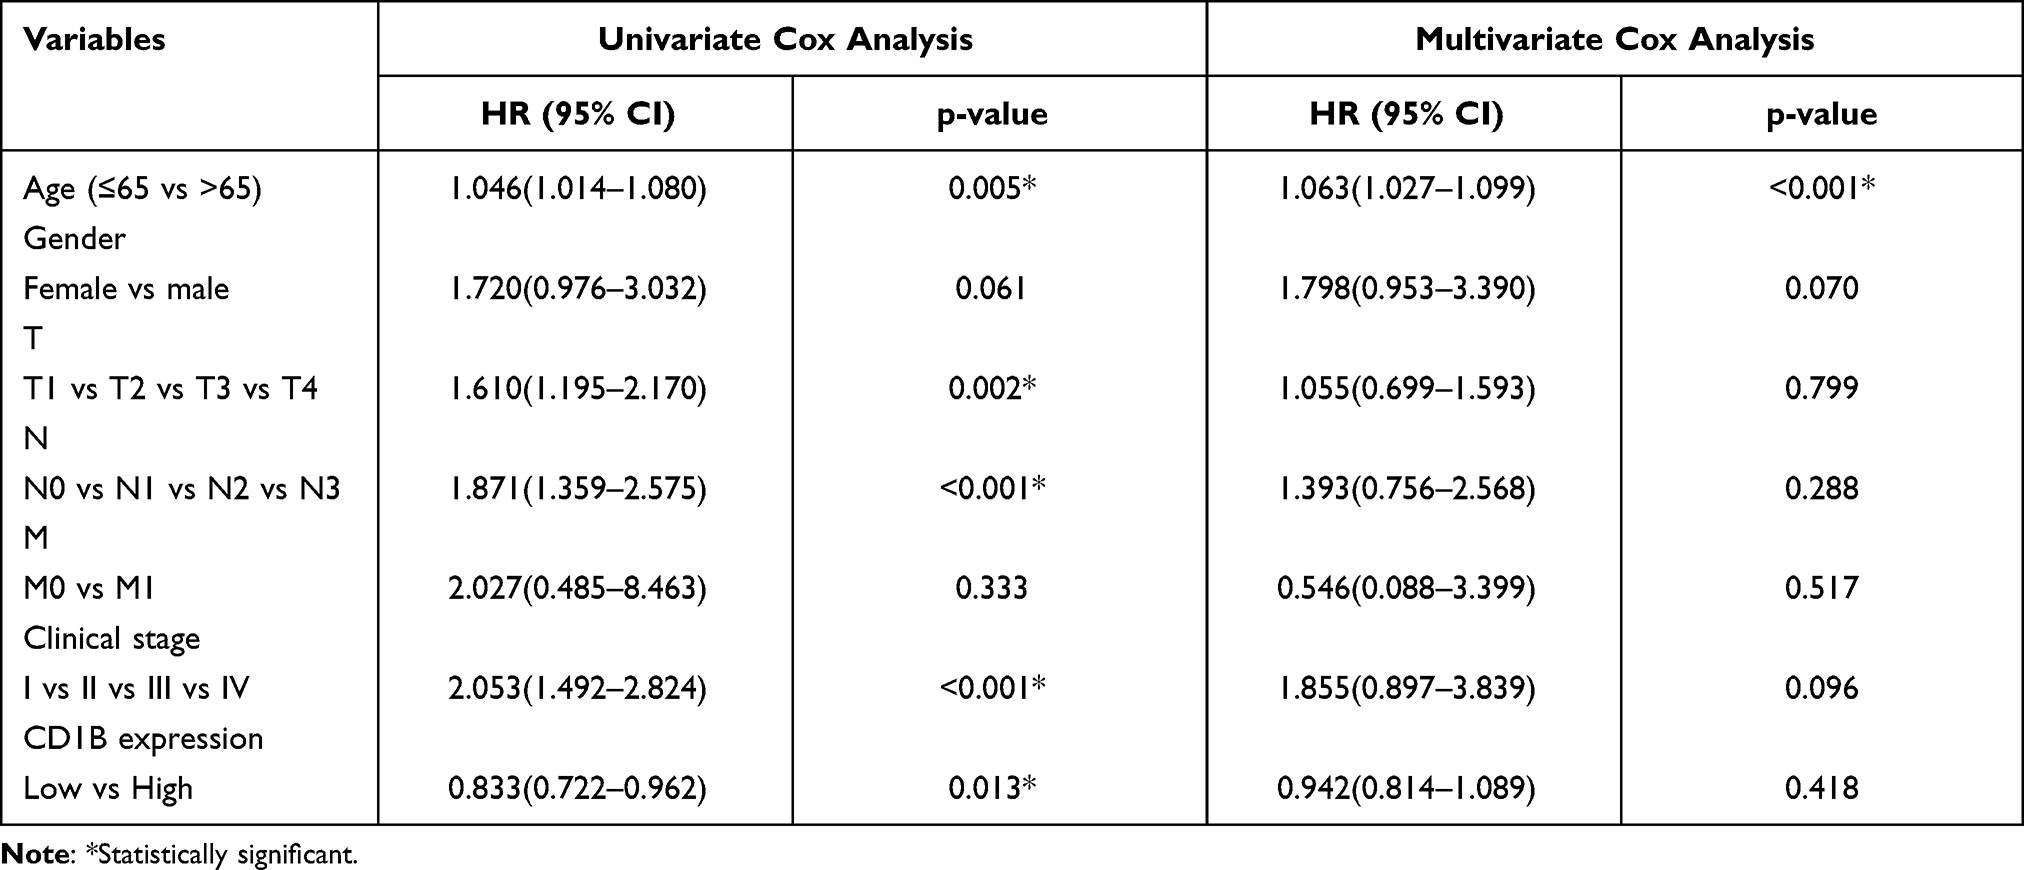 |
Table 4 Univariate and Multivariate Analyses for LUAD Patients on Overall Survival in Tissue Microarray |
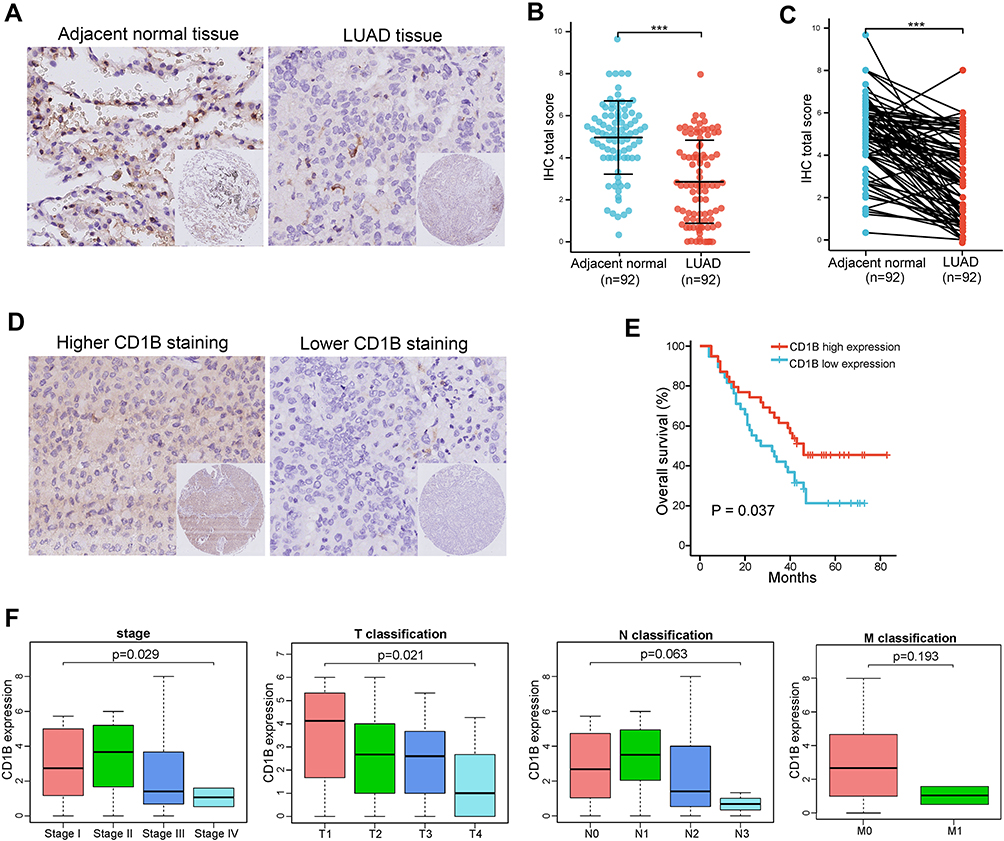 |
Figure 7 IHC detection of CD1B in LUAD and its correlation with survival and clinicopathological characteristics. (A) Representative images of IHC staining of LUAD tissues and corresponding adjacent normal tissues (original magnification ×200). (B) H-score of CD1B expression in cancer tissues and adjacent normal tissues. (C) Paired differentiation analysis for the expression of CD1B in the normal and tumor samples derived from the same patient. (D) Higher CD1B expression and lower CD1B expression in LUAD tissues (original magnification ×200). (E) Kaplan–Meier survival curves of LUAD patients with high CD1B expression and low CD1B expression. Patients were labeled with high expression or low expression depending on the comparison with the median expression level. (F) The correlation of CD1B expression with clinicopathological staging characteristics. Data are presented as the mean ± SEM. *** p<0.001. |
CD1B Was Correlated with Immune Checkpoint Expression in LUAD
We further examined the potential correlations between CD1B and immune-related molecules. First, we examined the relationships between CD1B and common immune checkpoints in TCGA databases, and the results showed positive correlations between CD1B and CTLA4, PD-L1, PD-1, PD-L2, TIM3, LAG3, TIGIT, OX40, and OX40L (Figure 8A). Given the significant role of PD-L1 in immunotherapy, we further validated the correlation between CD1B and PD-L1 using IHC staining. Representative images showed the samples stained with CD1B and PD-L1 (Figure 8B). Samples with positive CD1B expression tended to express higher levels of PD-L1 (Figure 8C). In all samples, Pearson correlation analysis and linear regression analysis showed that CD1B expression was positively correlated with PD-L1 in LUAD (r=0.27, p=0.027) (Figure 8D).
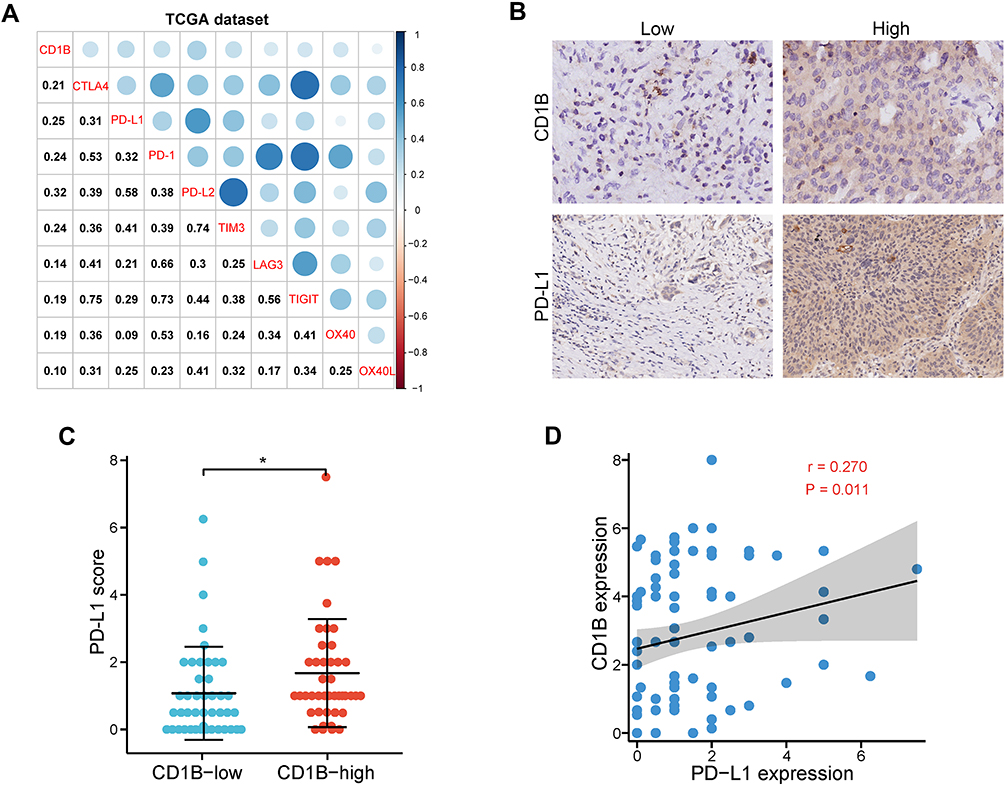 |
Figure 8 Correlation between CD1B and PD-L1 expression. (A) Correlation analysis of CD1B and common immune checkpoint expression in TCGA databases. (B) Representative IHC images showing LUAD samples immunostained for CD1B and PD-L1 in the tissue microarray. (C) Expression of PD-L1 according to CD1B expression status in the tissue microarray. (D) Correlation between CD1B and PD-L1 expression in the tissue microarray. * p< 0.05. |
CD1B is Involved in Immune Activation Functions and Pathways in LUAD
Given that the expression of CD1B was correlated with the survival and TNM stages of LUAD patients, GSEA was implemented to explore the mechanism of CD1B in LUAD. The results showed that genes positively related to CD1B were significantly enriched in the immune response, antigen processing and presentation, IFN-γ-mediated signaling pathway, and T-cell activation (Figure 9A and B). In addition, Hallmark was performed using CD1B expression as the phenotype. The results showed that highly expressed CD1B correlated with immune-related activities, such as allograft rejection, complement, and interferon responses, while poorly expressed CD1B was associated with metabolic pathways, such as glycolysis (Figure 9C and D). These results revealed that CD1B plays a crucial role in immune activation in LUAD, suggesting that CD1B may suppress the progression of LUAD through immune activation, which is consistent with previous results.
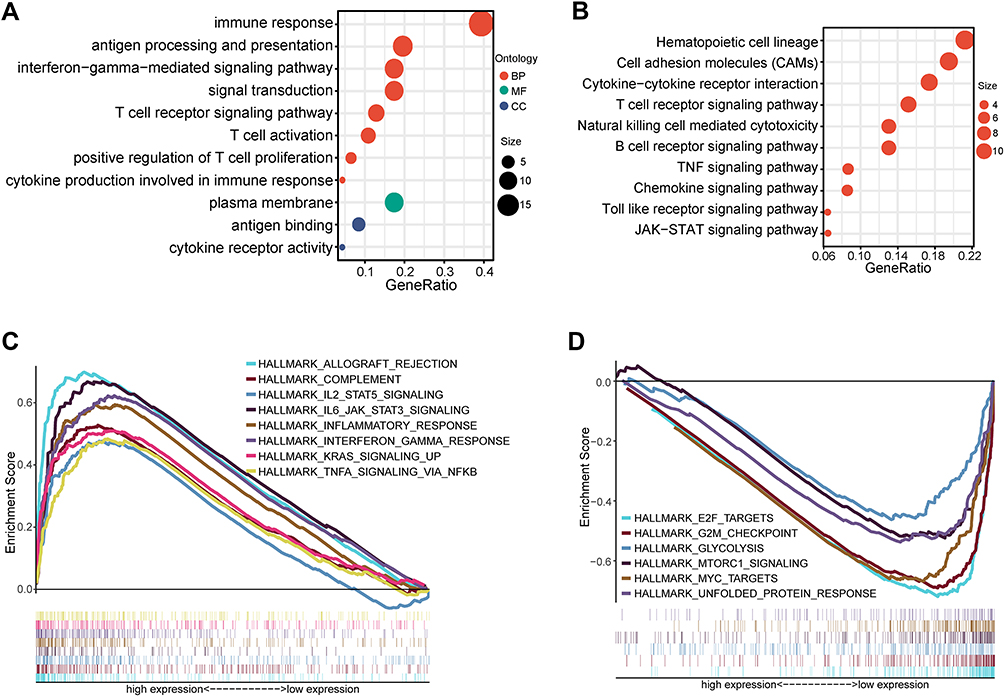 |
Figure 9 CD1B-related functions and pathways in LUAD. (A and B) GSEA enrichment results revealed that CD1B was closely related to the immune response and other immune-related pathways in LUAD. (C) The enriched gene sets in the HALLMARK collection by the high CD1B expression sample. Each line represents one particular gene set with a unique color. Only gene sets with p < 0.05 and q < 0.05 were considered significant. (D) Gene sets enriched in HALLMARK by samples with low CD1B expression. |
CD1B Expression is Associated with Immune Cell Infiltration in LUAD
We further explored the correlation of CD1B expression with tumor-infiltrating immune cells (TICs). The results of difference and correlation analyses showed that a total of eight kinds of immune cells were correlated with the expression of CD1B (Figure 10). Among them, memory B cell, memory CD4 T cells, monocytes, resting dendritic cells, and resting mast cells were positively correlated with CD1B expression, while plasma cells, resting NK cells, and M0 macrophages were negatively correlated. These findings further supported that the levels of CD1B affected the immune infiltration of LUAD.
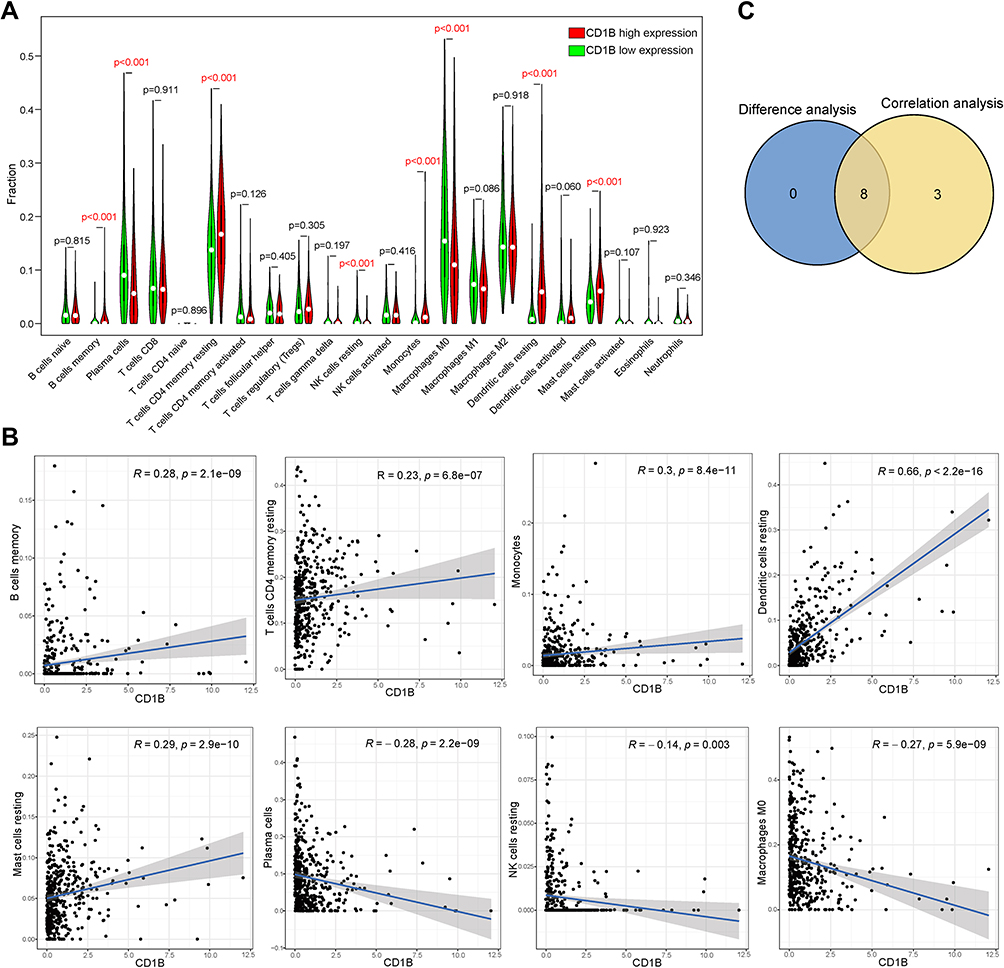 |
Figure 10 Correlation of CD1B expression with the immune infiltration level in LUAD. (A) Violin plot showing the ratio differentiation of 22 kinds of immune cells between LUAD tumor samples with low or high CD1B expression, and the Wilcoxon rank-sum test was used for the significance test. The statistical significance is represented in red with p-value < 0.05. (B) Scatter plot showing the correlation of 8 kinds of immune cell proportions with CD1B expression (p < 0.05), and the Pearson coefficient was used for the correlation test. (C) Venn plot displaying eight kinds of immune cells correlated with CD1B expression codetermined by difference and correlation tests displayed in violin and scatter plots, respectively. |
Discussion
In recent years, immunotherapy for the treatment of LUAD has rapidly developed. However, biomarkers are still needed to identify patients who could respond to treatment and to avoid unnecessary costs and severe toxicities for nonresponders. TMB and TILs have been verified to herald the efficacy of immunotherapy. However, few relevant studies have focused on the correlation of TMB with immune infiltrates in LUAD and the identification of related prognostic molecules.
In the present study, we first analyzed the mutation landscape in LUAD and investigated the relationship between TMB, immune-related genes, immune cell infiltration, and LUAD prognosis. Somatic mutations always occur during cancer progression and are accompanied by mutated gene transcription, translation, and neoantigen peptide synthesis.16 Part of the neoantigens will then be processed and presented on the cell surface with MHC, which will be recognized and targeted by the immune cells.17 Presenting heterogeneity variability among different types of tumors, the TMB level was high in NSCLCs, malignant melanoma, and squamous carcinomas, while in leukemias and some childhood cancers, TMB was low.18 A series of clinical trials showed that patients with a high TMB had a higher response rate and favorable progression-free survival when receiving immunotherapy.9 The reason might be that highly mutated tumors are more prone to form neoantigens, which can be recognized as foreign by the immune system, thus improving the anticancer immune response and resulting in better prognosis.10
DEGs between the high- and low-TMB groups were ferreted out, and GO and KEGG analyses indicated that these DEGs were mainly involved in immune-related functions, such as the regulation of positive chemotaxis and leukocyte-mediated cytotoxicity. We further explored the relationship between the TMB level and immune cell infiltration. We observed that the high TMB groups tended to have higher abundances of antitumor immune cells, such as CD8 T cells, CD4 T cells, and M1 macrophage infiltration, indicating that immunocyte-killing activity was increased in high-TMB patients. Consistent with previous mutation analysis, neoantigens carried by mutated tumors can be detected by the immune system and lead to T-cell-mediated antitumor effects.19 Therefore, high TMB is the key mechanism of enhancing immune cell infiltration and promoting antitumor immunity. Mahmoud et al found that the total number of CD8+ T cells was correlated with higher tumor grade and better patient survival.20 Similar conclusions were drawn by Matsumoto et al that CD4+ and CD8+ T cells were key factors in tumor immunotherapy and that their high infiltration levels were correlated with better prognosis in triple-negative breast cancer.21 Moreover, studies also suggested that macrophages play an important role in activating tumor-specific anticancer defenses by influencing T- and B- cell functions.22
Other important findings of this study were that 3 prognostic hub immune genes were identified through univariate and multivariate Cox regression analysis. In the subsequent validation of clinical samples in tissue microarray slides, we finally focused on CD1B. CD1B is a member of group 1 in the CD1 family of transmembrane glycoproteins.23 It is usually expressed on antigen-presenting cells (APCs), such as dendritic cells and monocytes/macrophages, and in many human cancer cells.24 Different from the classical MHC class I and II molecules that recognize peptide antigens, CD1B molecules recognize a wide array of self- and foreign-lipid antigens and present them to T-cell receptors (TCRs), making them visible to the immune system by activating the cognate T cells.25,26 Recent studies have indicated that normal cells have distinct expression patterns of CD1 molecules compared to tumor cells27 and decreased expression of CD1B is associated with worse overall survival in prostate cancer.28 Similar conclusions were drawn by our study that low expression of CD1B conferred adverse survival outcomes in LUAD. Moreover, studies have shown that CD1B regulates the development of natural killing (NK) cells.29 Our study also revealed that CD1B was involved in multiple immune-related pathways and the activation of immune cells. Therefore, CD1B plays an important role not only in the recognition and presentation of nonpeptide antigens but also in other immune responses. In addition, PD-L1 is an important immunomodulatory molecule, and the interaction between PD-1 and its ligands could attenuate the immune response via evasion of immune elimination.30 Our results suggested that CD1B was significantly associated with PD-L1 and other immune checkpoints. PD-L1 or other immune checkpoints may have a modest effect on the function of CD1B, which in turn has an impact on tumor immunity and clinical outcomes in LUAD patients. These data demonstrated the antitumor potential of CD1B and its potential application in immunotherapy, providing possible biomarkers for predicting ICI efficacy and a new target for immunotherapy in LUAD. This funding deserves further validation in patients receiving immunotherapy.
SCGB3A1 belongs to the secretoglobin family, also known as HIN-1, which is related to the regulation of cell differentiation and proliferation.31 Previous studies have found that SCGB3A1 possesses multiple tumor suppressor functions, including inhibition of cell growth, migration, and invasion through the AKT signaling pathway.32 Moreover, it has been reported that the SCGB3A1 gene is frequently methylated in lung tumors, and the downregulation of SCGB3A1 expression caused by methylation is an important factor in predicting poor prognosis.33 VEGFD, also known as FIGF, belongs to the vascular endothelial growth factor (VEGF) family. It could induce both angiogenesis and lymphangiogenesis.34 A clinical study showed that low expression of VEGFD is a predictor of more survival benefits from bevacizumab treatment for patients with colorectal cancer.35 Our results demonstrated that these hub genes exhibit prognostic effects in LUAD. However, the mechanistic details of these hub genes require further exploration.
Finally, we constructed a TMB prognostic model for survival prediction using the 3 hub immune genes. Our results showed that the model could well stratify patients into high- and low-risk groups, and high-risk patients revealed worse survival outcomes. The AUC of this prognostic model was 0.712, indicating high predictive accuracy. Univariate and multivariate Cox analyses confirmed that the model can be used as an independent prognostic factor for predicting the patient outcomes. Furthermore, we demonstrated that this classification was reproducible and predictable in three GEO test datasets.
Despite these findings, there are certain limitations in the present study. The lack of basic experimental research on the correlation between hub immune genes and immune cell infiltration cannot be ignored. Further validation in patients receiving immunotherapy will be required in the future. Otherwise, whether the prognostic model can be used to estimate the prognosis of patients in clinical practice still needs a larger clinical queue for verification.
Conclusions
Our study analyzed the relationship between TMB and immune infiltration in LUAD and constructed a TMB prognostic model that effectively predicted the prognosis of LUAD patients. CD1B expression was positively correlated with the prognosis and immune activation of LUAD, suggesting that CD1B may serve as a potential prognostic biomarker and immune-related therapeutic target for LUAD. Our research may provide novel insight into personalized prognosis prediction and new therapies in LUAD.
Ethics Approval and Informed Consent
This study was approved by the Institutional Review Board of Tongji Hospital (IRB ID: TJ-C20151236) in accordance with the ethical guidelines of the Declaration of Helsinki. Informed consent was obtained from all subjects.
Author Contributions
All authors made a significant contribution to the work reported, whether that is in the conception, study design, execution, acquisition of data, analysis and interpretation, or in all these areas; took part in drafting, revising or critically reviewing the article; gave final approval of the version to be published; have agreed on the journal to which the article has been submitted; and agree to be accountable for all aspects of the work.
Funding
This work was supported by grants from the National Natural Science Foundation of China (grant numbers 81772471 and 82172716 to S Xia).
Disclosure
The authors report no conflicts of interest in this work.
References
1. Bray F, Ferlay J, Soerjomataram I, Siegel RL, Torre LA, Jemal A. Global cancer statistics 2018: GLOBOCAN estimates of incidence and mortality worldwide for 36 cancers in 185 countries. CA Cancer J Clin. 2018;68(6):394–424. doi:10.3322/caac.21492
2. Duma N, Santana-Davila R, Molina JR. Non-small cell lung cancer: epidemiology, screening, diagnosis, and treatment. Mayo Clin Proc. 2019;94(8):1623–1640. doi:10.1016/j.mayocp.2019.01.013
3. Herbst RS, Morgensztern D, Boshoff C. The biology and management of non-small cell lung cancer. Nature. 2018;553(7689):446–454. doi:10.1038/nature25183
4. Reck M, Rodriguez-Abreu D, Robinson AG, et al. Pembrolizumab versus chemotherapy for PD-L1-positive non-small-cell lung cancer. N Engl J Med. 2016;375(19):1823–1833. doi:10.1056/NEJMoa1606774
5. Hellmann MD, Rizvi NA, Goldman JW, et al. Nivolumab plus ipilimumab as first-line treatment for advanced non-small-cell lung cancer (CheckMate 012): results of an open-label, Phase 1, multicohort study. Lancet Oncol. 2017;18(1):31–41. doi:10.1016/S1470-2045(16)30624-6
6. Braun DA, Burke KP, Van Allen EM. Genomic approaches to understanding response and resistance to immunotherapy. Clin Cancer Res. 2016;22(23):5642–5650. doi:10.1158/1078-0432.CCR-16-0066
7. Gibney GT, Weiner LM, Atkins MB. Predictive biomarkers for checkpoint inhibitor-based immunotherapy. Lancet Oncol. 2016;17(12):e542–e551. doi:10.1016/S1470-2045(16)30406-5
8. Mok TSK, Wu YL, Kudaba I, et al. Pembrolizumab versus chemotherapy for previously untreated, PD-L1-expressing, locally advanced or metastatic non-small-cell lung cancer (KEYNOTE-042): a randomised, open-label, controlled, Phase 3 trial. Lancet. 2019;393(10183):1819–1830. doi:10.1016/S0140-6736(18)32409-7
9. Samstein RM, Lee CH, Shoushtari AN, et al. Tumor mutational load predicts survival after immunotherapy across multiple cancer types. Nat Genet. 2019;51(2):202–206. doi:10.1038/s41588-018-0312-8
10. Rizvi NA, Hellmann MD, Snyder A, et al. Cancer immunology. Mutational landscape determines sensitivity to PD-1 blockade in non-small cell lung cancer. Science. 2015;348(6230):124–128. doi:10.1126/science.aaa1348
11. Rotte A, Jin JY, Lemaire V. Mechanistic overview of immune checkpoints to support the rational design of their combinations in cancer immunotherapy. Ann Oncol. 2018;29(1):71–83. doi:10.1093/annonc/mdx686
12. Chen DS, Mellman I. Oncology meets immunology: the cancer-immunity cycle. Immunity. 2013;39(1):1–10. doi:10.1016/j.immuni.2013.07.012
13. Yi M, Jiao D, Xu H, et al. Biomarkers for predicting efficacy of PD-1/PD-L1 inhibitors. Mol Cancer. 2018;17(1):129. doi:10.1186/s12943-018-0864-3
14. Chen DS, Mellman I. Elements of cancer immunity and the cancer-immune set point. Nature. 2017;541(7637):321–330. doi:10.1038/nature21349
15. Fenizia F, Pasquale R, Roma C, Bergantino F, Iannaccone A, Normanno N. Measuring tumor mutation burden in non-small cell lung cancer: tissue versus liquid biopsy. Transl Lung Cancer Res. 2018;7(6):668–677. doi:10.21037/tlcr.2018.09.23
16. Chabanon RM, Pedrero M, Lefebvre C, Marabelle A, Soria JC, Postel-Vinay S. Mutational landscape and sensitivity to immune checkpoint blockers. Clin Cancer Res. 2016;22(17):4309–4321. doi:10.1158/1078-0432.CCR-16-0903
17. Riaz N, Morris L, Havel JJ, Makarov V, Desrichard A, Chan TA. The role of neoantigens in response to immune checkpoint blockade. Int Immunol. 2016;28(8):411–419. doi:10.1093/intimm/dxw019
18. Alexandrov LB, Nik-Zainal S, Wedge DC, et al. Signatures of mutational processes in human cancer. Nature. 2013;500(7463):415–421. doi:10.1038/nature12477
19. Hackl H, Charoentong P, Finotello F, Trajanoski Z. Computational genomics tools for dissecting tumour-immune cell interactions. Nat Rev Genet. 2016;17(8):441–458. doi:10.1038/nrg.2016.67
20. Mahmoud SM, Paish EC, Powe DG, et al. Tumor-infiltrating CD8+ lymphocytes predict clinical outcome in breast cancer. J Clin Oncol. 2011;29(15):1949–1955. doi:10.1200/JCO.2010.30.5037
21. Matsumoto H, Thike AA, Li H, et al. Increased CD4 and CD8-positive T cell infiltrate signifies good prognosis in a subset of triple-negative breast cancer. Breast Cancer Res Treat. 2016;156(2):237–247. doi:10.1007/s10549-016-3743-x
22. Mills CD, Lenz LL, Harris RA, Breakthrough A. Macrophage-directed cancer immunotherapy. Cancer Res. 2016;76(3):513–516. doi:10.1158/0008-5472.CAN-15-1737
23. Brigl M, Brenner MB. CD1: antigen presentation and T cell function. Annu Rev Immunol. 2004;22:817–890. doi:10.1146/annurev.immunol.22.012703.104608
24. Shahine A, Reinink P, Reijneveld JF, et al. A T-cell receptor escape channel allows broad T-cell response to CD1b and membrane phospholipids. Nat Commun. 2019;10(1):56. doi:10.1038/s41467-018-07898-0
25. Reijneveld JF, Ocampo TA, Shahine A, et al. Human gammadelta T cells recognize CD1b by two distinct mechanisms. Proc Natl Acad Sci U S A. 2020;117(37):22944–22952. doi:10.1073/pnas.2010545117
26. Bagchi S, Li S, Wang CR. CD1b-autoreactive T cells recognize phospholipid antigens and contribute to antitumor immunity against a CD1b(+) T cell lymphoma. Oncoimmunology. 2016;5(9):e1213932. doi:10.1080/2162402X.2016.1213932
27. Shahine A. The intricacies of self-lipid antigen presentation by CD1b. Mol Immunol. 2018;104:27–36. doi:10.1016/j.molimm.2018.09.022
28. Lee CH, Chen LC, Yu CC, et al. Prognostic value of CD1B in localised prostate cancer. Int J Environ Res Public Health. 2019;16:23. doi:10.3390/ijerph16234723
29. Baron JL, Gardiner L, Nishimura S, Shinkai K, Locksley R, Ganem D. Activation of a nonclassical NKT cell subset in a transgenic mouse model of hepatitis B virus infection. Immunity. 2002;16(4):583–594. doi:10.1016/S1074-7613(02)00305-9
30. Pardoll DM. The blockade of immune checkpoints in cancer immunotherapy. Nat Rev Cancer. 2012;12(4):252–264. doi:10.1038/nrc3239
31. Castro M, Grau L, Puerta P, et al. Multiplexed methylation profiles of tumor suppressor genes and clinical outcome in lung cancer. J Transl Med. 2010;8:86. doi:10.1186/1479-5876-8-86
32. Krop I, Parker MT, Bloushtain-Qimron N, et al. HIN-1, an inhibitor of cell growth, invasion, and AKT activation. Cancer Res. 2005;65(21):9659–9669. doi:10.1158/0008-5472.CAN-05-1663
33. Marchetti A, Barassi F, Martella C, et al. Down regulation of high in normal-1 (HIN-1) is a frequent event in stage I non-small cell lung cancer and correlates with poor clinical outcome. Clin Cancer Res. 2004;10(4):1338–1343. doi:10.1158/1078-0432.CCR-1174-03
34. Janiszewska M, Tabassum DP, Castano Z, et al. Subclonal cooperation drives metastasis by modulating local and systemic immune microenvironments. Nat Cell Biol. 2019;21(7):879–888. doi:10.1038/s41556-019-0346-x
35. Weickhardt AJ, Williams DS, Lee CK, et al. Vascular endothelial growth factor D expression is a potential biomarker of bevacizumab benefit in colorectal cancer. Br J Cancer. 2015;113(1):37–45. doi:10.1038/bjc.2015.209
 © 2022 The Author(s). This work is published and licensed by Dove Medical Press Limited. The full terms of this license are available at https://www.dovepress.com/terms.php and incorporate the Creative Commons Attribution - Non Commercial (unported, v3.0) License.
By accessing the work you hereby accept the Terms. Non-commercial uses of the work are permitted without any further permission from Dove Medical Press Limited, provided the work is properly attributed. For permission for commercial use of this work, please see paragraphs 4.2 and 5 of our Terms.
© 2022 The Author(s). This work is published and licensed by Dove Medical Press Limited. The full terms of this license are available at https://www.dovepress.com/terms.php and incorporate the Creative Commons Attribution - Non Commercial (unported, v3.0) License.
By accessing the work you hereby accept the Terms. Non-commercial uses of the work are permitted without any further permission from Dove Medical Press Limited, provided the work is properly attributed. For permission for commercial use of this work, please see paragraphs 4.2 and 5 of our Terms.