")
Back to Journals » Journal of Inflammation Research » Volume 15
CD19 and POU2AF1 are Potential Immune-Related Biomarkers Involved in the Emphysema of COPD: On Multiple Microarray Analysis
Authors Zhang DW , Ye JJ, Sun Y, Ji S , Kang JY, Wei YY , Fei GH
Received 7 January 2022
Accepted for publication 5 April 2022
Published 20 April 2022 Volume 2022:15 Pages 2491—2507
DOI https://doi.org/10.2147/JIR.S355764
Checked for plagiarism Yes
Review by Single anonymous peer review
Peer reviewer comments 5
Editor who approved publication: Professor Ning Quan
Da-Wei Zhang,1,2,* Jing-Jing Ye,1,2,* Ying Sun,1,2 Shuang Ji,1,2 Jia-Ying Kang,1,2 Yuan-Yuan Wei,1,2 Guang-He Fei1,2
1Department of Respiratory and Critical Care Medicine, First Affiliated Hospital of Anhui Medical University, Hefei, 230022, Anhui Province, People’s Republic of China; 2Key Laboratory of Respiratory Diseases Research and Medical Transformation of Anhui Province, Hefei, 230022, Anhui Province, People’s Republic of China
*These authors contributed equally to this work
Correspondence: Guang-He Fei, Department of Respiratory and Critical Care Medicine, First Affiliated Hospital of Anhui Medical University, Hefei, 230022, Anhui Province, People’s Republic of China, Tel +86 551 6292 2013, Fax +86 551 6363 5578, Email [email protected]
Purpose: Emphysema is the main cause of the progression of chronic obstructive pulmonary disease (COPD). This study aimed to identify the key genes involved in COPD-related emphysema.
Patients and Methods: GSE76925 was downloaded from Gene Expression Omnibus database. Protein–protein interaction networks of differentially expressed genes (DEGs) between control and COPD groups were constructed to identify hub genes using Cytoscape. Diagnostic performance of hub genes was evaluated using receiver operating characteristic analysis. Correlation analysis was performed to identify the key genes by analyzing the relationship between the hub genes and lung function and computed tomography (CT) indexes of emphysema. COPD patients were then divided into two groups based on the median expression of key genes and DEGs between these two groups were identified. Enrichment analysis of DEGs and correlation analysis between key genes and the infiltration of the immune cells were also analyzed. Finally, the role of key genes was evaluated in a lung tissues dataset (GSE47460) and a blood dataset (GSE76705). Additionally, the expression of key genes was validated by quantitative real-time polymerase chain reaction and immunohistochemistry.
Results: CD19 and POU2AF1 had diagnostic efficacy for COPD and were significantly correlated with lung function and CT indexes of emphysema. Enrichment and immune analyses revealed that CD19 and POU2AF1 were correlated with the B cells in COPD. These results were consistent in GSE47460. The expression of CD19 and POU2AF1 in blood was the opposite of that in lung tissues, and CD19 and POU2AF1 were both significantly upregulated in COPD lung tissues at both the mRNA and protein levels.
Conclusion: CD19 and POU2AF1 may serve as key regulators of emphysema and contribute to the progression of COPD by regulating the B-cell immunology. Targeting B cells may be a promising strategy for treating COPD.
Keywords: chronic obstructive pulmonary disease, emphysema, B cell, bioinformatics analysis
Introduction
Chronic obstructive pulmonary disease (COPD) is a common, preventable and treatable disease that is characterized by persistent respiratory symptoms and airway limitation.1 The point prevalence of COPD was 3.92% worldwide in 2017, and the estimated COPD-attributable death rate was 42/100,000.1 As an important pathological manifestation of COPD, emphysema is defined as “abnormal permanent enlargement of air spaces distal to terminal bronchioles, accompanied by destruction of their walls without obvious fibrosis”.2 Emphysema has been recognized as one of the COPD phenotypes and may be present in other phenotypes, as well as in smokers without COPD.3 Moreover, emphysema is associated with the severity and progression of COPD.2 Patients with emphysema are more likely to experience acute exacerbations of COPD and have multiple complications than those without emphysema.4 Therefore, a better understanding of the detailed mechanisms underlying emphysema is helpful for preventing COPD progression.
COPD is usually diagnosed by spirometry as this is the most widely available and reproducible test of lung function. Worse pulmonary function and severer dyspnea have been observed in COPD patients with emphysema.5 A follow-up study of 2085 high-risk COPD patients found that emphysema was an independent risk factor for airflow limitation during the 3-year follow-up period.6 Currently, emphysema in COPD has been assessed mainly by computed tomography (CT) indexes of emphysema and pulmonary pathology.7 Chest CT indexes of emphysema have been used to identify the extent, severity, and distribution of emphysema based on its noninvasive phenotype. The low attenuation area percentage at −950 Hounsfield units (LAA950) and lung attenuation at 15th percentile (Perc15) are the most common CT indexes of emphysema,8 which relates the varying degrees of COPD severity with airflow obstruction.9,10 Based on these findings, finding a key biomarker associated with both lung function and emphysema is significant for the early prevention and diagnosis of patients with COPD.
The pathogenesis of emphysema is complex and diverse.11 As a multi-gene related disease, emphysema can occur through a variety of different molecular mechanisms, which are currently called the COPD endotype currently.12 An integrated bioinformatics method can more effectively combine the clinical features and the molecular mechanisms in COPD to determine the relation between exotype and endotype in COPD than other means. Multiple genomic analyses have also demonstrated the potential role of the B cell receptor (BCR) signaling pathway in the development of emphysema, both in lung tissue and blood.13 A recent study found that some B-cell-related genes, including CD19 and POU2AF1 were identified as the hub genes involved in the emphysema phenotype of COPD patients.14 CD19 is expressed from the earliest stages of B cell development until plasma cell terminal differentiation when its expression is lost.15 POU2AF1 is a transcriptional coactivator and is essential for the response of B-cells to antigens and required for the formation of germinal centers.16,17 In our study, we analyzed the gene expression data, corresponding clinical information, and immune cell infiltration of COPD using the Gene Expression Omnibus (GEO) database through bioinformatics analysis to identify key genes that are not only helpful for early diagnosis of COPD but also closely related to emphysema through bioinformatics analysis. Finally, we verified the roles of key genes using multiple COPD-associated datasets and experiments, aiming to provide new avenues for the study of immunological pathogenesis of emphysema in COPD.
Materials and Methods
Data Acquisition and Pretreatment
GSE76925, GSE47460 and GSE76705 were downloaded from the National Center for Biotechnology Information (NCBI) GEO database18 (https://www.ncbi.nlm.nih.gov/geo/) and then normalized using the “normalizeBetweenArrays” function of the R package “limma”. These data can be found in GSE76925 (https://www.ncbi.nlm.nih.gov/geo/query/acc.cgi?acc=GSE76925), GSE47460 (https://www.ncbi.nlm.nih.gov/geo/query/acc.cgi?acc=GSE47460) and GSE76705 (https://www.ncbi.nlm.nih.gov/geo/query/acc.cgi?acc=GSE76705). GSE76925 was regarded as a training cohort and contained 111 COPD and 40 normal lung tissues.19 GSE76925 was based onmGPL10558 platform (Illumina HumanHT-12 V4.0 expression beadchip). GSE47460 was regarded as a validation cohort.20 GSE47460 was used on GPL6480 [Agilent-014850 Whole Human Genome Microarray 4x44K G4112F (Probe Name version)] and GPL14550 [Agilent-028004 SurePrint G3 Human GE 8x60K Microarray (Probe Name Version)] and the batch effect of data matrix were removed using the “combat” function of the R package “SVA”. The exclusion criteria included subjects who had never smoked; subjects whose smoking history was unknown; and subjects who were at GOLD0 stage. A total of 204 COPD and 65 normal lung tissues were finally included from GSE47460. GSE76705 was used as a validation cohort and contained 143 COPD and 86 normal blood samples.21 GSE76705 was based on GPL570 platform [(HG-U133_Plus_2) Affymetrix Human Genome U133 Plus 2.0 Array]. The detailed clinical characteristics of COPD patients in this study are presented in Table 1. The detailed process of data selection and analysis is shown in Supplementary Material (Supplementary Figure S1).
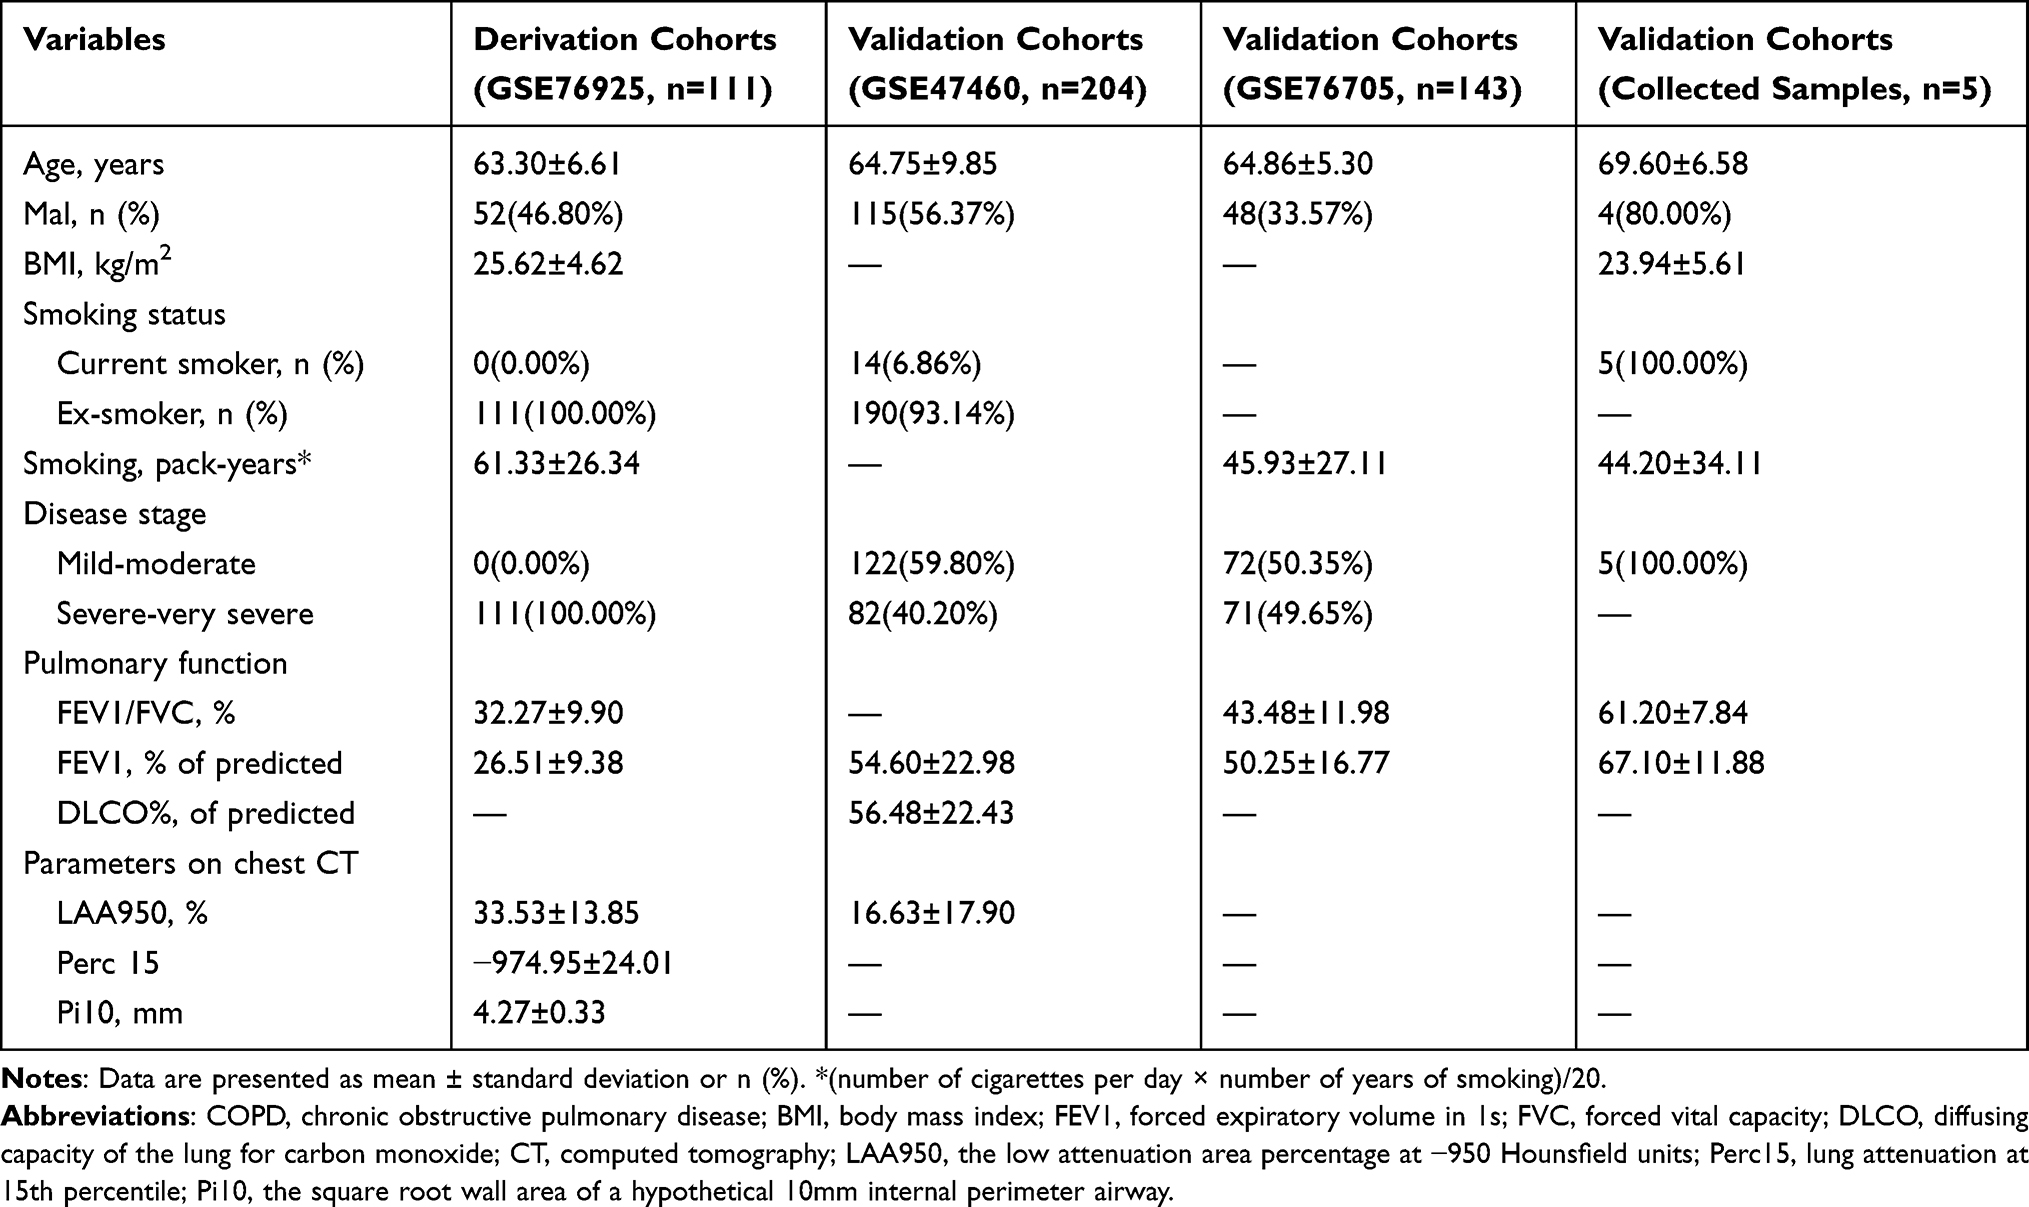 |
Table 1 Demographic Characteristics of COPD Patients in the Derivation and Validation Cohorts |
Identification of Differentially Expressed Genes
The R package “limma”22 was used to identify the differentially expressed genes (DEGs) between the COPD and control groups using GSE76925. The adjusted P value = p *(m/k), where m is the number of tests, and k is the ranking of the P-value of this test among all tests. DEGs were identified as genes with a two-fold change (log2 fold-change > 1 or < −1) and an adjusted P < 0.05.
Protein–Protein Interaction Network and Hub Gene Identification
The DEGs were mapped using the STRING database (https://string-db.org/;version11.0b)23 to construct a protein–protein interaction (PPI) network. An interaction score of > 0.4 was considered significant. The obtained protein interaction networks were then imported into Cytoscape software (http://www.cytoscape.org/, version 3.8.2) for visualization and processing of the topological network analysis using the Network Analyzer module.24 The Cytoscape plugin “CytoHubba” was used to explore PPI network hub genes25 and 10 hub genes were selected. Larger maximum correlation criterion (MCC) values were represented by deeper color.25 The heatmap was generated using the R package “pheatmap” with scale= “row”, and was clustered by Euclidean distance.
Unsupervised Clustering of Hub Genes
The “ConsensusClusterPlus” R package was used to perform an unsupervised consensus clustering to divide COPD groups into two clusters based on the expression of hub genes. Two clusters (namely, “cluster I” and “cluster II”) were selected for assessing the differences in clinical characteristics. Categorical clinical data between clusters were compared by one-way ANOVA followed by an LSD test.
Receiver Operating Characteristic Curve and Correlation Analysis
To assess hub gene diagnostic values, Graph-Pad Prism 7.0 was used to draw the receiver operating characteristic (ROC) curves and calculate the area under curve (AUC) values. Pearson correlation analysis between hub genes and lung function and CT indexes of emphysema in patients with COPD was used to identify the key genes in GSE76925.
Functional Enrichment Analysis
The COPD samples in GSE76925 and GSE47460 were divided into two groups based on the median value of the expression of key genes. DEGs with Log2 (fold change) > 1 or < −1 and an adjusted P < 0.05 were identified by Bayes test in GSE76925 and GSE47460. The R package “clusterProfiler”26 and “pathview”27 was used for the Gene Ontology (GO) - Biological processes (BP) functional enrichment analysis and Kyoto Encyclopedia of Genes and Genomes (KEGG) pathway enrichment analysis of DEGs. P-value <0.05 was regarded to be statistically significant. The enrichment results were visualized using the OmicStudio tools (https://www.omicstudio.cn/tool).
Immune Infiltration Analysis
To confirm the association between key genes and immune cells, the relative abundance scores of immune cells were calculated using xCell (https://xcell.ucsf.edu/).28 The relationship between the expression of key genes and immune infiltration was analyzed by Pearson correlation analysis.
Lung Tissues
Ten patients (five smokers without COPD and five smokers with COPD) who underwent pulmonary lobectomy or segmentectomy for lung cancer in situ were included in this study. These resected tissues were at least 3 cm from the tumor margin.29 The resected samples were immediately frozen in liquid nitrogen and stored at −80°C. All patients with COPD were diagnosed according to the GOLD guideline.1 The exclusion criteria included: patients with chronic lung diseases other than COPD; patients with acute COPD; and patients with a history of taking corticosteroids or any other anti-inflammatory drugs in the preceding 4 weeks. This study complied with the Declaration of Helsinki. All subjects signed the informed consent and this study was approved by the ethics committee of Anhui Medical University. NO. 20180388. The detailed clinical characteristics of COPD patients are presented in Table 1.
Quantitative Real-Time Polymerase Chain Reaction
Quantitative Real-Time Polymerase Chain Reaction (qRT‑PCR) was performed on all lung tissues collected. Total RNA was extracted using Trizol reagent (Ambion, Foster City, CA). The cDNA was synthesized using Hifair III 1st Strand cDNA Synthesis SuperMix (Yeasen Biotech, Shanghai, China). qRT-PCR was performed using SYBR Green Master Mix (Yeasen Biotech, Shanghai, China) to measure the mRNA levels of human key genes. mRNA levels were normalized to the β-actin mRNA level. Gene expression was quantified via the 2−ΔΔCt method. All primers are listed in Supplementary Material (Supplementary TableS1). Wilcoxon analysis was used to evaluate the differences in mRNA levels of key genes between the lung tissues of the control and COPD groups.
Histological Staining of Lung Tissues
Human lung tissues were fixed in 4% paraformaldehyde and then embedded in paraffin. Sections with a thickness of 4 μm were prepared for staining. Hematoxylin-eosin (HE) was employed to test for structural changes of the human lung. Immunohistochemical staining was used to detect the expression of key genes in these sections. Antigens were retrieved according to primary antibody specifications. An endogenous peroxidase blocker was added and slides were incubated for 30 minutes at 37°C. Slides were then incubated with rabbit anti-POU2AF1 antibody (Zenbio#382135, Chengdu, China; diluted 1:500) and mouse anti-CD19 antibody (MXB Biotechnologies#MAB-0705, Fuzhou, China) at 4°C overnight. The next day, the slides were washed with PBS, followed by incubation with biotinylated goat anti-rabbit IgG and then incubated with streptavidin-peroxidase. Diaminobenzidine (DAB) solution (ZSGB-Bio, Beijing, China) was used for staining. Finally, all slides were counterstained with hematoxylin. Images were obtained using a fluorescence microscope (TissueFAXS plus, ZEISS, Austria).
Statistical Analyses
All statistical analyses were performed in R version 3.6.2. For GSE47460 and GSE76705, the expression of the key genes in different groups was compared by Wilcoxon analysis. And the correlation between key genes and clinical data and immune cells in patients with COPD was analyzed by Pearson correlation analysis. P-values under 0.05 were considered significant.
Results
Identification of DEGs
We first obtained the microarray expression matrix of GSE76925 and analyzed the DEGs between the COPD group and the control group. As shown in Figure 1A, 339 DEGs, including 46 upregulated genes and 293 downregulated genes, were identified. The full DEGs list is shown in Supplementary Material (Supplementary File 3).
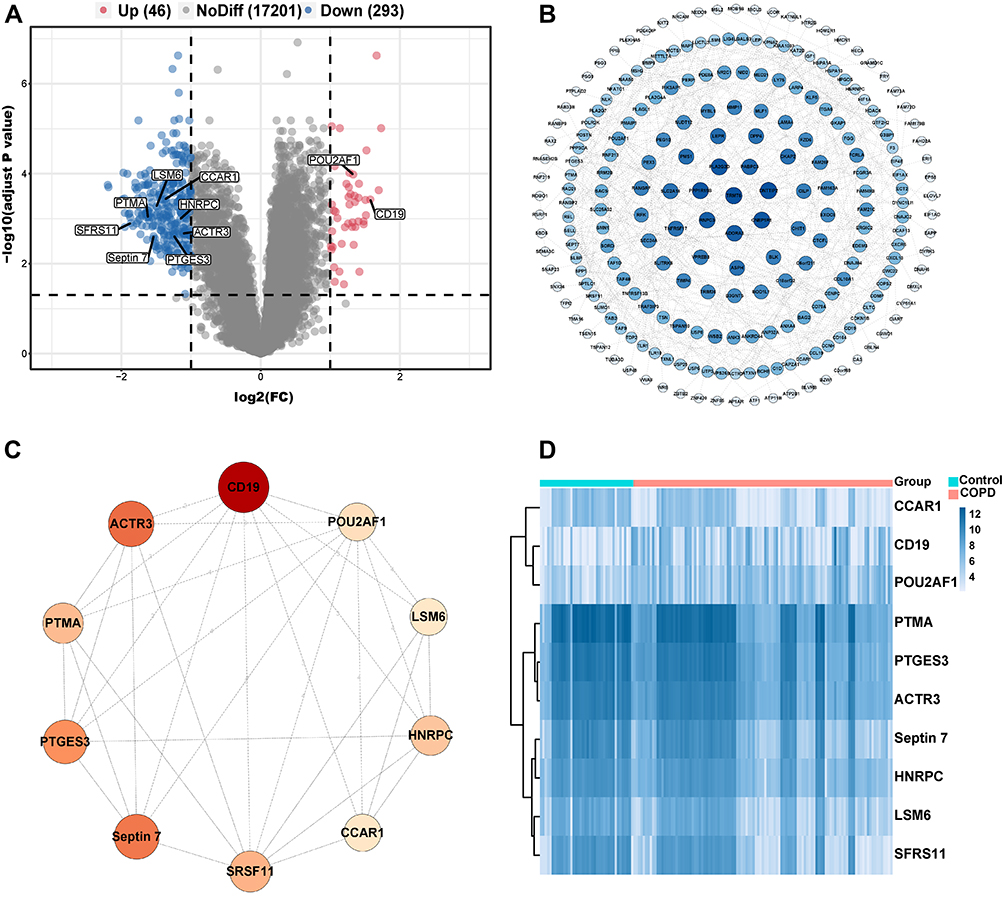 |
Figure 1 Identification of DEGs and hub genes in COPD. (A) Volcano plot of DEGs. Red dots represent relatively upregulated genes and blue dots represented downregulated genes. No significantly changed genes were marked as gray dots. (B) The PPI network of the DEGs visualized Cytoscape software. The bluer the color, the larger the topological coefficient. (C) Hub genes with the top 10 MCC were identified using the CytoHubba plugin. The redder the color, the larger the MCC. (D) Heatmap of the 10 hub genes. |
PPI Network Construction and Hub Genes Identification
To systematically analyze the key DEGs between the COPD group and control groups, a PPI network of DEGs was next constructed. The nodes corresponded to genes, and the edges represented the connections between genes. We identified 227 nodes and 482 edges among these DEGs and the nodes were evaluated in terms of their topological coefficients using Cytoscape (Figure 1B). The darker blue the hue, the larger the topological coefficient (Figure 1B). Then genes with the top 10 MCC values based on CytoHubba analysis were selected as hub genes (Figure 1C). The darker red the hue, the larger the MCC (Figure 1C). The expression of these hub genes is shown as a heatmap (Figure 1D).
Screening for Key Genes for COPD
To determine which hub genes have diagnostic significance for COPD patients, ROC analyses were conducted and the AUC was calculated. The results showed that the AUC of the ROC curves of these hub genes were 0.759, 0.750, 0.738, 0.733, 0.725, 0.715, 0.709, 0.709, 0.697, and 0.637 for CD19, POU2AF1, PTMA, LSM6, CCAR1, SFRS11, ACTR3, Septin7, PTGES3, and HNRPC, respectively (Figure 2). Then, correlation analysis between the top five genes and lung function indexes, and CT indexes of emphysema was performed. The lung function indexes included forced expiratory volume in 1 s (FEV1)/ forced vital capacity (FVC) and FEV1% of predicted (FEV1pred). The CT indexes of emphysema included LAA950 and Perc15. The results showed that the expression of CD19 and POU2AF1 was negatively correlated with FEV1pred, FEV1/FVC, Perc15 and positively correlated with LAA950 (Figure 3). The detailed results of correlation analysis are shown in Supplementary Material (Supplementary TableS2).
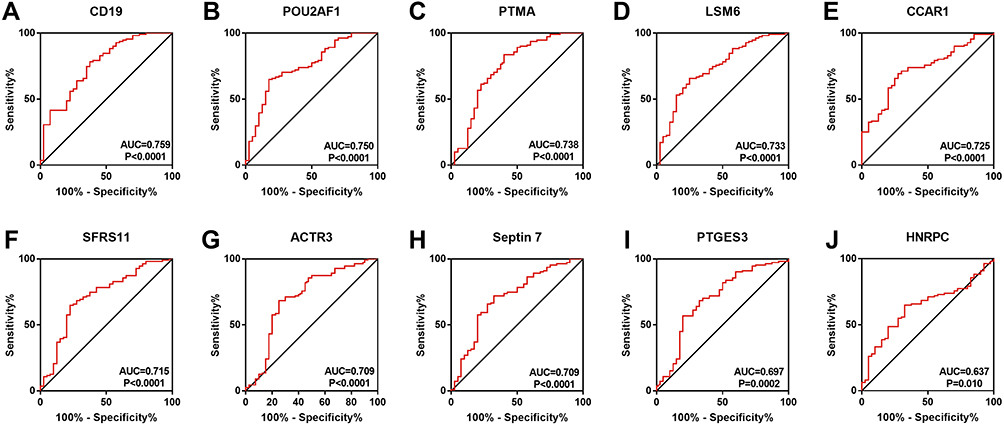 |
Figure 2 ROC curve of hub genes. The ROC curve of CD19 (A), POU2AF1 (B), PTMA (C), LSM6 (D), CCAR1 (E), SFRS11 (F), ACTR3 (G), Septin7 (F), PTGES3 (I), and HNRPC (J) were represented. |
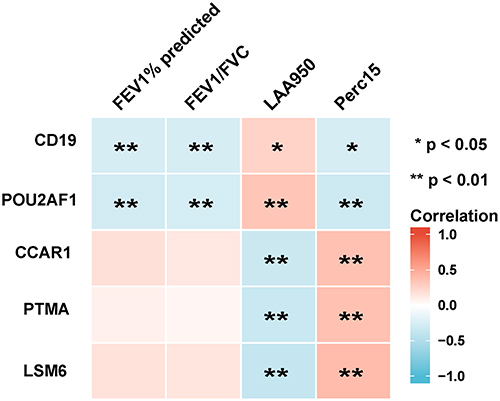 |
Figure 3 Analysis of the correlation between genes with lung function and CT indexes of emphysema. Blue represents a negative correlation; red represents a positive correlation. **P<0.01, *P<0.05. |
Identification and Functional Enrichment Analysis of DEGs in High- and Low- CD19 or POU2AF1 Expression Groups
All COPD patients in GSE76925 were next divided into high- and low-CD19 or POU2AF1 expression groups based on the median gene expression values of these genes. The median gene expression values of CD19 and POU2AF1 were 5.09 and 6.29, respectively. DEGs between high- and low-CD19 or POU2AF1 expression groups were next identified. The full DEGs list between high- and low- CD19 expression groups is shown in Supplementary Material (Supplementary File 5). POU2AF1 was upregulated in the high-CD19 expression group. We performed the GO-BP and KEGG pathway analyses to explore the biological functions and mechanisms of CD19 and POU2AF1. Figure 4A shows the findings of BP and KEGG pathways in the DEGs between high and low CD19 expression groups. Lymphocyte activation, positive regulation of cytosolic calcium ion concentration, B cell activation, mononuclear cell differentiation and B cell proliferation were the most enriched terms in BP (Figure 4A). The enriched term in KEGG were cytokine-cytokine receptor interaction, chemokine signaling pathway, hematopoietic cell lineage, Intestinal immune network for IgA production and B cell receptor signaling pathway (Figure 4A).
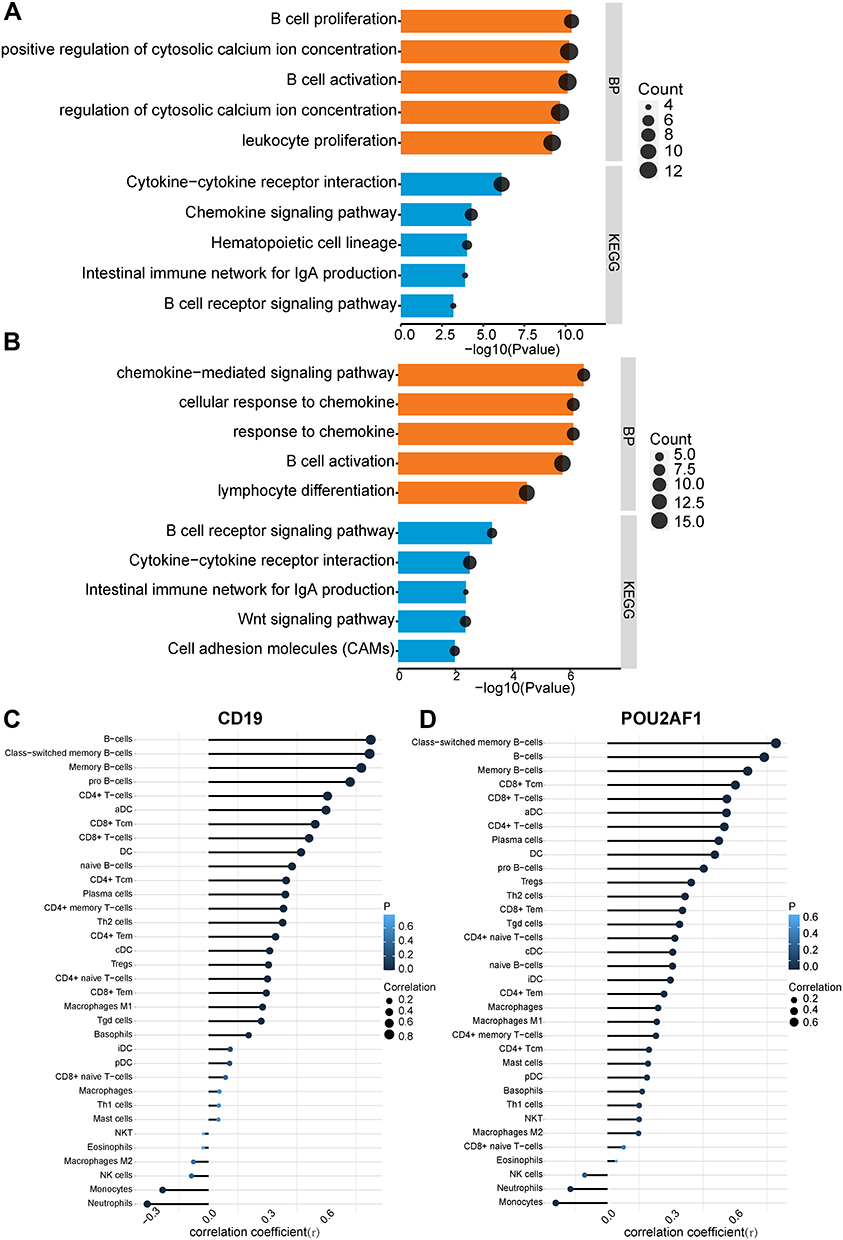 |
Figure 4 The enriched biological process of DEGs in high- and low- CD19 or POU2AF1 expression groups and immune correlation analysis in GSE76925. (A) GO-BP and KEGG pathway enrichment analysis of DEGs in high- and low- CD19 expression groups. (B) GO-BP and KEGG pathway enrichment analysis of DEGs in high- and low- POU2AF1 expression groups. The x-axis depicts the –log10 (P-value). The y-axis lists the enriched functional terms. (C) Correlation between CD19 and immune cells in COPD. (D) Correlation between POU2AF1 and immune cells in COPD. The size of the dots represented the strength of the correlation between genes and immune cells; the larger the dots, the stronger the correlation, and the smaller the dots, the weaker the correlation. The color of the dots represented the P-value, the blacker the color, the lower the P-value, and the bluer the color, the larger the P-value. |
The full DEGs list between high- and low- POU2AF1 expression groups is shown in Supplementary Material (Supplementary File 6). CD19 was upregulated in the high-POU2AF1 expression group. Figure 4B shows the findings of BP and KEGG pathways in the DEGs between high- and low- CD19 expression groups. In terms of GO-BPs, these DEGs were mainly enriched in chemokine−mediated signaling pathway, response to chemokine, cellular response to chemokine, B cell activation and lymphocyte activation (Figure 4B). The enriched term in KEGG were B cell receptor signaling pathway, cytokine-cytokine receptor interaction, intestinal immune network for IgA production, Wnt signaling pathway and cell adhesion molecules (CAMs) (Figure 4B). Most of the enriched terms were related to B-cell-associated terms in the high and low CD19 or POU2AF1 expression groups. The detailed results of GO analysis and KEGG pathway analysis are shown in Supplementary Material (Supplementary File 7).
Association of CD19 or POU2AF1 and Immune Cells
To further verify the relationship between key genes and immunity, we then investigated the association between key gene expression and immune cells. As we expected, significant positive associations were observed between the expression of CD19 and POU2AF1 and infiltration of the B cells (Figure 4C and D). The detailed results of immune correlation analysis are shown in Supplementary Material (Supplementary TableS3).
Validation of the Key Genes in GSE47460
In GSE47460, the ROC curve showed that CD19 and POU2AF1 also had good diagnostic efficacy for COPD (Figure 5A and B). Correlation analysis again confirmed that the expression of CD19 and POU2AF1 was negatively correlated with FEV1pred and positively correlated with LAA950 (Figure 5C). The detailed results of correlation analysis are shown in Supplementary Material (Supplementary TableS2). CD19 and POU2AF1 were significantly upregulated within lung samples from individuals with COPD and increased with disease severity in GSE47460 (Figure 5D and E). Similarly, DEGs between high and low CD19 or POU2AF1 expression groups in GSE47460 were also enriched in immune-associated terms, especially for B cell-associated terms (Figure 5F and G). Immune correlation analysis also showed that the expressions of CD19 and POU2AF1 were related to B cells (Figure 5H and I). The detailed results of immune correlation analysis in GSE47460 are shown in Supplementary Material (Supplementary Table S3).
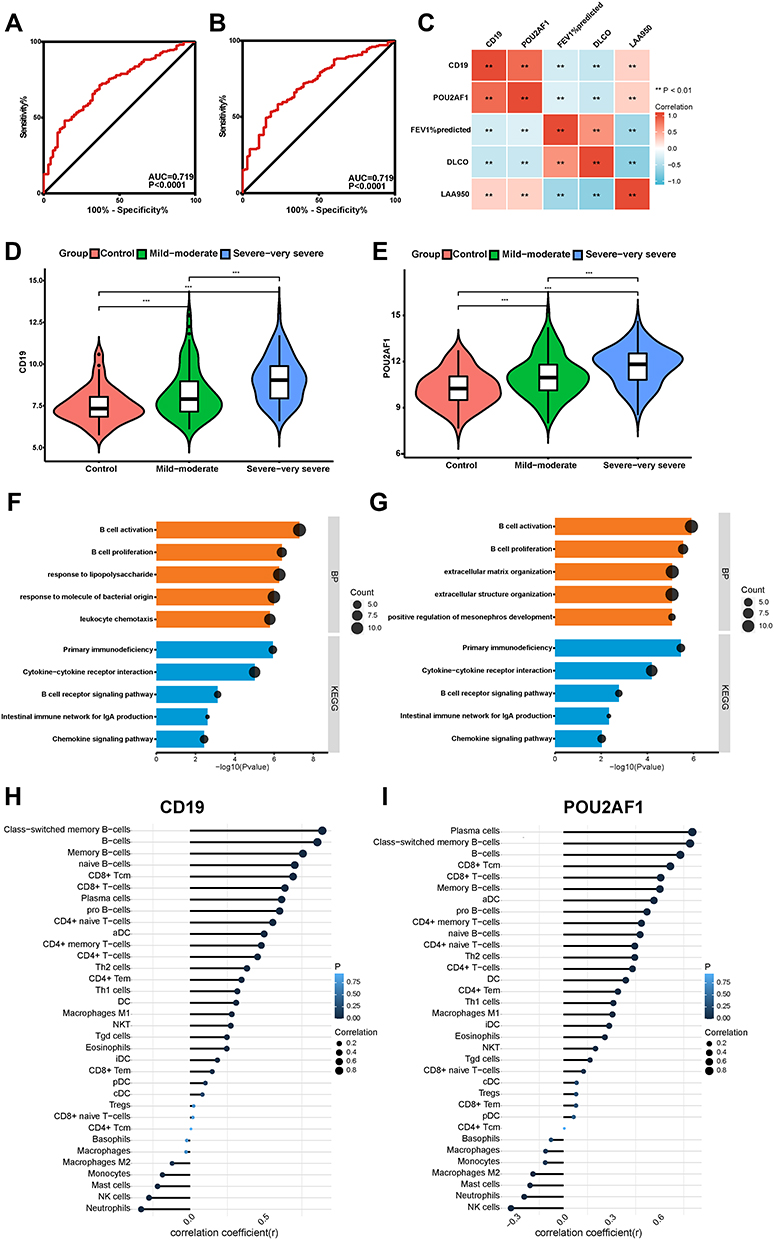 |
Figure 5 Performance of CD19 and POU2AF1 in validation sets (GSE47460). (A) ROC curve of CD19 for COPD. (B) ROC curve of POU2AF1 for COPD. (C) The correlation analysis between CD19 and POU2AF1 with lung function and CT indexes of emphysema. Blue represented a negative correlation; red represented a positive correlation. (D) The expression of CD19 in different disease severity of COPD. (E) The expression of POU2AF1 in different disease severity of COPD. (F) GO-BP and KEGG pathway enrichment analysis of DEGs in high- and low- CD19 expression groups. (G) GO-BP and KEGG pathway enrichment analysis of DEGs in high- and low- POU2AF1 expression groups. The x-axis depicts the –log10 (P-value). The y-axis lists the enriched functional terms. (H) Correlation between CD19 and immune cells in COPD. (I) Correlation between POU2AF1 and immune cells in COPD. The size of the dots represented the strength of the correlation between genes and immune cells; the larger the dots, the stronger the correlation, and the smaller the dots, the weaker the correlation. The color of the dots represented the P-value, the blacker the color, the lower the P-value, and the bluer the color, the larger the P-value. ***P<0.001, **P<0.01. |
Validation of the Key Genes in GSE76705
In the blood dataset GSE76705, the ROC curve showed that the diagnostic efficacy of CD19 and POU2AF1 in blood was worse than that in lung tissues from COPD patients (Figure 6A and B). Correlation analysis revealed that the expression of CD19 and POU2AF1 in blood was positively correlated with FEV1pred and FEV1/FVC (Figure 6C). The detailed results of correlation analysis are shown in Supplementary Material (Supplementary TableS2). The expression of CD19 and POU2AF1 in COPD patients was significantly decreased compared with controls (Figure 6D–E). Immune correlation analysis also showed that CD19 and POU2AF1 were related to B cells (Figure 6F–G). The detailed results of immune correlation analysis are shown in Supplementary Material (Supplementary Table S3).
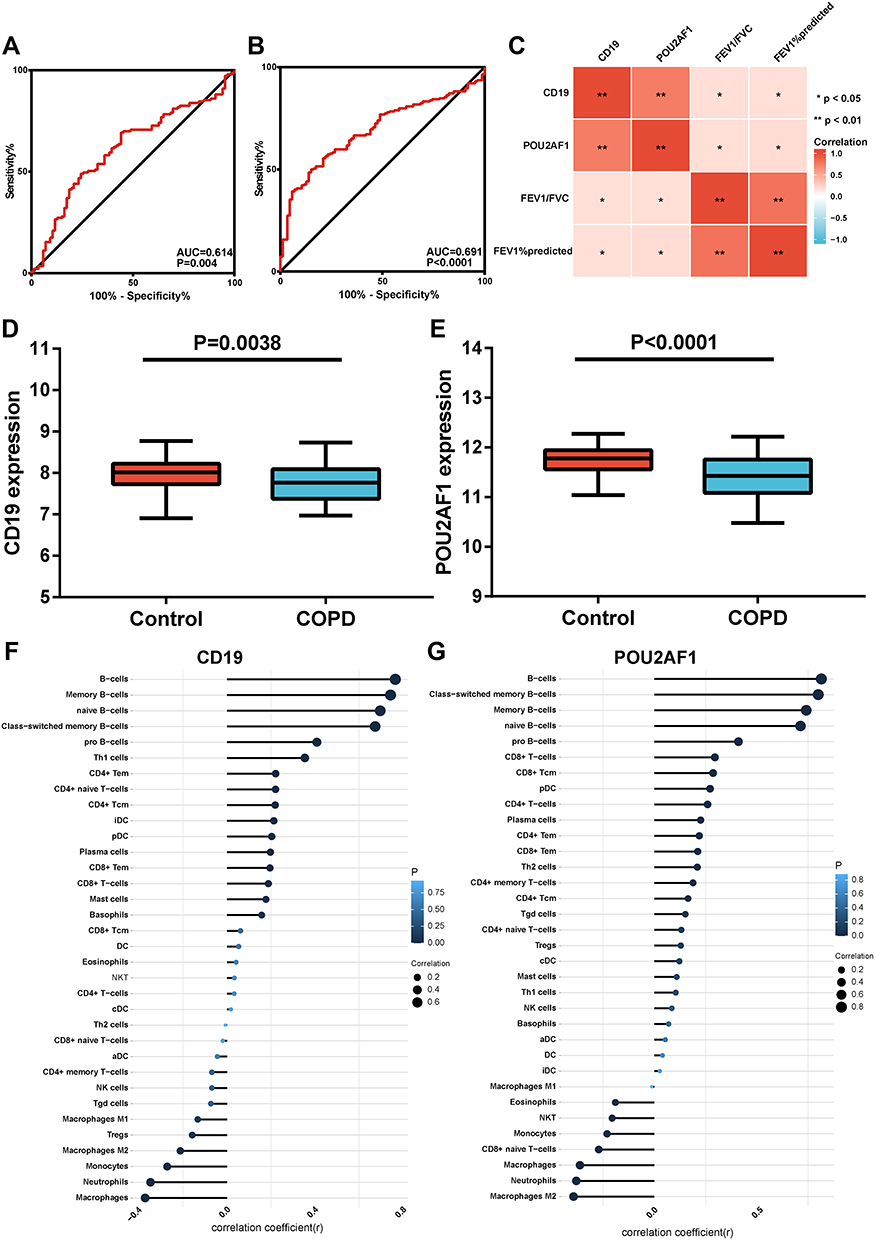 |
Figure 6 Performance of CD19 and POU2AF1 in validation sets (GSE76705). (A) ROC curve of CD19 for COPD. (B) ROC curve of POU2AF1 for COPD. (C) The correlation analysis between CD19 and POU2AF1 with lung function. Blue represented a negative correlation; red represented a positive correlation. **P<0.01, *P<0.05. (D) The expression of CD19 in COPD and control group. (E) The expression of POU2AF1 in COPD and control group. (F) Correlation between CD19 and immune cells in COPD. (G) Correlation between POU2AF1 and immune cells in COPD. The size of the dots represented the strength of the correlation between genes and immune cells; the larger the dots, the stronger the correlation, and the smaller the dots, the weaker the correlation. The color of the dots represented the P-value, the blacker the color, the lower the P-value, and the bluer the color, the larger the P-value. |
Validation of the Key Genes in Lung Tissues
To further verify the expression levels of key genes in COPD patients, we performed qRT-PCR to measure the mRNA levels of CD19 and POU2AF1 in lung tissues obtained from patients with COPD (n = 5) and non-COPD controls (n = 5). As shown in Figure 7A and B, the mRNA levels of CD19 and POU2AF1 were both significantly upregulated in the COPD group (P=0.016 and 0.008, respectively). Pulmonary lymphoid follicles (LF) are a key histopathological feature of advanced COPD. HE staining showed that many LFs were observable in the lung of COPD patients (Figure 7C). Immunohistochemistry showed that patients with COPD had a high expression of CD19 and POU2AF1. CD19 was highly expressed in the cytomembrane of B cells in the lymphoid follicles (Figure 7D). The POU2AF1 showed nuclear immunohistochemical expression in the lymphoid follicles in COPD patients (Figure 7E).
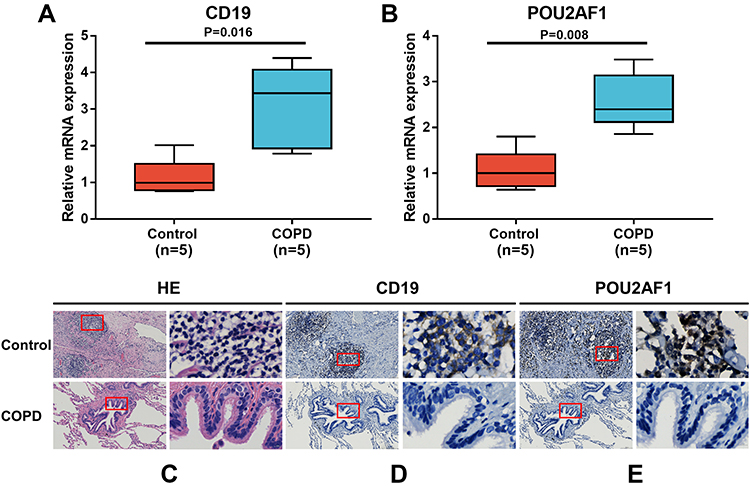 |
Figure 7 Expression of CD19 and POU2AF1 by qRT-PCR and immunohistochemistry. (A) The mRNA levels of CD19 in human lung tissues. (B) The mRNA levels of CD19 in human lung tissues. The mRNA levels of CD19 and POU2AF1 were normalized to β-actin. **P<0.01 compared with the control group. (C) HE staining in control and patients with COPD. (D) Immunohistochemical staining for CD19 in control and patients with COPD. (E) Immunohistochemical staining for POU2AF1 in control and patients with COPD. Positive protein staining appeared brown and nuclear staining appeared blue. Scale bar =100 μm, original magnification: ×50; scale bar=10 μm, original magnification: ×400. |
Discussion
In our study, we first identified that CD19 and POU2AF1 had a good diagnostic efficacy for COPD and were significantly correlated with lung function and CT indexes of emphysema. Enrichment analysis of DEGs in the high- and low-CD19 or POU2AF1 expression group demonstrated that CD19 and POU2AF1 may regulate the progression of emphysema in COPD through regulating the function of B cells. Moreover, immune correlation analysis showed that CD19 and POU2AF1 were significantly associated with B-cell subsets. The role of CD19 and POU2AF1 was well validated in the lung tissue (GSE47460) and blood (GSE76705) dataset. Finally, CD19 and POU2AF1 were both significantly upregulated in lung tissues of COPD at both the mRNA and protein levels. Therefore, this study demonstrated that CD19 and POU2AF1 were potential immune-associated biomarkers involved in the emphysema of COPD based on multiple microarray analyses. The effects of B-cell immunity should be taken into account when focusing on emphysema and disease progression in COPD.
We downloaded the COPD expression profile dataset from the GEO database and identified a total of 339 DEGs. A PPI network was constructed to determine the most significant hub genes, and 10 hub genes were selected for further analysis. A heatmap showed that the expression of CCAR1, PTMA, PTGES3, ACTR3, Septin 7, HNRPC, LSM6 and SFRS11 genes in some COPD patients was similar to that of a control group. Hence, we further analyzed the correlation among hub genes in COPD patients and found that CCAR1, PTMA, PTGES3, ACTR3, Septin 7, HNRPC, LSM6 and SFRS11 were significantly correlated with each other. Furthermore, we divided COPD patients into two clusters by unsupervised clustering analysis based on the expression of hub genes [see the Supplementary Material (Supplementary Figure S2)]. We found that the CT index of emphysema in patients in cluster 1 was significantly lower than that in cluster 2. LAA950 is widely used to quantitatively evaluate the degree of emphysema.10≤LAA950%<20 was mild emphysema; 20≤LAA950%<30 was moderate emphysema; LAA950%≥30 was severe emphysema.30,31 It showed that the COPD patients in cluster 1 were mainly mild and moderate emphysema, which in cluster 2 were mainly severe emphysema, suggesting that these genes have a role in distinguishing the severity of emphysema [see the Supplementary Material (Supplementary TableS4)]. However, the efficacy of these genes in differentiating non-emphysema and mild and moderate-emphysema needs to be further explored. Moreover, the AUC of the 10 hub genes was further analyzed. CD19, POU2AF1, PTMA, LSM6, and CCAR1 were ranked as the top five genes, suggesting that these genes may be promising targets for the diagnosis of COPD. The degree of emphysema is an independent predictor of the severity of COPD. CT scans could detect emphysema in patients who do not meet the spirometry standards of COPD in 20% of smokers.2,32 Lung function combined with chest CT may be better for assessing the disease progression and identifying subjects at risk of progression. In our study, the correlation analysis revealed that CD19 and POU2AF1 were significantly associated with lung function and CT indexes of emphysema. Consistent with previous research, CD19 and POU2AF1 were significantly upregulated and may be key genes in emphysema related to COPD.14,19,33
CD19 is the major stimulatory co-receptor of B cells. It is required for the normal development of subsets of B cells, and for the response of mature B cells to antigens.34 As shown in other studies, healthy and COPD smokers had a higher percentage of CD19+ lymphocytes than healthy and COPD nonsmokers.35 Bosken et al demonstrated that there were significantly more CD19+ lymphocytes in the airway wall in patients with airway obstruction than those without airway obstruction.36 POU2AF1 was mainly expressed in B cells and regulates the development and homeostasis of B cells.16,17 John E McDonough demonstrated that the expression of POU2AF1 was increased in B lymphocytes in the lungs of idiopathic pulmonary fibrosis and the degree of lung fibrosis in POU2AF1-knockout mice was significantly mitigated.37 Faner et al38 found that POU2AF1 was upregulated in patients with emphysema other than patients with bronchiolitis, and its expression was correlated with the severity of emphysema. The square root wall area of a hypothetical 10 mm internal perimeter airway (Pi10) is a common marker for airway disease in CT.39 In our study, we also found no correlation between POU2AF1 and Pi10, suggesting that POU2AF1 may be mainly involved in emphysema in COPD patients. Furthermore, the expression of CD19 and POU2AF1 was increased with the increase of disease severity in GSE47460, suggesting these two genes may also serve as potential biomarkers for the clinical classification of COPD. The latest GOLD2022 guidelines updated the point that the measurement of carbon monoxide diffusing capacity (DLCO) is also helpful for the detection of emphysema. Kahnert found that DLCO had a good predictive ability for emphysema, and the reduction of DLCO had a significant correlation with emphysema.40 In smokers without airflow limitation, DLCO values<80% predicted (as a marker of emphysema) signaled an increased risk for developing COPD over time.41,42 In the validation set GSE47460, we found that CD19 and POU2AF1 were negatively correlated with DLCO, which further validated the potential role of CD19 and POU2AF1 in emphysema. The combination of biomarkers, CT index and lung function may better predict the risk of COPD progression.
To explore the potential mechanism of CD19 and POU2AF1 in COPD, we divided COPD patients into high- and low- CD19 or POU2AF1 expression groups. The DEGs between the two groups were significantly enriched in the B cell-associated pathway. CD19 facilitated B cell development and activation by serving as a transmembrane adaptor that improves complement-dependent and complement-independent BCR signaling.43 The crosslinking of CD19 with BCR enhanced both B-cell Ca2+ signaling as well as proliferation.44 The germinal center (GC) defect of CD19−/− mice may also be explained by impaired BCR signaling during B-cell activation.44 Ca2+ influx was absent or severely delayed in CD19-deficient cells.45 This was consistent with our enrichment results in high- and low- CD19 expression groups. POU2AF1-knockout mice show impaired antigen-specific Ig production due to a decrease in transitional B cells, the complete absence of GC formation, and a lack of marginal zone B cells.46 In POU2AF1 deficient mice, the immature B cells, transitional B cells and recirculating B cells in bone marrow decrease significantly. The B2 cell population in the spleen also decrease significantly, especially the B cells in GC.46 Currently, there is no relevant study on the effect of lung B cells in POU2AF1 deficient mice. Functional enrichment analysis revealed that CD19 and POU2AF1 might influence IgA production. In studies of the functional state of B cells in COPD, the bronchial epithelium could induce B cells into plasma cells that produce IgA via interleukin 6 (IL-6)/IL-6 receptor, calcium modulator interactor and B-cell activating factor (BAFF) in COPD.47 It was shown that IgM+ B cells could be transformed into IgA+ B cells via continuous stimulation of colonized bacterium in the lung in other studies, which could lead to increased IgA secretion in serious COPD patients.48 The GOLD guideline pointed out that IgA deficiency was closely related to airway bacterial translocation, inflammatory damage and remodeling, which could not be changed even after smoking cessation. These results suggested that CD19 and POU2AF1 were implicated in B-cell functional status and emerged as key actors in adaptive immunity and inflammation in COPD.
Immune infiltration analysis was performed to detect the correlation between B cells and CD19 and POU2AF1. As expected, CD19 and POU2AF1 were both significantly positively correlated with B-cell subsets. Several recent studies had shown that B cells become overactivated in emphysema-predominant COPD and are mainly characterized by an increase in the number of naïve, memory and antibody-producing B cells.49 In agreement with the previous results, our analysis of immune infiltration also revealed the abundance of B-cell subsets was higher in the lungs of COPD patients [see the Supplementary Material (Supplementary FigureS3)]. The pathogenesis of COPD is divided into three stages: innate immunity stage, T lymphocyte proliferation stage and adaptive immunity stage.55 B cells are mainly involved in the adaptive immunity stage, which is closely related to the development of COPD to the most serious disease stage (GOLD3 and GOLD4). On the one hand, activated B cells released IL-10 to activate the release of MMP-12 from macrophages, which in turn degrades extracellular matrix (ECM) proteins, leading to the development of emphysema and the production of matrix fragments.50 On the other hand, the activated B cells proliferated and matured into plasma cells to release antibodies against bacteria and/or autoantibodies against lung components. Finally, autoantibodies bound to target antigens and induced complement activation to recruit and activate inflammatory cells and induce immune complex-mediated lung injury.51 Our results provided new evidence for a B cell-associated immune mechanism of COPD.
Undoubtedly, this was because blood is a convenient and easily accessible tissue. To this end, public blood datasets (GSE76705) were also downloaded, and the expression of CD19 and POU2AF1 in blood was found to be downregulated and positively correlated with FEV1%pred, which was opposite from the results of lung tissue. Similarly, Obeidat13 analyzed the expression of emphysema-related genes in different samples from COPD patients and found that while it was clear that the lung gene expression signature related to lung function was not fully recapitulated in blood cells, there was a sizable overlap of the lung tissue signature in blood samples. For most of these associations, the direction of effect was in the opposite direction. The reasons for the opposite results in blood remained unclear. It was possible that as B cells were recruited into lung tissue to form LFs during inflammation, their numbers in the peripheral circulation decreased. Our analysis of immune infiltration also revealed that the abundance of B cell immune infiltration was lower in the blood of COPD, but higher in the lung of COPD patients [see the Supplementary Material (Supplementary Figure S3)]. Moreover, B cells are expressed as the percentage of total lymphocytes, we could not exclude that the decreased percentage of B cells in COPD patients might be related to an increased percentage of CD8+ T cells, which was already demonstrated in COPD previously.35,52 Overall, this suggested that the role of CD19 and POU2AF1 observed in the lung was reproduced in the peripheral blood.
The expression of CD19 and POU2AF1 in COPD was also verified by qRT-PCR (mRNA expression) and immunohistochemistry (protein expression). Consistent with previous study,53,54 characteristic LFs were found in the lungs of COPD samples. The results of immunohistochemistry demonstrated that CD19 and POU2AF1 were markedly upregulated in lung tissues from patients with COPD compared with non-COPD tissues, especially in terms of lymphatic follicles. LFs in patients with COPD resulted from lymphoid neogenesis and belong to the inducible Bronchus-Associated Lymphoid Tissue (iBALT).55 In patients with COPD, B cell-rich lymphoid follicles are increased and are most strongly correlated with the emphysematous changes in the lung.51 LAA950 and the percentage of f FEV1pred were both associated with the number of LFs in the lungs of COPD.49
COPD is a complex chronic airway inflammatory disease, and patients vary greatly and unpredictably in terms of disease progression and prognosis.56,57 In our study, we identified that CD19 and POU2AF1 were potential immune-related biomarkers involved in the emphysema of COPD, which might be used to assess disease progression in combination with lung function and CT. Some limitations in the study, however, have to be acknowledged. First, targeting CD19 proposed as a therapeutic approach in a variety of inflammatory and autoimmune diseases. The effect of immunotherapy in the treatment of emphysema is also currently being studied. As immune-related genes, whether CD19 and POU2AF1 can guide the selection and predict the efficacy of immunotherapy remains to be further studied. Second, we had only validated the expression levels of CD19 and POU2AF1 in human lung tissues from COPD patients, and more detailed studies in vivo and in vitro on the underlying mechanisms are crucial. Third, single-cell genome sequencing could provide a comprehensive functional landscape of individual B cells. Fourth, changes in gene expression might not necessarily translate into changes into protein levels. Fifth, it has been found that corticosteroid use can downregulate immunoglobulin encoding genes and inhibit B cell proliferation and immunoglobulin production in COPD patients.58 Due to limited clinical data, we do not know whether these patients received regular treatments, especially if they had a history of corticosteroid use, which likely reduced the power of the present analysis. Sixth, the increase of B-cell infiltration and the number and size of B-cell-rich lymphoid follicles in COPD patients correlated with COPD severity,59 and the lymphoid follicles in patients with severe COPD were larger, more numerous, and contained more BAFF+ B cells than in patients with mild to moderate COPD.60 The lung specimens of COPD patients were difficult to collect, and most severe patients could not tolerate surgery. The lung samples we collected were mostly from moderate patients and the sample size was small. Seventh, exposure to cigarette smoke (CS) was the most common risk factor for the development of COPD and can trigger an autoimmune response. Willemse found that smoking cessation did not affect the disease progression of some patients.61 After smoking cessation, patients’ lungs continue to have inflammation, and patients have been shown to have LFs in the small airways and surrounding tissues of the lung parenchyma.53,54,62 Sullivan found that the activation of the B-cell compartment was significantly correlated with the extent of emphysema in smokers without airflow limitation. This suggested that B cell adaptive immune responses are increased before lung function starts declining. In human airway epithelial cells, overexpression of POU2AF1 mitigates the inhibition of host defense genes induced by smoking.63 In this study, all subjects were current smokers or former patients. However, the duration of smoking cessation can influence the progression of emphysema, and we could not obtain data on smoking cessation years. The role of smoking in CD19 and POU2AF1 needs to be explored further.
Conclusion
In conclusion, this study demonstrated that CD19 and POU2AF1 were key B cell-related genes involved in the emphysema of COPD, and contributed to the diagnosis of COPD. CD19 and POU2AF1 may participate in COPD by serving as key regulators of B-cell homeostasis. The key role of B cell-related immune processes in the pathological process of COPD deserves further study.
Abbreviations
COPD, Chronic obstructive pulmonary disease; GEO, Gene Expression Omnibus; DEGs, differently expressed genes; PPI, protein–protein interaction; ROC, receiver operating characteristic; CT, computed tomography; qRT-PCR, quantitative real-time polymerase chain reaction; LAA950, the low attenuation area percentage at −950 Hounsfield units; Perc15, lung attenuation at 15th percentile; LF, lymphoid follicles; BCR, B cell receptor; FEV1pred, the percentage of forced expiratory volume in 1s of predicted; NCBI, National Center for Biotechnology Information; MCC, maximum correlation criterion; AUC, area under curve; GO, Gene Ontology; BP, Biological processes; KEGG, Kyoto Encyclopedia of Genes and Genomes; HE, hematoxylin-eosin; DAB, diaminobenzidine; FVC, forced vital capacity; FEV1, forced expiratory volume in 1 s; CAMs, cell adhesion molecules; Pi10, The square root wall area of a hypothetical 10mm internal perimeter airway; DLCO, carbon monoxide diffusing capacity; GC, germinal center; IL-6, interleukin 6; BAFF, B-Cell activating factor; iBALT, inducible Bronchus-Associated Lymphoid Tissue; ECM, extracellular matrix.
Data Sharing Statement
The datasets analyzed during the current study available from the corresponding author on reasonable request.
Ethics Approval and Informed Consent
This study complied with the Declaration of Helsinki. All subjects signed the informed consent and the study was approved by the ethics committee of Anhui Medical University. NO. 20180388.
Acknowledgments
The authors would like to sincerely thank the thoracic surgery department, First Affiliated Hospital of Anhui Medical University.
Author Contributions
All authors made a significant contribution to the work. Guang-He Fei and Da-Wei Zhang designed the study. Da-Wei Zhang, Jing-Jing Ye and Ying Sun drafted the paper. Guang-He Fei, Da-Wei Zhang, Shuang-Ji and Ying Sun did the analysis. Yuan-Yuan Wei did the qRT-PCR. Jing-Jing Ye, Shuang-Ji and Jia-Ying Kang collected the clinical samples. All authors reviewed and agreed on all versions of the article before submission, during revision, the final version accepted for publication, and any significant changes introduced at the proofing stage. All authors read and approved the final manuscript and agreed the article was submitted to this journal. All authors had full access to all of the data in the study and take responsibility for the integrity of the data and the accuracy of the data analysis.
Funding
This work was supported by the National Science Foundation of China (No. 81870036) and subject construction project of Anhui Medical University (NO.2021lcxk001).
Disclosure
The authors declare that they have no competing interests.
References
1. GOLD. Global strategy for prevention, diagnosis and management of COPD: 2022 Report. [homepage on the Internet]; 2021. Available from: https://goldcopd.org/2022-gold-reports-2/.
2. Pompe E, Moore CM, Mohamed Hoesein FAA, et al. Progression of emphysema and small airways disease in cigarette smokers. Chronic Obstr Pulm Dis. 2021;8(2):198–212. doi:10.15326/jcopdf.2020.0140
3. Miravitlles M, Soler-Cataluña JJ, Calle M, et al. [Spanish COPD Guidelines (GesEPOC): pharmacological treatment of stable COPD]. Atencion primaria. 2012;44(7):425–437. Spanish. doi:10.1016/j.aprim.2012.04.005
4. Tanabe N, Muro S, Hirai T, et al. Impact of exacerbations on emphysema progression in chronic obstructive pulmonary disease. Am J Respir Crit Care Med. 2011;183(12):1653–1659. doi:10.1164/rccm.201009-1535OC
5. Izquierdo-Alonso JL, Rodriguez-Gonzálezmoro JM, de Lucas-ramos P, et al. Prevalence and characteristics of three clinical phenotypes of chronic obstructive pulmonary disease (COPD). Respir Med. 2013;107(5):724–731. doi:10.1016/j.rmed.2013.01.001
6. Mohamed Hoesein FA, de Hoop B, Zanen P, et al. CT-quantified emphysema in male heavy smokers: association with lung function decline. Thorax. 2011;66(9):782–787. doi:10.1136/thx.2010.145995
7. Wille MM, Thomsen LH, Petersen J, et al. Visual assessment of early emphysema and interstitial abnormalities on CT is useful in lung cancer risk analysis. Eur Radiol. 2016;26(2):487–494. doi:10.1007/s00330-015-3826-9
8. Litmanovich D, Boiselle PM, Bankier AA. CT of pulmonary emphysema–current status, challenges, and future directions. Eur Radiol. 2009;19(3):537–551. doi:10.1007/s00330-008-1186-4
9. Timmins SC, Diba C, Farrow CE, et al. The relationship between airflow obstruction, emphysema extent, and small airways function in COPD. Chest. 2012;142(2):312–319. doi:10.1378/chest.11-2169
10. Castaldi PJ, San José Estépar R, Mendoza CS, et al. Distinct quantitative computed tomography emphysema patterns are associated with physiology and function in smokers. Am J Respir Crit Care Med. 2013;188(9):1083–1090. doi:10.1164/rccm.201305-0873OC
11. Chung KF, Adcock IM. Multifaceted mechanisms in COPD: inflammation, immunity, and tissue repair and destruction. Eur Respir J. 2008;31(6):1334–1356. doi:10.1183/09031936.00018908
12. Petersen H, Vazquez Guillamet R, Meek P, Sood A, Tesfaigzi Y. Early endotyping: a chance for intervention in chronic obstructive pulmonary disease. Am J Respir Cell Mol Biol. 2018;59(1):13–17. doi:10.1165/rcmb.2018-0002PS
13. Obeidat M, Nie Y, Fishbane N, et al. Integrative genomics of emphysema-associated genes reveals potential disease biomarkers. Am J Respir Cell Mol Biol. 2017;57(4):411–418. doi:10.1165/rcmb.2016-0284OC
14. Zuo Q, Wang Y, Yang D, et al. Identification of hub genes and key pathways in the emphysema phenotype of COPD. Aging. 2021;13(4):5120–5135. doi:10.18632/aging.202432
15. Martin AW. Chapter 6 - Immunohistology of Non-Hodgkin Lymphoma. In: Dabbs DJ, editor. Diagnostic Immunohistochemistry.
16. Luo Y, Roeder RG. Cloning, functional characterization, and mechanism of action of the B-cell-specific transcriptional coactivator OCA-B. Mol Cell Biol. 1995;15(8):4115–4124. doi:10.1128/MCB.15.8.4115
17. Strubin M, Newell JW, Matthias P. OBF-1, a novel B cell-specific coactivator that stimulates immunoglobulin promoter activity through association with octamer-binding proteins. Cell. 1995;80(3):497–506. doi:10.1016/0092-8674(95)90500-6
18. Barrett T, Wilhite SE, Ledoux P, et al. NCBI GEO: archive for functional genomics data sets–update. Nucleic Acids Res. 2013;41(Database issue):D991–995. doi:10.1093/nar/gks1193
19. Morrow JD, Zhou X, Lao T, et al. Functional interactors of three genome-wide association study genes are differentially expressed in severe chronic obstructive pulmonary disease lung tissue. Sci Rep. 2017;7:44232. doi:10.1038/srep44232
20. Tan J, Tedrow JR, Dutta JA, et al. Expression of RXFP1 is decreased in idiopathic pulmonary fibrosis. implications for relaxin-based therapies. Am J Respir Crit Care Med. 2016;194(11):1392–1402. doi:10.1164/rccm.201509-1865OC
21. Chang Y, Glass K, Liu YY, et al. COPD subtypes identified by network-based clustering of blood gene expression. Genomics. 2016;107(2–3):51–58. doi:10.1016/j.ygeno.2016.01.004
22. Ritchie ME, Phipson B, Wu D, et al. limma powers differential expression analyses for RNA-sequencing and microarray studies. Nucleic Acids Res. 2015;43(7):e47. doi:10.1093/nar/gkv007
23. Szklarczyk D, Gable AL, Lyon D, et al. STRING v11: protein-protein association networks with increased coverage, supporting functional discovery in genome-wide experimental datasets. Nucleic Acids Res. 2019;47(D1):D607–d613. doi:10.1093/nar/gky1131
24. Shannon P, Markiel A, Ozier O, et al. Cytoscape: a software environment for integrated models of biomolecular interaction networks. Genome Res. 2003;13(11):2498–2504. doi:10.1101/gr.1239303
25. Chin CH, Chen SH, Wu HH, Ho CW, Ko MT, Lin CY. cytoHubba: identifying hub objects and sub-networks from complex interactome. BMC Syst Biol. 2014;8 Suppl 4(Suppl 4):S11. doi:10.1186/1752-0509-8-S4-S11
26. Yu G, Wang LG, Han Y, He QY. clusterProfiler: an R package for comparing biological themes among gene clusters. Omics. 2012;16(5):284–287. doi:10.1089/omi.2011.0118
27. Luo W, Brouwer C. Pathview: an R/Bioconductor package for pathway-based data integration and visualization. Bioinformatics. 2013;29(14):1830–1831. doi:10.1093/bioinformatics/btt285
28. Aran D, Hu Z, Butte AJ. xCell: digitally portraying the tissue cellular heterogeneity landscape. Genome Biol. 2017;18(1):220. doi:10.1186/s13059-017-1349-1
29. Zhu J, Wang F, Feng X, Li B, Ma L, Zhang J. Family with sequence similarity 13 member A mediates TGF-β1-induced EMT in small airway epithelium of patients with chronic obstructive pulmonary disease. Respir Res. 2021;22(1):192. doi:10.1186/s12931-021-01783-z
30. Müller NL, Staples CA, Miller RR, Abboud RT. “Density mask”. An objective method to quantitate emphysema using computed tomography. Chest. 1988;94(4):782–787. doi:10.1378/chest.94.4.782
31. Chubachi S, Nakamura H, Sasaki M, et al. Polymorphism of LRP5 gene and emphysema severity are associated with osteoporosis in Japanese patients with or at risk for COPD. Respirology. 2015;20(2):286–295. doi:10.1111/resp.12429
32. Woodruff PG, Barr RG, Bleecker E, et al. Clinical significance of symptoms in smokers with preserved pulmonary function. N Engl J Med. 2016;374(19):1811–1821. doi:10.1056/NEJMoa1505971
33. Qin J, Yang T, Zeng N, et al. Differential coexpression networks in bronchiolitis and emphysema phenotypes reveal heterogeneous mechanisms of chronic obstructive pulmonary disease. J Cell Mol Med. 2019;23(10):6989–6999. doi:10.1111/jcmm.14585
34. Nitschke L, Fearon DT. CHAPTER 12 - regulation of antigen receptor signaling by the co-receptors, CD19 and CD22. In: Honjo T, Alt FW, Neuberger MS, editors. Molecular Biology of B Cells. Burlington: Academic Press; 2004:171–186.
35. de Jong JW, van der Belt-gritter B, Koëter GH, Postma DS. Peripheral blood lymphocyte cell subsets in subjects with chronic obstructive pulmonary disease: association with smoking, IgE and lung function. Respir Med. 1997;91(2):67–76. doi:10.1016/S0954-6111(97)90070-6
36. Bosken CH, Hards J, Gatter K, Hogg JC. Characterization of the inflammatory reaction in the peripheral airways of cigarette smokers using immunocytochemistry. Am Rev Respir Dis. 1992;145(4 Pt 1):911–917. doi:10.1164/ajrccm/145.4_Pt_1.911
37. McDonough JE, Ahangari F, Li Q, et al. Transcriptional regulatory model of fibrosis progression in the human lung. JCI Insight. 2019;4(22). doi:10.1172/jci.insight.131597
38. Faner R, Cruz T, Casserras T, et al. Network analysis of lung transcriptomics reveals a Distinct B-cell signature in emphysema. Am J Respir Crit Care Med. 2016;193(11):1242–1253. doi:10.1164/rccm.201507-1311OC
39. Nakano Y, Wong JC, de Jong PA, et al. The prediction of small airway dimensions using computed tomography. Am J Respir Crit Care Med. 2005;171(2):142–146. doi:10.1164/rccm.200407-874OC
40. Kahnert K, Jobst B, Biertz F, et al. Relationship of spirometric, body plethysmographic, and diffusing capacity parameters to emphysema scores derived from CT scans. Chron Respir Dis. 2019;16:1479972318775423. doi:10.1177/1479972318775423
41. Balasubramanian A, MacIntyre NR, Henderson RJ, et al. Diffusing capacity of carbon monoxide in assessment of COPD. Chest. 2019;156(6):1111–1119. doi:10.1016/j.chest.2019.06.035
42. De-torres JP, O’Donnell DE, Marín JM, et al. Clinical and prognostic impact of low diffusing capacity for carbon monoxide values in patients with global initiative for obstructive lung disease I COPD. Chest. 2021;160(3):872–878. doi:10.1016/j.chest.2021.04.033
43. Engels N, Wienands J. Signal transduction by the B cell antigen receptor. In: Ratcliffe MJH, editor. Encyclopedia of Immunobiology. Oxford: Academic Press; 2016:44–50.
44. Reth M, Nitschke L, Hikida M, Kurosaki T. Chapter 10 - structure and signaling function of the B-Cell antigen receptor and its coreceptors. In: Alt FW, Honjo T, Radbruch A, Reth M, editors. Molecular Biology of B Cells (Second Edition). London: Academic Press; 2015:151–170.
45. Yong PFK, Thaventhiran JED, Grimbacher B. Chapter 2 - “A Rose is a Rose is a Rose,” but CVID is Not CVID: common Variable Immune Deficiency (CVID), What do we Know in 2011? In: Alt FW, editor. Advances in Immunology. Vol. 111. Academic Press; 2011:47–107.
46. Cornelia BTW. BOB.1/OBF.1 - A critical regulator of B cell function. Curr Immunol Rev. 2006;2(1):3–12.
47. Ladjemi MZ, Lecocq M, Weynand B, et al. Increased IgA production by B-cells in COPD via lung epithelial interleukin-6 and TACI pathways. Eur Respir J. 2015;45(4):980–993. doi:10.1183/09031936.00063914
48. Curtis JL, Cells B. Caught in the act: class switching to IgA in lung lymphoid follicles in chronic obstructive pulmonary disease. Am J Respir Crit Care Med. 2019;199(5):548–550. doi:10.1164/rccm.201810-1907ED
49. Sullivan JL, Bagevalu B, Glass C, et al. B cell-adaptive immune profile in emphysema-predominant chronic obstructive pulmonary disease. Am J Respir Crit Care Med. 2019;200(11):1434–1439. doi:10.1164/rccm.201903-0632LE
50. John-Schuster G, Hager K, Conlon TM, et al. Cigarette smoke-induced iBALT mediates macrophage activation in a B cell-dependent manner in COPD. Am J Physiol Lung Cell Mol Physiol. 2014;307(9):L692–706. doi:10.1152/ajplung.00092.2014
51. Polverino F, Seys LJ, Bracke KR, Owen CA. B cells in chronic obstructive pulmonary disease: moving to center stage. Am J Physiol Lung Cell Mol Physiol. 2016;311(4):L687–l695. doi:10.1152/ajplung.00304.2016
52. Domagała-Kulawik J, Hoser G, Dabrowska M, Chazan R. Increased proportion of Fas positive CD8+ cells in peripheral blood of patients with COPD. Respir Med. 2007;101(6):1338–1343. doi:10.1016/j.rmed.2006.10.004
53. Brusselle GG, Demoor T, Bracke KR, Brandsma CA, Timens W. Lymphoid follicles in (very) severe COPD: beneficial or harmful? Eur Respir J. 2009;34(1):219–230. doi:10.1183/09031936.00150208
54. Hogg JC, Chu F, Utokaparch S, et al. The nature of small-airway obstruction in chronic obstructive pulmonary disease. N Engl J Med. 2004;350(26):2645–2653. doi:10.1056/NEJMoa032158
55. Brusselle GG, Joos GF, Bracke KR. New insights into the immunology of chronic obstructive pulmonary disease. Lancet. 2011;378(9795):1015–1026. doi:10.1016/S0140-6736(11)60988-4
56. Koo HK, Hong Y, Lim MN, Yim JJ, Kim WJ. Relationship between plasma matrix metalloproteinase levels, pulmonary function, bronchodilator response, and emphysema severity. Int J Chron Obstruct Pulmon Dis. 2016;11:1129–1137. doi:10.2147/COPD.S103281
57. Agusti A, Calverley PM, Celli B, et al. Characterisation of COPD heterogeneity in the ECLIPSE cohort. Respir Res. 2010;11(1):122. doi:10.1186/1465-9921-11-122
58. Lee J, Machin M, Russell KE, et al. Corticosteroid modulation of immunoglobulin expression and B-cell function in COPD. FASEB j. 2016;30(5):2014–2026. doi:10.1096/fj.201500135
59. Ladjemi MZ, Martin C, Lecocq M, et al. Increased IgA expression in lung lymphoid follicles in severe chronic obstructive pulmonary disease. Am J Respir Crit Care Med. 2019;199(5):592–602. doi:10.1164/rccm.201802-0352OC
60. Polverino F, Cosio BG, Pons J, et al. B cell-activating factor. an orchestrator of lymphoid follicles in severe chronic obstructive pulmonary disease. Am J Respir Crit Care Med. 2015;192(6):695–705. doi:10.1164/rccm.201501-0107OC
61. Yadava K, Bollyky P, Lawson MA. The formation and function of tertiary lymphoid follicles in chronic pulmonary inflammation. Immunology. 2016;149(3):262–269. doi:10.1111/imm.12649
62. Seys LJ, Verhamme FM, Schinwald A, et al. Role of B cell-activating factor in chronic obstructive pulmonary disease. Am J Respir Crit Care Med. 2015;192(6):706–718. doi:10.1164/rccm.201501-0103OC
63. Zhou H, Brekman A, Zuo W-L, et al. POU2AF1 functions in the human airway epithelium to regulate expression of host defense genes. J Immunol. 2016;196(7):3159–3167. doi:10.4049/jimmunol.1502400
 © 2022 The Author(s). This work is published and licensed by Dove Medical Press Limited. The full terms of this license are available at https://www.dovepress.com/terms.php and incorporate the Creative Commons Attribution - Non Commercial (unported, v3.0) License.
By accessing the work you hereby accept the Terms. Non-commercial uses of the work are permitted without any further permission from Dove Medical Press Limited, provided the work is properly attributed. For permission for commercial use of this work, please see paragraphs 4.2 and 5 of our Terms.
© 2022 The Author(s). This work is published and licensed by Dove Medical Press Limited. The full terms of this license are available at https://www.dovepress.com/terms.php and incorporate the Creative Commons Attribution - Non Commercial (unported, v3.0) License.
By accessing the work you hereby accept the Terms. Non-commercial uses of the work are permitted without any further permission from Dove Medical Press Limited, provided the work is properly attributed. For permission for commercial use of this work, please see paragraphs 4.2 and 5 of our Terms.