")
Back to Journals » Journal of Inflammation Research » Volume 16
CD146+ Umbilical Cord Mesenchymal Stem Cells Exhibit High Immunomodulatory Activity and Therapeutic Efficacy in Septic Mice
Authors Zhang L, Zhang X, Liu Y , Zhang W, Wu CT, Wang L
Received 3 November 2022
Accepted for publication 18 January 2023
Published 11 February 2023 Volume 2023:16 Pages 579—594
DOI https://doi.org/10.2147/JIR.S396088
Checked for plagiarism Yes
Review by Single anonymous peer review
Peer reviewer comments 2
Editor who approved publication: Professor Ning Quan
Lin Zhang,1,2 Xiaoxu Zhang,1 Yubin Liu,2 Weiyuan Zhang,1 Chu-Tse Wu,2 Lisheng Wang1,3
1Laboratory of Molecular Diagnosis and Regenerative Medicine, the Affiliate Hospital of Qingdao University, Qingdao, People’s Republic of China; 2Beijing Institute of Radiation Medicine, Beijing, People’s Republic of China; 3Department of Rehabilitation Sciences, School of Nursing, Jilin University, Changchun, People’s Republic of China
Correspondence: Lisheng Wang, Laboratory of Molecular Diagnosis and Regenerative Medicine, the Affiliate Hospital of Qingdao University, Qingdao, 266000, People’s Republic of China, Email [email protected]
Background: Several studies have shown that MSCs can significantly improve the survival of sepsis animals. CD146+ mesenchymal stem cells (MSCs) correlate with high therapeutic potency. However, their therapeutic effect on sepsis and detail mechanisms have not been explored.
Methods: The effect of CD146±MSCs on differentiation of Treg, Th1, Th17 subsets was evaluated by flow cytometry. The effects of CD146±MSCs on RAW264.7 phagocytosis and LPS-stimulated polarization were studied using a co-culture protocol. Luminex bead array and RNA sequencing were employed to determine the mechanisms of MSCs on LPS-stimulated RAW264.7. The Arg1 protein was detected by Western blot. CD146±MSCs were injected into LPS-induced sepsis mice by tail vein. The therapeutic effect was assessed by organ HE staining, T-cell subsets, cytokine in plasma, peritoneal macrophages, infiltrating monocytes subpopulations.
Results: In vitro, CD146+MSCs could significantly increase the proportion of Treg cells. Co-culture with CD146+MSCs increase the phagocytic rate of RAW264.7. CD146+MSCs regulate M2-type macrophages production more rapidly. The transcript profile differences between the CD146+MSCs and CD146-MSCs groups were clustered in arginine metabolism pathways. CD146+MSCs decreased NO production and increased ARG1 expression. CD146+MSCs secreted higher level of IL15,IFNγ, VEGF and lower level of IL1β, IL8 under LPS stimuli. In vivo, The level of IL10 at 24h and CXCL1, IFNγ at 12h in CD146+MSCs group was the highest. CD146+MSCs treatment enhances the phagocytic capacity of peritoneal macrophages. CD146+MSCs also increases the ratios of CD11b+Ly6Clo reparative monocytes and CD11b+Ly6Chi inflammatory monocytes until 24h.
Conclusion: Compared with CD146-MSCs, CD146+MSCs can accelerate the end of the inflammatory response and have robust anti-inflammatory effects, by increasing the Treg cells, promoting macrophage phagocytosis, enhancing the reparative macrophage, secreting more VEGF, etc.
Keywords: UC-CD146±MSCs, macrophages, sepsis, anti-inflammatory
Background
Sepsis is a systemic inflammatory response syndrome caused by the invasion of pathogenic microorganisms. It is a rapidly progressive disease with a high mortality rate up to 40%, and its incidence is increasing each year, making it a prominent problem for the global medical community.1 When pathogens disrupt the body’s natural barriers to entry, the innate immune system is activated by interactions with pattern recognition receptors expressed on the cell surface, triggering an inflammatory response and the release of cytokines.2 The early release of cytokines involves proinflammatory and anti-inflammatory cytokines, including TNFα, IL1β, IL6, IL4, and IL10. The imbalance between pro- and anti-inflammatory effects causes an amplified inflammatory cascade response.3 Neutrophils and mononuclear macrophages arrive in large numbers at the site of the inflammatory response and release the late inflammatory factor HMGB1,4 which further leads to tissue and vascular endothelial damage and the progression of coagulation abnormalities and organ failure.5 Current sepsis treatment is mostly supportive, such as antibiotics, rehydration therapy, vasoactive drugs, and immunotherapy, and there are no specific sepsis treatment options that can improve the prognosis of patients.6,7 Impaired immune function is the main pathophysiological mechanism in the development of sepsis. Focusing on the overall immune response of the body and regulating the imbalance between anti-inflammatory and proinflammatory effects will help develop an effective means to treat sepsis. MSCs are ideal effector cells for the treatment of sepsis because of their bidirectional regulation of the immune system. The mechanisms by which MSCs can treat sepsis include reducing the level of proinflammatory factors, increasing the expression of anti-inflammatory factors, inhibiting the inflammatory cascade, regulating the activity of immune cells, and reducing apoptosis.8 MSCs treat sepsis through a variety of effectors. Transcriptomic analysis of the lung, heart, kidney, liver and spleen in mice with sepsis induced by caecal ligation showed that the protective effects of bone marrow mesenchymal stem cells against sepsis include reducing mitochondrial-related dysfunction, downregulating Toll-like receptor expression and other innate immune proinflammatory response pathways, and protecting the integrity of endothelial cells and blood vessels.9 MSCs therapy for sepsis has entered the stage of Phase I/II clinical trials. In an open, dose-escalating clinical trial of human UC-MSCs in the treatment of patients with sepsis, the mortality rates in the MSCs treatment group were comparable to those in the matched control group of historical cases (20% and 26%).10,11 Further mechanism studies will improve the efficacy of MSCs in the treatment of sepsis. The goal of our study was to identify an MSCs subpopulation with superior immunomodulatory functions to improve the efficacy of sepsis treatment.
Previous studies have shown that CD146 can be used as a surface marker to distinguish MSC subpopulations and that CD146+MSCs subpopulations have superior biological functions and therapeutic potential, especially in immunomodulation. Bone marrow-derived CD146+BMSCs could produce more anti-inflammatory-related cytokines in an inflammatory environment than CD146-BMSCs and attenuate the inflammatory response in vivo.12 Wu et al found that the IL6 expression levels in CD146-UCMSCs were higher than those in CD146+UCMSC cells after TNFα treatment.13 MA Lan et al found that during the DPMSC in vitro transmission process, CD146 expression gradually decreased, and the ability to induce apoptosis in T cells was reduced, which may act through the ERK/p-ERK pathway.14 Our team previously found that CD146+UCMSCs had better regenerative properties than CD146-MSCs in premature ovarian failure.15
Growing evidence indicated that CD146+MSCs have stronger regenerative ability and CD146 expression are considered as a quality control standard for MSC products. However, their therapeutic effect on sepsis and detail mechanisms about regulation of macrophage have not been explored. In this study, we compared the regulatory effects of CD146±UCMSCs on T cell populations of PBMCs and their effects on macrophage. We also compared the therapeutic effects and differential mechanisms of CD146±UCMSCs in a LPS-induced sepsis mouse model.
Materials and Methods
Tregs, Th1 Cells, and Th17 Cells in PBMCs Cocultured with CD146±MSCs
CD146±MSCs were obtained as previously described.15 Human peripheral blood mononuclear cells (PBMCs) from healthy donors were purified on Ficoll-Paque (Haoyang Biological, Tianjin, China). The isolation and culture of CD146±UCMSCs were performed as described previously. PBMCs were then cocultured with CD146±UCMSCs at an MSC-to-PBMC ratio of 1: 5 for three days. Human CD3/CD28 Dynabeads (STEMCELL Technologies, Canada) were added to the mixed population to activate T cells. To determine the Treg cell subsets, the Human Regulatory T-Cell Staining Kit (Lianke Bio, Hangzhou, China) was used. Before determining Th1 and Th17 subsets, the cells were incubated with Cell Activation Cocktail (Biolegend, San Diego, USA) for 6 h.
Cells were labelled with the LIVE/DEAD™ Fixable Green Dead Cell Staining Kit (Invitrogen, USA) to exclude dead cells. Tregs were identified by anti-human CD4-PC-5.5 (Biolegend), anti-human CD25-APC (Lianke Bio) and anti-human Foxp3-PE (Lianke Bio) antibodies. Th1 and Th17 subsets were distinguished by anti-human IFN-γ-PE (Biolegend) and anti-human IL17A-APC (Biolegend). The samples were analysed by flow cytometry (Beckman, CytoFLEX).
Macrophage Phagocytosis in vitro
RAW264.7 cells (Procell,Wuhan,China) were cultured in DMEM (Gibco, Australia) with 10% FBS (Gibco, Australia) without penicillin‒streptomycin. Raji cells were maintained in RPMI-1640 medium (BI, Israel) containing 10% FBS. Raji cells (Procell,Wuhan,China) were prepared at a density of 2X10⁶ cells/mL. A total of 500 µL of the cell suspension and 500 µL of 5 µM CFSE (Biolegend) working solution were mixed. After being incubated for 10 min, 5 mL of complete medium was added to halt the staining, followed by two washes with cold PBS. The cells were resuspended in complete medium and placed in the incubator for 30 min to allow the cells to release excess CFSE. Raji cells were resuspended in 150 μL of PBS and lysed by freezing and thawing. RAW264.7 cells were plated into the lower wells of Transwell chambers and cocultured with CD146±UCMSCs in the upper wells. Raji-CFSE fragments were added to the lower chamber. RAW264.7 cells were digested for 30 min, 1 h and 2 h, and the supernatant was collected. The anti-mouse F4/80 (Biolegend) antibody was used for labelling. The percentage of F4/80+CFSE+ cells in total macrophages was measured for phagocytosis analysis.
M1/M2 Polarization of RAW264.7
RAW264.7 cells were plated at 3×10⁵ cells/well in the lower chamber of a twelve-well Transwell plate (Corning, USA) in the presence of LPS (MCE, NJ, USA). Control cells were untreated naive macrophages (M0). MSCs were plated in the upper chambers at a density of 3×10⁵ cells/well. At 6h, 12h, 24h, the culture supernatant was collected for cytokine analysis. TRIzol reagent (Life Technologies, USA) was added to the cells to extract total RNA. RIPA lysis buffer (Beyotime, China) was added to obtain total protein extracts. The M1 macrophage marker CD86 (Biolegend) and the M2 macrophage marker CD206 (Biolegend) were examined by flow cytometry. A Fix and Perm Kit (Lianke Bio) was used to permeabilize the membrane prior to labelling with CD206 antibodies.
Mouse Sepsis Model and Treatment
To induce acute sepsis, male C57BL/6 mice aged 6–10 weeks were given a single intraperitoneal injection of 10 mg/kg body weight LPS (MCE, NJ, USA). CD146±MSCs (1X10⁵ in 100 µL) were intravenously injected into the tail vein after 1 hour. 48 mice were divided into four groups: CON (n = 12), LPS (n = 12), CD146+MSC (n = 12), and CD146- MSC (n = 12). Six mice were sacrificed at 12 h and 24 h post injection in each group.
Histological Analysis
The lung, liver and spleen samples were fixed with 4% formaldehyde and embedded in paraffin for histopathological analysis by hematoxylin eosin (H&E) staining. The images were taken under a light microscope and histological changes were recorded.
Isolation and Analysis of Peritoneal Macrophages
First, 75% ethanol was sprayed on the mouse abdomen. The outer layer of the peritoneum was cut with scissors, and then cold RPMI-1640 was injected into the abdominal cavity with a 5 mL syringe. The peritoneum was gently massaged for 1 minute, and a 5 mL syringe was used to collect the liquid in the peritoneum into a tube. The tube was kept on ice, and this procedure was repeated once. The collected liquid was centrifuged at 1000 rpm for 5 minutes at 4 °C. Half of the samples were incubated with F4/80-APC, CD11b-FITC, and Ly-6C-PE (all Biolegend) antibodies to analyse the activation of macrophages, and the other half were incubated with 1 mL of culture medium containing fluorescein isothiocyanate (FITC)-OVA (100 μg/mL) at 37 °C for 1 hour. The cells were washed with cold PBS to stop phagocytosis, labelled with the F4/80-APC antibodies, incubated in the dark at room temperature for 15 min, washed with PBS, resuspended with 500 µL of PBS and analysed by flow cytometry.
The Ratios of CD3, CD4 and CD8 Cells in Peripheral Blood
Whole blood was anticoagulated using heparin sodium. Red blood cells were depleted by treatment with erythrocyte lysis buffer (Biolegend). Lymphocytes were assessed by staining peripheral blood mononuclear cells with CD3-FITC, CD8-PC-5.5, and CD4-PE (Biolegend). The percentages of CD3, CD4, and CD8 cells were analysed by flow cytometry.
Cytokine Concentration Analysis
The levels of cytokines in mouse serum (IL1α, IL1β, IL4, IL5, IL6, IL8, IL10, IL12p, IL13, TNFα, IFNγ, monocyte chemotactic protein (MCP)-1, macrophage inflammatory protein (MIP)-1β, GM-CSF, RANTES and eotaxin) were determined by Luminex bead array technology (Luminex-X200, Texas, USA) using commercial kits (BioRad, Hercules, CA). Supernatants from CD146± MSCs stimulated with LPS were detected using the same technology. The level of NO was determined using the Nitric Oxide Assay Kit (Nanjing Jiancheng Bioengineering Institute, Nanjing, China) according to the manufacturer’s protocol.
Western Blotting
The protein concentration of the cell lysates was determined with a BCA assay (Thermo Fisher Scientific). Samples containing equal amounts of proteins were separated by 10% SDS‒PAGE and transferred onto a PVDF membrane (GE Life, Uppsala, Sweden), followed by blocking with 5% skim milk for 1 h and incubation with specific primary antibodies against Arg-1 (HUABIO, ET1605-8, Hangzhou, China) and Tubulin (Abcam, ab70187) at 4 °C overnight. Following primary antibody incubation, the membranes were washed and incubated with an HRP-conjugated secondary anti-rabbit antibodies (HUABIO, HA1031) for 1 h at room temperature and visualized by using ECL detection kits (Serviobio, China).
RNA Sequencing
Total RNA was extracted from RAW264.7 cells with TRIzol Reagent (Life Technologies, California, USA) according to the instructions. RNA integrity and concentration were determined using an Agilent 2100 Bioanalyzer (Agilent Technologies, Inc., Santa Clara, CA, USA). The cDNA library was constructed with the NEBNext Ultra RNA LibraryPrep Kit for Illumina (NEB, E7530) and NEBNext Multiplex Oligos for Illumina (NEB, E7500) according to the manufacturer’s instructions. The cDNA libraries were loaded on an Illumina Nova 6000 sequencing platform at Biomaker (Beijing, China). The adapters and reads from the raw reads of each sample were trimmed to obtain clean reads. The clean reads were mapped against Mus musculus.GRCm38 using HISAT2 v2.0.4. Gene expression levels were estimated using fragments per kilobase of exon per million fragments mapped (FPKM). The false discovery rate (FDR) control method was used to identify the threshold of the P value in multiple tests to compute the significance of the differences. Significant differential expression was accepted as |log2FC|>1.5 and P value<0.05. Functional annotation and enrichment analysis of the significantly differentially expressed genes was performed with the bioinformatic pipeline tool BMK Cloud online platform.
Data Analysis
Data are expressed as mean±standard deviation (SD). All analyses were performed using GraphPad Prism software. Independent-sample T tests and ordinary one-way analysis of variance (ANOVA) were carried out for two group and multiple-group comparisons, respectively. Post hoc tests were performed using the Tukey HSD (homogeneity of variance) test or Dunnett T3 (heterogeneity of variance) test.
Results
CD146+MSCs Had Stronger Regulatory Effects on Treg, Th1 and Th17 Subsets
Our previous study showed that CD146+MSCs had a robust inhibitory effect on T-cell proliferation.15 We further analysed the proportion of Treg, Th17, and Th1 subset changes after coculture with CD146±MSCs. Tregs were identified as CD4+CD25+Foxp3+ cells and Th1/17 were identified as CD4+IFNγ+/IL17A+ cells by flow cytometry. 7AAd-CD4+ PBMCs were gated, and CD25+Foxp3+ and IFNγ+/IL17A+ populations were examined (Figure 1A). The results showed that the CD146±MSCs group had increased proportions of the Treg cell subpopulation in PHA-stimulated PBMCs compared with the PBMC+PHA group. Notably, the Treg proportion was significantly higher in the CD146+MSCs group than in the other three groups (P<0.0001). The CD146±MSCs group had reduced Th1 and Th17-cell subpopulations (Figure 1B) compared with the PBMC group stimulated by the cocktail. The CD146-MSCs group had a significantly reduced proportions of Th1 cells (P<0.05), the CD146+MSCs group had a significantly reduced proportions of Th17 cells (P<0.05), and there was no significant difference between the CD146+MSCs and CD146-MSCs groups.
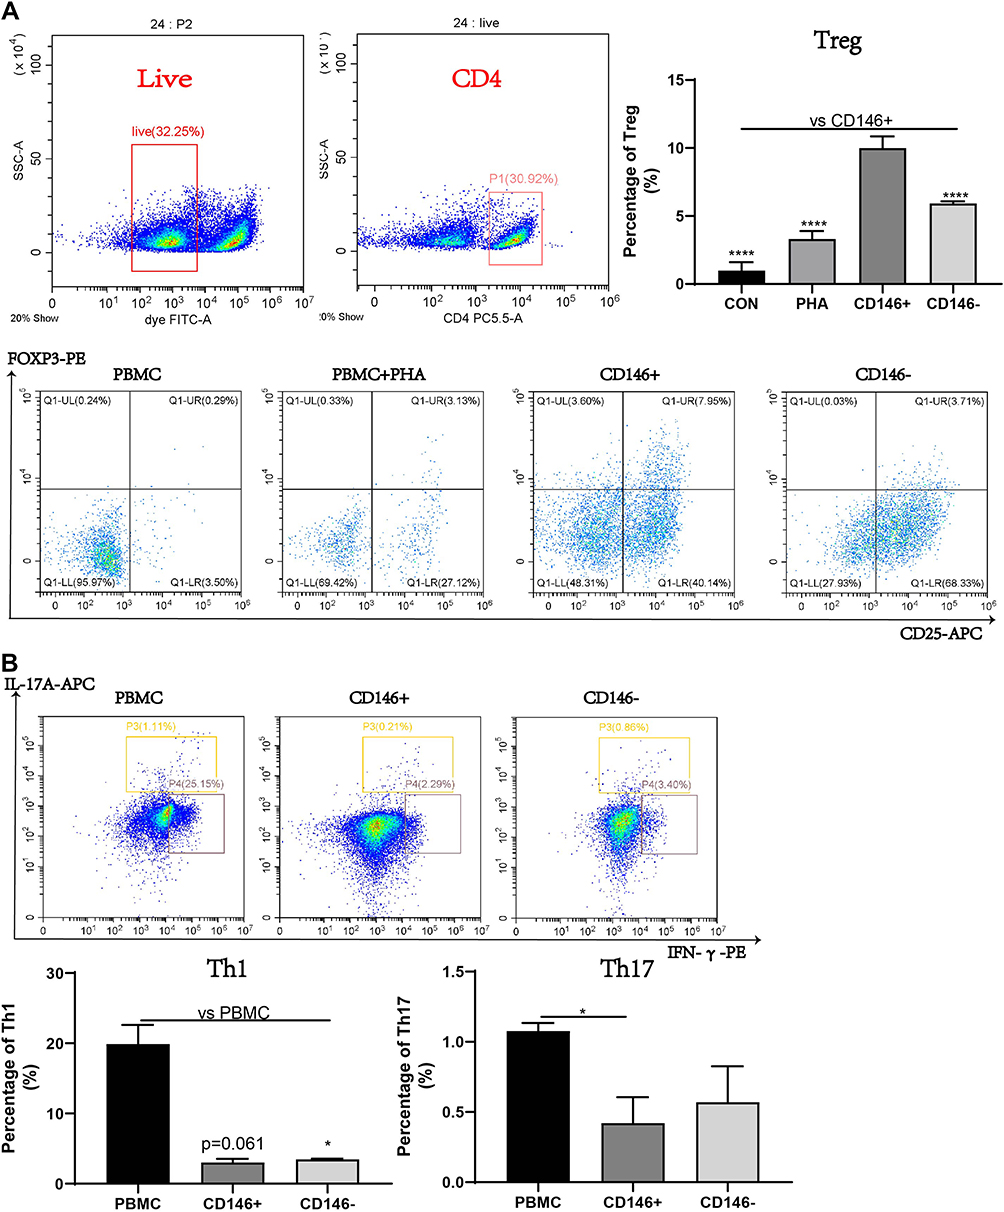 |
Figure 1 Regulatory ability of CD146±MSC to Treg, Th1 and Th17 subgroups in PBMC in vitro. (A) The proportion of Treg in PBMC after PHA activation for three days was detected by flow cytometry. CD4+ cell group was circled in live cell group, and CD25+Foxp3+ represented Treg subgroup. (B) Flow cytometry was used to detect the proportion of Th1 and Th17 subsets, after the PBMC were incubated with Cell Activation Cocktail for 6 h. CD4+IFNγ+ represents Th1 subgroup, CD4+IL17A+ represents Th17 subgroup. n=3, *P<0.05, **** P<0.0001. |
CD146+MSCs Increased the Phagocytic Capacity of RAW264.7 Cells
LPS-stimulated RAW264.7 cells were cocultured with CD146±MSCs in the Transwell system. At 6 h, 12 h and 24 h, changes in the expression of CD86 as a marker of M1 macrophages and CD206 as a marker of M2 macrophages were examined by flow cytometry. The results (Figure 2A) showed that at 6 h, the proportion of M1 macrophages in the LPS group was significantly increased, while CD146±MSCs reduced the expression of CD86, and the expression of CD86 at 12 h and 24 h in the groups tended to be the same. At 6 h, the proportion of M2 macrophages in the CD146+ MSC group was significantly higher than that in the LPS group and CD146-MSC group and then decreased. M2 macrophages in the CD146- MSC group showed an increasing trend, which was significantly higher than that in the CD146+ MSC group at 24 h. M0 macrophages are in an unpolarized state, which was gated with F4/80+CD86-CD206-. Further analysis of M0 cells showed that there were low numbers of M0 cells in each group at 6 h after LPS stimulation. The proportion of M0 cells in the CD146+MSC group distinctly recovered at 12 h, which was significantly different from that in the other two groups (Figure 2A). CFSE-labelled cell debris was added to RAW264.7 cells. F4/80+CFSE+ double-positive macrophages engulfed the cell debris. The results (Figure 2B) showed that at 30 min, the phagocytosis rate in the CD146+ MSC group was higher than that in the LPS group and CD146-MSC group, and at 1 h, the phagocytosis rate in the CD146+ MSC group was significantly higher than that in the CD146-MSC group (P=0.031). At 2 h, the phagocytosis rate in the three groups was basically the same.
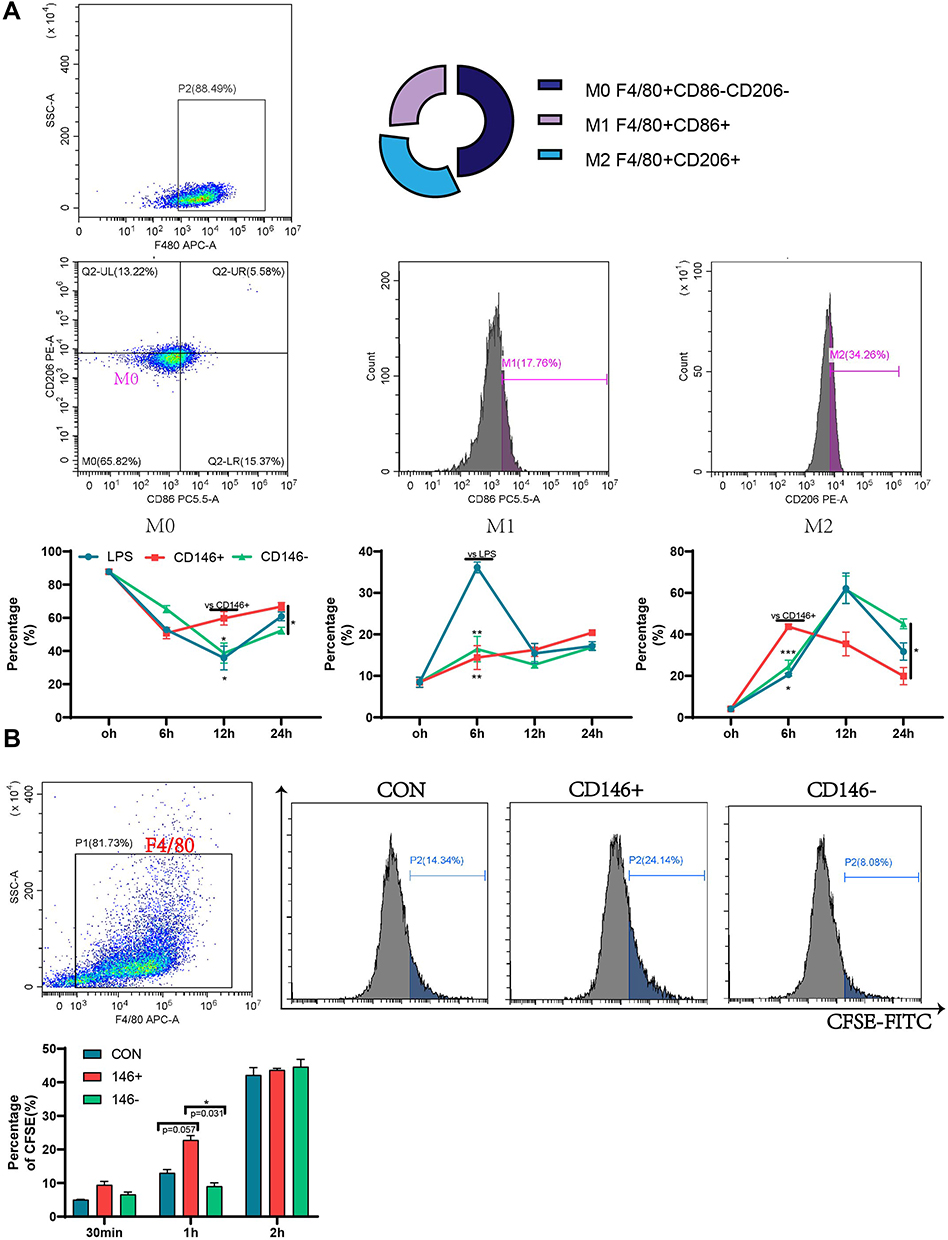 |
Figure 2 Regulation of macrophage raw264.7 by CD146±MSCs in vitro. (A) RAW264.7 were stimulated by LPS for 4h and co-cultured with CD146±MSC through Transwell. The proportion of M1(F4/80+CD86+) and M2(F4/80+CD206+) macrophages was detected at 6h,12h,24h by flow cytometry. (B) CFSE labeled Raji fragments were added to RAW264.7 co-cultured with CD146±MSC through Transwell. The proportion of RAW264.7 engulfed fragments characterized by F4/80+CFSE+ was detected by flow cytometry. n=3, *P<0.05, **P<0.01, ***P<0.001. |
CD146± MSCs Improved T-Cell Subsets and Inflammatory Factor Levels in the Peripheral Blood of Septic Mice
Morphological changes in the lung, kidney and spleen were observed by HE staining (Figure 3A). Compared with that in the control group, the alveolar wall in the LPS group was significantly thickened and oedematous, the hepatic sinuses were dilated and bleeding, a large number of inflammatory cells had infiltrated the lung and liver, the boundary between the white pulp and the red pulp of the spleen was blurred, and the distribution of lymphocytes was chaotic. The CD146±MSCs treatment improved the pathological damage to various organs caused by LPS, and the pathological morphology of organs in the CD146+MSC group was slightly better than that in the CD146- MSC group.
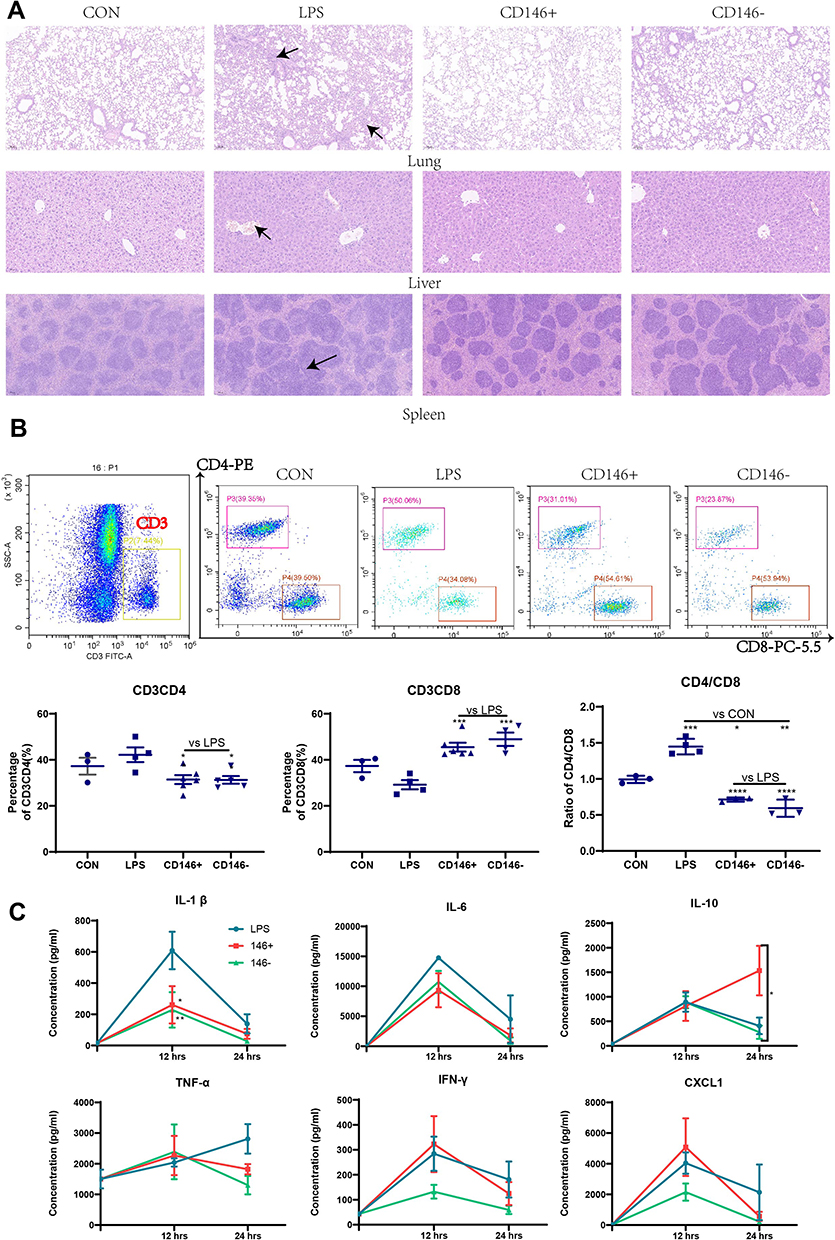 |
Figure 3 Therapeutic effect of CD146±MSCs on sepsis mice (A) Hematoxylin-eosin staining of lung, liver, spleen in CON, LPS, CD146±group. Arrowheads indicated abnormal pathological morphology of organs in LPS group. (B) Representative flow cytometry data for CD4+T and CD8+T cells in the peripheral blood after gating the CD3+T cells. Graph illustrating quantitative data for the percentages of CD3CD4+T cells, CD3CD8+T cells and the ratio of CD4/CD8 in the peripheral blood. (C) Analysis of IL1β, IL6, IL10, TNFα, IFNγ, CXCL1 in plasma by Luminex Assay. The cytokine level in CON group represents the cytokine level at 0h. n=4, *P<0.05, **P<0.01, ***P<0.001. |
Peripheral blood was collected and labelled with antibodies after red cell lysis. The proportions of CD3+CD4+ and CD3+CD8+ cells were analysed by flow cytometry. The results (Figure 3B) showed that CD146± MSC treatment improved the dysregulation of CD4 cells, CD8 cells and the CD4/8 ratio in septic mice. Compared with the LPS group, the CD146±MSCs treatment group had significantly decreased CD4 expression, significantly increased CD8 expression, and significantly decreased CD4/CD8 ratios. The ratio of CD4/CD8 in the CD146±MSCs treated group was similar to that in the normal group. At 12 h and 24 h after LPS injection, the plasma was collected to analyse IL1β, IL6, IL10, TNFα, IFNγ, and CXCL1 (Figure 3C). Compared with the LPS group, the CD146± MSC groups had significantly reduced levels of the proinflammatory factor IL1β at 12 h. The CD146±MSC groups reduced levels of the proinflammatory factor IL6 at 12 h and 24 h, but the difference was not significant. At 12 h, the level of IL10 was similar among the three groups. However, at 24 h, the level of IL10 in the CD146+ MSC group was significantly higher than that in the CD146- group (P < 0.001) and LPS group (P < 0.05). TNFα was increased in the LPS group with time, and at 24 h, TNFα was decreased in both CD146± MSC groups. The changes in IFNγ in the CD146+ MSC groups were similar to those in the LPS group, and the level of IFNγ in the CD146-MSC group was always lower. At 12 h, the level of CXCL1 in the CD146+MSC group was the highest and returned to a lower level at 24 h, while the level of CXCL1 in the LPS group was maintained at a higher level.
CD146+MSCs Improve the Phagocytosis and Subpopulation Ratio of Peritoneal Macrophages in Septic Mice
Peritoneal macrophages were isolated from septic mice at 12 h and 24 h, OVA protein was added for the phagocytosis assay, and the proportion of OVA-FITC-positive cells in the F4/80+ gate was examined by flow cytometry. The results (Figure 4A) showed that at 12 h, the phagocytic ability of peritoneal macrophages in CD146+MSCs-treated mice was stronger than that in the CD146-MSC treated and LPS groups. The phagocytic ability was similar in each group at 24 h. CD146+MSCs improved the phagocytic ability of macrophages in the early stage, which was consistent with the in vitro results. Further examination of CD11b+Ly6C+ monocytes in the peritoneal cavity revealed that at 12 h, the CD146±MSC treatment group had significantly reduced numbers of monocytes in the peritoneal cavity (Figure 4B). CD11b+Ly6Chi represents inflammatory monocytes, and CD11b+Ly6Clo represents reparative monocytes. The ratio of CD11b+Ly6Clo/CD11b+Ly6Chi cells showed the repair and regenerative capacity of the microenvironment after inflammation. The CD146±MSCs treatment groups both showed enhanced ratios of CD11b+Ly6Clo/CD11b+Ly6Chi at 12 h, and there was a significant difference between the CD146+ MSC group and the CD146-MSC group at 24 h.
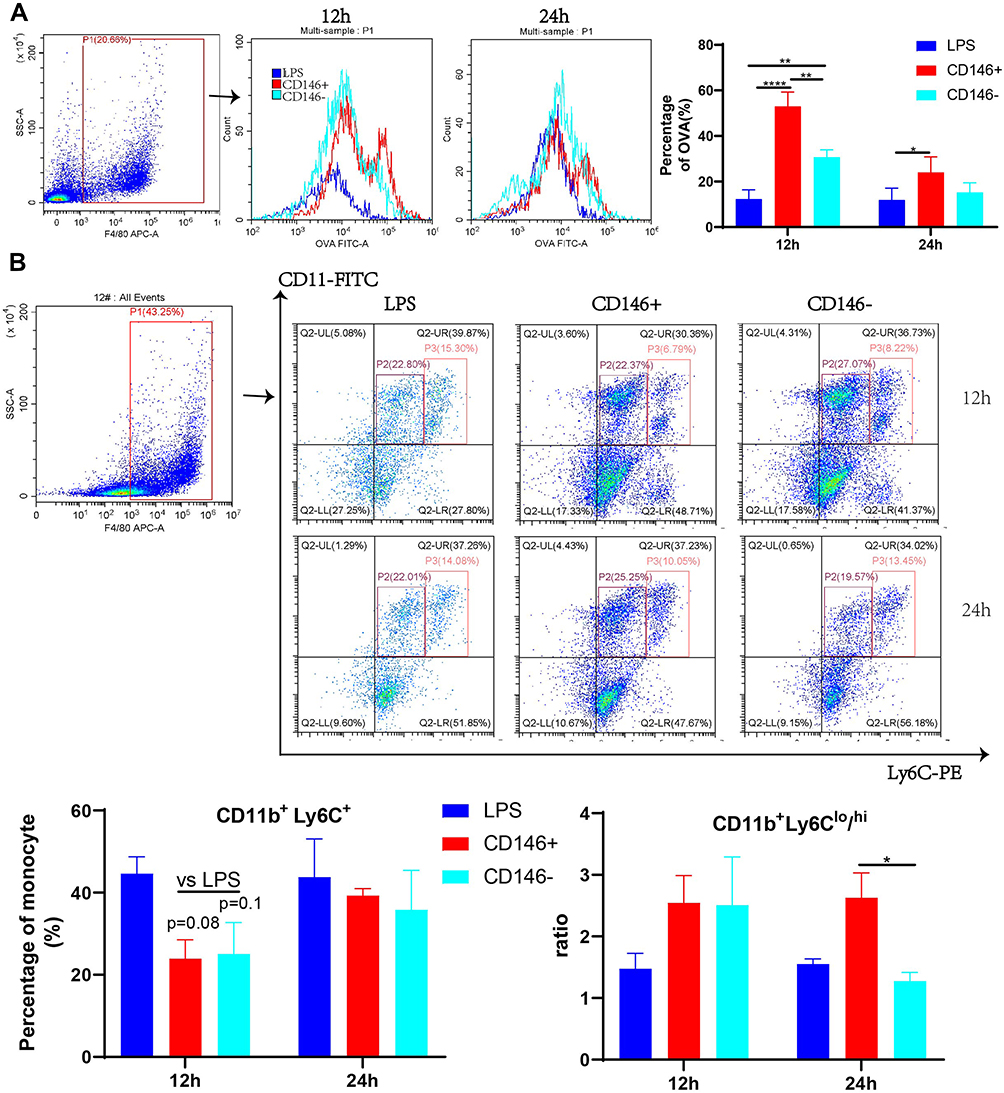 |
Figure 4 Modulation of phagocytosis and subsets of peritoneal macrophages by CD146 ±MSCs in septic mice. (A) OVA were added to peritoneal macrophages, and the percentage of OVA (%) represents the phagocytosis rate. The OVA-FITC+ cells in F4/80 + was determined by flow cytometry. Histograms reflect phagocytic capacity of peritoneal macrophages. (B) The monocyte in peritoneal macrophages were labelled with CD11b and Ly6C. Representative flow cytometry data for CD11b+Ly6C+ cells of LPS,CD146+,CD146- groups. (C) The CD11b+Ly6C+ monocyte in peritoneal macrophages include inflammatory CD11b+Ly6Chi and reparative CD11b+Ly6Clo cells. The ratio of CD11b+Ly6Chi/CD11b+Ly6Clo was calculated. |
Different Mechanisms by Which CD146±MSCs Regulate LPS-Induced RAW264.7 Cells Include Differences in Arg1 Expression
The mechanism by which CD146+MSCs repair LPS-treated RAW264.7 cells was further examined. RNA sequencing analysis was performed on a total of nine RAW264.7 cell specimens from the CD146+MSC, CD146-MSC, and LPS groups. We used KEGG analysis to observe functional and signalling pathway differences between the CD146+MSCs group and the LPS group. KEGG analysis (Figure 5A) showed that significant DEGs (CD146+MSC vs LPS groups) were significantly enriched in the cytokine‒cytokine receiver interaction, focal adhesion, fluid sheet stress and atherosclerosis, Rap1, and PPAR signalling pathways. DEGs (CD146-MSC vs LPS group) were primarily associated with the cytokine‒cytokine receptor interaction, PPAR, fluid sheet stress and atherosclerosis, JAK-STAT, and focal adhesion. Venn diagram analysis showed that there were many similarities and differences among the three groups of differentially expressed genes (Figure 5B). In the PPAR signalling pathway, CD146±MSCs significantly increased the expression of the Acsbg1, Scd family, and Olr1 genes and reduced the expression of the Fabp4, Lpl, and Acaa1b genes (Figure 5C). In the cytokine‒cytokine receptor interaction pathway, the expression levels of the chemokines Cxcl2 and Ccl9 and the cytokines Ebi3 and IL1f9 were decreased, and the expression levels of IL10, IL4ra, CX3CR1, CXCL14, TNFSF13b, Lif, Csf2rb2 and Osm were increased (Figure 5C).
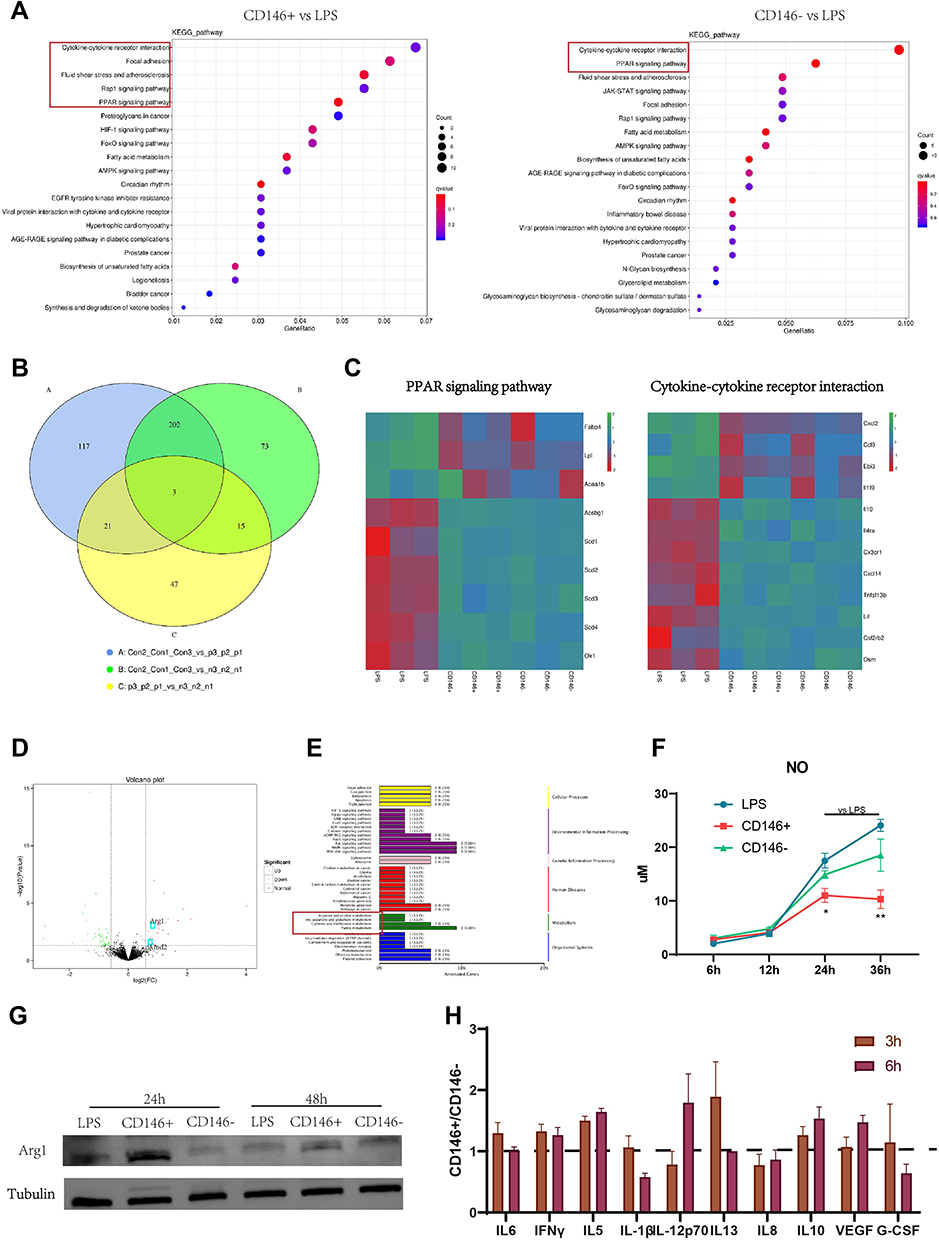 |
Figure 5 Mechanism of CD146± MSC in the treatment of LPS-induced Raw264.7. (A) KEGG pathway enriched by differential genes between CD146± groups and LPS group. (B) Venn diagram shows the same and different gene between two groups. (C) The heat map shows the different genes in PPAR and Cytokine-Cytokine Receptors Interaction signal pathway between CD146± groups and LPS group. (D) Volcano map of all the differentially expressed gene between CD146+ and CD146- group. (E) KEGG classification between CD146+ and CD146- group. (F) The NO content in cell culture supernatant of LPS (stimulated with 200 ng/mL LPS for 4h) and CD146± groups (coculture with CD146±MSCs through Transwell after LPS stimulation). (G) Western blot analysis of Arg1 and Tubulin at 24h and 48h in RAW264.7 after LPS stimulation. Cropped blot images are shown. See Supplementary Information for the original full-length blot images. (H) Cytokine level in CD146±MSCs conditioned medium stimulated with LPS (200 ng/mL) for 24h measured by Luminex. |
There were 86 differential genes between the CD146+ MSC and CD146-MSC groups (Figure 5D), and the differences in the signal pathway were relatively scattered. Interestingly, we found that some of the differentially expressed genes were clustered in arginine metabolism (Figure 5E). The expression of the Arg1 gene was different, and the WB results further confirmed that the expression level of Arg1 in the CD146+ MSC group was the highest (Figure 5G). In addition, Amd2, a gene related to polyamine metabolism, showed significant differences between the two groups. Arg1 is closely related to intracellular NO production. We measured NO production in each group and found that NO levels in the CD146+MSC group were significantly lower than those in the other groups at 24 h and 36 h (Figure 5F). We further collected the supernatant in the CD146± MSC groups in the presence of LPS and analysed the fold difference between the two groups at 3 h and 6 h. Compared with CD146-MSCs, CD146+MSCs secreted higher levels of factors such as IL15, IFNγ (consistent with the in vivo experimental results) and VEGF and lower levels of factors such as IL1β and IL8 (Figure 5H).
Discussion
Our previous study showed that under normal culture conditions, CD146+MSCs secreted lower levels of the inflammatory factors IL6 and IL1 and the chemokines CXCL2/3/8 than those in the CD146-MSC group, and CD146+ MSC had better value-added properties, a stronger ability to inhibit T-cell proliferation, and better recovery of the CD4/CD8 ratio imbalance caused by chemotherapy drugs. Previous studies have also shown that Th17 cells were activated when exposed to CD146–MSCs but not when exposed to CD146+MSCs.13 Our study found that CD146+MSCs had a slight advantage in inhibiting the PMA-induced increased proportion of Th17 cells. Both the CD146+MSC and CD146-MSC groups weakened Th1 cells in PBMCs. Furthermore, there was a significantly higher proportion of Tregs in PHA-stimulated PBMCs in the CD146+ MSC group than in the CD146-MSC group. The effect of CD146±MSCs on macrophage phagocytosis and polarization has not been reported in vitro. In this study, we explored this topic for the first time. We found that the CD146+MSCs had improved the phagocytic efficiency in macrophages. At 1 h, the macrophage phagocytosis rate in the CD146+MSC group was significantly higher than that in the CD146- MSC group. CD146±MSCs reduced LPS-activation of M1 cells, but the CD146+ MSC group could regulate the production of M2 cells more quickly, thereby inhibiting the inflammatory response and maintaining the macrophages in an inactivated state (M0).
In view of the superior immunomodulatory properties of CD146+ MSCs, we chose a sepsis model with immune imbalance to compare the therapeutic effects of CD146±MSCs. Previous studies have shown that CD4+CD25+ Treg cells are in continued imbalance in sepsis patients, which are positively correlated with the severity of the disease and the mortality rate.16 The CD8+ T lymphocyte count is inversely proportional to the severity of sepsis.17 After LPS injection, the CD4 ratio increased in mice, and the CD8 ratio decreased, indicating that we successfully established a sepsis model of immune regulation imbalance in mice. In our study, CD146±MSCs treatment could both improve LPS-induced changes in CD4 and CD8 and maintain the balance of the CD4/8 ratio, and there was no significant difference between the two groups, which might be because prompt injection of MSCs caused less damage in the acute phase. The early inflammatory mediators of sepsis include IL1β and IL6, and the proportions of IL1β and IL6 in the serum in the CD146± MSC groups were decreased. TNF-α is the most important proinflammatory cytokine in early inflammation and is also the key mediator of endotoxin injury.18 In the LPS group, TNFα increased with time and decreased in the CD146± MSC groups at 24 h. IFN-γ is produced the earliest after the body is damaged. This factor can not only activate cytokines but also significantly upregulate the expression of major histocompatibility complex class II antigen and enhance the interaction between antigen-presenting cells and T lymphocytes.19 The changing in IFNγ in the CD146+ MSC group was similar to that in the LPS MSC group, and the level of IFNγ in the CD146-MSC group was low. Our data suggest that these differences in regulating macrophages phagocytosis between CD146+ MSCs and CD146–MSCs may be related with IFNγ. CXCL1 induces neutrophil migration during bacterial infection.20 At 12 h, the CXCL1 level in the CD146+ MSC group was the highest, and it recovered to a lower level at 24 h, while CXCL1 levels in the LPS group remained high. The early anti-inflammatory factors of sepsis include IL10, IL-4, and IL-13.21 After priming, a protein chip study of the culture supernatant showed that the CD146+ MSC group secreted higher levels of IL10, IL4 and IL13 than the CD146- MSC group.12 At 24 h, the IL10 level in the CD146+MSC group was significantly higher than that in the CD146-MSC group and LPS group. CD146+MSCs secreted more IL10 under inflammatory conditions. We isolated mouse peritoneal macrophages and found that at 12 h, the phagocytic abilities of macrophages in the CD146+MSCs treatment group were superior to those in the CD146- MSC treatment group and the LPS group. CD146+MSCs improved the phagocytic efficiency of macrophages at an early stage, which was consistent with the in vitro results. At 12 h, the CD146+MSCs treatment group had significantly reduced proportions of monocytes in the abdominal cavity. CD11b+Ly6Chi represent inflammatory monocytes, and CD11b+Ly6Clo represent repair monocytes.22 The CD146±MSCs treatment groups had improved CD11b+Ly6Clo/CD11b+Ly6Chi levels, and at 24h the CD146+MSCs had significantly improved ratios of inflammatory and repair macrophages. Thus, we can hypothesize that CD146+MSCs can accelerate pathogen removal by ensuring the immune balance in the body and improving the proinflammatory and anti-inflammatory imbalance in sepsis so that the body can recover and regenerate more quickly after inflammation.
These in vivo and in vitro experimental results also suggest that CD146±MSCs seem to have somewhat different regulatory mechanisms for macrophages. Macrophages are the central players that initiate inflammatory reactions in the body and play an important role in the development of sepsis. Previous studies have shown that MSCs promote polarization from M1 to M2 by regulating the activation of NF-κB23 in macrophages and the secretion of TGF-β,24 TSG-6,25 and exosomal miR-146a26 in sepsis. In addition, MSCs can promote the removal of bacteria in the blood and organs of septic mice.27 In vitro experiments showed that MSCs could improve the phagocytosis of Escherichia coli by cocultured neutrophils through the secretion of the antibacterial peptide LL-37.28
In recent years, popular single-cell sequencing technology has also shown that MSCs mainly treat immune diseases by regulating mononuclear macrophages. In the acute synovitis model, single-cell sequencing showed that MSC treatment could attenuate macrophage polarization to the M1 type and induce macrophage transition to the M2 phenotype.29 In the acute lung injury model, single-cell sequencing of cells at the wound site revealed transcriptome changes in pulmonary macrophages after MSC infusion, and a group of angiogenic CD9+ macrophage subpopulations were found.30
Next, we focused on the mechanisms by which CD146±MSCs regulate macrophages. We further examined the effect of CD146±MSCs on LPS-induced RAW264.7 cells in vitro by RNA sequencing, and the results showed that the CD146± MSC group mainly showed improvements in the PPAR and cytokine receptor pathways. Previous study showed that infection could stimulate macrophages to absorb large amounts of lipids, which were stored in lipid droplets as triacylglycerol and promoted macrophages to form foam cells.31 Fatty acid binding protein 4 (FABP4) is a small apolipoprotein in macrophages that is abundantly expressed during foam cell formation and can regulate the intracellular metabolic process and immune response by binding to fatty acids.32 FABP4 inhibitors inhibit the LPS-induced inflammatory response in macrophages.33 Stearyl coenzyme A desaturase (SCD) is the rate-limiting enzyme that catalyses the formation of MUFAs from SFAs. The expression of SCD family genes was significantly increased in the CD146± MSC group. This finding indicated that MSCs could reduce the accumulation of fat in macrophages through the SCD family to prevent further foaming.
CXCL14 was highly expressed in the CD146±MSC groups, and Lv et al showed that CXCL14 overexpression played an anti-inflammatory role in sepsis-related AKI by downregulating the production of macrophage-derived cytokines (TNF-α, IL-6 and IL-1β).34 CX3CR1 was highly expressed in the CD146± MSC groups. The latest research indicates that CX3CR1+ macrophages can form a dynamic membrane-like structure through tight junctions and form an immune barrier to limit the inflammatory response.35 OSM was highly expressed in the CD146± MSC groups. Studies have shown that OSM is a key factor with which macrophages rebuild damaged tissues, and mice with macrophage-specific knockout of OSM cannot achieve cardiac regeneration after cardiac injury.36 CD146±MSCs therapy significantly reduced LPS-induced CXCL2 (also known as MIP2-α) and CCL9 (also known as MIP1γ) expression, both of which could further recruit macrophages to inflammatory sites and exacerbate the inflammatory response.37 In the CD146± MSC groups, Tnfsf13b and EBI3 were expressed at low levels. Tnfsf13b is a B-cell activator, and increased expression of EBI3 in macrophages induced dysfunction in tumour-infiltrating CD8+ T cells.38 This evidence indicated that CD146±MSCs therapy significantly improved the interaction between macrophages and other immune cells in the inflammatory environments.
Notably, the differences between the CD146± MSC groups were mainly associated with Arg1 metabolism. Arg1 is not a specific marker of M2 polarization, but Arg1 can occupy the substrate of iNOS by degrading arginine, downregulate nitric oxide production and promote the production of M2-type cells.39 We found a difference in the arginine and nitrogen metabolism pathways between the CD146± MSC groups after LPS induction for 24 h. At 24 h, Arg1 expression was 30-fold higher in the CD146- MSC group and 40-fold higher in the CD146+MSC group than in the LPS group. Since our sequencing time point was 24 h, the macrophages may have already been in the late stage of the inflammatory response. We used time points of 2 h, 4 h, 6 h, 12 h, and 24 h for further verification in vitro. The results showed that the expression of Arg1 in the CD146+ MSC group was the first to change, which was much higher than that in the other groups and was consistent with our sequencing results. The WB results further support our findings. The NO levels in the CD146+ MSC group were negatively correlated with Arg1 expression. Faster regulation of Arg1 expression in the CD146+ MSC group may be responsible for faster regulation of M2 cell production. The differences in cytokine levels in the supernatant of CD146±MSCs exposed to LPS might be the reason for this difference. CD146+MSCs secreted increased levels of IL15 and IFNγ, which are related to the promotion of antigen presentation, antibody production and improvements in macrophage lysosomal activity.40,41 In addition, the higher levels of IL10 and VEGF in the CD146+ group achieved a better effect on anti-inflammation and regeneration.
Conclusion
Compared with CD146-MSCs, CD146+MSCs can promote the elimination of inflammation and have robust anti-inflammatory effects as well as regenerative and reparative abilities, by increasing the Treg cells, promoting macrophage phagocytosis, enhancing the reparative monocytes, etc. Thus, CD146+MSCs might be developed as effective MSC drugs for the treatment of inflammatory diseases.
Abbreviations
MSCs, Mesenchymal stem cells; Arg1, Argininase1; LPS, lipopolysaccharide; HE, Hematoxylin eosin staining; PHA, Phytohaemagglutinin; NO, Nitric oxide; IL15, Interleukin 15; IFNγ, Interferon gamma; VEGF, Vascular endothelial growth factor; IL1β:Interleukin 1 beta; IL8, Interleukin 8; IL10, Interleukin 10; CXCL1, CXC chemokine ligand 1; HMGB1, High Mobility Group Box 1; TNFα, Tumor necrosis factor Alpha; PBMC, Peripheral blood mononuclear cell; Tregs:Regulatory T cell; Th1, Helper 1 T cell; Th17, Helper 17 T cell; OVA, Ovalbumin; BCA, Bicinchoninic acid assay; ECL, Enhanced chemiluminescence; KEGG, Kyoto Encyclopedia of Genes and Genomes; PPAR, Peroxisome proliferators activated receptors; UL, Up Left; UR, Up Right; LL, Lower Left; LR, Lower Right.
Data Sharing Statement
The datasets used and/or analyzed during the current study are available from the corresponding author on reasonable request.
Ethics Approval and Consent to Participate
All animal studies and experiments complied with the Guidelines for the Care and Use of Laboratory Animals of the Chinese Animal Welfare Committee and were approved by the Ethical Committee of Experimental Animal Welfare of Qingdao University Affiliated Hospital (AHQU-MAL20210827). PBMC collection was approved by the Ethics Committee of Shanghai Zhaxin Integrated Traditional Chinese and Western Medicine Hospital. Each donor provided written informed consent.
Consent for Participate
All authors agreed to participate in this manuscript submission.
Consent for Publication
All authors agreed to publish.
Acknowledgments
This work was supported by National Key Research and Development Program (2017YFA0105303) and Natural Science Foundation of Shandong Province (ZR2020MH327).
Author Contributions
All authors made a significant contribution to the work reported, whether that is in the conception, study design, execution, acquisition of data, analysis and interpretation, or in all these areas; took part in drafting, revising or critically reviewing the article; gave final approval of the version to be published; have agreed on the journal to which the article has been submitted; and agree to be accountable for all aspects of the work.
Funding
This work was supported by National Key Research and Development Program (2017YFA0105303), and Natural Science Foundation of Shandong Province (ZR2020MH327).
Disclosure
The authors declare that they have no competing interests in this work.
References
1. Baghdadi JD, Brook RH, Uslan DZ, et al. Association of a care bundle for early sepsis management with mortality among patients with hospital-onset or community-onset sepsis. JAMA Intern Med. 2020;180(5):707–716. doi:10.1001/jamainternmed.2020.0183
2. Uhle F, Lichtenstern C, Brenner T, Weigand MA. Sepsis und Multiorganversagen - Pathophysiologie der Sepsis [Pathophysiology of sepsis]. Anasthesiol Intensivmed Notfallmed Schmerzther. 2015;50(2):114–122. German. doi:10.1055/s-0041-100391.
3. Chousterman BG, Swirski FK, Weber GF. Cytokine storm and sepsis disease pathogenesis. Semin Immunopathol. 2017;39(5):517–528. doi:10.1007/s00281-017-0639-8
4. Blumental-Perry A, Bonfield TL. Editorial, Modulation of HMGB1 holds promise for managing sepsis immune paralysis. J Leukoc Biol. 2017;101(6):1273–1275. doi:10.1189/jlb.3CE1216-510R
5. Singer M, Deutschman CS, Seymour CW, et al. The third international consensus definitions for sepsis and septic shock (Sepsis-3). JAMA. 2016;315(8):801–810. doi:10.1001/jama.2016.0287
6. Gotts JE, Matthay MA. Sepsis, pathophysiology and clinical management. BMJ. 2016;353:i1585. doi:10.1136/bmj.i1585
7. Mouncey PR, Osborn TM, Power GS, et al. Trial of early, goal-directed resuscitation for septic shock. N Engl J Med. 2015;372(14):1301–1311. doi:10.1056/NEJMoa1500896
8. Keane C, Jerkic M, Laffey JG. Stem Cell-based Therapies for Sepsis. Anesthesiology. 2017;127(6):1017–1034. doi:10.1097/ALN.0000000000001882
9. Dos Santos CC, Murthy S, Hu P, et al. Network analysis of transcriptional responses induced by mesenchymal stem cell treatment of experimental sepsis. Am J Pathol. 2012;181(5):1681–1692. doi:10.1016/j.ajpath.2012.08.009
10. He X, Ai S, Guo W, et al. Umbilical cord-derived mesenchymal stem (stromal) cells for treatment of severe sepsis, a phase 1 clinical trial. Transl Res. 2018;199:52–61. doi:10.1016/j.trsl.2018.04.006
11. Laterre PF, Sanchez-Garcia M, van der Poll T, et al. A phase Ib/IIa, randomised, double-blind, multicentre trial to assess the safety and efficacy of expanded Cx611 allogeneic adipose-derived stem cells (eASCs) for the treatment of patients with community-acquired bacterial pneumonia admitted to the intensive care unit. BMC Pulm Med. 2020;20(1):309. doi:10.1186/s12890-020-01324-2
12. Bowles AC, Kouroupis D, Willman MA, Perucca Orfei C, Agarwal A, Correa D. Signature quality attributes of CD146(+) mesenchymal stem/stromal cells correlate with high therapeutic and secretory potency. Stem Cells. 2020;38(8):1034–1049. doi:10.1002/stem.3196
13. Wu CC, Liu FL, Sytwu HK, Tsai CY, Chang DM. CD146+ mesenchymal stem cells display greater therapeutic potential than CD146- cells for treating collagen-induced arthritis in mice. Stem Cell Res Ther. 2016;7:23. doi:10.1186/s13287-016-0285-4
14. Ma L, Huang Z, Wu D, Kou X, Mao X, Shi S. CD146 controls the quality of clinical grade mesenchymal stem cells from human dental pulp. Stem Cell Res Ther. 2021;12(1):488. doi:10.1186/s13287-021-02559-4
15. Zhang L, Sun Y, Zhang XX, et al. Comparison of CD146 ± mesenchymal stem cells in improving premature ovarian failure. Stem Cell Res Ther. 2022;13(1):267.
16. Chen K, Zhou QX, Shan HW, Li WF, Lin ZF. Prognostic value of CD4(+)CD25(+) Tregs as a valuable biomarker for patients with sepsis in ICU. World J Emerg Med. 2015;6(1):40–43.
17. Duong S, Condotta SA, Rai D, Martin MD, Griffith TS, Badovinac VP. Polymicrobial sepsis alters antigen-dependent and -independent memory CD8 T cell functions. J Immunol. 2014;192(8):3618–3625. doi:10.4049/jimmunol.1303460
18. Chen J, Xuan J, Gu YT, et al. Celastrol reduces IL-1beta induced matrix catabolism, oxidative stress and inflammation in human nucleus pulposus cells and attenuates rat intervertebral disc degeneration in vivo. Biomed Pharmacother. 2017;91:208–219. doi:10.1016/j.biopha.2017.04.093
19. Han RT, Kim S, Choi K, et al. Asthma-like airway inflammation and responses in a rat model of atopic dermatitis induced by neonatal capsaicin treatment. J Asthma Allergy. 2017;10:181–189. doi:10.2147/JAA.S124902
20. Paudel S, Baral P, Ghimire L, et al. CXCL1 regulates neutrophil homeostasis in pneumonia-derived sepsis caused by Streptococcus pneumoniae serotype 3. Blood. 2019;133(12):1335–1345. doi:10.1182/blood-2018-10-878082
21. Parande Shirvan S, Ebrahimby A, Dousty A, et al. Somatic extracts of Marshallagia marshalli downregulate the Th2 associated immune responses in ovalbumin-induced airway inflammation in BALB/c mice. Parasit Vectors. 2017;10(1):233. doi:10.1186/s13071-017-2159-8
22. Chen YL, Wang CY, Fang JH, Hsu HP. Serine/threonine-protein kinase 24 is an inhibitor of gastric cancer metastasis through suppressing CDH1 gene and enhancing stemness. Am J Cancer Res. 2021;11(9):4277–4293.
23. Liang X, Li T, Zhou Q, et al. Mesenchymal stem cells attenuate sepsis-induced liver injury via inhibiting M1 polarization of Kupffer cells. Mol Cell Biochem. 2019;452(1–2):187–197. doi:10.1007/s11010-018-3424-7
24. Liu F, Qiu H, Xue M, et al. MSC-secreted TGF-beta regulates lipopolysaccharide-stimulated macrophage M2-like polarization via the Akt/FoxO1 pathway. Stem Cell Res Ther. 2019;10(1):345. doi:10.1186/s13287-019-1447-y
25. Huang Q, Cheng X, Luo C, et al. Placental chorionic plate-derived mesenchymal stem cells ameliorate severe acute pancreatitis by regulating macrophage polarization via secreting TSG-6. Stem Cell Res Ther. 2021;12(1):337. doi:10.1186/s13287-021-02411-9
26. Song Y, Dou H, Li X, et al. Exosomal miR-146a contributes to the enhanced therapeutic efficacy of interleukin-1beta-primed mesenchymal stem cells against sepsis. Stem Cells. 2017;35(5):1208–1221. doi:10.1002/stem.2564
27. Alcayaga-Miranda F, Cuenca J, Martin A, Contreras L, Figueroa FE, Khoury M. Combination therapy of menstrual derived mesenchymal stem cells and antibiotics ameliorates survival in sepsis. Stem Cell Res Ther. 2015;6:199. doi:10.1186/s13287-015-0192-0
28. Krasnodembskaya A, Song Y, Fang X, et al. Antibacterial effect of human mesenchymal stem cells is mediated in part from secretion of the antimicrobial peptide LL-37. Stem Cells. 2010;28(12):2229–2238. doi:10.1002/stem.544
29. Kouroupis D, Best TM, Kaplan LD, Correa D, Griswold AJ. Single-Cell RNA-sequencing identifies infrapatellar fat pad macrophage polarization in acute synovitis/fat pad fibrosis and cell therapy. Bioengineering. 2021;8:11.
30. Kosaric N, Srifa W, Bonham CA, et al. Macrophage subpopulation dynamics shift following intravenous infusion of mesenchymal stromal cells. Mol Ther. 2020;28(9):2007–2022. doi:10.1016/j.ymthe.2020.05.022
31. Kim MJ, Wainwright HC, Locketz M, et al. Caseation of human tuberculosis granulomas correlates with elevated host lipid metabolism. EMBO Mol Med. 2010;2(7):258–274. doi:10.1002/emmm.201000079
32. Furuhashi M, Saitoh S, Shimamoto K, Miura T. Fatty acid-binding protein 4 (FABP4), pathophysiological insights and potent clinical biomarker of metabolic and cardiovascular diseases. Clin Med Insights Cardiol. 2014;8:23–33. doi:10.4137/CMC.S17067
33. Furuhashi M, Fuseya T, Murata M, et al. Local production of fatty acid-binding protein 4 in epicardial/perivascular fat and macrophages is linked to coronary atherosclerosis. Arterioscler Thromb Vasc Biol. 2016;36(5):825–834. doi:10.1161/ATVBAHA.116.307225
34. Lv J, Wu ZL, Gan Z, Gui P, Yao SL. CXCL14 overexpression attenuates sepsis-associated acute kidney injury by inhibiting proinflammatory cytokine production. Mediators Inflamm. 2020;2020:2431705. doi:10.1155/2020/2431705
35. Culemann S, Gruneboom A, Nicolas-Avila JA, et al. Locally renewing resident synovial macrophages provide a protective barrier for the joint. Nature. 2019;572(7771):670–675. doi:10.1038/s41586-019-1471-1
36. Li Y, Feng J, Song S, et al. gp130 controls cardiomyocyte proliferation and heart regeneration. Circulation. 2020;142(10):967–982. doi:10.1161/CIRCULATIONAHA.119.044484
37. Du J, Flynn R, Paz K, et al. Murine chronic graft-versus-host disease proteome profiling discovers CCL15 as a novel biomarker in patients. Blood. 2018;131(15):1743–1754. doi:10.1182/blood-2017-08-800623
38. Dong L, Chen C, Zhang Y, et al. The loss of RNA N(6)-adenosine methyltransferase Mettl14 in tumor-associated macrophages promotes CD8(+) T cell dysfunction and tumor growth. Cancer Cell. 2021;39(7):945–957 e910. doi:10.1016/j.ccell.2021.04.016
39. Zhu L, Yang T, Li L, et al. TSC1 controls macrophage polarization to prevent inflammatory disease. Nat Commun. 2014;5:4696. doi:10.1038/ncomms5696
40. Patidar M, Yadav N, Dalai SK. Interleukin 15, A key cytokine for immunotherapy. Cytokine Growth Factor Rev. 2016;31:49–59. doi:10.1016/j.cytogfr.2016.06.001
41. Fiorenza MF, Marey MA, Rashid MB, et al. Neutrophils recognize and amplify IFNT signals derived from day 7 bovine embryo for stimulation of ISGs expression in vitro, A possible implication for the early maternal recognition of pregnancy. Biochem Biophys Res Commun. 2021;553:37–43. doi:10.1016/j.bbrc.2021.03.037
 © 2023 The Author(s). This work is published and licensed by Dove Medical Press Limited. The full terms of this license are available at https://www.dovepress.com/terms.php and incorporate the Creative Commons Attribution - Non Commercial (unported, v3.0) License.
By accessing the work you hereby accept the Terms. Non-commercial uses of the work are permitted without any further permission from Dove Medical Press Limited, provided the work is properly attributed. For permission for commercial use of this work, please see paragraphs 4.2 and 5 of our Terms.
© 2023 The Author(s). This work is published and licensed by Dove Medical Press Limited. The full terms of this license are available at https://www.dovepress.com/terms.php and incorporate the Creative Commons Attribution - Non Commercial (unported, v3.0) License.
By accessing the work you hereby accept the Terms. Non-commercial uses of the work are permitted without any further permission from Dove Medical Press Limited, provided the work is properly attributed. For permission for commercial use of this work, please see paragraphs 4.2 and 5 of our Terms.