")
Back to Journals » Cancer Management and Research » Volume 10
CCNA2 acts as a novel biomarker in regulating the growth and apoptosis of colorectal cancer
Authors Gan Y, Li Y, Li T, Shu G, Yin G
Received 11 June 2018
Accepted for publication 1 September 2018
Published 31 October 2018 Volume 2018:10 Pages 5113—5124
DOI https://doi.org/10.2147/CMAR.S176833
Checked for plagiarism Yes
Review by Single anonymous peer review
Peer reviewer comments 2
Editor who approved publication: Dr Antonella D'Anneo
Yaqi Gan,1,2,* Yimin Li,1,2,* Tong Li,1,2 Guang Shu,2 Gang Yin1,2
1Department of Pathology, Xiangya Hospital, Central South University, Changsha, Hunan Province, China; 2Department of Pathology, School of Basic Medical Sciences, Central South University, Changsha, Hunan Province, China
*These authors contributed equally to this work
Objective: Colorectal cancer (CRC) is considered to be the most prevalent malignant tumors that contribute to high cancer-related mortality. However, the signaling pathways involved in CRC and CRC-driven genes are largely unknown. We seek to discover a novel biomarker in CRC.
Materials and methods: All clinical CRC samples (n=33) were from Xiangya Hospital. We first selected CCNA2 by integrated bioinformatics analysis of four GSE databases. Next, the expression of CCNA2 in tissues and cell lines was verified by quantitative real-time PCR. The effects of CCNA2 on cell growth, proliferation, cell cycle, and apoptosis were examined by in vitro assays.
Results: We identified 498 shared DEGs (294 upregulated and 204 downregulated), and the top ten hub genes were selected by integrated analysis. These hub genes were significantly overexpressed in CRC samples and were positively correlated. Our data revealed that the expression of CCNA2 in CRC tissues is higher than that in normal tissues. The CCNA2 knockdown could significantly suppress CRC cell growth by impairing cell cycle progression and inducing cell apoptosis.
Conclusion: CCNA2, as a novel oncogenic gene, plays a role in regulating cancer cell growth and apoptosis. It could be used as a new biomarker for diagnosis and therapy in CRC.
Keywords: CCNA2, colorectal cancer, bioinformatics analysis, proliferation, cell cycle, apoptosis
Introduction
Colorectal cancer (CRC) is not only the most common malignant tumor in the digestive system but also the major cause of cancer-related death in the world.1 According to the annual report of Cancer Facts & Figures 2017, there are 0.14 million new cases of CRC patients in the US in 2017, accounting for 43.625% of gastrointestinal cancers.2 In addition, CRC caused ~50,000 deaths in 2017, accounting for 31.87% of death caused by gastrointestinal cancers.2 The Global Cancer Statistic showed that there are 1.36 million new CRC patients each year around the world. CRC malignant tumors have the third highest occurrence in the world, ranking third in males and second in females. Also, CRC has caused ~0.69 million deaths, and the mortality rates are still increasing in developed countries.3–6 It is worth noting that while the 5-year survival rates of CRC patients are still rising in some populations and countries, the morbidity and mortality rates remain very high due to cancer recurrence and metastasis.7–10 A large number of studies have reported that the screening and early detection of CRC are deemed to be crucial for improving survival rate.3,11 So far, the main clinical screening methods for CRC involve endoscopic screening, particularly colonoscopy;12–15 colonoscopy comprises shortcomings such as the poor patient compliance, the influence of family history,16,17 inconvenience, and high cost and risk.18,19 Therefore, it is emergent to find an effective early diagnostic strategy to detect relapse and monitor CRC progression.11
Due to the high heterogeneity of CRC, researchers are exploring biomarkers that could indicate the specific cancer subtype and prognosis of CRC in recent decades.20 Until now, several biomarkers have been discovered in a wide range of cancers. Yes-associated protein (YAP), for example, is a newly found downstream effector molecule of Hippo,21,22 and the Hippo pathway can function in tumor suppression. Many studies have shown that YAP is an oncogenic gene, which is highly expressed in various tumors and can regulate tumor progression.23–25 Nuclear YAP can promote cancer cell proliferation, apoptosis, metastasis, and maintenance of stemness by interacting with other transcription factors and affecting tumor progression. Therefore, YAP has the prospect of being a new tumor biomarker or therapeutic target for CRC. During the past few decades, the high-throughput sequencing technology has been widely used in the life sciences.26 The widespread use of high-throughput sequencing has rendered a large amount of core slice data stored in public databases, which can provide valuable clues for novel researches after being integrated and re-analyzed. In this analysis, we chose GSE21815, GSE32323, GSE44076, and GSE74602 from Gene Expression Omnibus ([GEO], https://www.ncbi.nlm.nih.gov/geo), and used the GEO2R (https://www.ncbi.nlm.nih.gov/geo/geo2r/) online tool to detect differentially expressed genes (DEGs). Gene ontology (GO) and pathway enrichment analyses were performed using the Database for Annotation, Visualization and Integrated Discovery (DAVID) to screen DEGs. Next, we established a protein–protein interaction (PPI) network for DEGs and selected ten core genes that have a high degree of connectivity (http://string-db.org). The potential correlation and expression level were analyzed via Gene Expression Profiling Interactive Analysis (GEPIA) (http://gepia.cancer-pku.cn/index.html). Our data showed that the expression of CCNA2 is significantly higher in CRC tissues compared with the normal tissues. The cell cycle progression could be slowed and the apoptosis could be induced by knockdown of CCNA2, which directly leads to inhibition of growth of CRC cells. In conclusion, CCNA2 can be used as a new diagnostic indicator and guide the combined treatment of CRC.
Materials and methods
Microarray data
Array data of GSE21815, GSE32323, GSE44076, and GSE7460226–28 were downloaded from the Gene Expression Omnibus database, which is a freely accessible database. Microarray data from GSE21815 included 131 CRC tissues and nine normal colon tissues. The GSE32323 data included 17 paired CRC tumors and adjacent noncancerous tissues. The GSE44076 data included 98 paired normal adjacent mucosa and tumor samples. And the GSE74602 data included 30 paired normal and tumor colorectal samples.
Data processing of DEGs
GEO2R was used to analyze DEGs between CRC tissues and noncancerous tissues.29 GEO2R is an interactive online tool which can compare several groups of samples in GEO sequences and analyze nearly any GEO series with a gene symbol. The Benjamini and Hochberg (BH) false discovery rate method of default was corrected for the occurrence of false-positive results according to adjusted P-values. Adjusted P-values <0.05 and |logFC| ≥1.5 were set as the cutoff standards. We extracted 8,843, 2,606, 2,678, and 1,674 DEGs from the expression profile data sets GSE21815, GSE32323, GSE44076, and GSE74602.
GO and Kyoto Encyclopedia of Genes and Genomes (KEGG) pathway analyses of DEGs
GO analysis is a universally useful method for gene annotation and gene products.30 The KEGG is a collection of databases for associating related gene sets with the pathways they are involved in.31 The Database for Annotation, Visualization and Integrated Discovery (DAVID, https://david.ncifcrf.gov/) is an online bioinformatics program that provides tools for functionally explaining biological processes and a large quantity of genes or proteins.32 P values <0.05 and PBH values <0.05 were set as the cutoff standards. We chose DAVID to analyze the core biological processes, cellular components, molecular functions, and pathways among these DEGs.
PPI network and module analysis
The Search Tool for the Retrieval of Interacting Genes (STRING) was employed to identify DEG-encoded proteins and their PPI networks.33 We first mapped the DEGs into STRING to identify the potential relationships among these DEGs. A confidence score of ≥0.4 and the maximum number of interactions =0 were set as the cutoff standards. Then, we downloaded the TSV files and used Cytoscape34 to analyze those files. In these DEGs, the top ten genes that had a high degree of connectivity were selected as hub genes. At the same time, the Molecular Complex Detection (MCODE) app in Cytoscape was used to analyze the PPI network modules. In addition, cutoff =2, node score cutoff =0.2, k-core =2, and max depth =100 was set as cutoff standards. The top three modules were selected. KEGG pathway analysis of genes in different modules was performed by DAVID.
Comparison of the hub gene expression levels and their relationship
GEPIA is a recently developed interactive web server used to explore the large data sets from the The Cancer Genome Atlas (TCGA) and The Genotype- Tissue Expression (GTEx) projects.35 It provides a common task, such as analysis of DEGs based on the comparison of tumor and normal samples. In this study, GEPIA was used to analyze the relative expression levels of hub genes in CRC tissues and nontumorous tissues. Boxplots were used to compare the gene expressions in colon adenocarcinoma (COAD) and rectum adenocarcinoma (READ), and the correlation was used to visualize the relationships among these ten genes.
Validation based on clinical samples from CRC
To further verify the data from GEO, we conducted quantitative real-time PCR (qRT-PCR) to quantify the expression level of CCNA2 in clinical CRC patient samples (n=33) from Xiangya Hospital (Central South University, Changsha, China). Written informed consents were obtained from all patients. This study was approved by the Institute Research Ethics Committee of Xiangya Hospital.
Cell lines and cell transfection
All cell lines, including normal cell line NCM460, and CRC cell lines HT-29, HCT116, SW620, and SW480 were purchased from the American Type Culture Collection. The cells were cultured in RPMI-1640, supplemented with 10% FBS (Thermo Fisher Scientific, Waltham, MA, USA). All cells were maintained in a humidified incubator with 5% CO2 at 37°C.
A total of 5 ×10⁵ cells/mL were plated about 24 hours before transfection. Once cells were at 40%–60% confluence, in each well of a six-well plate, cells were transfected with 50 nM of siRNA/NC (RiboBio, Guangzhou, China) using Lipofectamine 2000 (Thermo Fisher Scientific) at indicated concentrations according to the manufacturer’s instructions. Six hours later, the culture medium was replaced with fresh medium containing 10% FBS. The cells were harvested after 24 hours of transfection for the following assays.
siRNA sequences are as follows
Si-h-CCNA2_001: forward, 5′-GCUGUGAACUACAUUGAUA dTdT-3′; reverse, 3′-dTdT UAUCAAUGUA GUUCACAGC-5′.
Si-h-CCNA2_002: forward, 5′-GGUCCCUCUUGAUUAUCCA dTdT-3′; reverse, 3′-dTdT UGGAUAAUCAAGAGGGACC-5′.
RNA extraction, reverse transcription (RT)-PCR, and qRT-PCR
Total RNAs from cells were extracted using TRIzol reagent (Thermo Fisher Scientific). Reverse-transcribed complementary DNA was synthesized using the GoScript Reverse Transcription System (Promega Corporation, Fitchburg, WI, USA). The RT-PCR conditions were 42°C for 15 minutes, 70°C for 15 minutes, and 4°C hold. After the dilution of cDNA with Nuclease-free water by 1:4, qRT-PCR was performed by the Applied Biosystems 7500 Real-Time PCR System and the GoTaq qPCR Master Mix (Promega Corporation, A6001). The mixes were predenaturated at 95°C for 10 minutes, followed by 40 cycles of denaturation at 95°C for 15 seconds, and 60°C for 1 minute. The results were normalized to GAPDH expression. The relative expression level of CCNA2 was calculated by the 2−ΔΔCt method.
The primers used for qRT-PCR were as follows: CCNA2-forward, 5′-GCATGTCACCGTTCCTCCTT-3′; and reverse, 5′-GGGCATCTTCACGCTCTATTT-3′; GAPDH forward, 5′-GCACCGTCAAGGCTG AGAAC-3′; and reverse, 5′-TGGTGAAGACGCCAGTGGA-3′.
Cell proliferation assay
For cell proliferation analysis, 5,000 living cells seeded on 96-well plates were transfected with siCCNA2 001, 002 or an siRNA control. After 48 hours, cell growth was determined at 0, 1, and 2 days by Cell Counting Kit-8 ([CCK-8]; Dojindo Chemical Laboratories, Kumamoto, Japan). Viable cells were measured with CCK-8 reagent 10 µL/well, incubated at 37°C for 2 hours, and then the optical density values were measured at a wavelength of 450 nm using a Bio-Rad iMark™ Microplate Absorbance Reader (Bio-Rad Laboratories Inc., Hercules, CA, USA).
Colony formation assay
Forty-eight hours after SW480 cells were infected with siRNA, about 500 cells were seeded on each well of a six-well plate. The cells were allowed to incubate at 37°C for 10 days. Cells were fixed, stained with crystal violet, and photographed. ImageJ (1.48 u; National Institutes of Health, Bethesda, MA, USA) was used to count the number of clones per well.
Cell cycle analysis
Forty-eight hours after siRNA interference, SW480 cells were harvested, centrifuged, and resuspended in 1× PBS. The cells were fixed in 70% ethanol overnight. On the second day, after being washed by 1× PBS solution and centrifuged, cells were resuspended in 1× PBS solution and incubated with RNAse A at 37°C for 30 minutes. Finally, cells were then stained with propidium iodide and analyzed by FACSCalibur system (BD Biosciences, San Jose, CA, USA).
Apoptosis analysis
SW480 cells were infected with siRNA for 48 hours and was harvested and centrifuged. Then the supernatant was removed and resuspended in 1× PBS solution. This procedure was repeated thrice in 1×10⁶ cells per unit well, then stained by Annexin V/FITC and PI kit. After staining, the cells were analyzed in a FACS Calibur system (BD Biosciences).
Statistical analysis
All experiments were performed at least three times and each independent test was carried out in triplicate for each condition under the protocol and according to the manufacturer’s instructions. All statistical analyses were performed using PASW Statistics 19.0 (IBM, Chicago, IL, USA) or GraphPad Prism 6 software (GraphPad Software, Inc., La Jolla, CA, USA).
Results
Identification of DEGs
Gene expression profiles from GSE21815, GSE32323, GSE44076, and GSE74602 of CRC and normal or adjacent mucous tissues were used in this study. The microarray data of GSE21815 included 131 CRC tissues and nine normal colon tissues.27 The GSE32323 data included 17 paired CRC tumors and adjacent noncancerous tissues.28 The GSE44076 data included 98 paired normal adjacent mucosa and tumor samples,29 and the GSE74602 data had 30 paired normal and tumor colorectal samples. The GEO2R online analysis tool was used to detect DEGs; by using an adjusted P-value <0.05 and |logFC| ≥1.0 as the cutoff criteria, we extracted 8843, 2606, 2678, and 1674 DEGs from the expression profile datasets GSE21815, GSE32323, GSE44076, and GSE74602, respectively. A total of 498 consistently expressed genes were identified from the four profile data sets, in which 294 were upregulated genes and 204 were downregulated genes in CRC tissues, compared to normal colon tissues (Figure 1A and B).
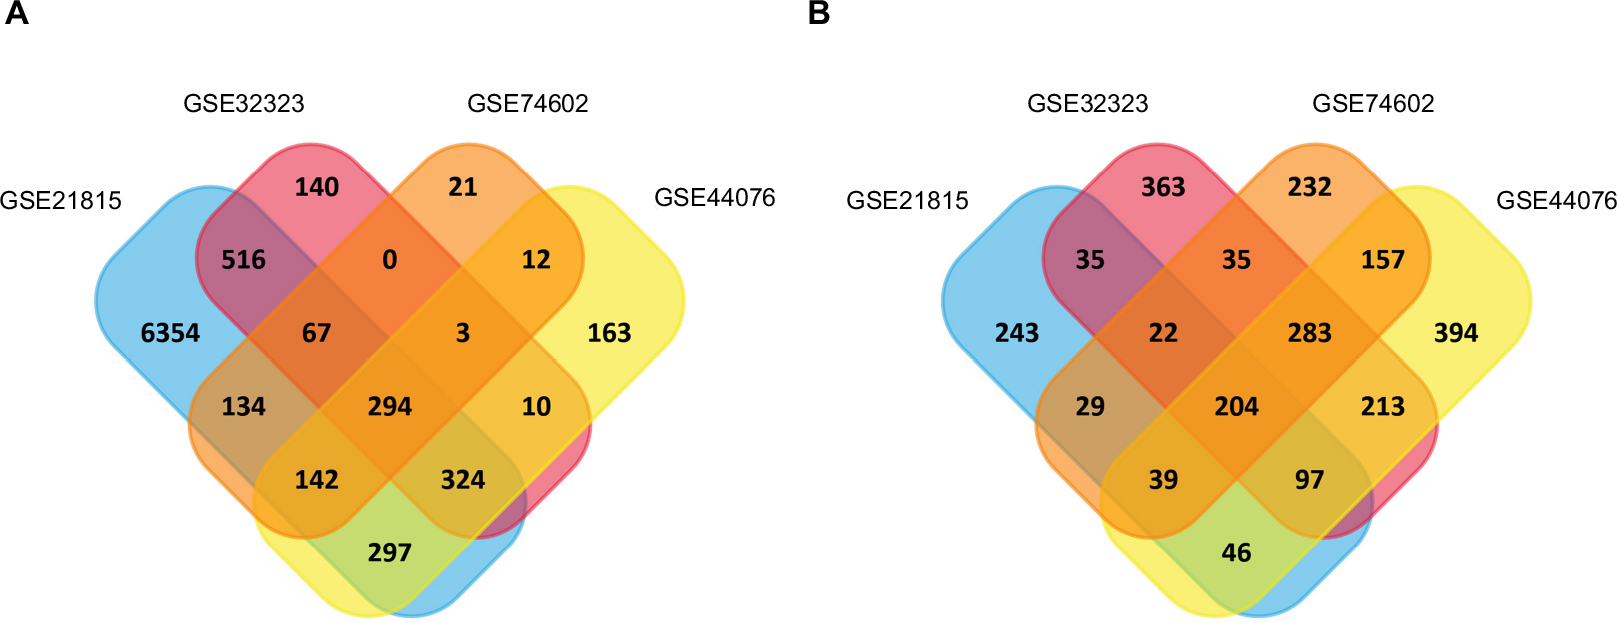 | Figure 1 Identification of synchronized upregulated genes (294 DEGs, A) and downregulated genes (204 DEGs, B) from the four cohort profile data sets (GSE21815, GSE32323, GSE44076, and GSE74602) using Funrichnew software. Notes: The different color areas represent different data sets. The cross-sectional areas mean the synchronized and changed DEGs. |
GO function and KEGG pathway enrichment analyses in CRC
To further understand the selected DEGs, GO function and KEGG pathway enrichment analyses were applied by using DAVID. After all the DEG data were input into DAVID software, it turned out that they can be classified into three major functional groups: biological process, cellular component, and molecular function (Table 1). As shown in Table 1, in the biological process group, upregulated genes were mainly enriched in mitotic cell cycle processes, mitotic cell cycle, cell cycle processes, mitotic nuclear division, and cell cycle, and the downregulated genes were mainly enriched in ion homeostasis, inorganic ion homeostasis, chemical homeostasis, cation homeostasis, and cellular cation homeostasis. For GO cell component analysis, the upregulated DEGs were enriched in nucleoplasm, chromosome, chromosomal part, chromosomal region, and condensed chromosome, and the downregulated DEGs were enriched in the extracellular region, apical part of the cell, extracellular vesicles, and extracellular organelles. In addition, molecular function analysis showed that the upregulated DEGs were significantly enriched in ATP binding, adenyl nucleotide binding, adenyl ribonucleotide binding, purine ribonucleoside triphosphate binding, and purine ribonucleoside binding, while the downregulated DEGs were enriched in carbonate dehydratase activity, oxidoreductase activity, acting on CH-OH group of donors, carboxylic ester hydrolase activity, hormone activity, and hydro-lyase activity.
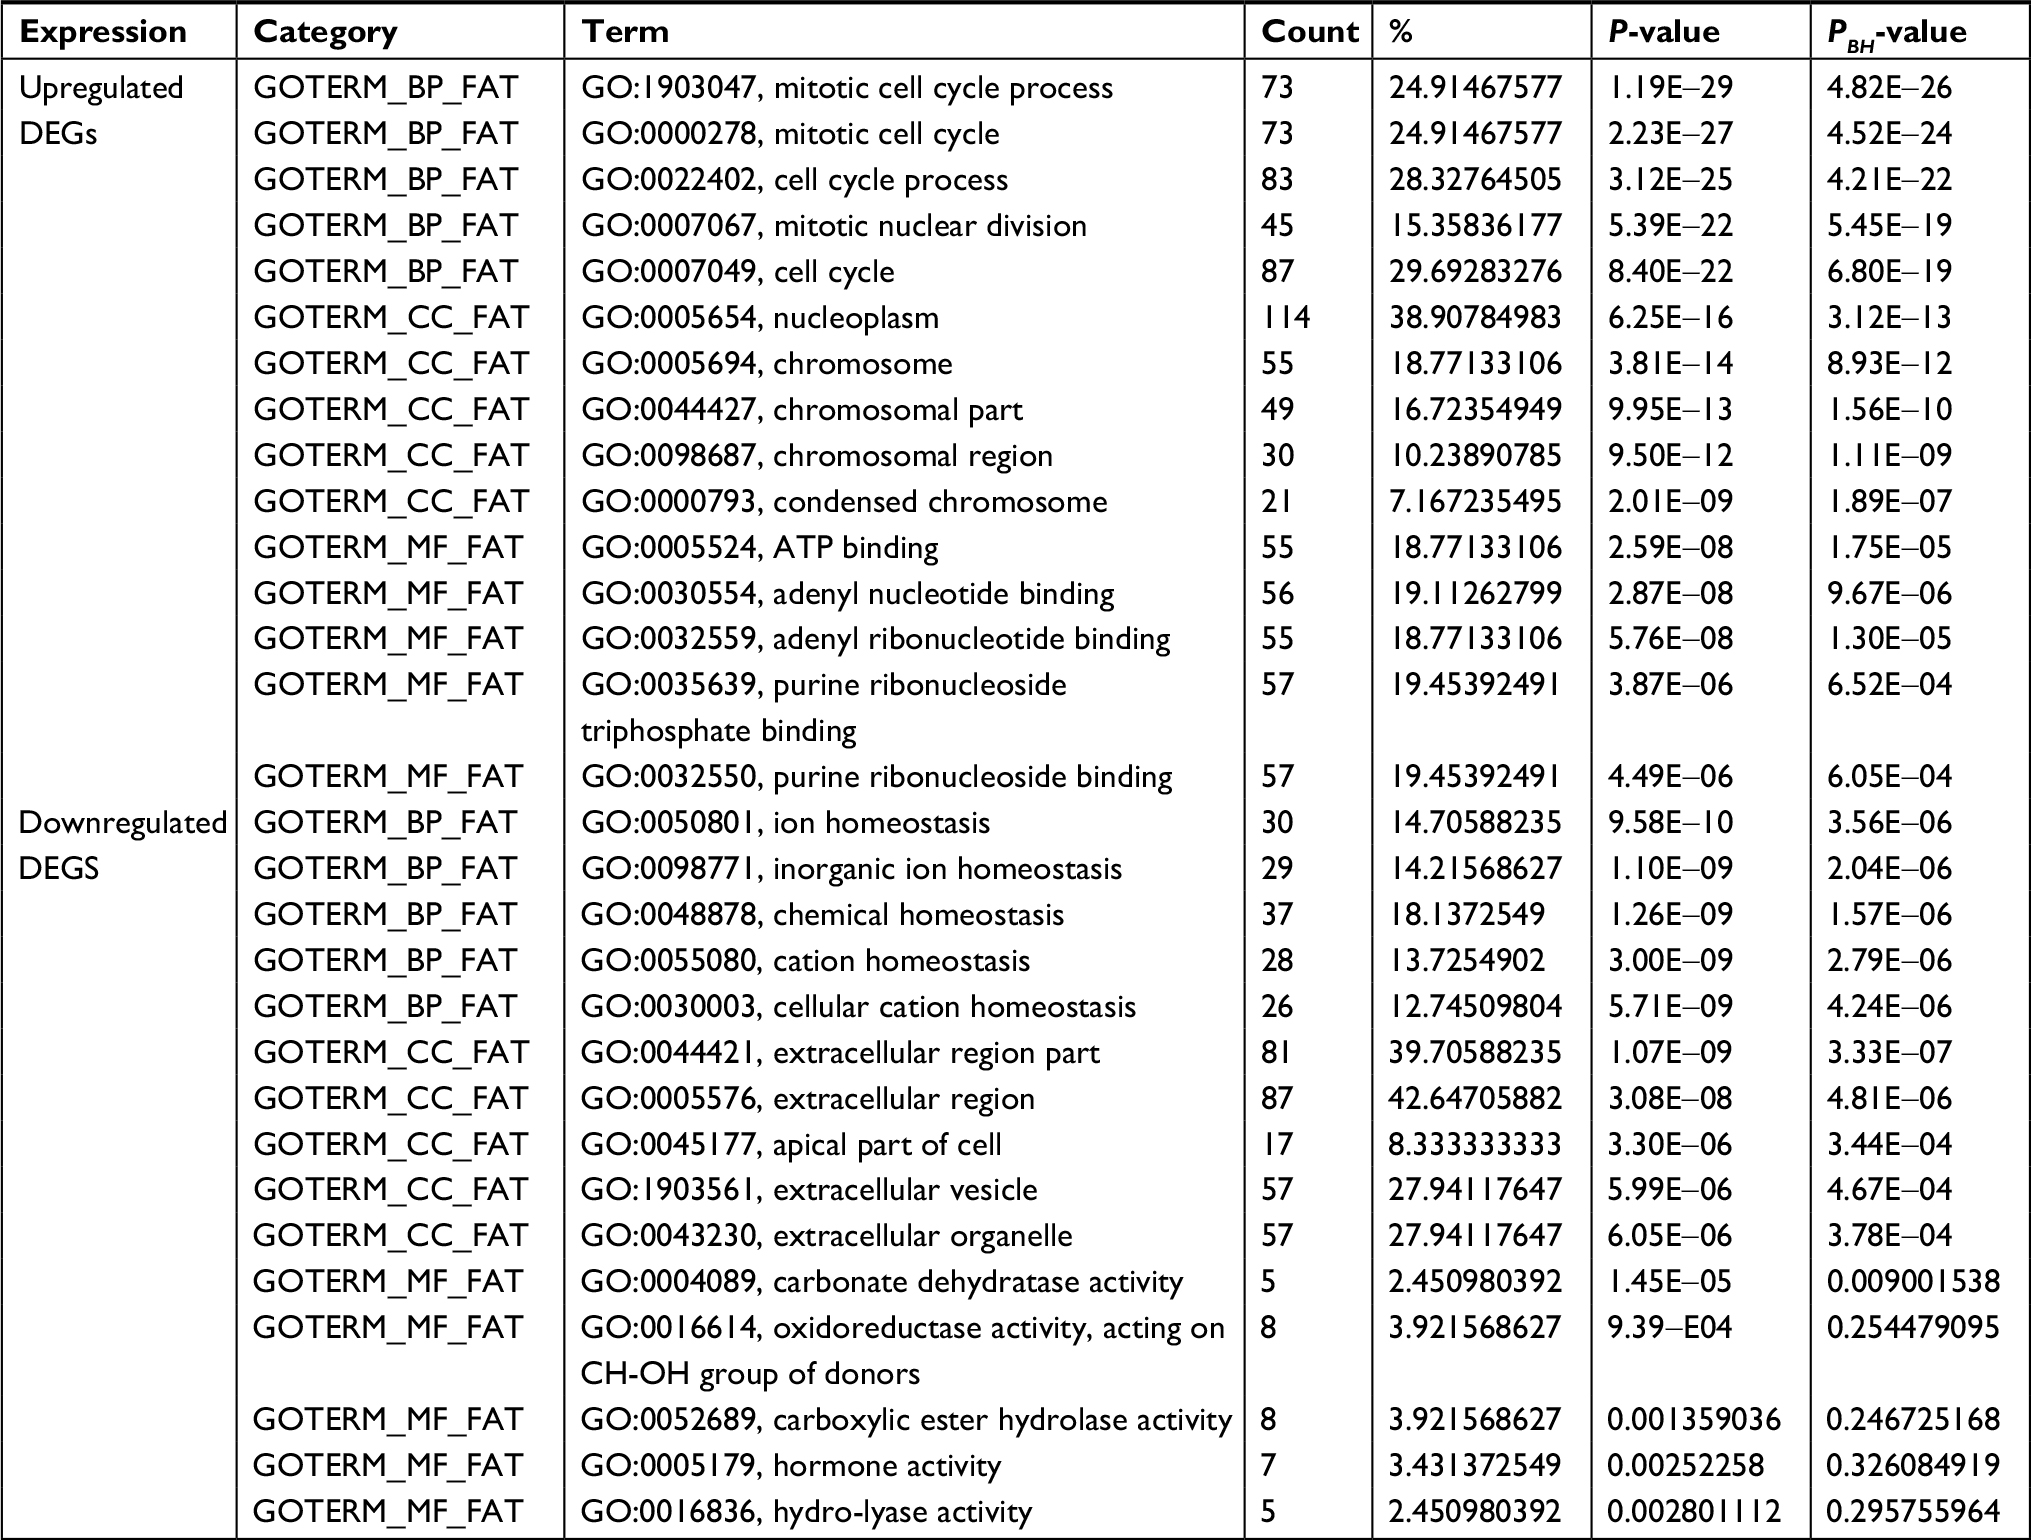 | Table 1 GO analysis of DEGs associated with CRC Notes: P-values were calculated by Fisher’s exact test. PBH values were adjusted by BH method. Abbreviations: BH, Benjamini and Hochberg; BP, biological process; CC, cell component; CRC, colorectal cancer; DEGs, differentially expressed genes; GO, gene ontology; MF, molecular function. |
Table 2 lists the most significantly enriched KEGG pathways for the upregulated and downregulated DEGs. The upregulated DEGs were enriched in cell cycle, DNA replication, and mismatch repair (MMR), while the downregulated DEGs were enriched in mineral absorption, aldosterone-regulated sodium reabsorption, pancreatic secretion, nitrogen metabolism, and proximal tubule bicarbonate reclamation.
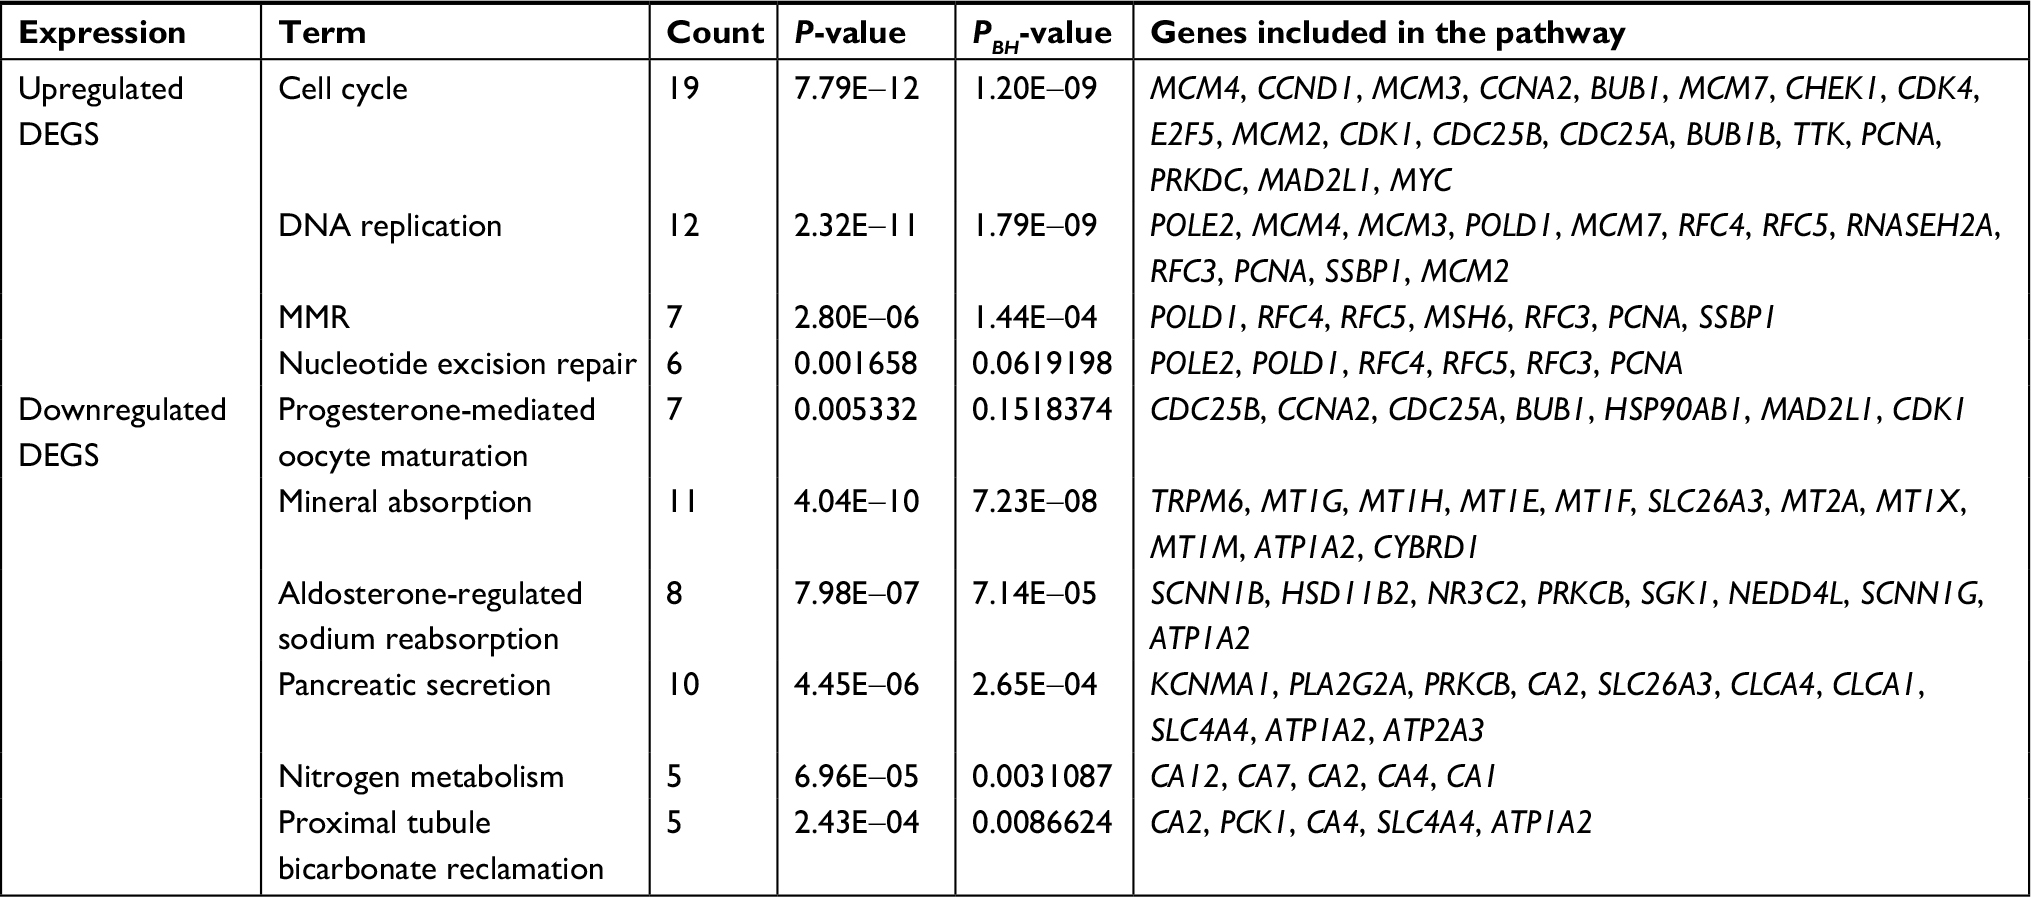 | Table 2 KEGG pathway analysis of DEGs associated with CRC Notes: P-values were calculated by Fisher’s exact test. PBH values were adjusted by BH method. Abbreviations: CRC, colorectal cancer; DEGs, differentially expressed genes; KEGG, Kyoto Encyclopedia of Genes and Genomes; MMR, mismatch repair. |
Hub genes and module screening from PPI network and modular analyses
Using the STRING online database and Cytoscape software, a total of 363 DEGs from the 498 synchronously altered DEGs were filtered into the DEG PPI network complex, and 135 of the 498 DEGs did not fall into the DEG PPI network. Among the 363 DEGs, we constructed a PPI network of the top ten hub genes that have increased connectivity (Figure 2), which comprises TOP2A, CDK1, PCNA, MAD2L1, RFC4, CCNA2, BUB1, PAICS, AURKA, and CHEK1. These ten hub genes are listed from the largest to the smallest degree. In order to detect significant modules in this PPI network, we used the MCODE plug-in, by which three modules with the highest degree of importance were selected (Figure 3). KEGG pathway enrichment analysis showed that Module 1 was mainly associated with cell cycle, DNA replication, oocyte meiosis, and nucleotide excision repair, Module 2 was mostly linked with ribosome biogenesis in eukaryotes, and Module 3 was primarily connected with chemokine signaling pathway and tumor necrosis factor signaling pathway. Meanwhile, we input ten hub genes into the DAVID software. GO analysis showed that these genes were particularly enriched in the mitotic cell cycle checkpoint, negative regulation of mitotic cell cycle, cell cycle checkpoint, negative regulation of cell cycle, and regulation of mitotic cell cycle (Table S1). KEGG analysis showed that these genes were enriched in cell cycle, progesterone-mediated oocyte maturation, and oocyte meiosis (Table S2).
 | Figure 2 The PPI network of top ten hub genes. Abbreviation: PPI, protein–protein interaction. |
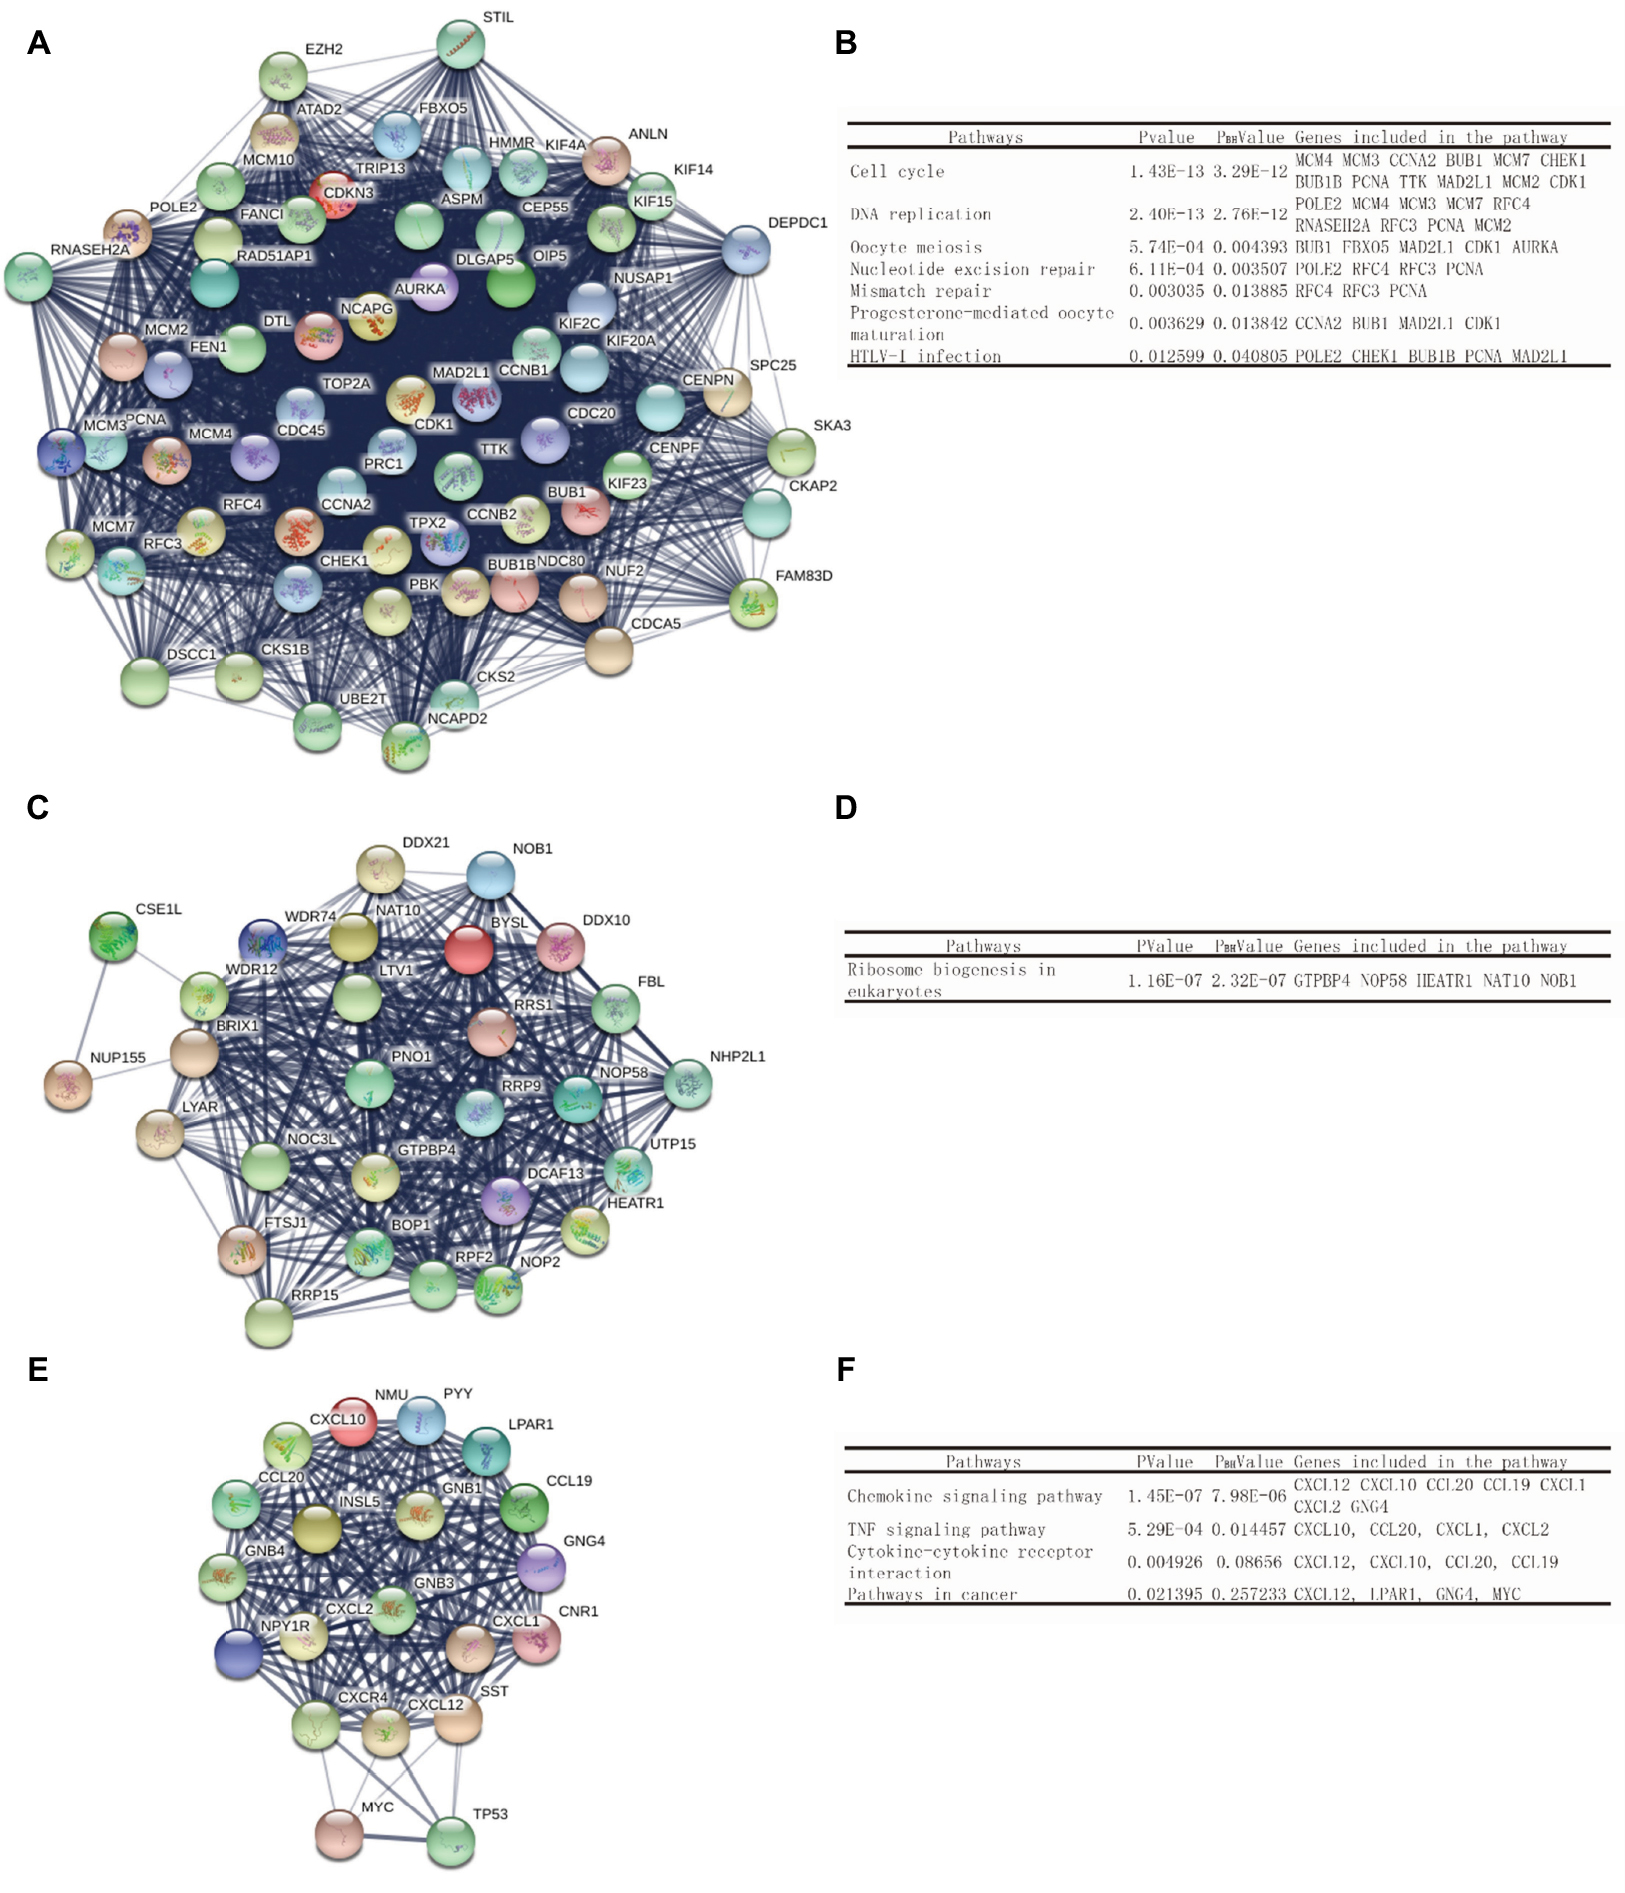 | Figure 3 Top three modules of the PPI network. Notes: (A) Module 1. (B) The enriched pathways of Module 1. (C) Module 2. (D) The enriched pathways of Module 2. (E) Module 3. (F) The enriched pathways of Module 3. Abbreviation: PPI, protein–protein interaction. |
The expression level and correlation analyses of the ten hub genes in GEPIA
GEPIA is an interactive online server for exploring the large data sets from the TCGA and the GTEx projects. To confirm the reliability of the ten identified hub genes from the four data sets, we used GEPIA to verify the correlation between them, and they were obviously positively correlated with each other in CRC (Figure 4A). GEPIA was also used to figure out the expression levels of the ten genes in CRC. Figure 4B shows that these genes were all significantly overexpressed in colon cancer (COAD) and rectal cancer (READ) samples compared to the normal samples.
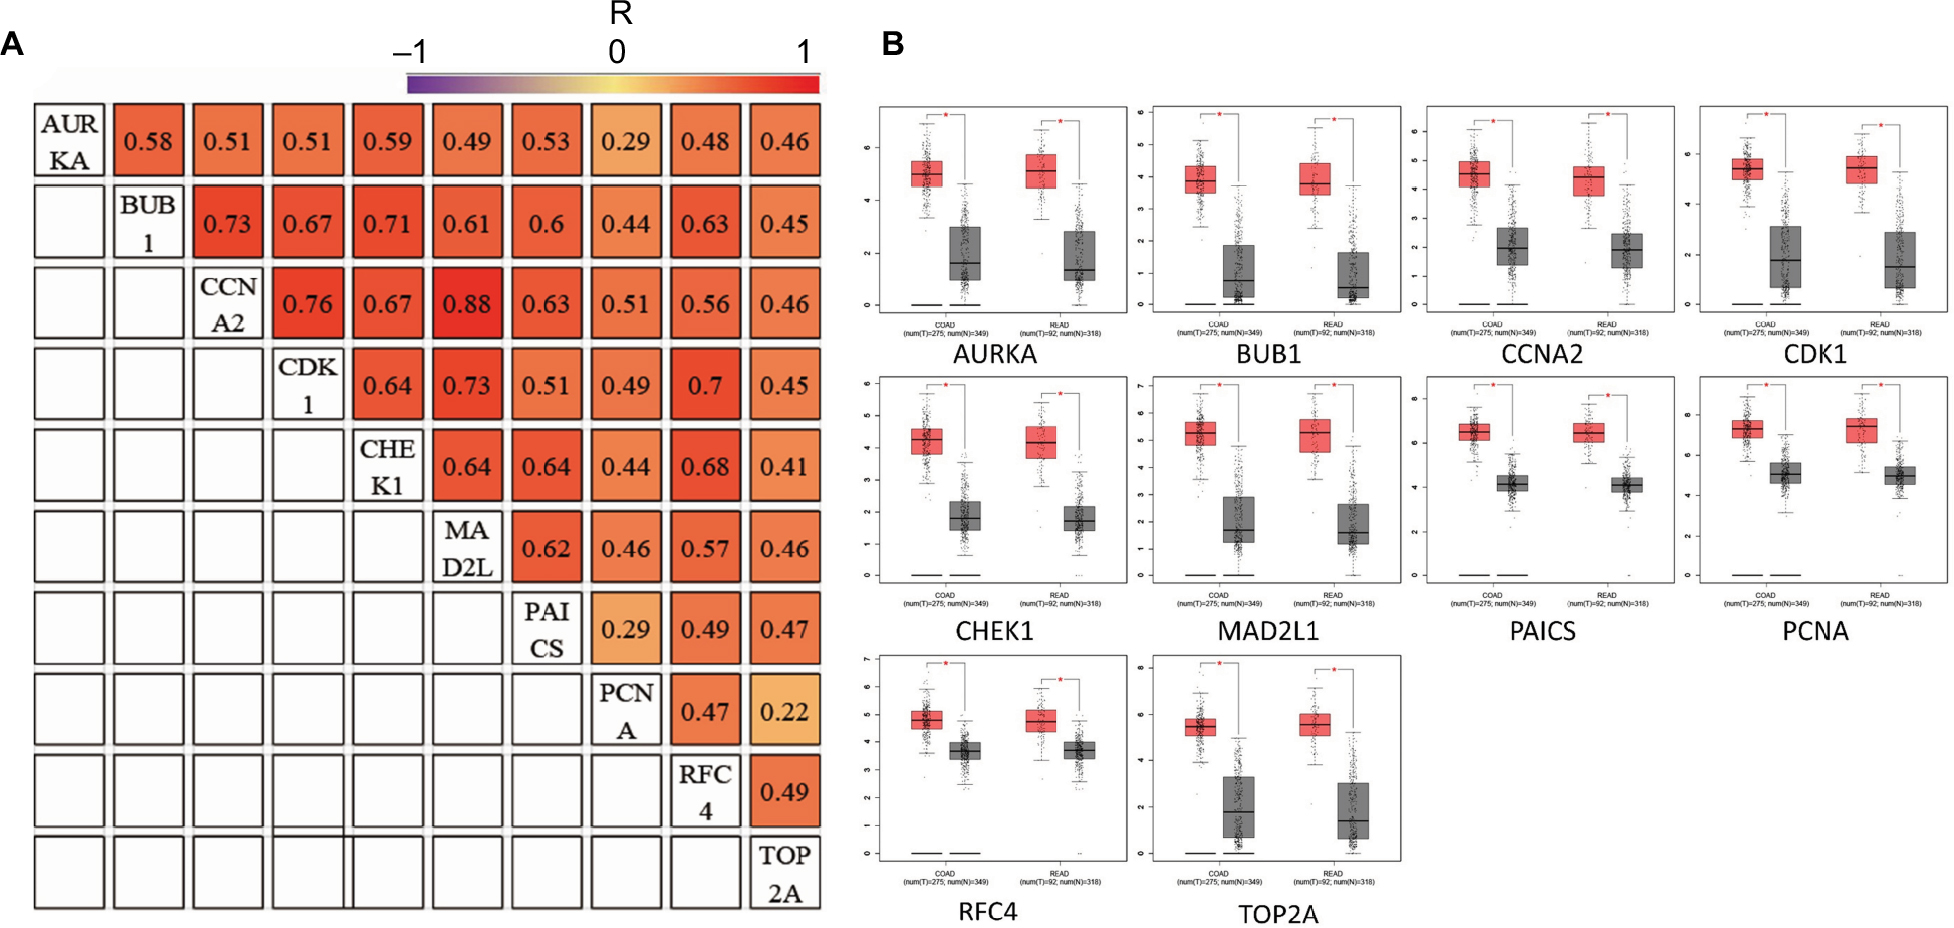 | Figure 4 (A) The correlation analysis of the ten hub genes. (B) Expression levels of the ten hub genes in COAD and READ compared to the normal samples. Notes: R is the Pearson correlation coefficient. *P<0.05. Abbreviations: COAD, colon adenocarcinoma; READ, rectum adenocarcinoma. |
Expression patterns of CCNA2 in CRC
To identify the expression level of CCNA2 in CRC, we performed qRT-PCR to confirm the expression of CCNA2 in 33 paired clinical samples, in which the mean expression level of CCNA2 was notably higher in CRC tissues than that in normal tissues (Figure 5A). Next, we measured the expression of CCNA2 in various cell lines, including the normal cell line NCM460 and CRC cell lines HT-29, HCT116, SW620, and SW480. The expression of CCNA2 was higher in tumor cells than that in normal cells (Figure 5B), which is similar to the results from the four datasets in GEO, GEPIA, suggesting that our results on these genes are reliable.
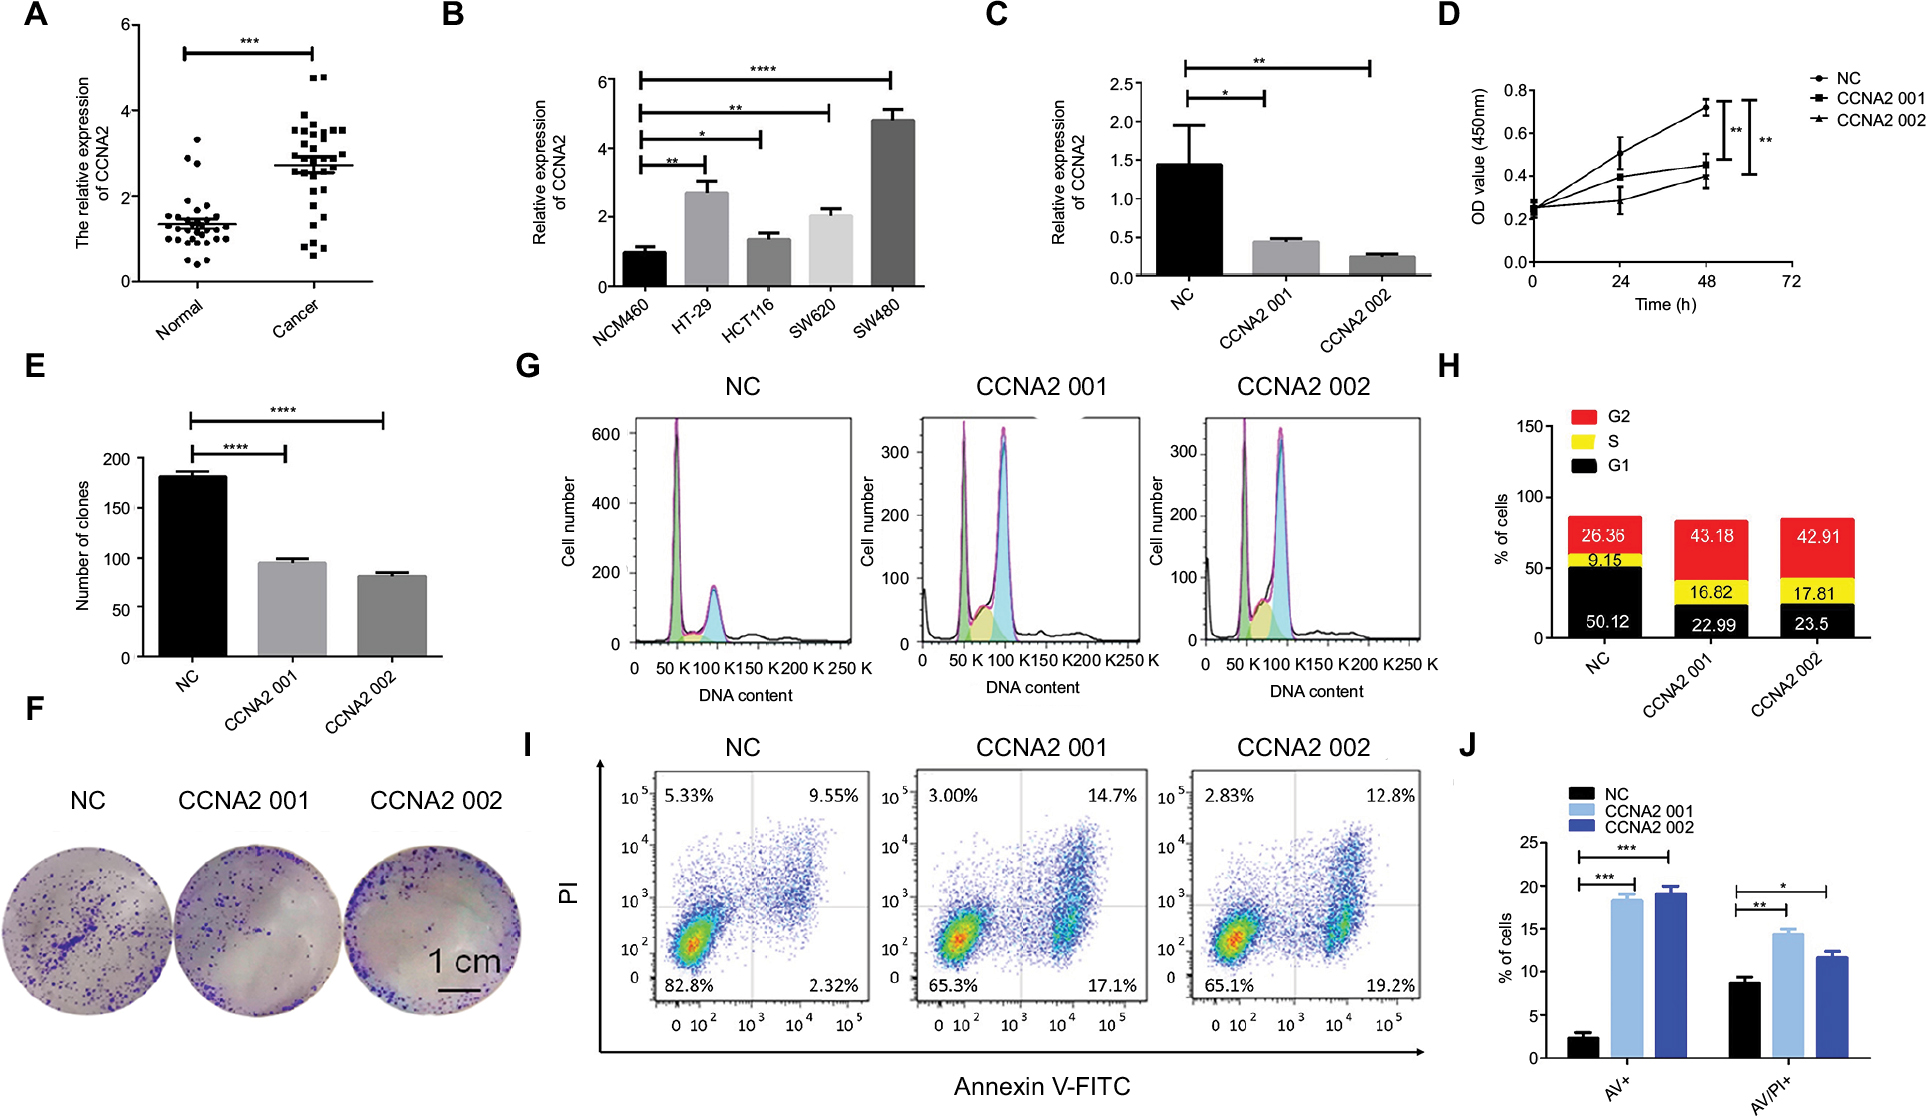 | Figure 5 CCNA2 knockdown suppressed colon cancer cell proliferation by impairing cell cycle progression and inducing apoptosis. Notes: (A) Expression level of CCNA2 gene in 33 paired CRC tissues (n=3; ***P<0.001; two-tailed t-test). (B) Expression level of CCNA2 gene in colon normal cell line NCM460 and CRC cell lines HT-29, HCT116, SW620, and SW480 (n=3; *P<0.05, **P<0.01, ***P<0.001, ****P<0.0001; two-tailed t-test). (C) Expression level of CCNA2 were examined after siRNA transfection in SW480 cells (n=3; *P<0.05, **P<0.01; two-tailed t-test). (D) The cell proliferation rates were analyzed by CCK-8 assay. All values were mean±SD (n=3; **P<0.01; two-tailed t-test). € Graph illustrating quantified values (n=3; ****P<0.0001; two-tailed t-test). (F) Colony formation assays were performed. (G, H) Distribution of cells in three cell cycle phases was examined by flow cytometry assay, and the graph shows quantification for each phase. (I) For measurement of apoptotic cells, cells were stained with both AV and PI, and analyzed by an image flow assay. (J) Graph illustrating the quantification of apoptotic cells, AV+ means early apoptosis, AV/PI+ means late apoptosis (n=3; *P<0.05, **P<0.01, ***P<0.001; two-tailed t-test). Abbreviations: AV, Annexin V FITC; CRC, colorectal cancer; CCK-8, cell counting kit-8, PI, propidium iodide; NC, negative control. |
Knockdown of CCNA2 suppressed cell growth by impairing cell cycle progression and inducing cell apoptosis
To determine whether CCNA2 could be a therapeutic target in CRC, we inactivated CCNA2 by using siRNA in SW480 cell. We found that CCNA2 knockdown (Figure 5C), as compared to control knockdown, significantly inhibited cell proliferation (Figure 5D) and reduced cell numbers in SW480 cells (Figure 5E and F), which indicated that CCNA2 might promote cell proliferation. To examine how CCNA2 affects cell growth, the cell cycle phase distribution and apoptosis were analyzed by flow cytometric analysis. Knockdown of CCNA2 resulted in a decrease of cell percentage in the G1 phase, and an increase of cell percentage in the S phase and G2 phase (Figure 5G and H), which indicated that CCNA2 knockdown prevented cell passage from the G2 phase into M phase. Therefore, CCNA2 was shown to promote G2/M phase transition. Apoptosis assay results indicated that the apoptotic cells significantly increased in SW480 cells with si-CCNA2 transfection (Figure 5I and J). These data indicate that CCNA2 knockdown could impair cell cycle progression and induce cell apoptosis.
Discussion
Even with a progressive decrease in morbidity in the past few years, CRC is still the fourth leading cause of cancer-related death worldwide.1 The development and progression of CRC is a dynamic process, and the expression levels of some molecules differ across the different stages of CRC.24 Under this circumstance, the difficulty is increasing in early screening and diagnosis. Hence, it is essential to find sensitive and precise biomarkers of CRC.
In this analysis, GSE21815, GSE32323, GSE44076, and GSE74602 were selected from the GEO database. A total of 498 consistently expressed genes were identified from these four profile data sets, in which 294 were upregulated genes and 204 were downregulated genes in CRC tissues, compared to normal colon tissues. In order to have a deeper understanding of these selected DEGs, we performed the GO function and KEGG pathway analyses of these DEGs.
GO analysis showed that the upregulated DEGs were particularly enriched in mitotic cell cycle processes, mitotic cell cycle, nucleoplasm, chromosome, ATP binding, and adenyl nucleotide binding, while the downregulated DEGs were involved in ion homeostasis, inorganic ion homeostasis, extracellular regions, carbonate dehydratase activity, and oxidoreductase activity. In addition, the KEGG pathways for the upregulated DEGs included the cell cycle, DNA replication, and MMR, while the pathways of downregulated DEGs gathered in mineral absorption, aldosterone-regulated sodium reabsorption, and pancreatic secretion.
Analysis of the three selected modules of the PPI network showed that CRC was associated with cell cycle related pathway, DNA replication related pathway, and MMR related pathway. Overall, they were all associated with cell growth, cell invasion, cell proliferation, the cell cycle, and microsatellite instability (MSI), all of which play critical roles in the process of tumorigenesis.36 MSI tumors usually arise because of a genetic defect in the MMR genes which is one of the main DNA-repair systems. MMR is primarily involved in the post-replication elimination of base–base mismatches and insertion deletion loops (IDLs) that arise as a result of DNA polymerase slippage during DNA synthesis.37–39 MSI colorectal tumors accumulate mutations at microsatellite sequences in coding regions of genes implicated in tumor progression.39–42 MSI accounts for 10%–20% of CRCs and is the second most important model of colorectal carcinogenesis.41–43 The most common MMR genes with germline mutations are MSH2, MLH1, PMS2, and MSH6.41,42
Ten DEGs with high connectivity were selected as hub genes for PPI network analysis. Through analyzing the correlation and expression level in GEPIA, we determined that hub genes were obviously positively correlated and significantly overexpressed in CRC samples.
We searched PubMed literatures for associations among the ten hub genes in CRC. RFC4 and TOP2A are related to tumor progression and poor survival outcome through regulating on cell proliferation and the cell cycle in CRC.44,45 In addition, TOP2A was revealed to be a vital enzyme in DNA replication and a molecular target of topo II inhibitors which is a class of anticancer drugs.46 Overexpression of TOP2A is associated with resistance to chemotherapy by inhibition of apoptosis in CRC.47 CDK1 influences apoptosis by interacting with the iASPP/p53 apoptosis pathway48 or combined targeting with a MEK/ERK inhibitor in BRAFV600E CRCs.49 Moreover, CDK1 is involved in an iron-regulated signaling axis to regulate cell cycle and promote colorectal tumorigenesis.50 The spindle proteins AURKA, BUB1, and MAD2L1 are important components of the spindle assembly checkpoint,51 which has been frequently established to be an important mechanism that drives aneuploidy and carcinogenesis in CRC.52,53 PAICS, a de novo purine biosynthetic gene, participates in purine metabolism and metabolic pathways.54 Using integrated bioinformatics analysis, we identified ten hub genes, including nine genes that have been documented for their clinical significance and mechanism in CRC. As a responsive gene, CCNA2 was chosen for further investigation because knockdown of CCNA2 (Figure 5C) showed significant inhibition of proliferation (Figure 5D) and reduction in colony formation (Figure 5E and F).
CCNA2, which is normally silenced in the postnatal mammalian myocardium,55 can induce cardiac repair in small animal models of myocardial infarction.56 It is a functional target of retinoblastoma-mediated cell cycle arrest.57 After a thorough search in PubMed, there was no clear evidence indicating the relationship between CCNA2 and CRC. CCCNA2 was highly expressed in colon cancer according to biological information. Moreover, like CCNA2, MAD2L1 have a high correlation that is obviously positively correlated, and their Pearson correlation coefficient was 0.88. To examine the expression level of CCNA2, we found that CCNA2 has a higher expression in the CRC clinical samples and cell lines. We further confirmed that knockdown of CCNA2 could significantly suppress CRC cell growth by impairing cell cycle progression and inducing cell apoptosis. CCNA2 has the potential to be a new biomarker for diagnosis and CRC therapy.
In summary, using four cohorts profile data sets and multiple bioinformatics analyses, our present work identified ten hub genes as DEGs. These DEGs are significantly enriched in several pathways that are mainly associated with the cell cycle, DNA replication, and progesterone-mediated oocyte maturation in CRC, and they might play key roles in the development and progression of CRC. CCNA2 shows higher expression level in CRC, involving in colon cancer cell growth and cell cycle progress, which could be used as a new biomarker, and has significant meanings for clinical treatment.
Conclusion
In this study, using four cohorts profile data sets and multiple bioinformatics analyses, we identified ten hub genes which are significantly enriched in the cell cycle, DNA replication, and progesterone-mediated oocyte maturation pathways in CRC. Moreover, the expression level of CCNA2 was significantly increased in CRC and knockdown of CCNA2 suppressed colon cancer cell growth by impairing cell cycle and apoptosis progression. Our findings also establish that CCNA2 could be a new biomarker for diagnosis and guide the combination therapy for CRC.
Acknowledgment
This study was supported by grants from the National Key R&D Program of China, Stem Cell and Translational Research (No. 2016YFA0102000) and the National Natural Science Foundation of China (No. 81572900).
Disclosure
The authors report no conflicts of interest in this work.
References
Mármol I, Sánchez-de-Diego C, Pradilla Dieste A, Cerrada E, Rodriguez Yoldi MJ. Colorectal carcinoma: a general overview and future perspectives in colorectal cancer. Int J Mol Sci. 2017;18(1):197. | ||
American Cancer Society. Cancer Facts & Figures 2017. Atlanta: American Cancer Society; 2017. Available from: https://www.cancer.org/content/dam/cancer-org/research/cancer-facts-and-statistics/annual-cancer-facts-and-figures/2017/cancer-facts-and-figures-2017.pdf. Accessed May 25, 2018. | ||
Peters U, Bien S, Zubair N. Genetic architecture of colorectal cancer. Gut. 2015;64(10):1623–1636. | ||
Tamas K, Walenkamp AM, de Vries EG, et al. Rectal and colon cancer: Not just a different anatomic site. Cancer Treat Rev. 2015;41(8):671–679. | ||
Torre LA, Bray F, Siegel RL, Ferlay J, Lortet-Tieulent J, Jemal A. Global cancer statistics, 2012. CA Cancer J Clin. 2015;65(2):87–108. | ||
Ferlay J, Shin HR, Bray F, Forman D, Mathers C, Parkin DM. Estimates of worldwide burden of cancer in 2008: GLOBOCAN 2008. Int J Cancer. 2010;127(12):2893–2917. | ||
Siegel RL, Miller KD, Fedewa SA, et al. Colorectal cancer statistics, 2017. CA Cancer J Clin. 2017;67(3):177–193. | ||
Siegel RL, Miller KD, Jemal A. Cancer statistics, 2017. CA Cancer J Clin. 2017;67(1):7–30. | ||
Labianca R, Nordlinger B, Beretta GD, Brouquet A, Cervantes A, ESMO Guidelines Working Group. Primary colon cancer: ESMO Clinical Practice Guidelines for diagnosis, adjuvant treatment and follow-up. Ann Oncol. 2010;21 Suppl 5(Suppl 5):v70–v77. | ||
van Blarigan EL, Meyerhardt JA. Role of physical activity and diet after colorectal cancer diagnosis. J Clin Oncol. 2015;33(16):1825–1834. | ||
Jia S, Zhang R, Li Z, Li J. Clinical and biological significance of circulating tumor cells, circulating tumor DNA, and exosomes as biomarkers in colorectal cancer. Oncotarget. 2017;8(33):55632–55645. | ||
Doubeni CA, Corley DA, Quinn VP, et al. Effectiveness of screening colonoscopy in reducing the risk of death from right and left colon cancer: a large community-based study. Gut. 2018;67(2):291–298. | ||
Nishihara R, Wu K, Lochhead P, et al. Long-term colorectal-cancer incidence and mortality after lower endoscopy. N Engl J Med. 2013;369(12):1095–1105. | ||
Smith RA, Andrews KS, Brooks D, et al. Cancer screening in the United States, 2017: A review of current American Cancer Society guidelines and current issues in cancer screening. CA Cancer J Clin. 2017;67(2):100–121. | ||
Bian J. Overuse of colorectal cancer screening services in the United States and its implications. Chin J Cancer. 2016;35(1):88. | ||
Jackson-Thompson J, Ahmed F, German RR, Lai SM, Friedman C. Descriptive epidemiology of colorectal cancer in the United States, 1998-2001. Cancer. 2006;107(5 Suppl):1103–1111. | ||
Win AK, Macinnis RJ, Hopper JL, Jenkins MA. Risk prediction models for colorectal cancer: a review. Cancer Epidemiol Biomarkers Prev. 2012;21(3):398–410. | ||
Debourcy AC, Lichtenberger S, Felton S, Butterfield KT, Ahnen DJ, Denberg TD. Community-based preferences for stool cards versus colonoscopy in colorectal cancer screening. J Gen Intern Med. 2008;23(2):169–174. | ||
Ling BS, Schoen RE, Trauth JM, et al. Physicians encouraging colorectal screening: a randomized controlled trial of enhanced office and patient management on compliance with colorectal cancer screening. Arch Intern Med. 2009;169(1):47–55. | ||
Punt CJ, Koopman M, Vermeulen L. From tumour heterogeneity to advances in precision treatment of colorectal cancer. Nat Rev Clin Oncol. 2017;14(4):235–246. | ||
Yu FX, Zhao B, Guan KL. Hippo pathway in organ size control, tissue homeostasis, and cancer. Cell. 2015;163(4):811–828. | ||
Meng Z, Moroishi T, Guan KL. Mechanisms of Hippo pathway regulation. Genes Dev. 2016;30(1):1–17. | ||
Zhao B, Li L, Lei Q, Guan KL. The Hippo-YAP pathway in organ size control and tumorigenesis: an updated version. Genes Dev. 2010;24(9):862–874. | ||
Moroishi T, Hansen CG, Guan KL. The emerging roles of YAP and TAZ in cancer. Nat Rev Cancer. 2015;15(2):73–79. | ||
Ou C, Sun Z, Li S, Li G, Li X, Ma J. Dual roles of yes-associated protein (YAP) in colorectal cancer. Oncotarget. 2017;8(43):75727–75741. | ||
Kulasingam V, Diamandis EP. Strategies for discovering novel cancer biomarkers through utilization of emerging technologies. Nat Clin Pract Oncol. 2008;5(10):588–599. | ||
Kogo R, Shimamura T, Mimori K, et al. Long noncoding RNA HOTAIR regulates polycomb-dependent chromatin modification and is associated with poor prognosis in colorectal cancers. Cancer Res. 2011;71(20):6320–6326. | ||
Khamas A, Ishikawa T, Shimokawa K, et al. Screening for epigenetically masked genes in colorectal cancer Using 5-Aza-2’-deoxycytidine, microarray and gene expression profile. Cancer Genomics Proteomics. 2012;9(2):67–75. | ||
Sanz-Pamplona R, Berenguer A, Cordero D, et al. Aberrant gene expression in mucosa adjacent to tumor reveals a molecular crosstalk in colon cancer. Mol Cancer. 2014;13:46. | ||
Davis S, Meltzer PS. GEOquery: a bridge between the Gene Expression Omnibus (GEO) and BioConductor. Bioinformatics. 2007;23(14):1846–1847. | ||
Ashburner M, Ball CA, Blake JA, et al. Gene ontology: tool for the unification of biology. The Gene Ontology Consortium. Nat Genet. 2000;25(1):25–29. | ||
Ogata H, Goto S, Sato K, Fujibuchi W, Bono H, Kanehisa M. KEGG: Kyoto Encyclopedia of Genes and Genomes. Nucleic Acids Res. 1999;27(1):29–34. | ||
Huang Daw, Sherman BT, Lempicki RA. Systematic and integrative analysis of large gene lists using DAVID bioinformatics resources. Nat Protoc. 2009;4(1):44–57. | ||
Franceschini A, Szklarczyk D, Frankild S, et al. STRING v9.1: protein-protein interaction networks, with increased coverage and integration. Nucleic Acids Res. 2013;41(Database issue):D808–D815. | ||
Shannon P, Markiel A, Ozier O, et al. Cytoscape: a software environment for integrated models of biomolecular interaction networks. Genome Res. 2003;13(11):2498–2504. | ||
Tang Z, Li C, Kang B, Gao G, Li C, Zhang Z. GEPIA: a web server for cancer and normal gene expression profiling and interactive analyses. Nucleic Acids Res. 2017;45(W1):W98–W102. | ||
Davis WJ, Lehmann PZ, Li W. Nuclear PI3K signaling in cell growth and tumorigenesis. Front Cell Dev Biol. 2015;3:24. | ||
Fearon ER, Vogelstein B. A genetic model for colorectal tumorigenesis. Cell. 1990;61(5):759–767. | ||
Kolodner RD, Marsischky GT. Eukaryotic DNA mismatch repair. Curr Opin Genet Dev. 1999;9(1):89–96. | ||
Raut CP, Pawlik TM, Rodriguez-Bigas MA. Clinicopathologic features in colorectal cancer patients with microsatellite instability. Mutat Res. 2004;568(2):275–282. | ||
Söreide K, Janssen EA, Söiland H, Körner H, Baak JP. Microsatellite instability in colorectal cancer. Br J Surg. 2006;93(4):395–406. | ||
Iacopetta B, Grieu F, Amanuel B. Microsatellite instability in colorectal cancer. Asia Pac J Clin Oncol. 2010;6(4):260–269. | ||
Michailidi C, Papavassiliou AG, Troungos C. DNA repair mechanisms in colorectal carcinogenesis. Curr Mol Med. 2012;12(3):237–246. | ||
Geiersbach KB, Samowitz WS. Microsatellite instability and colorectal cancer. Arch Pathol Lab Med. 2011;135(10):1269–1277. | ||
Xiang J, Fang L, Luo Y, et al. Levels of human replication factor C4, a clamp loader, correlate with tumor progression and predict the prognosis for colorectal cancer. J Transl Med. 2014;12:320. | ||
Järvinen TA, Tanner M, Rantanen V, et al. Amplification and deletion of topoisomerase IIalpha associate with ErbB-2 amplification and affect sensitivity to topoisomerase II inhibitor doxorubicin in breast cancer. Am J Pathol. 2000;156(3):839–847. | ||
Gao X, Guo X, Xue H, et al. lncTCF7 is a negative prognostic factor, and knockdown of lncTCF7 inhibits migration, proliferation and tumorigenicity in glioma. Sci Rep. 2017;7(1):17456. | ||
Coss A, Tosetto M, Fox EJ, et al. Increased topoisomerase IIalpha expression in colorectal cancer is associated with advanced disease and chemotherapeutic resistance via inhibition of apoptosis. Cancer Lett. 2009;276(2):228–238. | ||
Gan W, Zhao H, Li T, Liu K, Huang J. CDK1 interacts with iASPP to regulate colorectal cancer cell proliferation through p53 pathway. Oncotarget. 2017;8(42):71618–71629. | ||
Zhang P, Kawakami H, Liu W, et al. Targeting CDK1 and MEK/ERK overcomes apoptotic resistance in BRAF-mutant human colorectal cancer. Mol Cancer Res. 2018;16(3):378–389. | ||
Xue X, Ramakrishnan SK, Weisz K, et al. Iron uptake via DMT1 integrates cell cycle with JAK-STAT3 signaling to promote colorectal tumorigenesis. Cell Metab. 2016;24(3):447–461. | ||
Chen RH, Shevchenko A, Mann M, Murray AW. Spindle checkpoint protein Xmad1 recruits Xmad2 to unattached kinetochores. J Cell Biol. 1998;143(2):283–295. | ||
Burum-Auensen E, Deangelis PM, Schjølberg AR, Røislien J, Andersen SN, Clausen OP. Spindle proteins Aurora A and BUB1B, but not Mad2, are aberrantly expressed in dysplastic mucosa of patients with longstanding ulcerative colitis. J Clin Pathol. 2007;60(12):1403–1408. | ||
Zhong R, Chen X, Chen X, et al. MAD1L1 Arg558His and MAD2L1 Leu84Met interaction with smoking increase the risk of colorectal cancer. Sci Rep. 2015;5:12202. | ||
Chakravarthi BV, Goswami MT, Pathi SS, et al. Expression and Role of PAICS, a De Novo Purine Biosynthetic Gene in Prostate Cancer. Prostate. 2017;77(1):10–21. | ||
Dyson N. The regulation of E2F by pRB-family proteins. Genes Dev. 1998;12(15):2245–2262. | ||
Zerfass-Thome K, Schulze A, Zwerschke W, et al. p27KIP1 blocks cyclin E-dependent transactivation of cyclin A gene expression. Mol Cell Biol. 1997;17(1):407–415. | ||
Blanchard JM. Cyclin A2 transcriptional regulation: modulation of cell cycle control at the G1/S transition by peripheral cues. Biochem Pharmacol. 2000;60(8):1179–1184. |
Supplementary materials
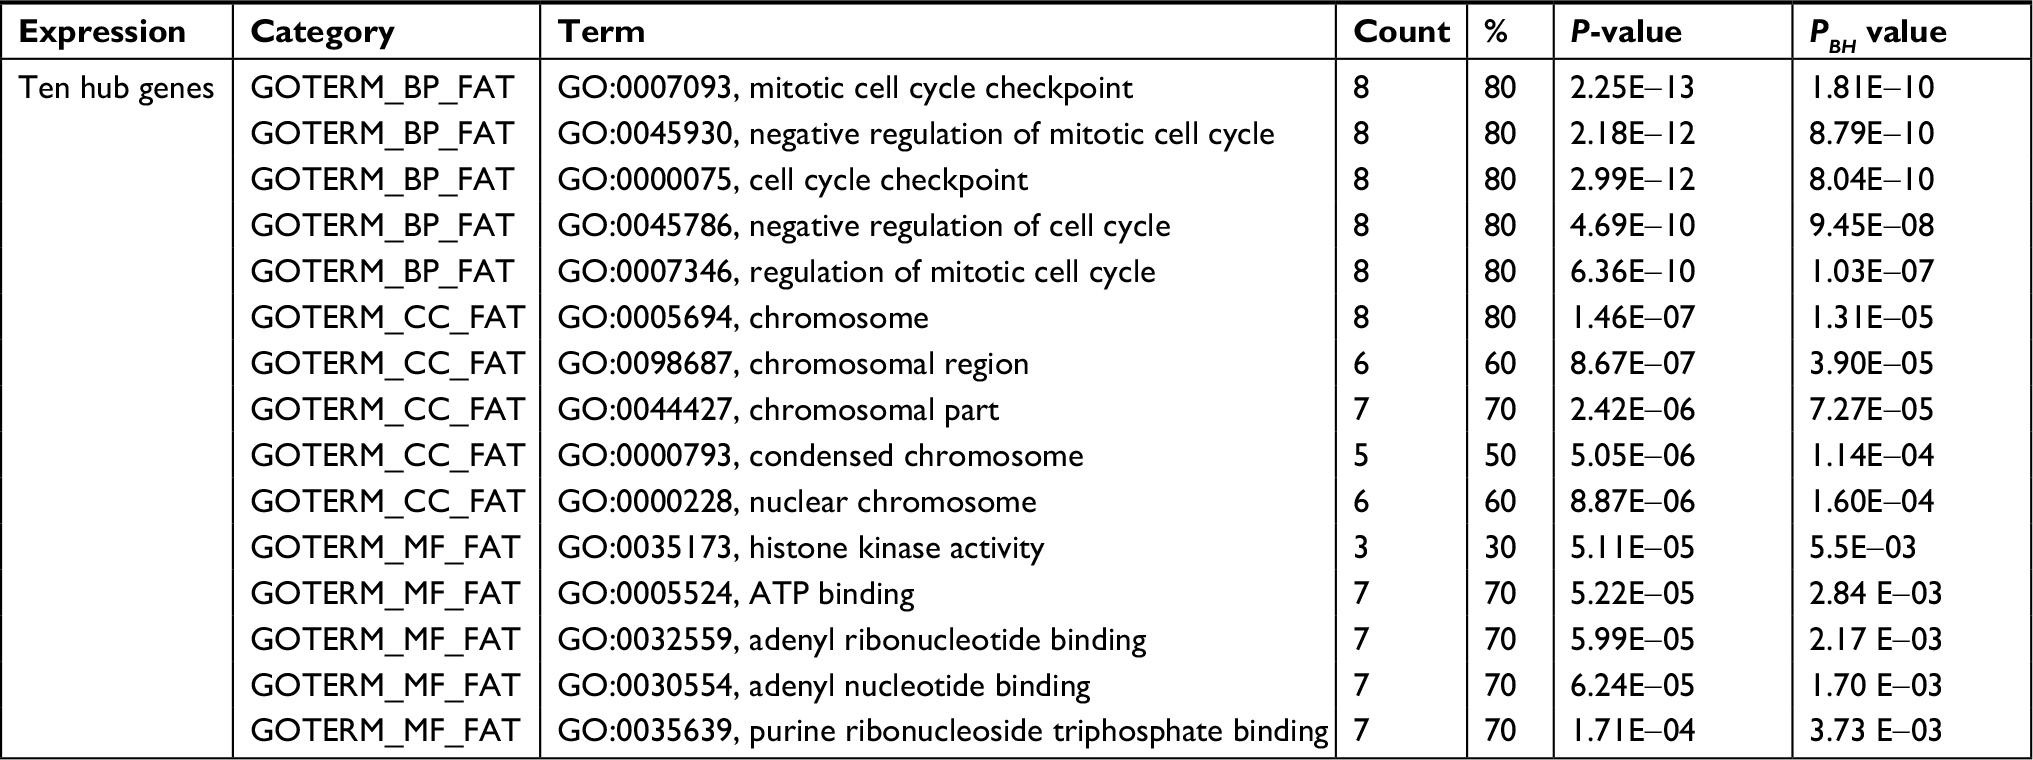 | Table S1 GO analysis of ten hub genes associated with CRC Abbreviations: CRC, colorectal cancer; GO, gene ontology; BP, biological process; CC, cell component; MF, molecular function. |
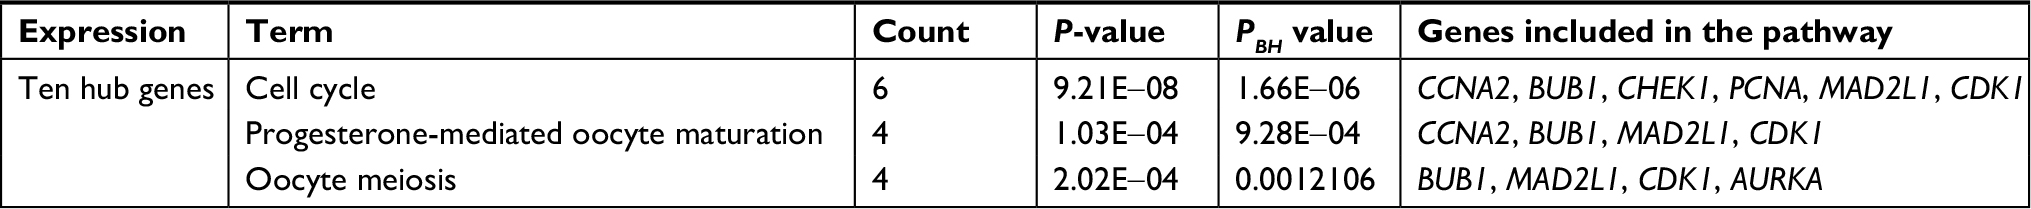 | Table S2 KEGG pathway analysis of ten hub genes associated with CRC Abbreviations: CRC, colorectal cancer; KEGG, Kyoto Encyclopedia of Genes and Genomes. |
 © 2018 The Author(s). This work is published and licensed by Dove Medical Press Limited. The full terms of this license are available at https://www.dovepress.com/terms.php and incorporate the Creative Commons Attribution - Non Commercial (unported, v3.0) License.
By accessing the work you hereby accept the Terms. Non-commercial uses of the work are permitted without any further permission from Dove Medical Press Limited, provided the work is properly attributed. For permission for commercial use of this work, please see paragraphs 4.2 and 5 of our Terms.
© 2018 The Author(s). This work is published and licensed by Dove Medical Press Limited. The full terms of this license are available at https://www.dovepress.com/terms.php and incorporate the Creative Commons Attribution - Non Commercial (unported, v3.0) License.
By accessing the work you hereby accept the Terms. Non-commercial uses of the work are permitted without any further permission from Dove Medical Press Limited, provided the work is properly attributed. For permission for commercial use of this work, please see paragraphs 4.2 and 5 of our Terms.