")
Back to Journals » International Journal of General Medicine » Volume 15
CBX3 is a Prognostic Biomarker Correlated with ATR Activation and Immune Infiltration in Head and Neck Squamous Cell Carcinoma
Authors Zhang X, Zhou W, Zhang Y, Liu Z
Received 5 November 2021
Accepted for publication 6 January 2022
Published 15 February 2022 Volume 2022:15 Pages 1497—1508
DOI https://doi.org/10.2147/IJGM.S344390
Checked for plagiarism Yes
Review by Single anonymous peer review
Peer reviewer comments 2
Editor who approved publication: Dr Scott Fraser
Xu Zhang,1– 3,* Wenkai Zhou,1– 3,* Yu Zhang,1– 3 Zheqi Liu1– 3
1Department of Oral and Maxillofacial & Head and Neck Oncology, Shanghai Ninth People’s Hospital, College of Stomatology, Shanghai Jiao Tong University School of Medicine, Shanghai, 200011, People’s Republic of China; 2College of Stomatology, Shanghai Jiao Tong University, Shanghai, People’s Republic of China; 3National Center for Stomatology; National Clinical Research Center for Oral Diseases, Shanghai Key Laboratory of Stomatology, Shanghai, 200011, People’s Republic of China
*These authors contributed equally to this work
Correspondence: Zheqi Liu; Yu Zhang, Department of Oral and Maxillofacial & Head and Neck Oncology, Shanghai Ninth People’s Hospital, Shanghai Jiao Tong University School of Medicine, Shanghai, 200011, People’s Republic of China, Email [email protected]; [email protected]
Background: Chromobox protein homolog (CBX) family members play important roles in the progression and prognosis of many cancers. However, their functional role in head and neck squamous cell carcinoma (HNSCC) remains largely unknown.
Methods: In this study, we analyzed the expression and functions of CBX family members using The Cancer Genome Atlas data. Most CBX family members were found to be differentially expressed in various tumors, including HNSCC, compared to normal tissues. Multivariate Cox regression analysis showed that CBX3 expression is an independent prognostic factor for HNSCC patients. A nomogram based on CBX3 expression was constructed for use as a diagnostic indicator for HNSCC patients. We also used qPCR to validate the expression of CBX3.
Results: Gene set enrichment analysis suggested that CBX3 participates in ataxia-telangiectasia mutated and Rad3-related protein kinase (ATR) activation and tumor progression. Analysis of immune infiltration indicated that CBX3 expression is negatively correlated with mast cells, DCs, immature DCs, and neutrophils.
Conclusion: Our findings show that high CBX3 expression predicts poor prognosis in HNSCC and that CBX3 may act as an oncoprotein by activating ATR and affecting immune infiltration.
Keywords: CBX, prognostic biomarker, immune infiltration, HNSCC, bioinformatic analysis
Introduction
Head and neck cancer is the sixth leading malignancy worldwide, and nearly 90% of cases are classified as head and neck squamous cell carcinoma (HNSCC).1 HNSCC is a heterogeneous solid tumor with an aggressive phenotype and poor clinical outcomes, primarily due to local recurrence and regional lymph-node and distant metastasis. With the vast improvement in treatments, including surgery, radiotherapy, chemotherapy, and multidisciplinary comprehensive sequence therapy, the quality of life of patients with HNSCC has improved to a certain extent; however, the five-year survival rate remains at approximately 50%.2 Although the knowledge of tumor invasion and metastasis has improved, the molecular mechanism of HNSCC tumorigenesis remains unclear.
In humans, eight chromobox (CBX) proteins have been identified, with links primarily to heterochromatin, gene expression, apoptosis, and the regulation of development.3 CBX family members are abnormally overexpressed in tumorigenesis and affect tumor prognosis.4,5 For example, overexpression of CBX8 in hepatocellular carcinoma patients is related to short overall survival (OS) time.6 In gastric cancer, CBX7 is activated via the AKT pathway and downregulated by the tumor suppressor protein p16, and plays an important role in maintaining the stem cell-like characteristics of gastric cancer cells.7 However, the roles of the various CBX family members in the onset and development of HNSCC remain unclear.
In the present study, we used a range of tools and databases to investigate the relationships between CBX family members and HNSCC. We analyzed the expression, mutation, and clinical correlations of CBX proteins in HNSCC patients to predict their potential functions and prognostic values.
Materials and Methods
Data Collection and Bioinformatics Analysis
To analyze the expression and correlations with HNSCC prognosis of CBX family members, we downloaded gene expression data (RNA-sequencing [RNA-seq] data expressed as transcripts per million) from The Cancer Genome Atlas (TCGA) (http://cancergenome.nih.gov). In total, 546 HNSCC cases were included in the analysis, for which RNA-seq data and clinicopathological data were extracted. Patient characteristics included sex, race, TNM stage, clinical stage, histologic grade, lymphovascular invasion, smoking status, and radiation therapy or not. All data used in this study were obtained from TCGA, thus, ethics approval and informed consent were not required, which was approved by the Ethics Committee of the Ninth People’s Hospital, Shanghai Jiao Tong University School of Medicine. We also collected 17 pairs of HNSCC tumor and normal tissues for.
RNA-Seq Gene Expression Analysis
The EdgeR package (version 3.8, http://www.bioconductor.org/EdgeR) was used to analyze the differentially expressed mRNAs between HNSCC tissues and normal adjacent tissues.8 A |log(fold change)| > 2 and P < 0.01 were set as cut-off criteria. RNA expression was visualized in a histogram using the ggplot2 package (version 3.1.0, https://github.com/tidyverse/ggplot2).
Survival Prognosis Analysis
We used the survminer package to obtain OS and disease-free survival significance map data of the CBX family across all TCGA tumors. Cutoff-high (50%) and cutoff-low (50%) values were used as expression thresholds for splitting the high-expression and low-expression cohorts. The Log rank test was used in the hypothesis test, and survival plots were constructed using the survminer package. The relationships between clinicopathologic features and CBX expression were analyzed using the Wilcoxon rank-sum test and logistic regression. Clinicopathologic characteristics associated with OS and DSS were analyzed with Cox regression and the Kaplan-Meier method. The multivariate Cox analysis was used to identify the influence of CBX expression on survival, along with other clinical features. All hypothetical tests were two-sided, and P values<0.05 were considered significant.
Functional Enrichment Analysis
Metascape (http://metascape.org) is a free gene-list analysis tool for gene annotation and analysis.9 We used Metascape to conduct pathway and process enrichment analysis of differentially expressed genes (DEGS) in HNSCC significantly associated with CBX3 alterations. Gene enrichment was analyzed using Gene Ontology (GO) terms for biological process, cellular component, and molecular function categories, as well as Kyoto Encyclopedia of Gene and Genomes (KEGG) pathways. Terms with P < 0.01, minimum count of 3, and enrichment factor > 1.5 were considered as significant.
Gene Set Enrichment Analysis (GSEA)
We used GSEA to list all DEGs according to their correlation with CBX3 expression. The R package clusterProfiler (version 3.6.3) was used to perform GSEA of the high- and low-CBX3 groups. For each analysis, gene set permutation was repeated 1000 times according to the default statistical method. DEGs with a false discovery rate-adjusted P-value (q-value) < 0.25, adjusted P < 0.05, and |normalized enrichment score| > 1 were considered as significantly enriched.
Analysis of Immune Cell Characteristics by Single-Sample (ss)GSEA
We used the GSVA R package to compare the normalized CBX3 gene expression data and immune cell signatures. ssGSEA classifies marker gene sets with common biological functions, chromosomal localization, and physiological regulation in a single sample. Immune infiltration in HNSCC was analyzed using ssGSEA in the R package (version 3.6.3). To reveal correlations between CBX3 and immune cell infiltration levels, we used the Spearman’s rank correlation test and Wilcoxon’s rank-sum test (P < 0.05).
Tissue Samples and qRT-PCR
Paired, fresh HNSCC tissues and their corresponding adjacent normal tissues were collected from the Ninth People’s Hospital, Shanghai Jiao Tong University School of Medicine. Written informed consent was obtained from each patient. The patients were well-informed and have consented to this study, and the process was approved by Ethics Committee of the Ninth People’s Hospital, Shanghai Jiao Tong University School of Medicine.(SH9H-2021-TK547-1).
Total RNA was extracted using TRIzol (Invitrogen, CA, United States). An equal amount of RNA was reverse-transcribed using the HiScript II Q RT Supermix and was quantified by qPCR using SYBR Green (Bimake). The primer sequences are shown in Supplementary Table 1.
Results
CBX1–8 Expression in Different Cancers
The public database, TCGA, was used to analyze the mRNA expression of CBX1–8 in various cancers and normal tissues. Figure 1 shows the expression levels in pan-cancer. CBX1, CBX2, CBX3, CBX4, CBX5, and CBX8 mRNA levels were elevated in most cancers, whereas CBX6 and CBX7 were downregulated in most cancers.
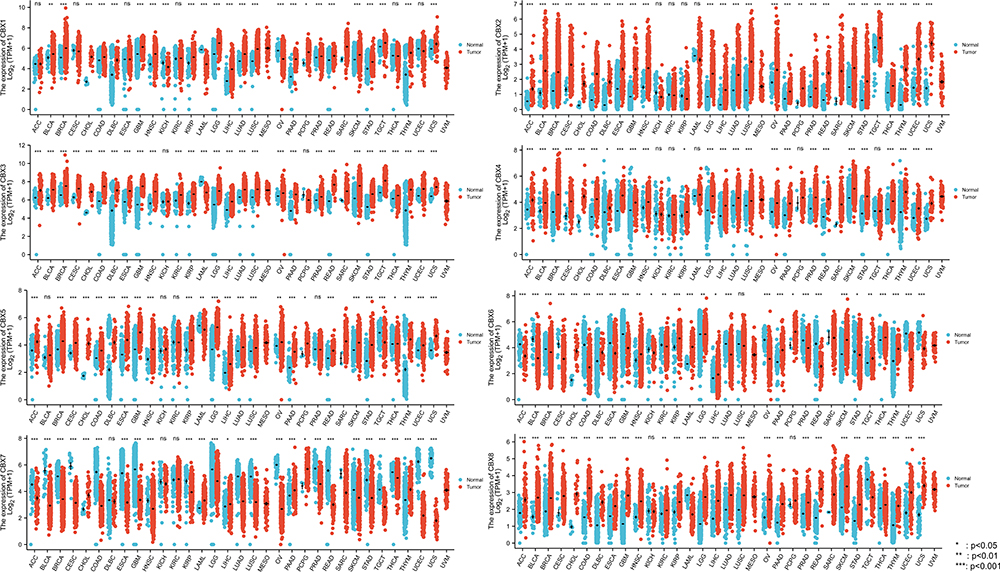 |
Figure 1 Expression level of CBX family was upregulated in most cancer types. |
CBX1–8 Expression Differs Between HNSCC Tissues and Normal Tissues
Next, we focused on the expression of CBX1–8 in HNSCC using TCGA data. CBX1, CBX2, CBX3, CBX4, CBX5, CBX6, and CBX8 mRNA levels were higher in tumor tissues than in normal tissues, whereas that of CBX7 was lower in tumor tissues (Figure 2A). Receiver operating characteristic (ROC) curve analysis revealed that most CBX family members, including CBX1, CBX2, CBX3, CBX8, may be used as a marker to distinguish tumor from non-tumor cells (Figure 2B). The cut-off levels of CBX1-8 are shown in Supplementary Table 2. We also used qPCR to validate mRNA expression levels of CBX3. The results showed that CBX3 mRNA levels were higher in tumor tissues than in normal tissues (Figure 2C).
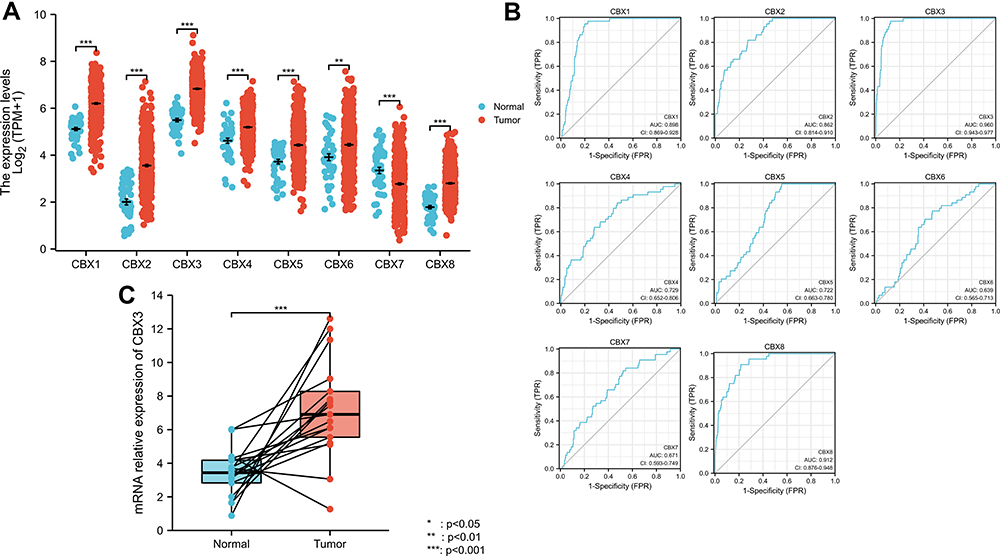 |
Figure 2 Expression level of most members of CBX family was upregulated in HNSCC. (A) CBX expression of normal samples and tumor samples in TCGA head and neck squamous cell carcinoma. (B) ROC curve of CBX family. (C) mRNA relative expression of CBX3 (qPCR results). |
Prognostic Value of CBX1–8 Expression in HNSCC
Multivariate Cox regression of OS and disease-specific survival (DSS) showed that CBX3 and CBX5 expression levels were independent risk factors in patients with HNSCC (Table 1A and B). Therefore, we focused on these two genes and used Kaplan–Meier curves of OS and DSS to analyze the prognosis of HNSCC patients with different expression levels of CBX3 and CBX5. High CBX3 expression was significantly associated with shorter survival, while high CBX5 expression was associated with longer survival (Figure 3A and B). We used a subgroup analysis to analyze the relationships between CBX3 and CBX5 expression and the prognosis of patients with different characteristics (Figure 3C and D). In patients undergoing radiation-therapy, patients with clinical grades III and IV, patients with tumor grades III and IV, and smoking patients, high CBX3 expression predicted poor survival, whereas high CBX5 expression predicted good survival in these patient groups.
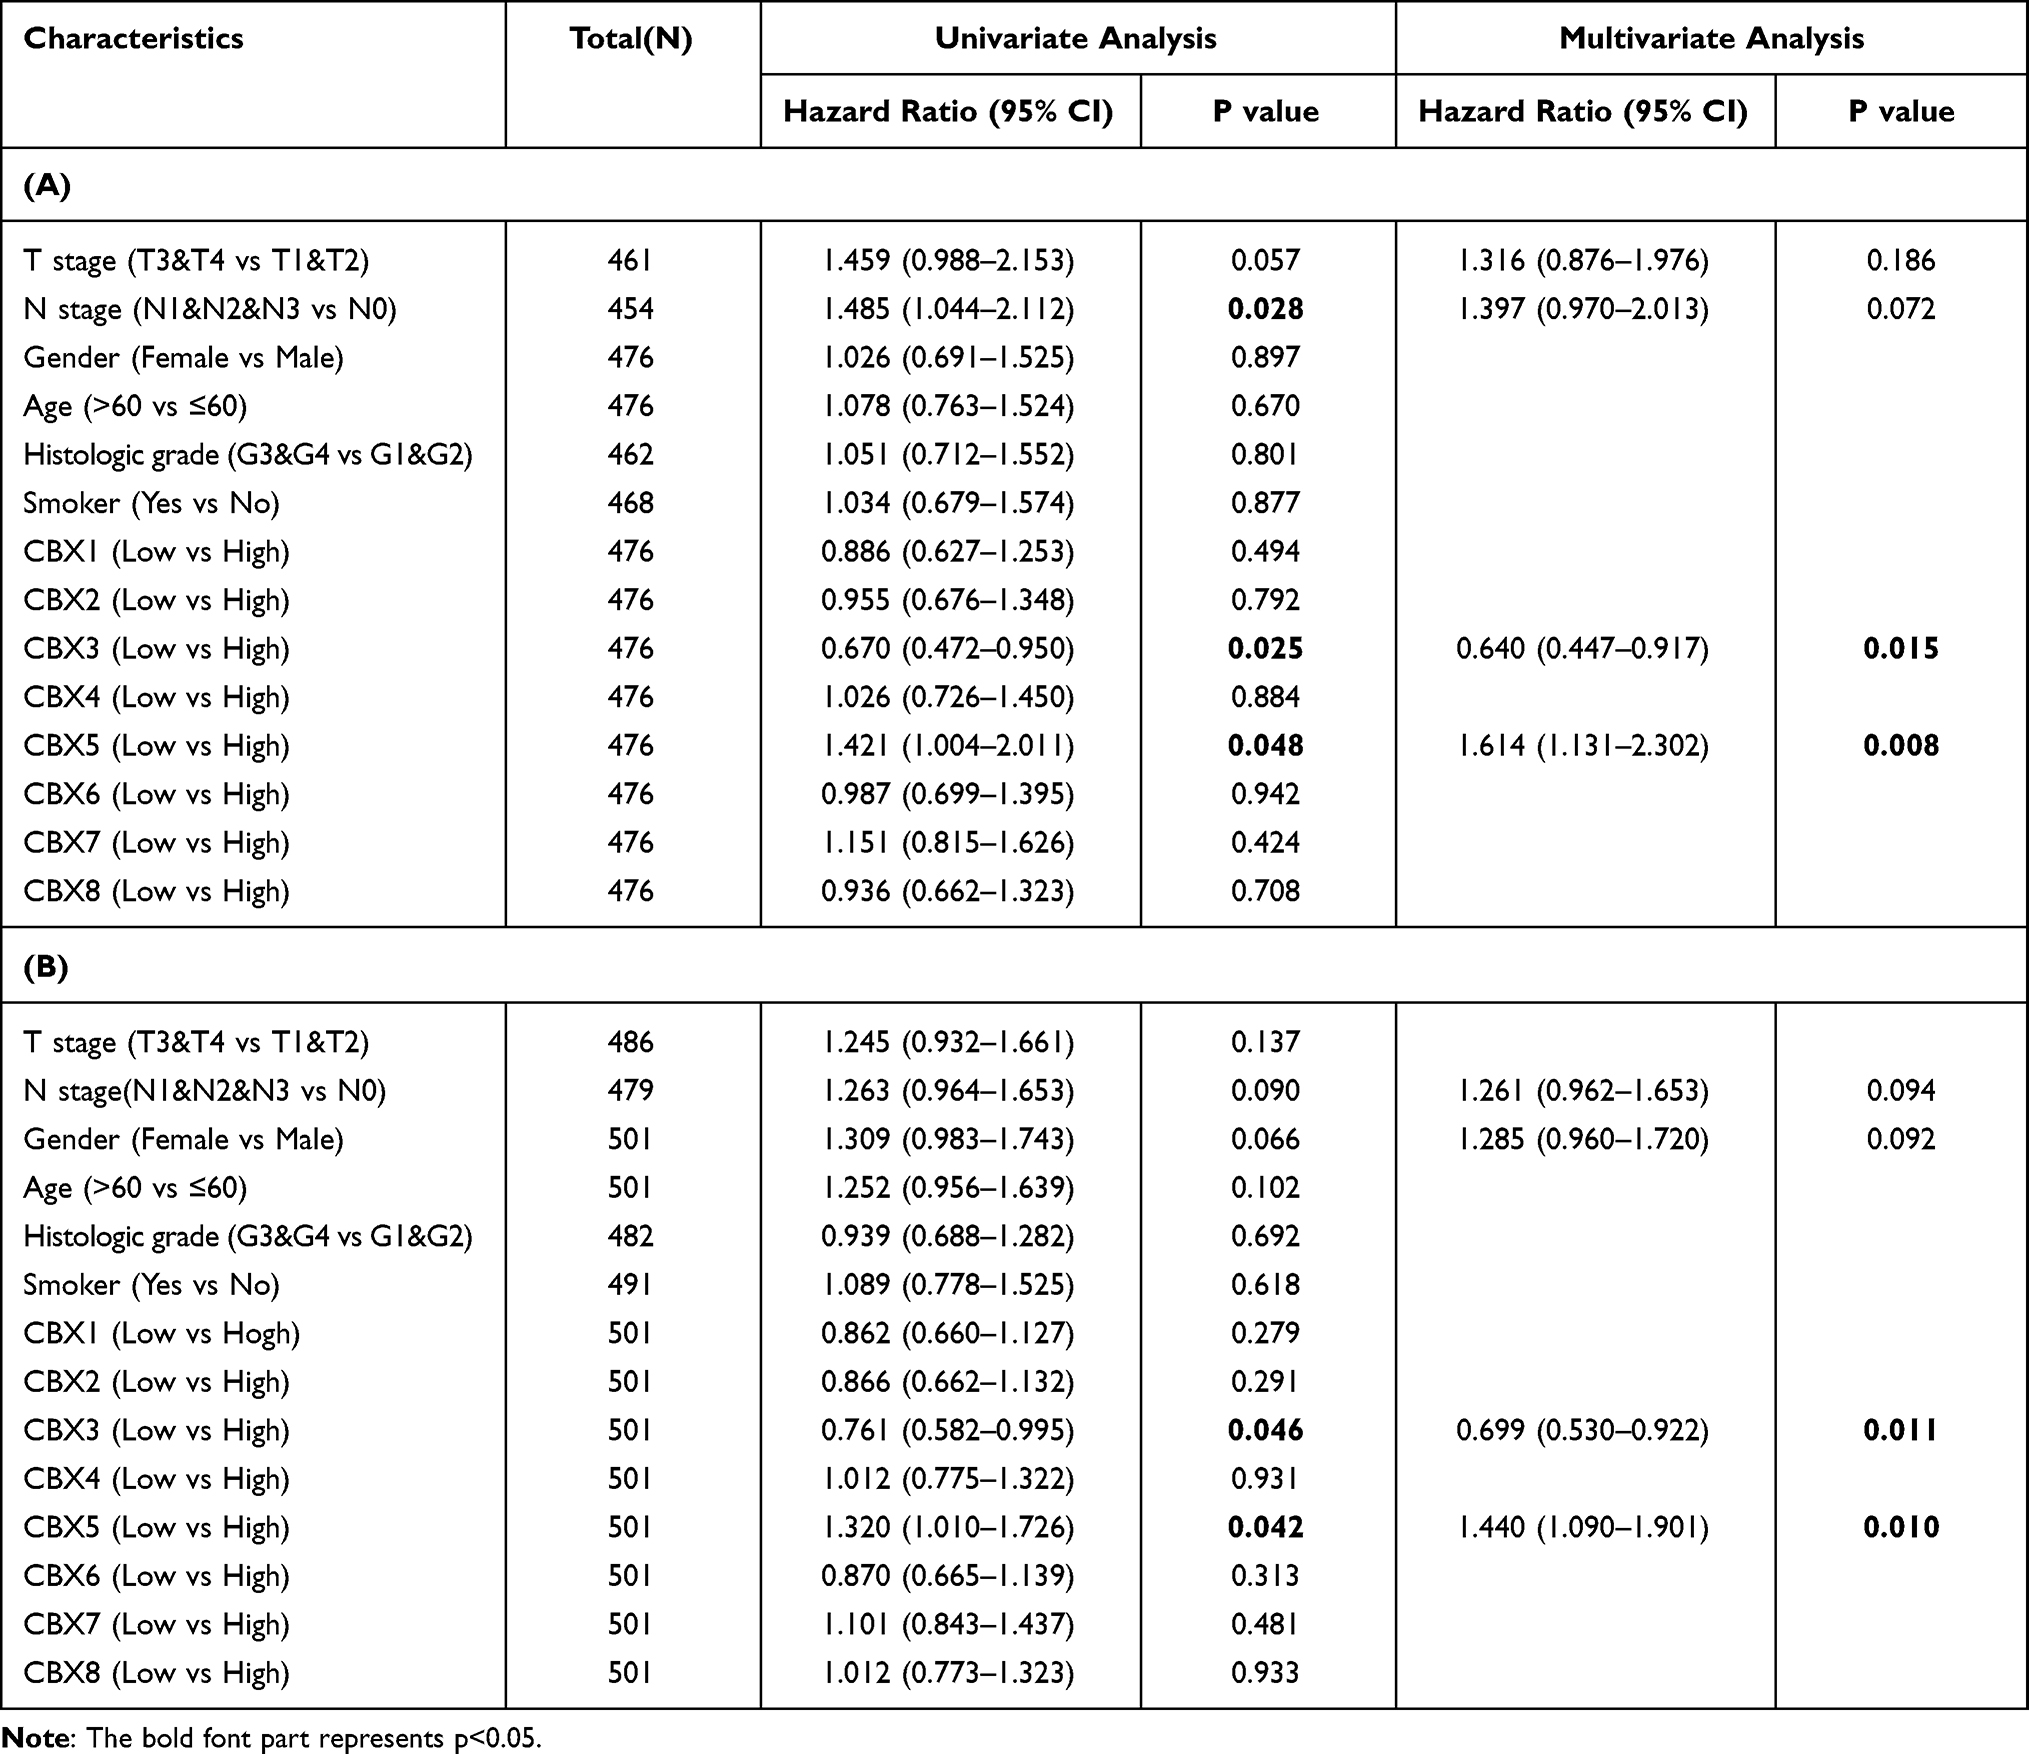 |
Table 1 (A) CBX3 Expression Associated with Clinicopathological Parameters (Logistic Regression). (B) CBX5 Expression Associated with Clinicopathological Parameters (Logistic Regression) |
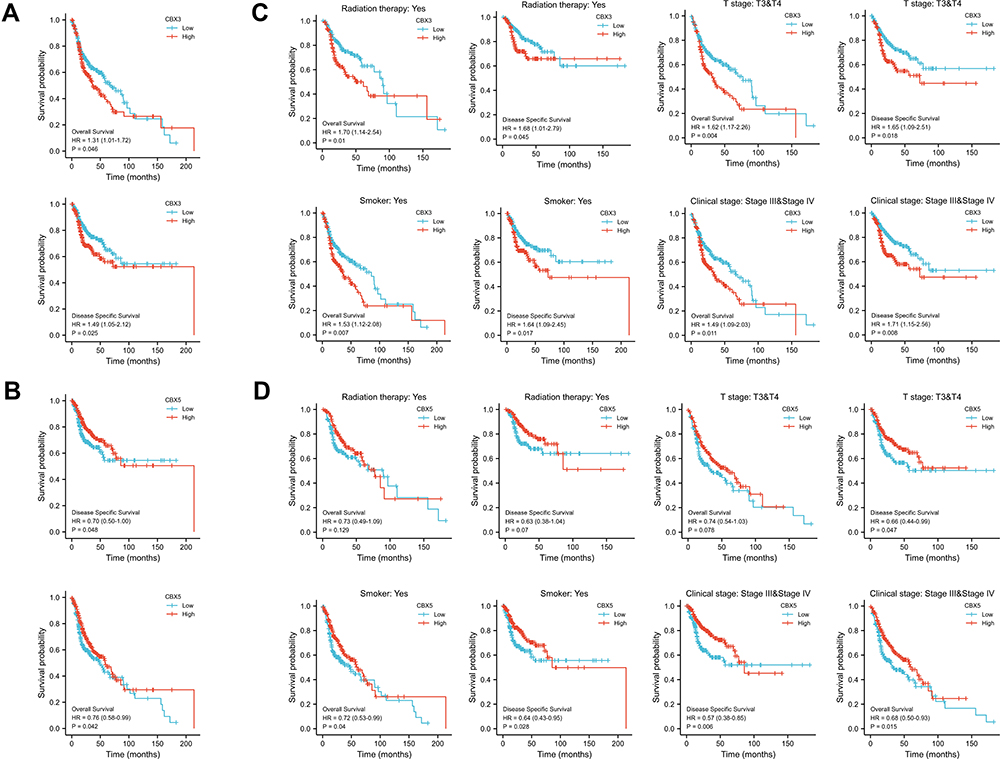 |
Figure 3 Prognostic value of CBX3 and CBX5 in HNSCC. (A) Kaplan-Meier curves of OS and DSS with different expression level of CBX3. (B) Kaplan-Meier curves of OS and DSS with different expression level of CBX5. (C) Kaplan-Meier curves of OS and DSS with different expression level of CBX3 in radiation therapy group, clinical grades III and IV group, T grades III & IV group and smoked group. (D) Kaplan-Meier curves of OS and DSS with different expression level of CBX5 in radiation therapy group, clinical grades III and IV group, T grades III & IV group and smoked group. |
CBX3 and CBX5 Expression Correlate with Clinicopathological Parameters
We analyzed the correlation of CBX3 and CBX5 expression with clinicopathological parameters. We used clinical information of 502 HNSCC patients, including 368 male and 124 female patients with a median age of 61 years (range: 55–71 years), collected from the TCGA. Clinicopathological features are shown in Table 2. CBX3 and CBX5 expression in HNSCC tissues was categorized as “low” or “high” based on median values. High CBX3 expression was strongly associated with high T&N stages, age, clinical stages, radiation therapy, high histologic grade, and lymphovascular invasion (Table 3A and B), while high CBX5 expression was strongly associated with high histologic grade.
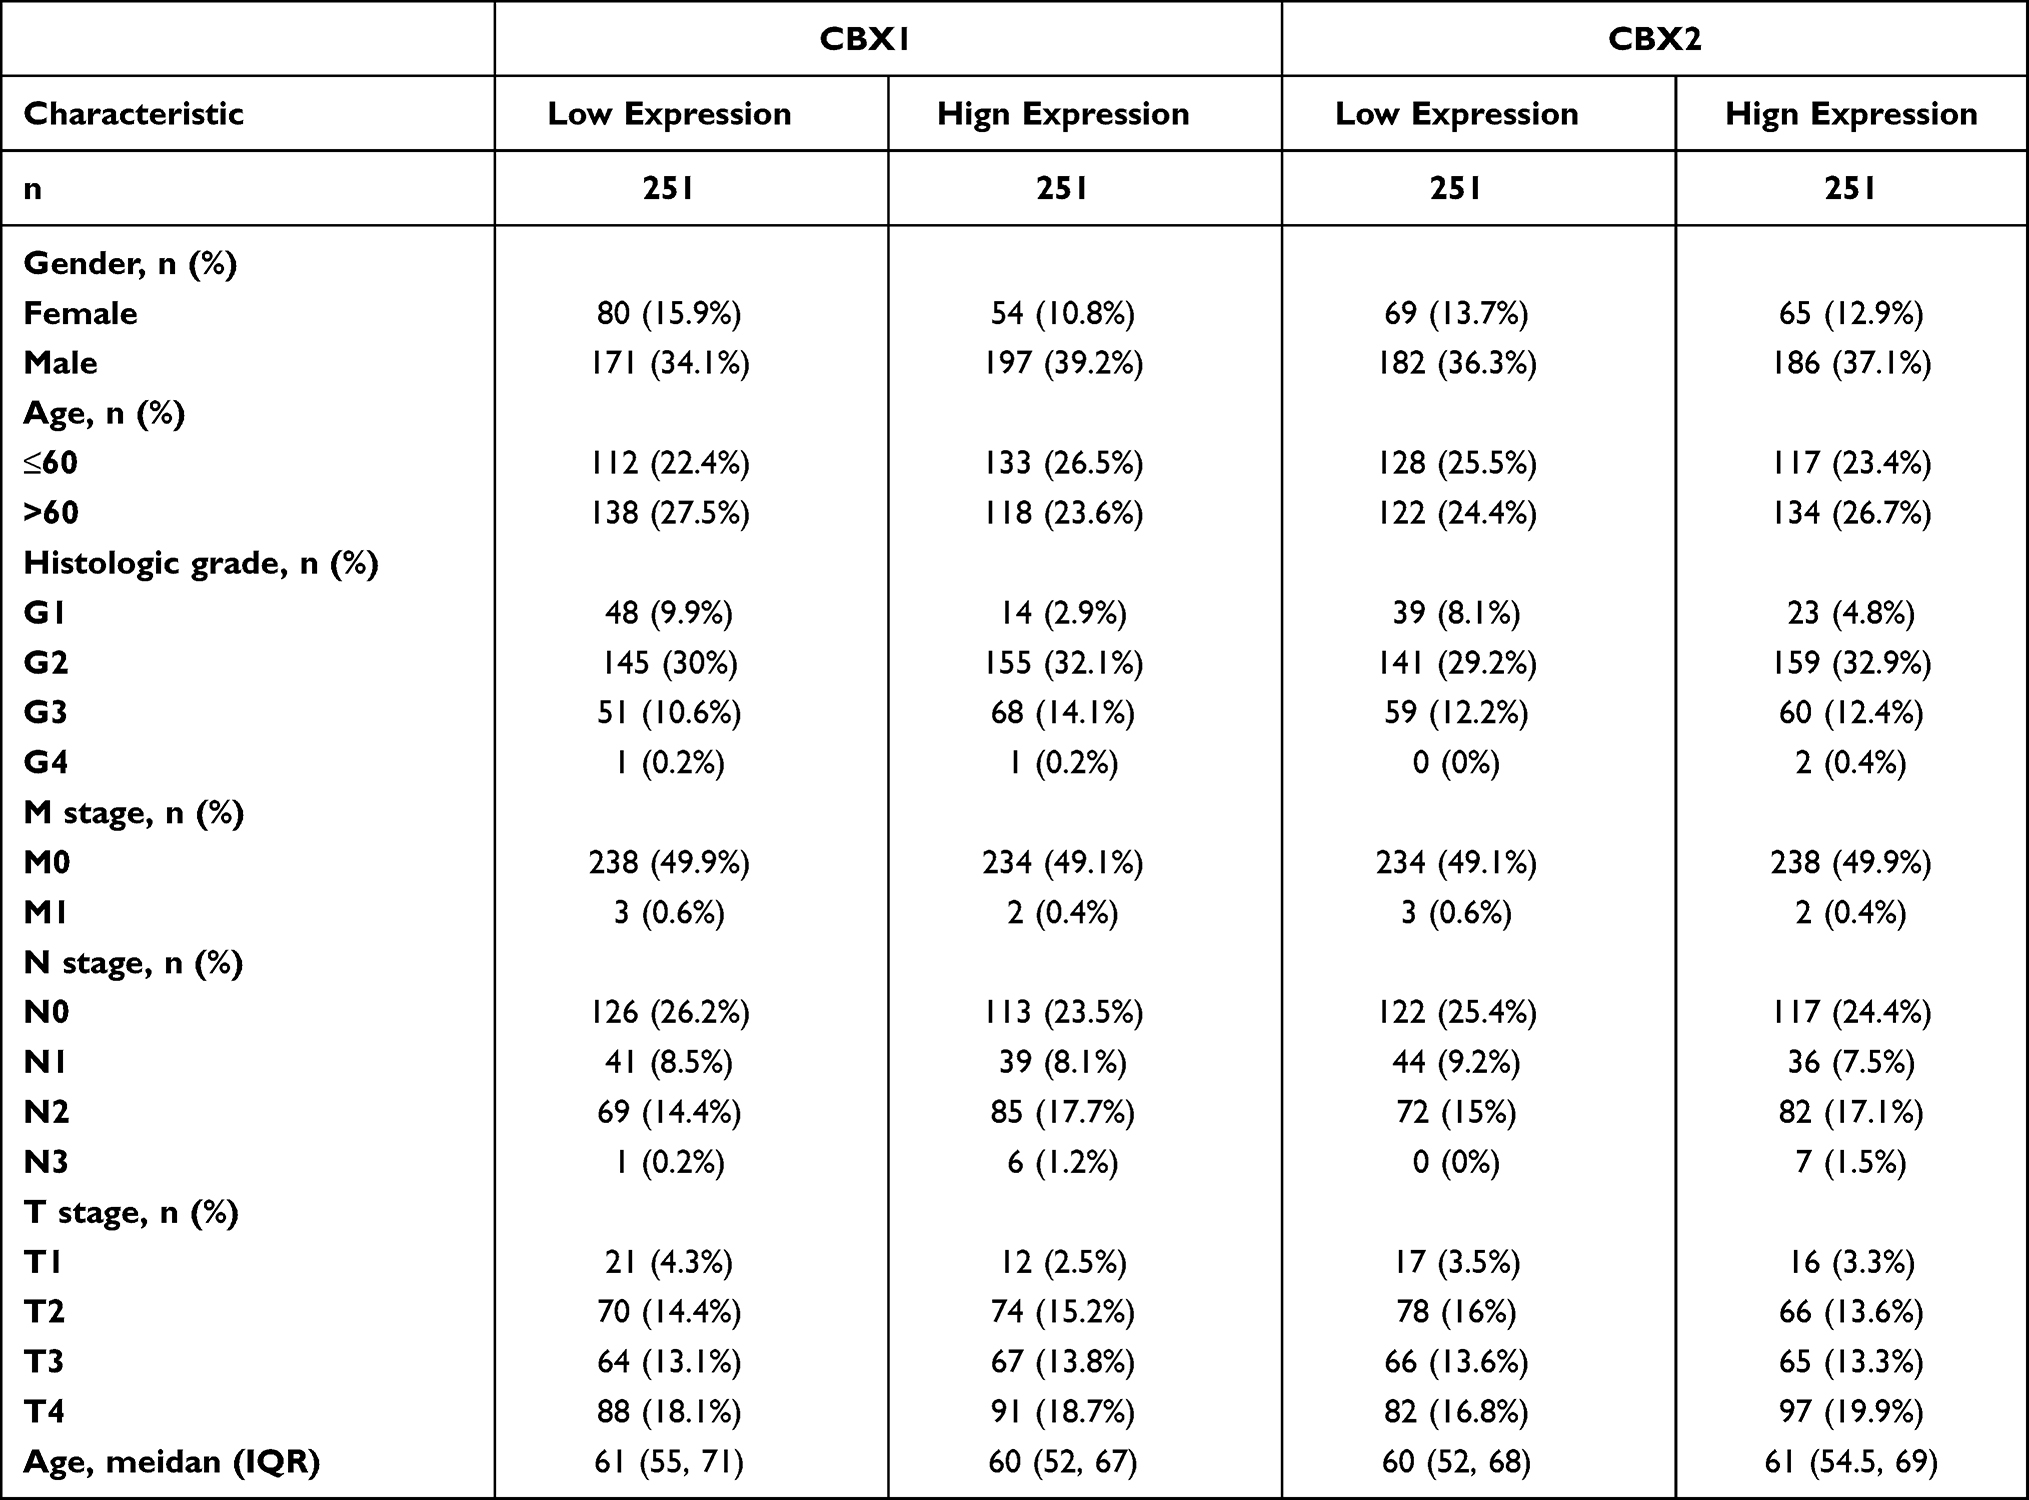 |
Table 2 Characteristic of Patients with HNSCC Based on TCGA |
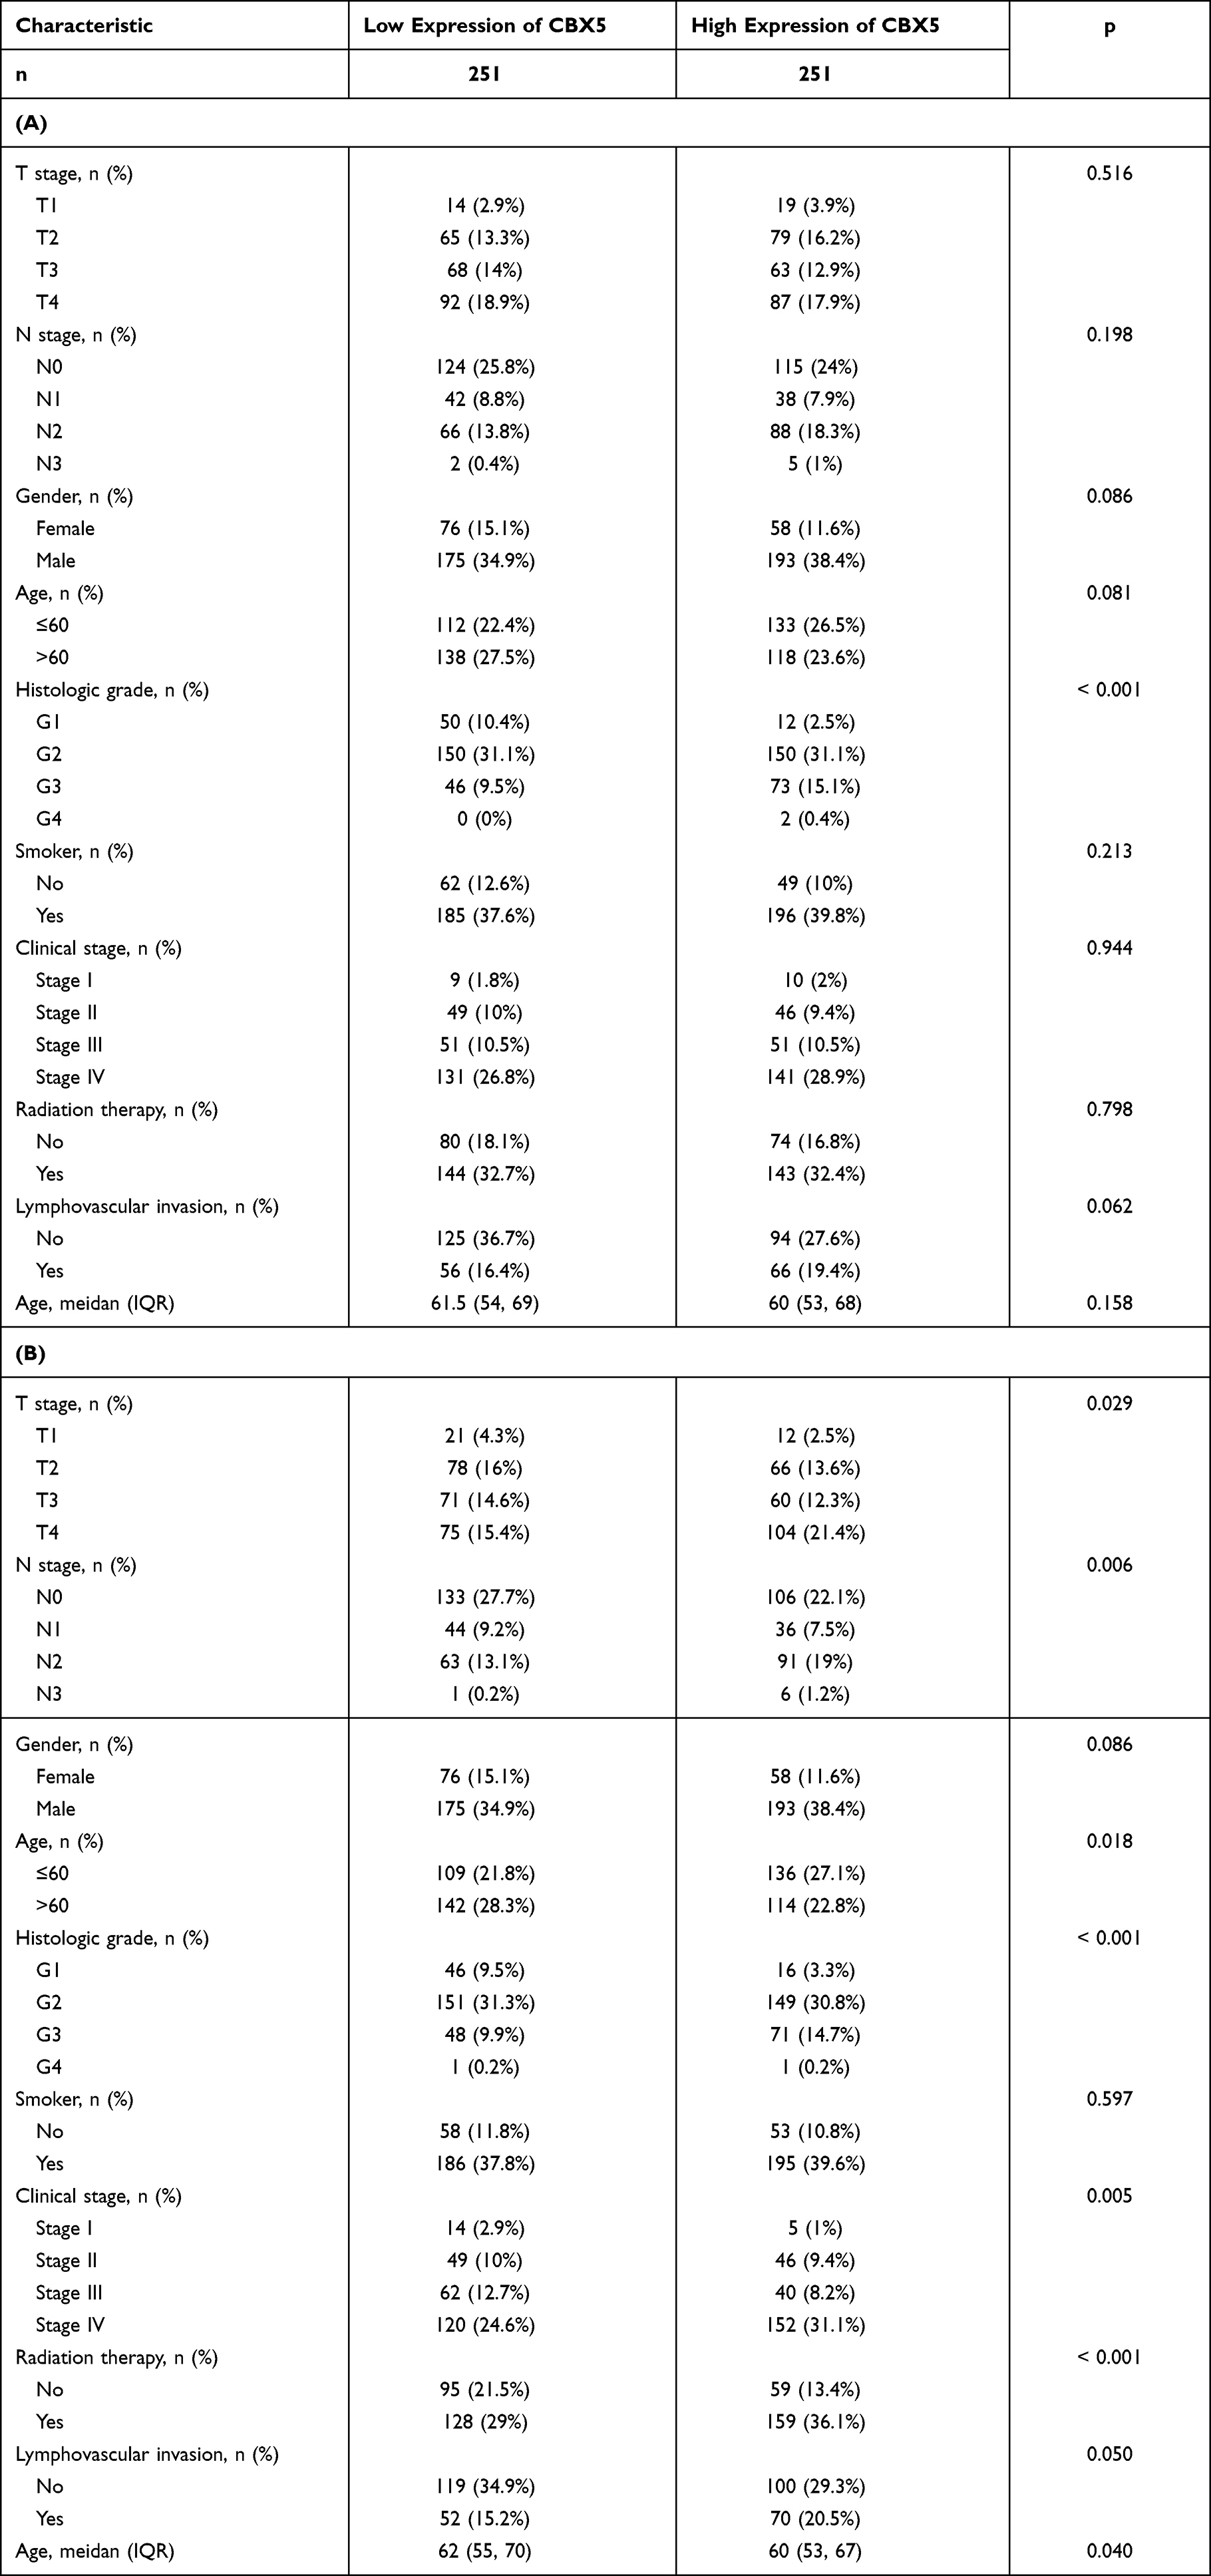 |
Table 3 (A) Univariate and Multivariate Cox Regression Analysis of Clinicopathological Parameters and Overall Survival. (B) Univariate and Multivariate Cox Regression Analysis of Clinicopathological Parameters and Disease-Specific Survival |
Identification of DEGs in High- and Low-CBX3 Expression Samples via Functional Cluster Analysis
To explore the potential mechanism of CBX3 in causing tumor progression, we analyzed DEGs in high- and low-CBX3 expression samples. In total, we identified 273 DEGs, including 85 upregulated and 188 downregulated genes. DEG expression is presented in a heatmap and a volcano plot (Figure 4A and B). The functions of the DEGs were analyzed by GO and KEGG enrichment analyses. The top GO terms in the biological process, molecular function, and cellular component categories were cell adhesion molecule binding, cornified envelope, and peptidase regulator activity, respectively. KEGG analysis showed that genes involved in Staphylococcus aureus infection were enriched (Figure 4C). We used GSEA to analyze the key pathways related to CBX3. The most differentially enriched pathways based on the normalized enrichment scores were 1) activation of ataxia-telangiectasia mutated and Rad3-related protein kinase (ATR) in response to replication stress and 2) activation of the pre-replicative complex (Figure 4D).
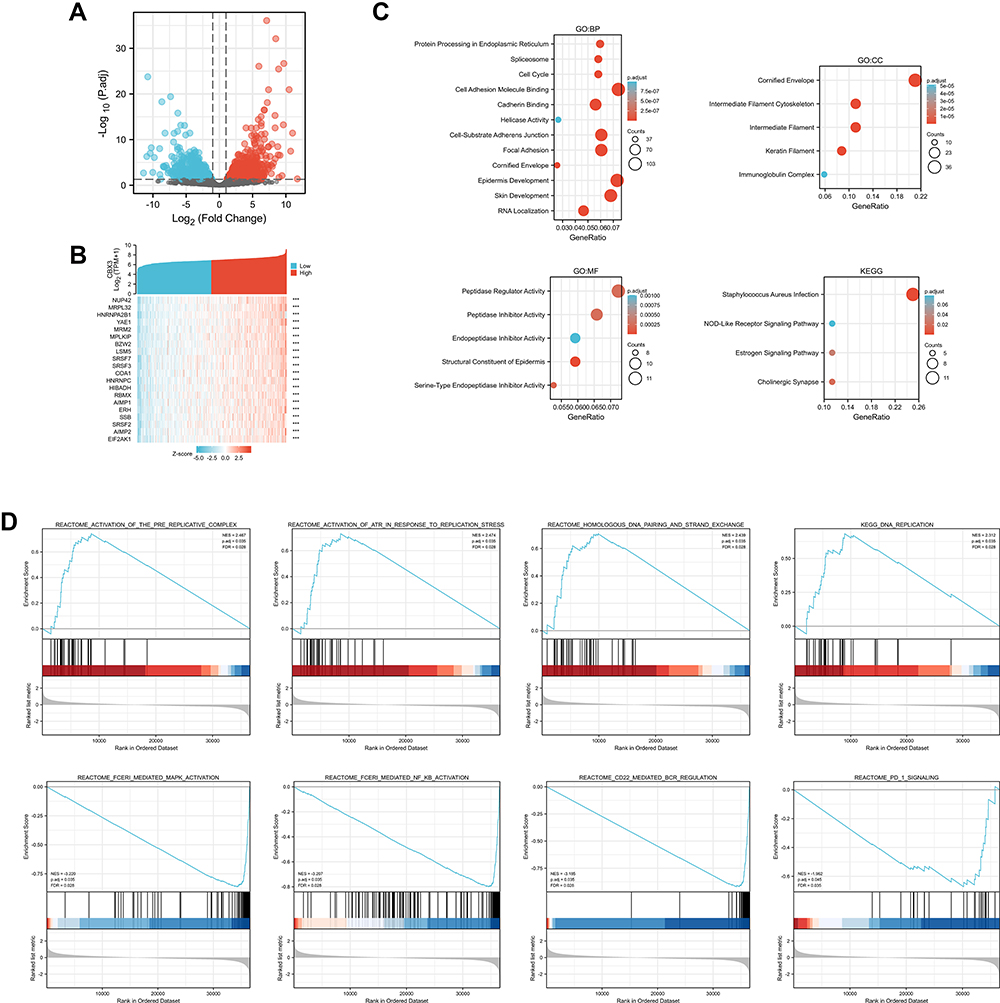 |
Figure 4 Differentially expressed genes (DEGs) in High CBX3 expression and Low CBX3 expression samples and functional cluster analysis. (A) Volcano map of DEGs with |log2FoldChange >2| and adjusted P value<0.05. (B) Heat map of top 10 DEGs in high and low CBX3 expression groups. (C) Significantly enriched GO and KEGG annotations of CBX3 related genes. (D) Enrichment genes analysis by GSEA. |
Correlation Between CBX3 Expression and Immune Infiltration
We used Spearman correlation to analyze the correlation between CBX3 expression and immune cell infiltration levels (generated by ssGSEA). The results are shown in Figure 5A. CBX3 expression was significantly negatively correlated with mast cells. The Spearman R value was –0.314, with P < 0.001. The Wilcoxon rank-sum test corroborated that compared with the CBX3-high expression group, mast cell infiltration was higher in the CBX3-low expression group (Figure 5B). Other immune cells that were statistically significantly enriched were dendritic cells (DCs), neutrophils, immature DCs, and Th17 cells (Figure 5B).
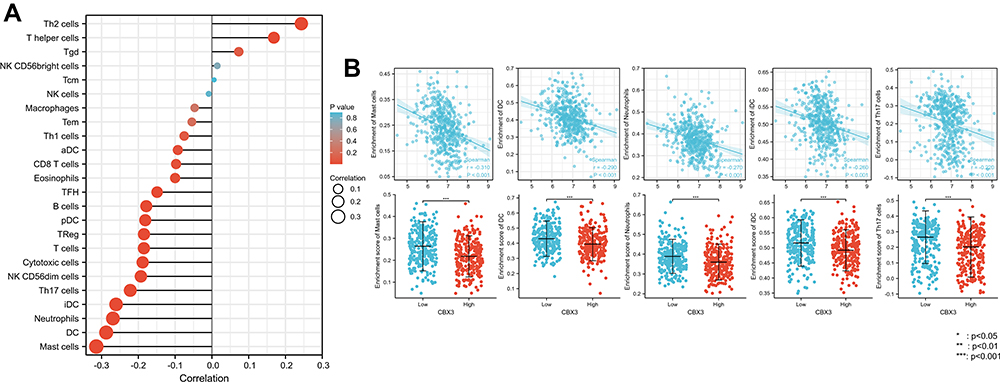 |
Figure 5 The expression level of CBX3 was associated with the immune infiltration in tumor environment. (A) The plots showed the correlation between CBX3 expression and immune cells subsets. (B) Spearman correlation and expression distribution of mast cells, DCs, neutrophils, iDCs, and Th17 cells in low and high CBX3 samples. |
Discussion
Patients with HNSCC have a poor five-year survival (<50%) and a high risk for regional recurrence or distal metastasis.10 Efficient biomarkers for HNSCC diagnosis and treatment are lacking. The identification of novel biomarkers for HNSCC diagnosis and prediction is needed. CBX3 interacts with various cofactors to exert various biological functions, including RNA alternative splicing, DNA damage response, transcription elongation, cell growth, and differentiation.11 CBX3 is normally not detected in differentiated cells of various normal human tissues, but is detected in tumor tissues of various cancers, including esophageal, lung, cervical, colon, and breast cancers.12–15 Substantial evidence indicates that CBX3 has cancerogenic and prognostic roles in various cancer types. However, the exact functions of CBX3 in HNSCC remain unclear.
In this study, by analyzing TCGA data, we found that CBX1, CBX2, CBX3, CBX4, CBX5, and CBX8 exhibit increased expression in tumor tissues of most cancers when compared with normal tissues, while CBX6 and CBX7 show reduced expression. In HNSCC, many CBX family members were highly expressed in tumor tissues. The ROC curve showed that CBX1, CBX2, CBX3, CBX4, CBX5, and CBX8 exhibited potential as diagnostic makers.
We researched the relationships between CBX family members and prognosis. High CBX3 expression was correlated with poor prognosis, whereas high CBX5 expression was correlated with good prognosis. The other members were not correlated with prognosis. Therefore, we further focused on CBX3 and CBX5. The odds ratios of CBX3 and CBX5 expression indicated that they may serve as diagnostic markers. Moreover, high CBX3 expression in HNSCC was associated with a high clinical stage, high histologic grade, and lymphovascular invasion. High CBX5 expression in HNSCC was associated with high histologic grade. CBX3 performed well as a prognostic marker as indicated by these results.
To investigate the potential function of CBX3 in HNSCC further, we analyzed DEGs in low- and high-CBX3 expression groups. Among the upregulated DEGs, AIMP2, SRSF2, and ERH are reportedly related to tumor progression in several cancers. High AIMP2 expression predicts poor prognosis in hematologic cancer.16 SRSF2 is a key regulator of RNA splicing dysregulation in cancer with possible clinical implications as a candidate prognostic factor in patients with hepatocellular carcinoma.17 ERH regulates MYC gene expression and is related to the migration and invasion of bladder cancer.18 According to GO analysis, CBX3 affects adhesion molecule binding and epidermis development, which is associated with epithelial-mesenchymal transition of cancer cells.19 According to KEGG analysis, CBX3 involved in Staphylococcus aureus infection pathway, but there was no research about the relationship between CBX3and this pathway. These results suggest that CBX3 may affect cancer progression via various mechanisms.
We performed GSEA to search for potential pathways affected by CBX3. The results indicated that CBX3 may affect HNSCC progression through ATR activation in response to replication stress and activation of the pre-replicative complex, which are related to DNA repair in cancer cells.20 ATR is a critical component of the cellular DNA damage response.21 ATR is activated by regions of single-stranded DNA, some of which occur as a result of replication stress.22–24 High ATR expression may provide a stable environment for oncogenes and relate to poor prognosis and drug resistance.25
Tumor-infiltrating immune cells offer prognostic value in several human malignancies.26–28 Therefore, we analyzed the correlations between CBX3 expression and immune cells. CBX3 expression was negatively associated with mast cells, DCs, immature DCs, and neutrophils. These immune cells can act as antigen-presenting cells (APCs) that ingest, process, and present extracellular antigens, activate CD4+ T cells, and induce an immune response.28 High CBX3 expression was associated with a reduction APCs in this study, which implies that CBX3 may suppress adaptive immunity and killer T-cell function by inhibiting the function and proliferation of APCs. However, the detailed underlying mechanism requires further investigation.
Conclusions
In conclusion, our research showed that high CBX3 expression predicts decreased OS and that CBX3 can function as a potential prognostic marker. CBX3 may affect cancer progression via various mechanisms that remain to be elucidated and promote HNSCC proliferation and invasion by activating ATR and immune cell infiltration.
Acknowledgments
We acknowledge TCGA database for providing their platforms and contributors for uploading their meaningful datasets. Xu Zhang and Wenkai Zhou are co-first authors for this study.
Funding
This article was supported by Chuying Program of Shanghai Anticancer Association (SACA-CY21A01).
Disclosure
The authors report no conflicts of interest in this work.
References
1. Siegel RL, Miller KD, Jemal A. Cancer statistics, 2020. CA Cancer J Clin. 2020;70(1):7–30. doi:10.3322/caac.21590
2. Shield KD, Ferlay J, Jemal A, et al. The global incidence of lip, oral cavity, and pharyngeal cancers by subsite in 2012. CA Cancer J Clin. 2017;67(1):51–64. doi:10.3322/caac.21384
3. Long J, Zuo D, Park M. Pc2-mediated sumoylation of Smad-interacting protein 1 attenuates transcriptional repression of E-cadherin. J Biol Chem. 2005;280(42):35477–35489. doi:10.1074/jbc.M504477200
4. Vincenz C, Kerppola TK. Different polycomb group CBX family proteins associate with distinct regions of chromatin using nonhomologous protein sequences. Proc Natl Acad Sci U S A. 2008;105(43):16572–16577. doi:10.1073/pnas.0805317105
5. Ruddock-D’Cruz NT, Prashadkumar S, Wilson KJ, et al. Dynamic changes in localization of Chromobox (Cbx) family members during the maternal to embryonic transition. Mol Reprod Dev. 2008;75(3):477–488. doi:10.1002/mrd.20752
6. Ning G, Huang Y-L, Zhen L-M, et al. Transcriptional expressions of Chromobox 1/2/3/6/8 as independent indicators for survivals in hepatocellular carcinoma patients. Aging. 2018;10(11):3450–3473. doi:10.18632/aging.101658
7. van Wijnen AJ, Bagheri L, Badreldin AA, et al. Biological functions of chromobox (CBX) proteins in stem cell self-renewal, lineage-commitment, cancer and development. Bone. 2021;143:115659. doi:10.1016/j.bone.2020.115659
8. Owens NDL, De Domenico E, Gilchrist MJ. An RNA-seq protocol for differential expression analysis. Cold Spring Harb Protoc. 2019;2019(6):
9. Webber C. Functional enrichment analysis with structural variants: pitfalls and strategies. Cytogenet Genome Res. 2011;135(3–4):277–285. doi:10.1159/000331670
10. Leemans CR, Snijders PJF, Brakenhoff RH. The molecular landscape of head and neck cancer. Nat Rev Cancer. 2018;18(5):269–282. doi:10.1038/nrc.2018.11
11. Zhang H, Chen W, Fu X, et al. CBX3 promotes tumor proliferation by regulating G1/S phase via p21 downregulation and associates with poor prognosis in tongue squamous cell carcinoma. Gene. 2018;654:49–56. doi:10.1016/j.gene.2018.02.043
12. Chang SC, Lai Y-C, Chen Y-C, et al. CBX3/heterochromatin protein 1 gamma is significantly upregulated in patients with non-small cell lung cancer. Asia Pac J Clin Oncol. 2018;14(5):e283–e288. doi:10.1111/ajco.12820
13. Slezak J, Truong M, Huang W, et al. HP1gamma expression is elevated in prostate cancer and is superior to Gleason score as a predictor of biochemical recurrence after radical prostatectomy. BMC Cancer. 2013;13:148. doi:10.1186/1471-2407-13-148
14. He Z, Chen J, Chen X, et al. microRNA-377 acts as a suppressor in esophageal squamous cell carcinoma through CBX3-dependent P53/P21 pathway. J Cell Physiol. 2021;236(1):107–120. doi:10.1002/jcp.29631
15. Liang Y-K, Lin H-Y, Chen C-F, et al. Prognostic values of distinct CBX family members in breast cancer. Oncotarget. 2017;8(54):92375–92387. doi:10.18632/oncotarget.21325
16. Ku J, Kim R, Kim D, et al. Single-cell analysis of AIMP2 splice variants informs on drug sensitivity and prognosis in hematologic cancer. Commun Biol. 2020;3(1):630. doi:10.1038/s42003-020-01353-x
17. Luo C, Cheng Y, Liu Y, et al. SRSF2 regulates alternative splicing to drive hepatocellular carcinoma development. Cancer Res. 2017;77(5):1168–1178. doi:10.1158/0008-5472.CAN-16-1919
18. Pang K, Zhang Z, Hao L, et al. The ERH gene regulates migration and invasion in 5637 and T24 bladder cancer cells. BMC Cancer. 2019;19(1):225. doi:10.1186/s12885-019-5423-9
19. Song Y, Zhu Z, An Y, et al. Selection of DNA aptamers against epithelial cell adhesion molecule for cancer cell imaging and circulating tumor cell capture. Anal Chem. 2013;85(8):4141–4149. doi:10.1021/ac400366b
20. Lecona E, Fernandez-Capetillo O. Targeting ATR in cancer. Nat Rev Cancer. 2018;18(9):586–595. doi:10.1038/s41568-018-0034-3
21. Shiloh Y, Ziv Y. The ATM protein kinase: regulating the cellular response to genotoxic stress, and more. Nat Rev Mol Cell Biol. 2013;14(4):197–210. doi:10.1038/nrm3546
22. Zou L, Elledge SJ. Sensing DNA damage through ATRIP recognition of RPA-ssDNA complexes. Science. 2003;300(5625):1542–1548. doi:10.1126/science.1083430
23. Moynahan ME, Jasin M. Mitotic homologous recombination maintains genomic stability and suppresses tumorigenesis. Nat Rev Mol Cell Biol. 2010;11(3):196–207. doi:10.1038/nrm2851
24. Zeman MK, Cimprich KA. Causes and consequences of replication stress. Nat Cell Biol. 2014;16(1):2–9. doi:10.1038/ncb2897
25. Karnitz LM, Zou L. Molecular pathways: targeting ATR in cancer therapy. Clin Cancer Res. 2015;21(21):4780–4785. doi:10.1158/1078-0432.CCR-15-0479
26. Chirica M, Le Bourhis L, Lehmann-Che J, et al. Phenotypic analysis of T cells infiltrating colon cancers: correlations with oncogenetic status. Oncoimmunology. 2015;4(8):e1016698. doi:10.1080/2162402X.2015.1016698
27. Lee AM, Clear AJ, Calaminici M, et al. Number of CD4+ cells and location of forkhead box protein P3–positive cells in diagnostic follicular lymphoma tissue microarrays correlates with outcome. J Clin Oncol. 2006;24(31):5052–5059. doi:10.1200/JCO.2006.06.4642
28. Englund E, Reitsma B, King BC, et al. The human complement inhibitor Sushi Domain-Containing Protein 4 (SUSD4) expression in tumor cells and infiltrating T cells is associated with better prognosis of breast cancer patients. BMC Cancer. 2015;15(1):737. doi:10.1186/s12885-015-1734-7
 © 2022 The Author(s). This work is published and licensed by Dove Medical Press Limited. The full terms of this license are available at https://www.dovepress.com/terms.php and incorporate the Creative Commons Attribution - Non Commercial (unported, v3.0) License.
By accessing the work you hereby accept the Terms. Non-commercial uses of the work are permitted without any further permission from Dove Medical Press Limited, provided the work is properly attributed. For permission for commercial use of this work, please see paragraphs 4.2 and 5 of our Terms.
© 2022 The Author(s). This work is published and licensed by Dove Medical Press Limited. The full terms of this license are available at https://www.dovepress.com/terms.php and incorporate the Creative Commons Attribution - Non Commercial (unported, v3.0) License.
By accessing the work you hereby accept the Terms. Non-commercial uses of the work are permitted without any further permission from Dove Medical Press Limited, provided the work is properly attributed. For permission for commercial use of this work, please see paragraphs 4.2 and 5 of our Terms.