")
Back to Journals » Diabetes, Metabolic Syndrome and Obesity » Volume 13
Cbl Proto-Oncogene B (CBLB) c.197A>T Mutation Induces Mild Metabolic Dysfunction in Partial Type I Multiple Symmetric Lipomatosis (MSL)
Authors Chen K , Wan X, Zhao L, Zhao S, Peng L, Yang W, Yuan J, Zhu L , Mo Z
Received 24 July 2020
Accepted for publication 11 September 2020
Published 6 October 2020 Volume 2020:13 Pages 3535—3549
DOI https://doi.org/10.2147/DMSO.S273780
Checked for plagiarism Yes
Review by Single anonymous peer review
Peer reviewer comments 2
Editor who approved publication: Professor Ming-Hui Zou
Ke Chen,1 Xinxing Wan,1 Liling Zhao,1 Shaoli Zhao,1 Lin Peng,2 Wenjun Yang,1 Jingjing Yuan,1 Liyong Zhu,3 Zhaohui Mo1
1Department of Endocrinology, The Third Xiangya Hospital of Central South University, Changsha, Hunan 410013, People’s Republic of China; 2Department of Nephrology, The First Hospital of Changsha, Changsha, Hunan 410005, People’s Republic of China; 3Department of General Surgery, The Third Xiangya Hospital of Central South University, Changsha, Hunan 410013, People’s Republic of China
Correspondence: Zhaohui Mo Tel/Fax +86 731 88618006
Email [email protected]
Background: Multiple symmetric lipomatosis (MSL) is a rare disease showing chronic progression of multiple, symmetrical, and non-encapsulated subcutaneous lipoma. The cause of the disease remains unknown.
Patients and Methods: This study reported and summarized 13 sporadic cases of Type I MSL patients in terms of histopathology and cellular and molecular biology and assessed the CBLB c.197A>T mutation in the IRS1-PI3K-Akt pathway.
Results: The clinical data showed that these 13 Type I patients were all male with a mean age of 57.0 ± 6.6 years old and consumed alcohol heavily. The laboratory tests revealed that most of the patients had hyperuricemia, diabetes, hyperinsulinemia, or insulin resistance; however, their blood lipid levels were close to a normal range. The imaging data exhibited lipomas that only occurred subcutaneously but not viscerally, ie, Types Ia (15.4%), Ib (30.8%), and Ic (53.8%). The molecular analyses of adipocytes of isoprenaline stimulated human adipose tissue-derived mesenchymal stromal cells (hADSCs) isolated from the adipose tissue lipoma-like masses (ATLLM) demonstrated that these adipocytes did not express UCP-1. The Cbl proto-oncogene B (CBLB), an E3 ubiquitin-protein ligase, was associated with insulin resistance and obesity and was mutated (ie, CBLB c.197A>T) in four MSL patients after the whole genome and Sanger sequencing of the blood samples. Furthermore, the CBLB c.197A>T mutation induced hADSC resistance to insulin by inactivation of the IRS-1-PI3K-AKT pathway.
Conclusion: This study analyzed clinical, histopathological, and cellular and molecular biological characterizations of 13 Type I MSL patients and identified the CBLB c.197A>T heterozygous mutation that could be responsible for MSL metabolic dysfunction or even MSL development.
Keywords: multiple symmetric lipomatosis, MSL, manifestation, characterization, CBLB
Introduction
Multiple symmetric lipomatosis (MSL), a rare benign abnormal fat distribution disorder, is clinically characterized by very slow growth of multiple, symmetrical, and non-encapsulated adipose tissue in the face, neck, shoulder, back, and abdomen.1,2 Dr. Brodie reported the first MSL case in 1846 and Dr. Madelung summarized 33 cases in 1888, so it was also named Madelung disease.3 The MSL incidence rate is 1:25,000 in the Mediterranean region but is very low among Asian populations, and the age of onset is usually between 30 and 70 years old in men, occurring up to 30 times more frequently in men than in women.4,5 Although most MSL cases occur sporadically, it has also been reported in hereditary family MSL.6–9 The cause of the disease remains unknown, but alcohol abuse is an important risk factor in MSL development and avoidance of alcohol consumption may prevent disease progression.9–11 Furthermore, other factors, like diabetes, hyperlipidemia, fatty liver, obstructive sleep apnea syndrome (OSAHS), or other metabolic diseases, were also reported to be associated with MSL development,12 although Harsch IA and we showed normal metabolic parameters in MSL patients.13,14 Molecularly, gene mutation or deletion was associated with MSL development. For example, mtDNA (m.A8344G, m.G8363A, or m.T8357C) mutations of the tRNALys or single mtDNA deletions in MSL patients7,9,15–18 and the latter gene mutations resulted in a clinical characterization of myoclonus epilepsy associated with ragged-red fibers (MERRF) syndrome.17 In contrast, gene mutations or deletions of the non-mitochondrial genes, including mitofusin-2 (MFN2), Lipase E, Hormone Sensitive Type (LIPE) and Calcyphosine Like (CAPSL), were also reported in familial MSL.17,19,20 In addition, alcohol could lead to mitochondrial or β-adrenoceptor dysfunction and result in altered mitochondrial function and loss of or reduced lipolysis.11,15 The adipose tissue lipoma-like mass (ATLLM) specimens obtained from MSL patients showed multilocular and small adipocytes or were rich in fibrous and vascular tissues compared with the normal subcutaneous adipose tissues (SATs).11,16,19 Human adipose tissue-derived mesenchymal stromal cells (hADSCs) isolated from MSL adipose tissues expressed a high level of uncoupling protein 1 (UCP-1), a marker of brown adipose tissues, and even higher UCP-1 levels after noradrenaline stimulation.21,22 Thus, it is speculated that the ATLLM may originate from the brown adipose tissue, depending on further investigation.
Cbl proto-oncogene B (CBLB), a highly conserved protein, encodes an E3 ubiquitin-protein ligase as a critical factor to promote proteosome-mediated protein degradation and participates in the immune response, insulin resistance, inflammation, allergies, and cancer development.23–25 CBLB also regulates the function of macrophages and T-cells, including cell maturation and activity, and participates in insulin insistence after macrophage infiltration into the adipose tissues; for example, CBLB-/- elderly mice (20 weeks or older) had a serious insulin insistence and decrease in glucose intolerance and triglyceride (TG) levels but an increase in epididymal fat weight, although the body weight may be normal.26 CBLB was able to specifically degrade the insulin receptor substrate 1 (IRS1) protein and negatively regulate the PI3K-IRS1-AKT activity; however, CBLB overexpression significantly downregulated the levels of phosphoinositide 3-kinas (PI3K), IRS1, and protein kinase B (AKT) in T cells, basophilic leukemic cells, and osteoblasts.27–29 In this study, we speculated that CBLB might suppress insulin-induced activity of the IRS1-PI3K-AKT pathway in adipocytes. Previous studies using the exome sequencing technique assessed gene mutations of familial MSL;16,19,20,30 however, most MSL cases were sporadic, and familial cases were rare. Thus, whole genome sequencing (WGS) was used to explore gene mutations in these 13 sporadic Type I MSLs. We then summarized their clinical, histopathological, and cellular and molecular biological data and then assessed the CBLB c.197A>T mutation and explored the molecular mechanism of the CBLB c.197A>T mutation in the regulation of gene expression and the IRS1-PI3K-AKT pathway in MSL.
Patients and Methods
Patients and Sample Collection
In this study, we collected 13 MSL cases and 343 unrelated control males between July 2008 and October 2019 from The Department of Endocrinology and General and Urology Surgery, The Third Xiangya Hospital of Central South University (Changsha, China). The MSL patients were clinically diagnosed with MSL according to typical symptoms and signs. The control patients suffered from chronic cholecystitis but had no acute inflammation, diabetes, cancer, or mental illness. The abdominal (P1, P2, P4, P6, and P9) and neck (P11) SATs from MSL and control patients (n = 6) were obtained surgically and the perirenal adipose tissues (PATs; n = 4) were obtained from control patients who were diagnosed with kidney stones. Blood samples were also collected from all patients after 8 hours of fasting. The bone mineral density (BMD) and the percentage of the total body fat mass were assessed by using dual-energy X-ray absorptiometry (GE-Lunar DPX-NT, USA). This study was approved by the Ethics Committee of The Third Xiangya Hospital of Central South University (Changsha, China), and was performed according to the guidelines outlined in the Declaration of Helsinki. All participants provided a written informed consent form.
hADSCs Isolation and Differentiation and Isoprenaline Stimulation
The hADSCs were isolated from adipose tissue, cultured for differentiation, and stained with the Oil Red O according to our previous study.31 Briefly, 10 grams of fresh SATs were washed in physiological saline (PBS) three times, cut into a size of 1 mm × 1 mm, and digested in collagenase I solution (Gibco, Life Technology, China) for 1 hour at 37°C. After that, the mixture was filtered through a 70-µm cell strainer (BD Falcon, Becton Dickinson, Franklin Lakes, NJ, USA) and centrifuged at 150× g for 10 minutes. Next, the supernatant was gently poured off and the cells were combined with 3 mL of erythrocyte lysate (Beyotime Institute of Biotechnology, Shanghai, China) and then incubated for 3 minutes and centrifuged at 150× g for 10 minutes to collect the cells. The cells were washed with PBS three times through centrifugation at 150 g for 10 minutes each and finally cultured in DMEM/F12 (Life Technologies, Carlsbad, CA, USA) and supplemented with 10% fetal bovine serum (FBS; Life Technologies). The mature adipocytes that were induced from MSL hADSCs were stimulated by 1 μM, 5 μM, or 10 μM of isoprenaline (Hefeng Pharmaceutical Co., Ltd., Shanghai, China).
Hematoxylin and Eosin (H&E) Staining and Immunohistochemistry
The SATs from MSL (P1, P2, P4, P6, P9, and P11), SATs, and PATs from control patients were fixed in 10% buffered formalin and routinely dehydrated and subsequently embedded in paraffin for preparation of the 4 μM-thickness tissue sections. The sections were stained with hematoxylin and eosin or immunohistochemically with anti-CBLB (Cat. #12781-1-AP; at a dilution of 1:200; Proteintech, Wuhan, China) or UCP-1 (Cat. #23673-1-AP; at a dilution of 1:200; Proteintech) antibody. The color reaction was performed using 2% of 3,3ʹ-diaminobenzidine solution (DAB; Solarbio® Life Sciences, Beijing, China), and the images were taken under a light microscope (Leica DM IL LED Fluo, Germany).
Quantitative Reverse Transcriptase-Polymerase Chain Reaction (qRT-PCR)
Total RNA was isolated from tissue and hADSCs using a TRIzol reagent (Life Technologies) and reversely transcribed into cDNA using a reverse transcription kit (Promega, Madison, WI, USA) according to the manufacturers’ instructions. qPCR was amplified using Mastercycler®ep real-time PCR (Eppendorf, Hamburg, Germany) with gene specific primers (Supplementary Table 1). The relative levels of gene expression were calculated by using the method of 2-ΔΔCT. The experiment was in duplicate and repeated three times.
Western Blot
The tissue or cells were lysed in a radioimmunoprecipitation assay (RIPA) buffer (Sigma-Aldrich, St Louis, MO, USA), and the protein concentration was quantified by using a bicinchoninic acid (BCA) assay (Beyotime Institute of Biotechnology, Shanghai, China). The protein samples were then separated in sodium dodecyl sulphate-polyacrylamide gel electrophoresis (SDS-PAGE) gels and electroblotted onto polyvinylidene difluoride (PVDF) membranes (Millipore, Billerica, MA, USA). The membranes were first blocked in 5% skimmed milk in 0.1% Tween-20 at room temperature for 1.5 hours and then incubated with the primary antibody, ie, anti-CBLB (see above), GAPDH (Cat. #60004-1-Ig; Proteintech), AKT (Cat. #ab179463; Abcam, Cambridge, MA, USA), IRS1 (Cat. #ab40777; Abcam), p-AKT (Cat. #4060; Cell Signaling Technology, Danvers, MA, USA), and p-IRS1 (Cat. #2385; Cell Signaling Technology) at 4°C overnight and subsequently with the peroxidase-conjugated secondary antibody. The positive protein bands were visualized by using the eECL Western Blot Kit (Beyotime Institute of Biotechnology, Shanghai, China) and captured with ChemiDocTM CRS + Molecular Imager (Bio-Rad, Hercules, CA, USA). The experiment was repeated three times.
Genomic DNA Extraction and Whole Genome Sequencing (WGS)
The genomic DNA was extracted from blood samples from the P1 to P13 patients using a DNeasy blood kit (Qiagen, Valencia, CA) according to the manufacturer’s protocol and then quantified using a Qubit® DNA Assay Kit in a Qubit® 2.0 Fluorometer (Life Technologies). After that, 0.8 μg genomic DNA from each sample with high molecular weight (> 20 Kb single band of DNA after agarose gel electrophoresis) were used for preparation of the DNA library using the TruSeq Nano DNA HT Sample Prep Kit (Illumina, USA) and WGS according to a previous study.32 The raw high-throughput data from P1 to P7 patients were detected with a Illumina Hiseq platform and filtered with the SOAPnuke (v. 1.5) software to remove the adapter sequences and the low-quality reads, whereas the high-quality clean reads were mapped to the human reference genome (hg19; NCBI build GRCh37) with Burrows-Wheeler Aligner (BWA; v. 0.7.12) software.
Bioinformatical Analysis and Sanger Sequencing
All gene mutation data were analyzed by filtered them by these seven steps, ie, (1). The data was filtered for the allele frequency (AF) less than 0.01. The data were filtered with the human gene mutation database (HGMD Professional), the Online Mendelian Inheritance in Man (OMIM), and GeneTests (www.genetests.org), and then with 1000 genomes (http://www.internationalgenome.org/), the ExAC (http://exac.broadinstitute.org/), and the gnomADgenomes (https://macarthurlab.org); (2). The data were then filtered with the harmfulness analysis. The gene mutations were analyzed and predicted by the SIFT (http://sift.jcvi.org), LRT (http://www.genetics.wustl.edu/jflab/), Mutation Taster (http://www.mutationtaster.org), Polyphen2 HVAR, and Polyphen2 HDIV (http://genetics.bwh.harvard.edu/pph2); (3). The data were then filtered for the gene mutations that are not localized at the functional regions; (4) The data were then. Filtered with for the synonymous mutations and repeat regions; (5) The data were then. Filtered for the intron sites; (6). Annotated with the phenolyzer (http://phenolyzer.wglab.org/), ACMG (https://www.acmg.net/), and the document reporting method of genes that participate in the adipogenesis, lipid metabolism (intake, synthesis, and lipolysis), fat distribution, brown fat metabolism, mitochondria, ethanol metabolism, and tricarboxylic acid cycle; (7) The data was lastly filtered for common gene mutations (≥ 3 patients of P1 to P7 were then analyzed and summarized, while the samples of all patients from P1 to P13 and 343 unrelated controls were subjected to Sanger sequencing). Lastly, the conservation of CBLB p.Q66L point mutations was analyzed by the UCSC software (http://genome.ucsc.edu)].
Plasmid Construction, Lentivirus Production, and Cell Infection
The human CBLB cDNA (#NM_170662.3) was amplified to subclone the expression vector (GV218) using a primer set (5ʹ-GAGGATCCCCGGGTACCGGTCGCCACCATGGCAAACTCAATGAATGGCAGAAACC-3ʹ and 5ʹ-TCACCATGGTGGCGACCGGTAGATTTAGACGTGGGGATACTGGAG-3ʹ), while plasmids carrying the human wild type CBLB (LV-wt-CBLB), mutated CBLB (LV-mut-CBLB), negative control (LV-NC), CBLB-RNAi (LV-CBLB-RNAi), and CBLB-negative control RNAi (LV-CBLB-NC-RNAi) were constructed, and the lentiviruses were produced by GeneChem Co. Ltd. (Shanghai, China). Human embryonic kidney 293 (HEK-293) cells, originally obtained from American Type Culture Collection (Manassas, VA, USA), were infected with LV-wt-CBLB, LV-mut-CBLB, or LV-NC using 2 mg/mL polybrene (GeneChem Co. Ltd.) in a serum-free medium for 16 hours and the medium was replaced with a complete medium for 72 hours. The infection efficiency and subcellular localization of the CBLB protein was verified under a fluorescence microscope (Leica DM IL LED Fluo). The lentivirus carrying RNAi was used to infect cells according to the manufacturer’s protocols. After lentivirus infection and confirmation under a fluorescence microscope, these hADSCs were treated with 100 nM insulin (Cat. #I6634; Sigma), 0.1 nM palmitic acid (PA; Cat. #P0500; Sigma), or 10 nM glucose (Cat. #G8270; Sigma) for 24 hours. The levels of the IRS1, p-IRS1, AKT, and p-AKT proteins were assayed using a Western blot.
Statistical Analysis
The results were summarized and presented as the mean plus or minus the standard deviation (SD) and analyzed using an unpaired or paired Student’s t-test for two groups of data or by using a one-way analysis of variance (ANOVA) for multiple groups of data. The statistically significant level was defined as p < 0.05.
Results
Characteristics of Patients
All of these 13 patients were from Hunan, China, and they were all male with a mean age of 57.0 ± 6.6 years old. Their medical history showed that they all consumed alcohol heavily for 8–40 years, while their ATLLM formation was very slow (between 1 and 25 years for a mean of 7.38 ± 6.76 years). Despite SATs formation, most patients had a normal Body Mass Index (BMI) except for the P1 patient. Furthermore, biochemical tests showed that most patients had mild liver damage, especially in the P2 and P7 patients who were diagnosed with liver cirrhosis according to the color B ultrasound and type III pro-collagen (PIIINP), collagen IV (CIV), laminin (LN), and hyaluronic acid (HA) levels; thus, we speculate that alcohol and fat deposition contributed to their liver cirrhosis. P1, P7, P10, and P13 patients showed symptoms of myasthenia. The patients with significant adipose accumulation in the neck (ie, P5, P7, P10, and P13 patients) had OSAHS (Figure 1A and Table 1). However, all patients had normal erythrocyte sedimentation rates (ESR) and C-reactive protein (CRP; Table 1). Furthermore, P10 and P13 patients received a surgical resection of the adipose tissues from the anterior neck for ATLLM that occurred 10 years ago and were persistently slow growing. P2 patient with a liver cirrhosis diagnosis received a gastroscopy and showed a 1.2 cm × 1.0 cm × 0.6 cm capsuled lipoma in the duodenal bulb (Supplementary Figure 1).
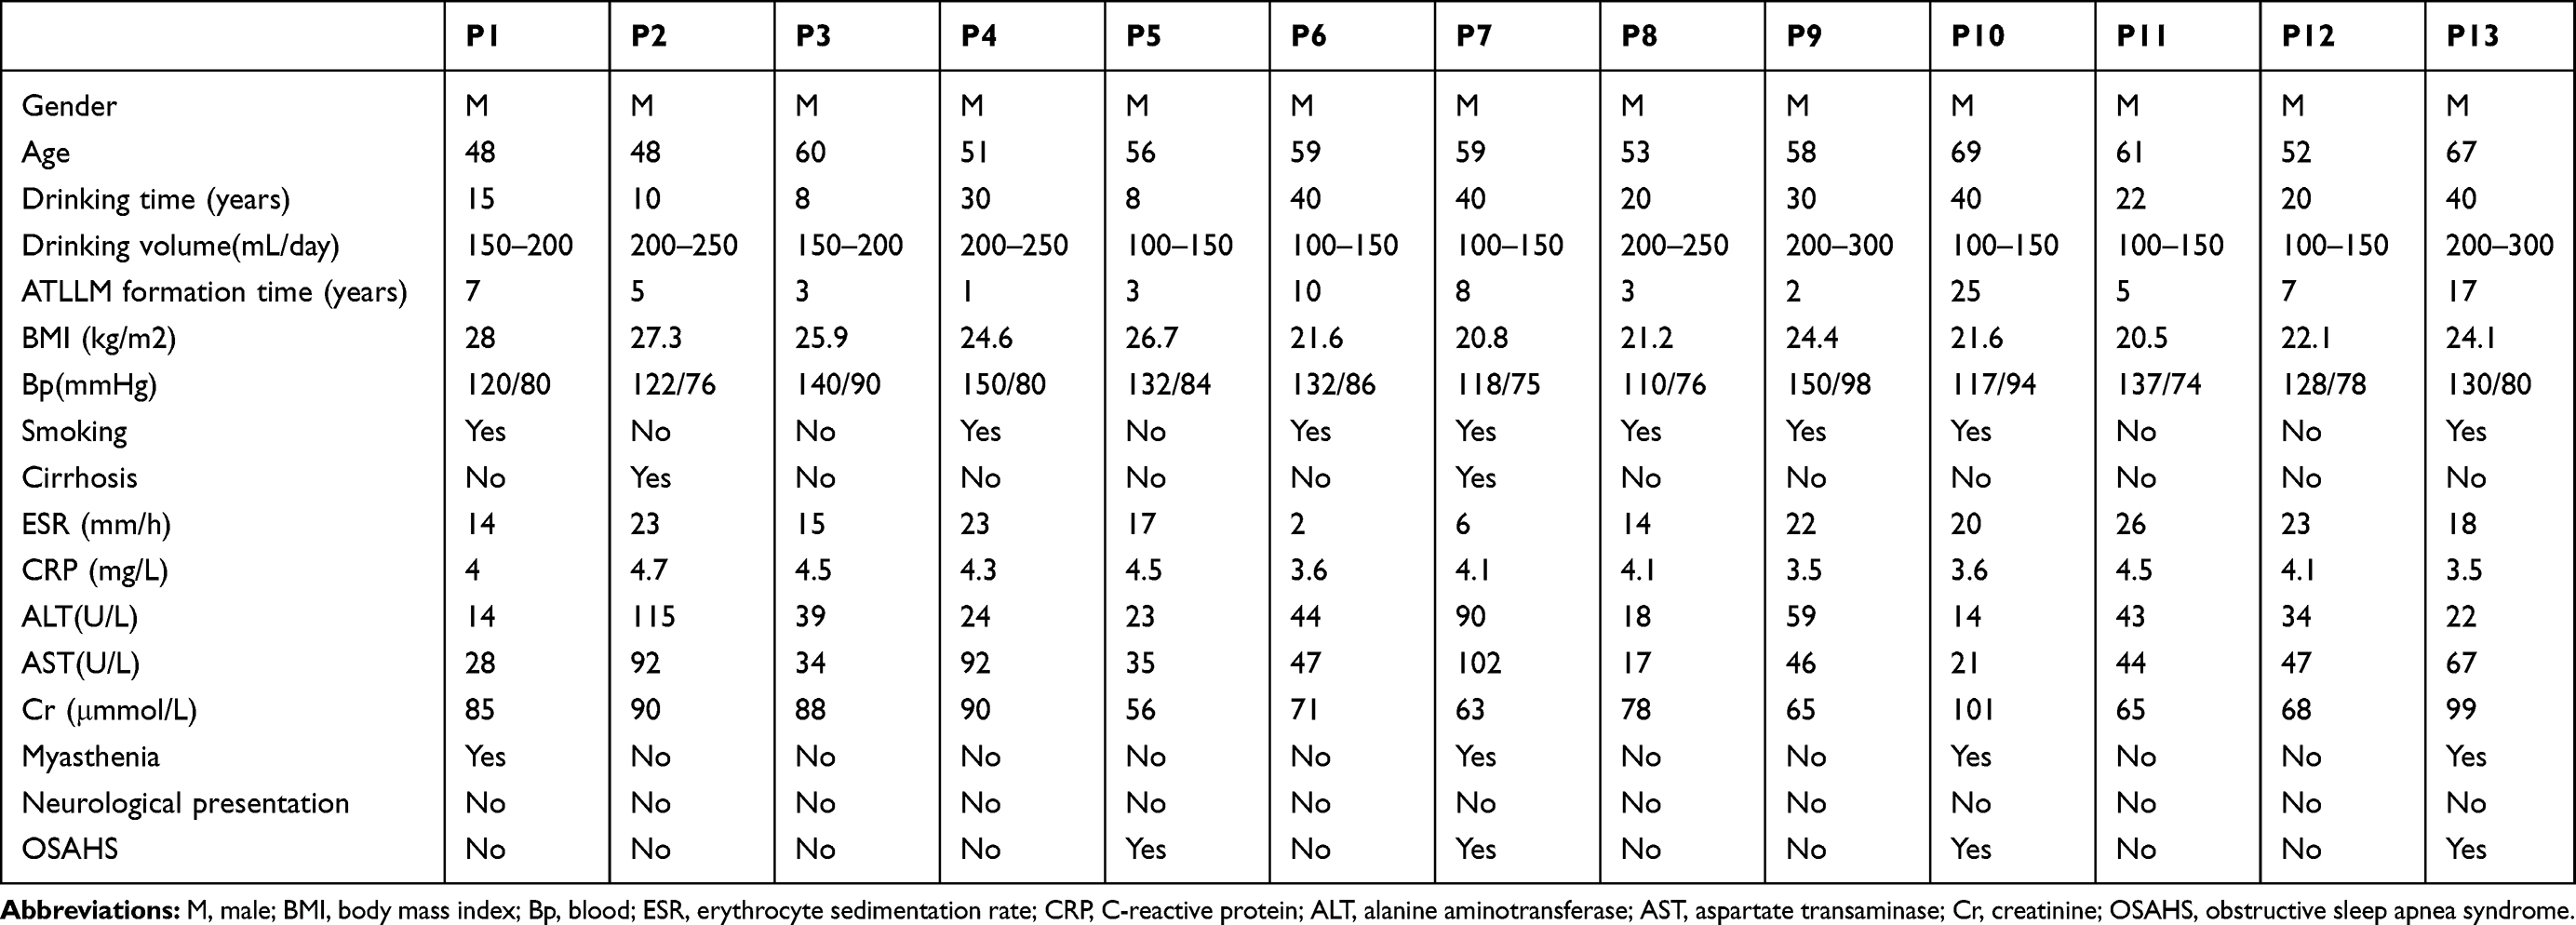 |
Table 1 Clinicopathological Features of These 13 MSL Patients |
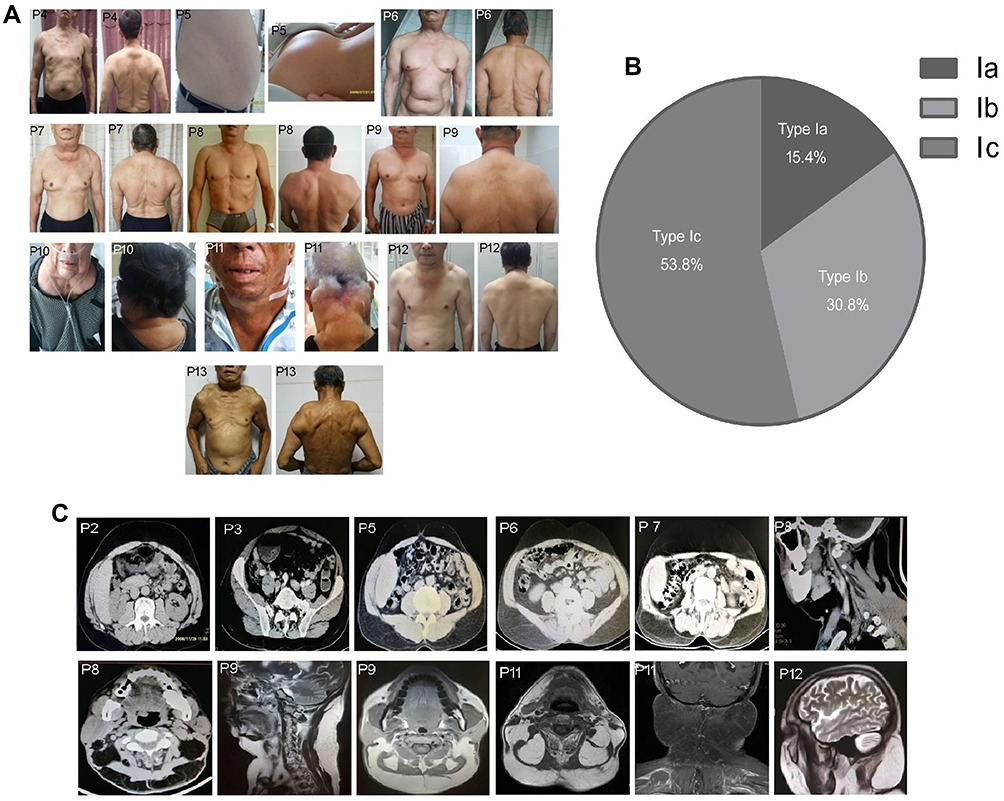 |
Figure 1 Distribution of the MSL adipose tissues and image examinations. (A) Photographs of the clinical phenotype in these 13 MSL patients, and adipose tissue accumulated in the nuchal region, upper thorax, both upper arms, shoulders, abdomen, and the back in P1 to P6 and P13 patients, in the nuchal region and shoulders adipose tissues in P7, P8, P9, and P12 patients, and in the nuchal region in P10 and P11 patients. (B) MSL clinical classification according to the adipose tissue distribution. (C) Images of adipose tissue accumulation. The CT image data shows that abdomen adipose tissues only occur in the subcutaneous but not visceral locations in P1 to P6 and P13 patients, and CT images of the adipose tissues in the nuchal region and the anterior and posterior neck in P8 and P9 patients and MRI in P11 and P12 patients. |
Alteration of Mild Metabolic and Endocrinic Parameters
Next, we found alteration of the metabolic and endocrinic parameters in most of the patients. For example, the blood uric acid and glucose were abnormal in P3, P5, P6, P7, P12, and P13 patients, but there was no gout in these patients. P2, P4, P7, and P11 patients were diagnosed with diabetes, P6 and P8 patients were diagnosed with impaired fasting glucose, and P9 patients were diagnosed with impaired glucose tolerance after the oral glucose tolerance test, although most patients had good control of blood glucose levels according to the HbA1c level. Furthermore, eight patients (P2, 5, 6, and 8–12) had an insulin resistance according to the HOMA-IR level, and two patients (P7 and P13) had a significant decrease in their fasting insulin levels. In contrast, these patients had an almost normal lipid profile, ie, the blood level of cholesterol (4.87 ± 0.89), TG (1.37 ± 0.62), and low-density lipoprotein (LDL: 2.19 ± 0.75). In addition, P5, P7, and P13 patients had a fatty liver diagnosis using a color B ultrasound (Table 2). All patients had a significant increase in the total body fat percentage (26.99 ± 3.77%) after the dual-energy X-ray absorptiometry, especially P1 and P3 (Table 2). All of the patients had a normal cortisol function (Table 2).
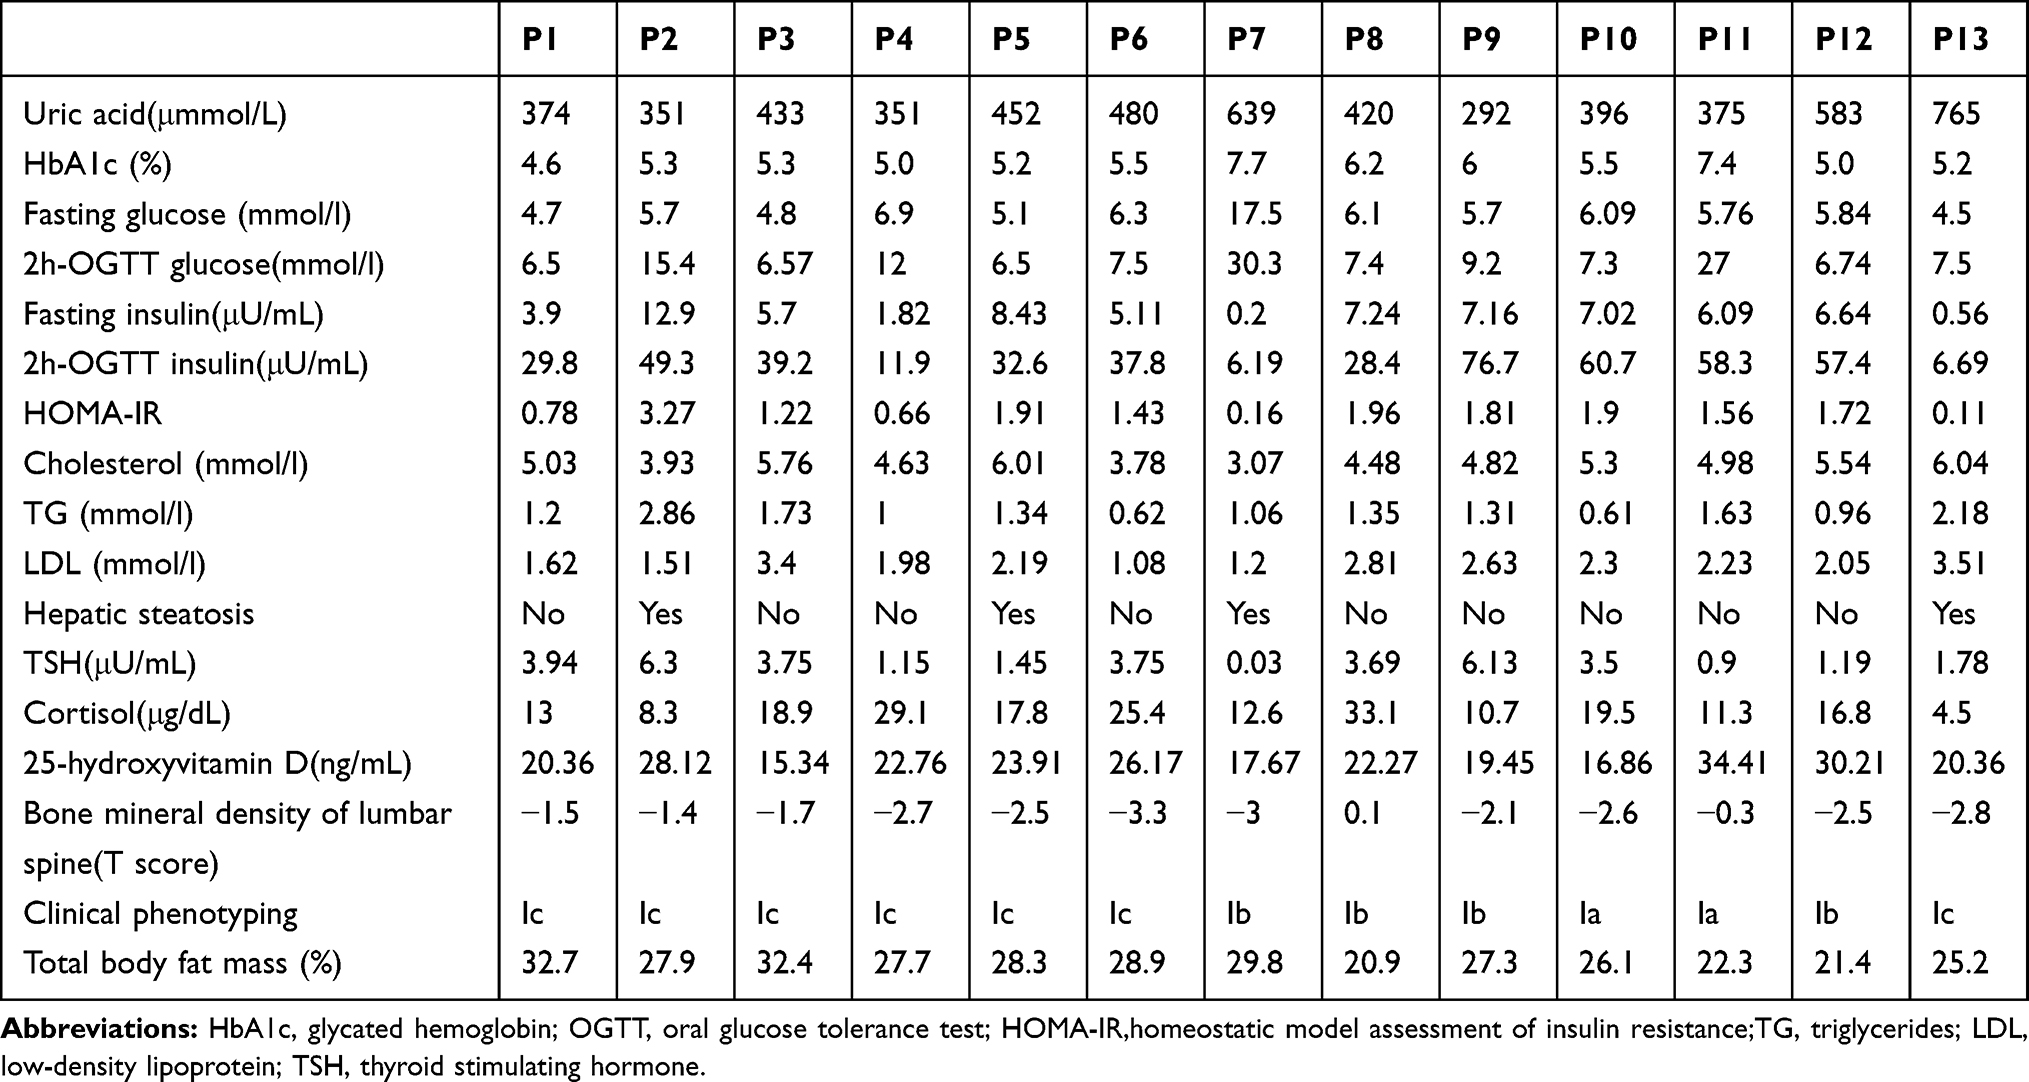 |
Table 2 Altered Metabolic and Endocrinic Parameters in These 13 MSL Patients |
MSL Patient Classification and Abnormality of the Bone Mineral Density (BMD)
According to the newly developed MSL classification system,33 our patients presented as 15.4% Type Ia, 30.8% Type Ib, and 53.8% Type Ic, but there were no Type II or III in these 13 patients. Increase in ATLLM in the P1-P6 and P13 patients resulted in a Type Ic diagnosis in the nuchal region, upper thorax, both upper arms, shoulders, abdomen, and back, while the P7, P8, P9, and P12 patients had a Type Ib diagnosis in the tissues of the nuchal region and shoulders; however, the Type Ia diagnosis only occurred in the nuchal region in P10 and P11 patients (Figure 1A and B and Table 2). Furthermore, the CT or MRI images further verified the SATs accumulation in the abdominal level in P1 - P6 and P13 patients, but the visceral adipose tissue did show a significant increase (CT for P8 and P9) and (MRI for P11 and P12; Figure 1C). However, P7, P10, and P13 patients refused any imaging scans. The clinical phenotype of P1, P2, and P3 patients and P1 CT images were reported in our previous studies.13,31
Furthermore, we scanned the patients’ lumbar spine (T score) using a dual-energy X-ray absorptiometry and found that 10 patients had osteoporosis and osteopenia, although parathyroid hormone (PTH) and alkaline phosphatase (AKP) in all patients were in a normal range (data not shown), but there was a significantly low level of 25-hydroxyvitamin D in almost all patients (Table 2). We thus speculate that low 25-hydroxyvitamin D, long-term alcohol drinking, and tobacco smoking contribute to osteoporosis or osteopenia in these patients.
Molecular Characterization of ATLLM
Previous studies demonstrated that MSL ATLLM expressed UCP-1, a biomarker of brown adipose tissues.21,22,34 In this study, we first assessed the expression of UCP-1 mRNA and protein in the ATLLM from the P1, P2, P4, P6, P9, and P11 patients and PATs and SATs from the controls using immunohistochemistry and qRT-PCR. The results revealed downregulation of UCP-1 protein and mRNA in SATs obtained from MSL patients and control patients compared with those in PATs from controls (Figure 2A and B). Furthermore, we treated induced mature adipocytes from MSL hADSCs with up to 10 μM isoprenaline; however, isoprenaline treatment was unable to induce expression of UCP-1 mRNA (Figure 2C), indicating that the MSL ATLLM did not possess the characteristics of brown adipose.
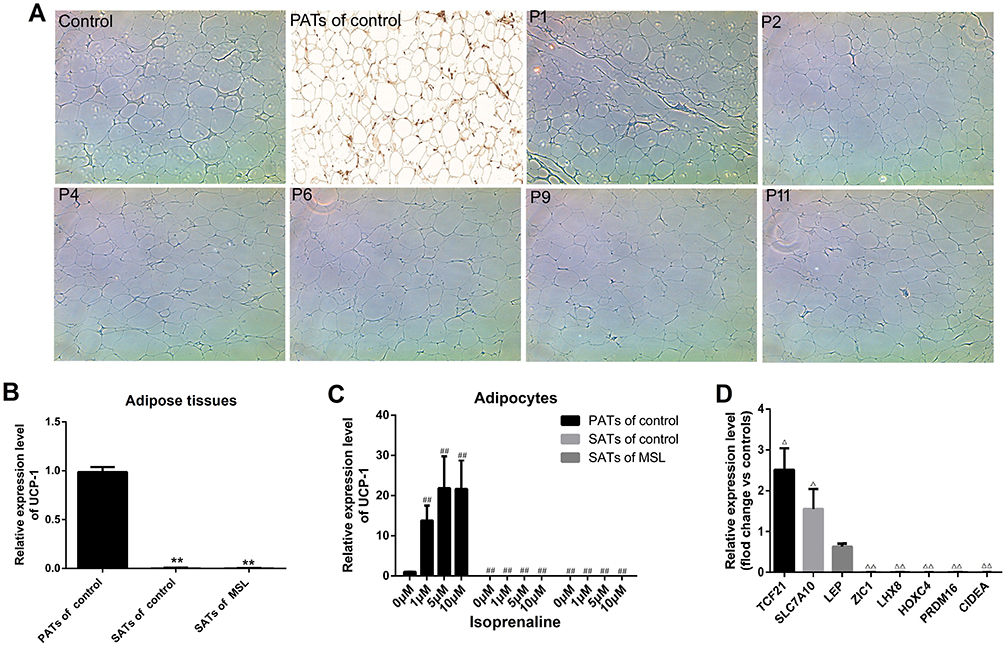 |
Figure 2 Isolation and characterization of hADSCs and ATLLM from MSL patients. (A) Immunohistochemistry. Expression of the UCP-1 protein was assessed in the ATLLM from MSL SATs, control SATs, and PATs. (B) qRT-PCR. The level of UCP-1 mRNA was detected in the ATLLM from MSL SATs (n = 6) and control SATs (n = 6) and PATs (n = 4). (C) qRT-PCR. The level of UCP-1 mRNA in the induced mature adipocytes with different concentration isoprenaline stimulation in MSL SATs (n = 6) and control SATs (n = 6) and PATs (n = 4). (D) qRT-PCR. The expression of the white and brown adipose markers in induced mature adipocytes from the MSL (n = 6) and control (n = 6). Representative blots are shown and the data is represented by the mean plus or minus SEM from 3 experiments. **P< 0.01 vs PATs of control; ##P < 0.01 vs 0 μM isoprenaline stimulation of control PATs; ΔP< 0.05, ΔΔP< 0.01 vs control. |
Furthermore, we detected expression of Myf5 and Pax7 mRNA in MSL-isolated hADSCs and found no expression of these two genes in hADSCs (CT value passed 40; data no shown). Next, we also assessed biomarkers for the white (TCF21, SLC7A10, and LEP), beige (CD137, TMEM26, TBX1, and SHOX2), and brown adipose (ZIC1, LHX8, HOXC4, PRDM16, and CIDEA) in induced mature adipocytes from MSL hADSCs. Our results showed that the adipocytes did not express any biomarkers for the brown adipose tissues, while was hardly amplified for the beige adipose markers (CT value passed 40; data no shown). In contrast, there was high expression of some white adipose tissue markers compared to those in the controls (Figure 2D). These results showed that MSL hADSCs might originate from the white but not beige or brown adipose tissues.
CBLB c.197A>T Heterozygous Mutation in MSL Tissues
Previous studies reported mutations of mtDNA (m.8344A>G; m.8363G>A), the β-adrenoceptor, MFN2, LIPE, and CAPSL in familial MSL16,19–21,30 and PTEN, MEN1, LMNA, RB1 (RB transcriptional corepressor 1), and NF causing fat redistribution.11,16,20,35–38 To explore any possible gene mutations or alterations in the MSL, we performed the WGS using blood samples from P1 to P7 patients and found that there was no mutation of these genes, especially a mtDNA mutation (m.8344A>G), after being further confirmed with Sanger sequencing in all 13 patients. The PCR primers were 5ʹ-CACTTTCACCGCTACACGAC-3ʹ and 5ʹ-GCAATGAATGAAGCGAACAG-3ʹ (Supplementary Figure 2). We then filtered our WGS data using several bioinformatical tools and found 10 common gene mutations in at least 3 patients, including C8orf59 c.264_265insAATATT (NM_001099670.1), CCDC117 c.237T>G (NM_173510.2), EYS c.3489T>A (NM_001142800.1), HCLS1 c.982_983insGGCCTGAGCCTG (NM_001292041), HTT c.1475A>C (NM_002111.6), NEB c.22241A>G (NM_001164507.1), OBSCN c.1175G>A (NM_001098623.2), SYNE2 c.20330T>C (NM_015180.4), TTN c.68645C>A (NM_001256850.1), and CBLB c.197A>T (NM_ 170662.3). After Sanger sequencing analysis, we constructed plasmids carrying the wild and mutated genes and produced lentiviruses and subsequently transfected them into hADSCs, respectively. We assessed whether these genes were able to affect the adipogenesis and the IRS1-PI3K-AKT pathway; however, we found that these gene mutations did not affect adipogenesis, but only CBLB c.197A>T was able to affect the activity of the IRS1-PI3K-AKT pathway in hADSCs.
The CBLB c.197A>T heterozygous mutation occurred in P2, P4, and P6 patients after the WGS analysis. Our Sanger sequencing of this mutation in all 13 patients showed the mutation in P2, P4, P6, and P9 patients but not in any of the 343 controls (Figure 3A–E). Furthermore, we performed bioinformatical analyses of CBLB mutation and found that the CBLB c.197A>T heterozygous mutation was localized at the “4H” functional domain, a TKB domain (Figure 3F), but this point mutation frequency was very low. The AF was lower than 0.01 in the online databases, ie, the 1000 genomes, the ExAC, the gnomAD genomes, the gnomAD exomes, the CONVERGE, and the HRC database (Supplementary Table 2). The harmfulness analysis of the mutation revealed a very high pathogenicity scores of SIFT (0.023), Polyphen2 HDIV (0.983), Polyphen2 HVAR (0.92), LRT (0.000002), and MutationTaster (1.00; Supplementary Table 3). Moreover, the conservation analysis showed a high conservation, which was predicted by different software (Supplementary Table 4). In addition, we further compared the conservation in the vertebrates using the UCSC software and found that this gene locus was highly conserved in 98 vertebrates (Figure 3G). All the bioinformatical data were summarized in https://www.pubvar.com.
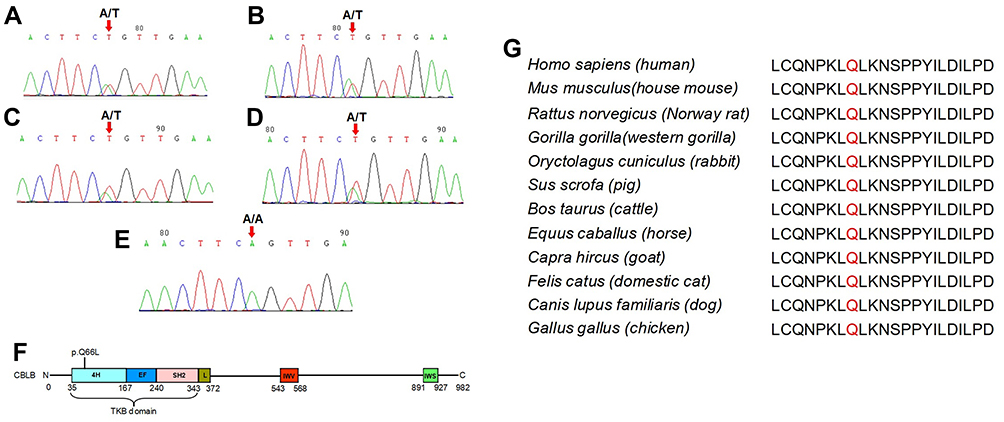 |
Figure 3 Sanger histogram of the CBLB c.197A>T heterozygous mutation in P2, P4, P6, and P9 patients. CBLB protein sequence and Conversation analysis of the CBLB p.Q66. The genomic DNA was extracted from the blood samples of all 13 MSL patients and 343 unrelated controls for the Sanger DNA sequence. (A–D) Sanger sequencing. The CBLB c.197A>T heterozygous mutation was verified in P2, P4, P6, and P9 patients, (E) not in any of the 343 unrelated controls. (F) The CBLB p.Q66L heterozygous mutation occurs in the “4H” functional domain within the TKB domain. (G) CBLB p.Q66 was the highly conserved site in 98 vertebrates analyzed with the UCSC software. |
Detection and Role of CBLB Expression in MSL ATLLM
We first performed the H&E staining of the SATs and found typical patterns of white adipose tissue characteristics; for example, the big and unilocular adipocytes with abundant fibers in the adipose tissue and unique adipocyte size compared to the controls but without the multilocular adipocytes (Figure 4A). Immunohistochemical data showed that CBLB was highly expressed in the controls and non-CBLB mutated MSL tissues from P1 and P11 patients, whereas CBLB expression was much lower in the CBLB mutated MSL tissues from P2, P4, P6, and P9 patients (Figure 4B).
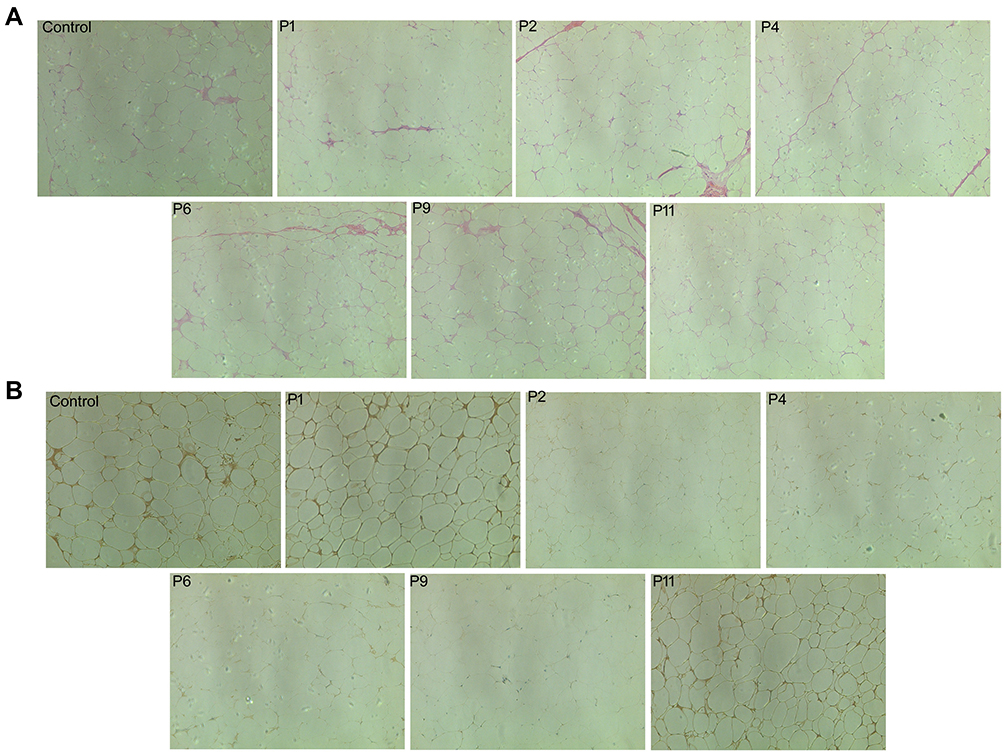 |
Figure 4 Confirmation of the ATLLM as a classic white adipose tissue with low CBLB expression in MSL. (A) H&E staining. The control SATs and PATs and MSL The SATs were subjected to tissue processing and staining for H&E. The data showed that there is no difference in either adipocyte size or morphology in the control and MSL SATs; however, there were abundant fibers in MSL SATs and smaller adipocyte size in control PATs. (B) Immunohistochemistry. The tissue sections were analyzed immunohistochemically for CBLB expression in the control, non-CBLB mutation (P1 and P11 patients), and the CBLB mutation (P2, P4, P6, and P9 patients). Strong expression of CBLB in controls and in non-CBLB mutation MSL patients, but there was low expression in CBLB mutation patients. |
Adipogenesis and Subcellular Localization of CBLB c.197A>T Heterozygous Mutated Protein
Furthermore, we explored whether CBLB protein is able to regulate adipogenesis of hADSCs using LV-NC, LV-wt-CBLB, LV-mut-CBLB, LV-CBLB-NC-RNAi, and LV-CBLB-RNAi to overexpress or knock down CBLB expression, respectively. The infection efficacy of the hADSCs was approximately 70% (The data is not shown). The resulting hADSCs were induced to mature adipocytes and analyzed by the Oil Red O staining and qRT-PCR analysis of C/EBPα, PPARγ, and FABP4, biomarkers of adipogenesis. Our data showed there was no difference in expression in these biomarkers for each group (data not shown), indicating that CBLB did not affect hADSC adipogenesis. We then detected the subcellular localization of this mutated protein in HEK293 cells after infection with LV-NC, LV-wt-CBLB, or LV-mut-CBLB. We found expression of wt- and mut-CBLB proteins in the cytoplasm (Figure 5).
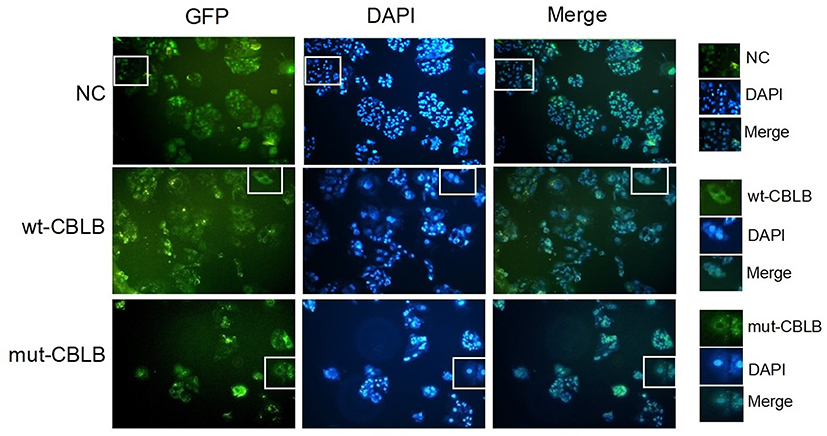 |
Figure 5 Subcellular localization of the wt- and mut-CBLB proteins. The HEK293 cells were infected with LV-NC, LV-wt-CBLB, or LV-mut-CBLB and viewed under a fluorescence microscope. The subcellular localization of the CBLB protein in LV-NC occurred in the cytoplasm and nucleus, but wt-and mut-CBLB proteins were found in the cytoplasm only. |
Mutated CBLB Induction of hADSCs Insulin Resistance
A previous study showed that CBLB was able to degrade IRS1 and inactivate IRS1-PI3K-AKT signaling to induce insulin resistance.39 Thus, this study first assessed the level of IRS1-PI3K-AKT signaling by treating hADSCs with different concentrations of glucose (2.5, 10, 25, and 100 nM), PA (0.1, 0.25, and 0.5 nM), and insulin (1, 10, 100, and 1000 nM). Our data showed that both glucose and PA suppressed, but insulin stimulated, the activity of the IRS1-PI3K-AKT pathway in a dose-dependent manner (Figure 6A–C). Furthermore, we infected hADSCs with LV-NC, LV-wt-CBLB, or LV-mut-CBLB for 72 hours, and there was no difference in the expression of IRS1, p-IRS1, AKT, and p-AKT between the LV-wt-CBLB and LV-mut-CBLB groups after 10 nM glucose or 0.1 nM PA intervention for 24 hours (Figure 6D and E); however, the hADSCs were treated with 100 nM of insulin for 24 hours. The levels of IRS1 and p-AKT were suppressed in hADSCs with CBLB overexpression and insulin treatment, whereas there was no change in AKT and p-IRS1 expression. In hADSCs with LV-mut-CBLB infection, the levels of IRS1 and p-AKT were further downregulated compared to those in LV-NC and LV-wt-CBLB groups (Figure 6F–I). These results indicate that mutated CBLB may enhance degradation of the IRS1 protein to inhibit the activity of the IRS1-PI3K-AKT pathway and increase insulin resistance.
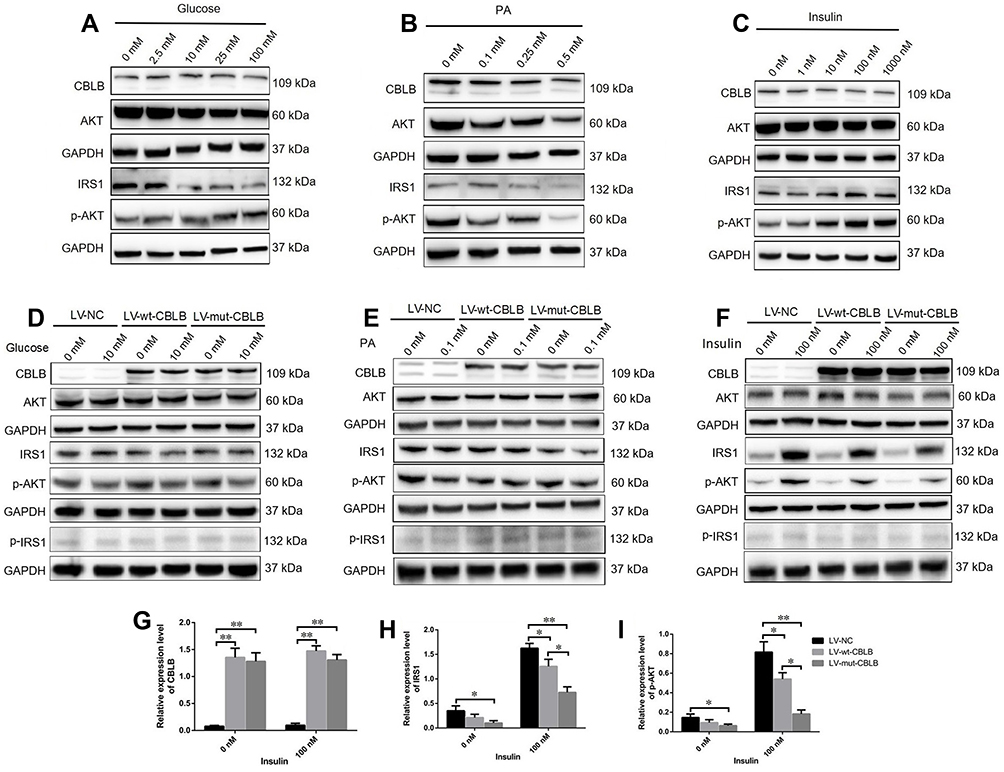 |
Figure 6 Mutated CBLB suppression of the IRS1-PI3K-AKT pathway activity. The hADSCs were treated with different concentrations of (A) glucose, (B) PA, or (C) insulin for 24 hours and then subjected to a Western blot analysis. The hADSCs were grown and infected with LV-NC, LV-wt-CBLB, or LV-mut-CBLB for 72 hours and then were treated with (D) 10nM glucose, (E) 0.1 nM PA, or (F–I) 100 nM insulin for 24 hours and then were subjected to a Western blot. Representative blots are shown and the data is summarized as the mean plus or minus SEM (n=3 experiments). *P< 0.05 and **P< 0.01. |
Discussion
In the current study, we assessed MSL characteristics of a cohort of 13 patients and explored the role of the CBLB c.197A>T mutation in MSL pathogenesis. Our current data on dominant male gender is consistent with most other studies.40,41 These 13 patients were all sporadic cases without any family history of the disease, but these patients consumed alcohol heavily, similar to a previous report.42 It is true that there are no studies connecting the role of alcohol in MSL pathogenesis, and stopping alcohol consumption did not reverse or prevent disease development, although other studies suggested that alcohol could be a key MSL promoter and delay ATLLM formation.4,43,44 Our current data supported the notion that alcohol is considered to be a crucial factor for MSL development. In addition, most of our patients had mild metabolic dysfunction, and Zolotov et al reported high levels of TG in three patients. One of whom had abnormal levels of blood glucose, and none of whom had hyperuricemia.30 Also, Rocha et al showed severe insulin insistence in their patients, although these patients had normal glucose intolerance.16 Nevertheless, some, but not all of our current cohort of patients, had hyperuricemia, abnormal blood glucose, and insulin resistance. Interestingly, these patients had normal lipid levels and good glucose control according to HbA1c levels.
Abnormal adipose tissue accumulation and distribution are important MSL traits, and, according to the newly developed MSL classification system,33 MSL can be divided into five types, of which our patients were 15.4% Type Ia, 30.8% Type Ib, and 53.8% Type Ic, but there were no Type II or III patients. To date, there are no effective means to treat or prevent adipose tissue proliferation. Clinically, if the adipose tissue accumulation does cause a respiratory obstruction or affect daily life, surgery is necessary to resect the extra adipose tissues or use liposuction to remove them; however, our P10 and P13 patients received surgery ten years ago, but the adipose tissues accumulated again in the lesions. Previous studies showed multilocular, smaller adipocytes, richer in fibrous and vascular tissues in MSL than in normal SATs.11,16,19,22 Our cohort of patients also showed abundant fiber in ATLLM, but there was no multiocular lipoma or difference in adipocyte size.
A number of studies have shown that the MSL ATLLM may be derived from brown adipose tissues due to typical brown adipose tissue distribution.22,45 UCP-1, a biomarker for brown adipose tissue, was expressed in MSL ATLLM.11,22,34 However, in our current study, we failed to detect UCP-1 expression. Although our results were similar to those reported by Emilie Capel et al,19 our results showed weak expression of UCP-1 and other thermogenic markers (PR/SET domain 16 [PRDM16], transmembrane protein 26 [TMEM26], iodothyronine deiodinase 2 [DIO2], and PPARG co-activator 1 alpha [PPARGC1A]). Rocha et al16 and Moonen et al46 demonstrated that the ATLLM did not express UCP-1 and uptake of 18F-fluorodeoxyglucose (18F-FDG) in the positron emission tomography-computed tomography images after cold stimulation. Our current data also did not show an increase in UCP-1 expression after isoprenaline-stimulated mature adipocytes from MSL. Moreover, previous studies revealed that MSL ATLLM were a classic white adipose tissue histologically and in terms of the ultrastructure.46,47 Our molecular data on these patients showed expression of biomarkers for white adipose but not beige and brown adipose, further supporting that the ATLLM were from the white adipose tissue.
Mutations in various genes and a mutation in mtDNA were first reported for MSL, including mutations in the mtDNA (m.8344A>G or m.8363G>A) and genomic MFN2, LIPE, and CAPSL.16,19,20,30 However, our current data failed to confirm mutations of these known genes in our cohort of patients or mutations of PTEN, MEN1, LMNA, RB1, NF1, or β3-AR that may participate in abnormal adipose tissue distribution or MSL phenotypes.36,37,48,49 We did find the CBLB c.197A>T heterozygous mutation in 4 of 13 patients. CBLB is a critical factor in the promotion of proteosome-mediated protein degradation and extensively participates in the host immune response, insulin resistance, inflammation, allergies, and cancer development.23,50,51 CBLB is a highly evolutionary conversation protein from the nematodes to the vertebrates,23,52 and the CBLB p.Q66L mutation is localized in the region of the TKB domain that binds to the tyrosine site of protein phosphorylation and ubiquitinates the target proteins. In our current study, we found that this point mutation was highly conserved in 98 vertebrates using the UCSC tool, and our bioinformatical analysis identified a very low mutation frequency that could be harmful if it occurred in the CBLB p.Q66L site. Furthermore, knockout of CBLB induced obesity, insulin resistance, and diabetes in elderly C57BL/6 mice, and CBLB-/- mice mediated macrophage infiltration into the peripheral adipose tissues and increased the levels of pro-inflammation factors, including TNF-α, IL-6, and MCP-126. The CBLB mutation was also reported in type 1 diabetes,53 and our P7 and P13 patients had a significant decrease in fasting insulin levels, although we do not know whether the CBLB c.197A>T mutation induced the impairment of the islet function. It is true that CBLB deficiency activated macrophages via saturated fatty acid-mediated insulin resistance in older mice54 but not in young mice.55 Previous studies conducted by others and in our own previous work13,31 showed that MSL developed in middle-aged males and that ATLLM accumulated for both long-term and slow processes, which features seem similar to the CBLB-/- mice model. However, our current data showed that CBLB did not affect adipogenesis. In addition, the CBLB-/- mice showed normal cholesterol but reduced TG levels,26 whereas our current data showed almost normal blood lipid levels in this cohort of patients. The CBLB-/- mice had reduced weight in the gastrocnemius muscle, while their body weight and epididymal fat were increased, and there was no change in liver weight. In our patients, most did not have a fatty liver. Indeed, the phenotypes of the CBLB-/- mice model were similar to human MSL clinical characteristics, so it is reasonable to believe that the CBLB mutation could be an important risk factor in developing MSL.28,29,56 Our current study initiated the verification of the CBLB c.197A>T mutation in affecting the IRS-1-PI3K-AKT pathway in MSL-isolated hADSCs and confirmed our speculation.
Taken together, our current study characterized the clinical, histopathological, and cell and molecular biology patterns of a cohort of 13 Type I MSL patients and identified the CBLB c.197A>T mutation in 4 of these 13 patients. However, we believe that the monogenic mutation may not induce MSL alone. It may combine with others factors together, for example, heavy drinking or sex hormones. Those factors commonly contribute to the pathophysiological process of MSL. The limitations of this study include the small sample size with a specific patient population. In addition, there are still many unclear issues. For instance, MSL often occurs in middle-aged males. Moreover, the factors to induce adipose tissue redistribution remain to be defined.
Acknowledgments
We thank Medjaden Bioscience Limited (Hong Kong, China) for assistance in the language editing of this manuscript.
Funding
This study was supported in part by grants from the National Natural Science Foundation of China (#81870589), Hunan Province Natural Science Foundation of China (#2017JJ2367), and Project of Scientific Research Plan of Hunan Health Committee (#B2017030 and #B2019135).
Disclosure
The authors report no conflicts of interest in this work.
References
1. Mimica M, Pravdic D, Nakas-Icindic E, et al. Multiple symmetric lipomatosis: a diagnostic dilemma. Case Rep Med. 2013;2013:836903. doi:doi:10.1155/2013/836903
2. Lee LC, Weng TH, Huang KH, et al. Application of lateral tarsoconjunctival flap to correct ocular complications of Madelung’s disease: a case report and literature review. Medicine. 2018;97(42):e12864. doi:doi:10.1097/MD.0000000000012864
3. Chen CY, Fang QQ, Wang X, et al. Madelung’s disease: lipectomy or liposuction? Biomed Res Int. 2018;2018:3975974. doi:doi:10.1155/2018/3975974
4. Witmanowski H, Banasiak Ł, Kierzynka G, et al. The use of high tumescent power assisted liposuction in the treatment of Madelung’s collar. Postepy Dermatol Alergol. 2017;34(4):366–371. doi:10.5114/ada.2017.69319
5. Tremp M, Wettstein R, Tchang LA, Schaefer DJ, Rieger UM, Kalbermatten DF. Power-assisted liposuction (PAL) of multiple symmetric lipomatosis (MSL)–a longitudinal study. Surg Obes Relat Dis. 2015;11:155–160. doi:10.1016/j.soard.2014.05.004
6. Araújo-Vilar D, Victoria B, González-Méndez B, et al. Histological and molecular features of lipomatous and nonlipomatous adipose tissue in familial partial lipodystrophy caused by LMNA mutations. Clin Endocrinol. 2012;76(6):816–824. doi:10.1111/j.1365-2265.2011.04208.x
7. Gámez J, Playán A, Andreu AL, et al. Familial multiple symmetric lipomatosis associated with the A8344G mutation of mitochondrial DNA. Neurology. 1998;51(1):258–260. doi:10.1212/wnl.51.1.258
8. Payne CE. Hereditary Madelung’s disease. J R Soc Med. 2000;93(4):194–195. doi:doi:10.1177/014107680009300411
9. Perera U, Kennedy BA, Hegele RA. MTTK multiple symmetric lipomatosis (Madelung disease) in a large canadian family with the mitochondrial c.8344A>G variant. J Investig Med High Impact Case Rep. 2018;6:2324709618802867. doi:doi:10.1177/2324709618802867
10. El Ouahabi H, Doubi S, Lahlou K, Boujraf S, Ajdi F. Launois-bensaude syndrome: a benign symmetric lipomatosis without alcohol association. Ann Afr Med. 2017;16(1):33–34. doi:10.4103/1596-3519.202082
11. Prantl L, Schreml J, Gehmert S, et al. Transcription profile in sporadic multiple symmetric lipomatosis reveals differential expression at the level of adipose tissue-derived stem cells. Plast Reconstr Surg. 2016;137(4):1181–1190. doi:10.1097/PRS.0000000000002013
12. Szewc M, Sitarz R, Moroz N, Maciejewski R, Wierzbicki R. Madelung’s disease - progressive, excessive, and symmetrical deposition of adipose tissue in the subcutaneous layer: case report and literature review. Diabetes Metab Syndr Obes. 2018;26(11):819–825. doi:10.2147/DMSO.S181154
13. Chen K, Xie Y, Hu P, Zhao S, Mo Z. Multiple symmetric lipomatosis: substantial subcutaneous adipose tissue accumulation did not induce glucose and lipid metabolism dysfunction. Ann Nutr Metab. 2010;57(1):68–73. doi:10.1159/000317641
14. Haap M, Siewecke C, Thamer C, et al. Multiple symmetric lipomatosis: a paradigm of metabolically innocent obesity? Diabetes Care. 2004;27(3):794–795. doi:10.2337/diacare.27.3.794
15. López-Gallardo E, Cammarata-Scalisi F, Emperador S, et al. Mitochondrial DNA pathogenic mutations in multiple symmetric lipomatosis. Clin Genet. 2020;97(5):731–735. doi:10.1111/cge.13701
16. Rocha N, Bulger DA, Frontini A, et al. Human biallelic MFN2 mutations induce mitochondrial dysfunction, upper body adipose hyperplasia, and suppression of leptin expression. eLife. 2017;6:e23813. doi:10.7554/eLife.23813
17. Gilson RC, Osswald S. Madelung lipomatosis presenting as a manifestation of myoclonic epilepsy with ragged red fibers (MERRF) syndrome. JAAD Case Rep. 2018;4(8):822–823. doi:10.1016/j.jdcr.2018.05.004
18. Campos Y, Martín MA, Navarro C, Gordo P, Arenas J. Single large-scale mitochondrial DNA deletion in a patient with mitochondrial myopathy associated with multiple symmetric lipomatosis. Neurology. 1996;47(4):1012–1014. doi:10.1212/wnl.47.4.1012
19. Capel E, Vatier C, Cervera P, et al. MFN2-associated lipomatosis: clinical spectrum and impact on adipose tissue. J Clin Lipidol. 2018;12(6):1420–1435. doi:10.1016/j.jacl.2018.07.009
20. Lindner A, Marbach F, Tschernitz S, et al. Calcyphosine-like (CAPSL) is regulated in multiple symmetric lipomatosis and is involved in adipogenesis. Sci Rep. 2019;9(1):8444. doi:10.1038/s41598-019-44382-1
21. Nisoli E, Regianini L, Briscini L, et al. Multiple symmetric lipomatosis may be the consequence of defective noradrenergic modulation of proliferation and differentiation of brown fat cells. J Pathol. 2002;198(3):378–387. doi:10.1002/path.1212
22. Enzi G, Busetto L, Sergi G, et al. Multiple symmetric lipomatosis: a rare disease and its possible links to brown adipose tissue. Nutr Metab Cardiovasc Dis. 2015;25(4):347–353. doi:10.1016/j.numecd.2015.01.010
23. Liu Q, Zhou H, Langdon WY, Zhang J. E3 ubiquitin ligase Cbl-b in innate and adaptive immunity. Cell Cycle. 2014;13(12):1875–1884. doi:10.4161/cc.29213
24. Singh TP, Vieyra-Garcia PA, Wagner K, Penninger J, Wolf P. Cbl-b deficiency provides protection against UVB-induced skin damage by modulating inflammatory gene signature. Cell Death Dis. 2018;9(8):835. doi:10.1038/s41419-018-0858-5
25. Abe T, Hirasaka K, Nikawa T. Involvement of Cbl-b-mediated macrophage inactivation in insulin resistance. World J Diabetes. 2017;8(3):97–103. doi:10.4239/wjd.v8.i3.97
26. Abe T, Hirasaka K, Kagawa S, et al. Cbl-b is a critical regulator of macrophage activation associated with obesity-induced insulin resistance in mice. Diabetes. 2013;62(6):1957–1969. doi:10.2337/db12-0677
27. Choi YH, Han Y, Lee SH, et al. Cbl-b and c-Cbl negatively regulate osteoblast differentiation by enhancing ubiquitination and degradation of Osterix. Bone. 2015;75:201–209. doi:10.1016/j.bone.2015.02.026
28. Fang D, Liu YC. Proteolysis-independent regulation of PI3K by Cbl-b-mediated ubiquitination in T cells. Nat Immunol. 2001;2(9):870–875. doi:10.1038/ni0901-870
29. Qu X, Li Y, Liu J, et al. Cbl-b promotes chemotherapy-induced apoptosis in rat basophilic leukemia cells by suppressing PI3K/Akt activation and enhancing MEK/ERK activation. Mol Cell Biochem. 2010;340(1–2):107–114. doi:10.1007/s11010-010-0407-8
30. Zolotov S, Xing C, Mahamid R, Shalata A, Sheikh-Ahmad M, Garg A.Homozygous LIPE mutation in siblings with multiple symmetric lipomatosis, partial lipodystrophy, and myopathy. Am J Med Genet A. 2017;173(1):190–194. doi:10.1002/ajmg.a.37880
31. Chen K, He H, Xie Y, et al. miR-125a-3p and miR-483-5p promote adipogenesis via suppressing the RhoA/ROCK1/ERK1/2 pathway in multiple symmetric lipomatosis. Sci Rep. 2015;5:11909. doi:doi:10.1038/srep11909
32. Luo W, Tian P, Wang Y, et al. Characteristics of genomic alterations of lung adenocarcinoma in young never-smokers. Int J Cancer. 2018;143(7):1696–1705. doi:10.1002/ijc.31542
33. Schiltz D, Anker A, Ortner C, et al. Multiple symmetric lipomatosis: new classification system based on the largest german patient cohort. Plast Reconstr Surg Glob Open. 2018;6(4):e1722. doi:10.1097/GOX.0000000000001722
34. Plummer C, Spring PJ, Marotta R, et al. Multiple symmetrical lipomatosis–a mitochondrial disorder of brown fat. Mitochondrion. 2013;13(4):269–276. doi:10.1016/j.mito.2013.03.003
35. Sanchez-Gurmaches J, Hung CM, Sparks CA, Tang Y, Li H, Guertin DA. PTEN loss in the Myf5 lineage redistributes body fat and reveals subsets of white adipocytes that arise from Myf5 precursors. Cell Metab. 2012;16(3):348–362. doi:10.1016/j.cmet.2012.08.003
36. Genuardi M, Klutz M, Devriendt K, Caruso D, Stirpe M, Lohmann DR. Multiple lipomas linked to an RB1 gene mutation in a large pedigree with low penetrance retinoblastoma. Eur J Hum Genet. 2001;9(9):690–694. doi:10.1038/sj.ejhg.5200694
37. Béréziat V, Cervera P, Le Dour C, et al. LMNA mutations induce a non-inflammatory fibrosis and a brown fat-like dystrophy of enlarged cervical adipose tissue. Am J Pathol. 2011;179(5):2443–2453. doi:10.1016/j.ajpath.2011.07.049
38. Béréziat V, Cervera P, Le Dour C, et al. Genetic syndromes with localized subcutaneous fat tissue accumulation. Acta Biomed. 2019;90(10):90–92. doi:doi:10.23750/abm.v90i10-S.8767
39. Nakao R, Hirasaka K, Goto J, et al. Ubiquitin ligase Cbl-b is a negative regulator for insulin-like growth factor 1 signaling during muscle atrophy caused by unloading. Mol Cell Biol. 2009;29(17):4798–4811. doi:10.1128/MCB.01347-08
40. Hadjiev B, Stefanova P, Shipkov C, Uchikov A, Mojallal A. Madelung disease: on the morphologic criteria for diagnosis and treatment. Ann Plast Surg. 2010;64(6):807–808. doi:10.1097/SAP.0b013e3181d9aa55
41. Mevio E, Sbrocca M, Mullace M, Viglione S, Mevio N. Multiple symmetric lipomatosis: a review of 3 cases. Case Rep Otolaryngol. 2012;2012:910526. doi:doi:10.1155/2012/910526
42. Wan SC, Huang MH, Perng CK, Liao WC. Madelung disease: analysis of clinicopathological experience in Taipei veterans general hospital. Ann Plast Surg. 2019;82(1S Suppl 1):S66–S71. doi:10.1097/SAP.0000000000001719
43. Ujpál M, Németh ZS, Reichwein A, Szabó GY. Long-term results following surgical treatment of benign symmetric lipomatosis (BSL). Int J Oral Maxillofac Surg. 2001;30(6):479–483. doi:10.1054/ijom.2001.0162
44. Enzi G, Busetto L, Ceschin E, Coin A, Digito M, Pigozzo S. Multiple symmetric lipomatosis: clinical aspects and outcome in a long-term longitudinal study. Int J Obes Relat Metab Disord. 2002;26(2):253–261. doi:10.1038/sj.ijo.0801867
45. Zingaretti MC, Crosta F, Vitali A, et al. The presence of UCP1 demonstrates that metabolically active adipose tissue in the neck of adult humans truly represents brown adipose tissue. FASEB J. 2009;23(9):3113–3120. doi:10.1096/fj.09-133546
46. Moonen MP, Nascimento E, van Kroonenburgh MJ, Brandjes D, Lichtenbelt WD. Absence of F-fluorodeoxyglucose uptake using positron emission tomography/computed tomography in Madelung’s disease: a case report. Clin Obes. 2019;9(3):e12302. doi:doi:10.1111/cob.12302
47. Cinti S, Enzi G, Cigolini M, Bosello O. Ultrastructural features of cultured mature adipocyte precursors from adipose tissue in multiple symmetric lipomatosis. Ultrastruct Pathol. 1983;5(2–3):145–152. doi:10.3109/01913128309141834
48. Muñoz-Málaga A, Bautista J, Salazar JA, et al. Lipomatosis, proximal myopathy, and the mitochondrial 8344 mutation. A lipid storage myopathy? Muscle Nerve. 2000;23(4):538–542. doi:10.1002/(sici)1097-4598(200004)23:4<538::aid-mus12>3.0.co;2-t
49. Li X, Qi L. Gene-environment interactions on body fat distribution. Int J Mol Sci. 2019;20:3690. doi:doi:10.3390/ijms20153690
50. Sitaram P, Uyemura B, Malarkannan S, Riese MJ. Beyond the cell surface: targeting intracellular negative regulators to enhance T cell anti-tumor activity. Int J Mol Sci. 2019;20(23):5821. doi:doi:10.3390/ijms20235821
51. Fabbri L, Bost F, Mazure NM. Primary cilium in cancer hallmarks. Int J Mol Sci. 2019;20(6):1336. doi:doi:10.3390/ijms20061336
52. Liu J, DeYoung SM, Hwang JB, O’Leary EE, Saltiel AR. The roles of Cbl-b and c-Cbl in insulin-stimulated glucose transport. J Biol Chem. 2003;278(38):36754–36762. doi:10.1074/jbc.M300664200
53. Bergholdt R, Taxvig C, Eising S, Nerup J, Pociot F. CBLB variants in type 1 diabetes and their genetic interaction with CTLA4. J Leukoc Biol. 2005;77(4):579–585. doi:10.1189/jlb.0904524
54. Abe T, Hirasaka K, Kohno S, et al. Ubiquitin ligase Cbl-b and obesity-induced insulin resistance. Endocr J. 2014;61(6):529–538. doi:10.1507/endocrj.ej14-0048
55. Hirasaka K, Kohno S, Goto J, et al. Deficiency of Cbl-b gene enhances infiltration and activation of macrophages in adipose tissue and causes peripheral insulin resistance in mice. Diabetes. 2007;56(10):2511–2522. doi:10.2337/db06-1768
56. Suzue N, Nikawa T, Onishi Y, et al. Ubiquitin ligase Cbl-b downregulates bone formation through suppression of IGF-I signaling in osteoblasts during denervation. J Bone Miner Res. 2006;21(5):722–734. doi:10.1359/jbmr.060207
 © 2020 The Author(s). This work is published and licensed by Dove Medical Press Limited. The full terms of this license are available at https://www.dovepress.com/terms.php and incorporate the Creative Commons Attribution - Non Commercial (unported, v3.0) License.
By accessing the work you hereby accept the Terms. Non-commercial uses of the work are permitted without any further permission from Dove Medical Press Limited, provided the work is properly attributed. For permission for commercial use of this work, please see paragraphs 4.2 and 5 of our Terms.
© 2020 The Author(s). This work is published and licensed by Dove Medical Press Limited. The full terms of this license are available at https://www.dovepress.com/terms.php and incorporate the Creative Commons Attribution - Non Commercial (unported, v3.0) License.
By accessing the work you hereby accept the Terms. Non-commercial uses of the work are permitted without any further permission from Dove Medical Press Limited, provided the work is properly attributed. For permission for commercial use of this work, please see paragraphs 4.2 and 5 of our Terms.