")
Back to Journals » Cancer Management and Research » Volume 10
CAV3.1 knockdown suppresses cell proliferation, migration and invasion of prostate cancer cells by inhibiting AKT
Authors Hu SB , Li L, Huang W , Liu J, Lan G, Yu S, Peng L, Xie X, Yang L, Nian Y, Wang Y
Received 3 May 2018
Accepted for publication 13 June 2018
Published 15 October 2018 Volume 2018:10 Pages 4603—4614
DOI https://doi.org/10.2147/CMAR.S172948
Checked for plagiarism Yes
Review by Single anonymous peer review
Peer reviewer comments 3
Editor who approved publication: Dr Antonella D'Anneo
Shanbiao Hu,1 Ling Li,2 Wei Huang,3 Jie Liu,4 Gongbin Lan,1 Shaojie Yu,1 Longkai Peng,1 Xubiao Xie,1 Luoyan Yang,2 Yeqi Nian,2 Yinhuai Wang2
1Department of Urological Organ Transplantation, The Second Xiangya Hospital of Central South University, Changsha, China; 2Department of Urology, The Second Xiangya Hospital of Central South University, Changsha, China; 3Research Center of Carcinogenesis and Targeted Therapy, Xiangya Hospital, Central South University, Changsha, China; 4Department of Pathology, Changsha Central Hospital, Changsha, China
Background: Aberrant expression of CAV3.1, one of T-type Ca2+ channels, is reported to exert important functions in pathological processes, including carcinogenesis. However, its expression pattern and function in prostate cancer (PCa) remains unclear.
Materials and methods: The expression pattern of CAV3.1 was analyzed in multiple ways, including online analysis in Oncomine database, experimental analyses in cell lines, and collected clinical specimens using immunohistochemistry, quantitative reverse transcription polymerase chain reaction, and Western blot. Then, CAV3.1 was downregulated in PCa cells to explore its functions.
Results: Upregulated CAV3.1 in PCa tissues and cells was confirmed by analyzing mRNA expression datasets from Oncomine and quantitative reverse transcription polymerase chain reaction detection, respectively. Accordingly, significantly higher CAV3.1 protein level in PCa tissues specimens than that in benign prostatic hyperplasia tissues was indicated by immunohistochemical staining. In addition, CAV3.1 upregulation was positively associated with metastasis. Depletion of CAV3.1 impaired the proliferation, migration, and invasion ability of PCa cells demonstrating by cell functional experiments, such as CCK-8, cell cycle distribution, plate clone formation, scratch wound healing, and transwell invasion assays. Mechanistically, due to constrained Akt activity, CAV3.1 knockdown resulted in decreased level of CCND1, N-cadherin, and Vimentin, and increased level of E-cadherin whose expressions could be reversed by ectopic Akt expression. Similarly, ectopic Akt expression also rescued the inhibitory effects of CAV3.1 knockdown on cell functions like proliferation and migration in PCa cells.
Conclusion: Upregulated CAV3.1 is positively associated with the development of PCa. CAV3.1 knockdown can inhibit PCa cell proliferation, migration, and invasion by suppressing AKT activity.
Keywords: CAV3.1, PCa, AKT signaling, proliferation, invasion
Introduction
As a male-specific malignancy, the incidence and mortality of prostate cancer (PCa) have been increasing year by year and have become the leading cause of cancer-associated death for men all over the word.1 Existing treatments, such as surgery resection, androgen ablation therapy, as well as radiotherapy and chemotherapy have demonstrated relatively satisfactory outcome in management of PCa at early stage. However, owing to the early symptoms of PCa being not obvious, and it is difficult to discriminate with benign prostate diseases, most patients are diagnosed in advanced stage. At this point, PCa often featured by castration resistance chemoradiotherapy resistance, or distant metastasis, which means that the effect of traditional treatments is greatly reduced and contribute little to improve the overall survival of PCa patients.1–4 Thus, discovery and identification of key molecules in PCa carcinogenesis, which would present new diagnostic markers and therapeutic targets for PCa, is essential for improvement of PCa treatment.
As the most important second messenger of cell signaling transduction, Ca2+ is involved in regulation of numerous crucial cellular events, including cell growth and death-related processes, gene transcription, exocytosis, hormone release, and cell motility.5–7 Thus, the aberrance of Ca2+ signaling is associated with most pathological states included cancer. As one of critical transporters for Ca2+ influx, T-type Ca2+ channels, comprising 3 subtypes, including CAV3.1, CAV 3.2, and CAV 3.3, have demonstrated important functions in carcinogenesis. Generally, T-type Ca2+ channels exhibit aggressive roles like promoting cell survival, proliferation, invasion, and chemoradiotherapy resistance, etc. in cancer development.7–9 Upregulated expression of CAV3.1 and CAV 3.2 has been revealed in multiple cancers, including glioblastoma,10 breast adenocarcinoma,11 melanoma,12,13 lung cancer,14 and colon cancer.15 Moreover, when T-type Ca2+ channels were suppressed by small interfering RNA-mediated CAV3.1/CAV3.2 knockdown or by specific inhibitors, such as mibefradil, NNC 55-0396, and TTL1177, significant inhibitory effects on malignance, such as constrained cell proliferation and migration, improved chemo/radio sensibility were observed in cancers.8,11,12 As for PCa, increased expression of CAV3.2 has been reported to be associated with neuroendocrine differentiation (NED) to a more aggressively malignant phenotype in PCa cells.16,17 However, the expressions and functions of CAV3.1 in PCa and its underlying mechanisms are rarely revealed.
In this study, we examine the expression of CAV3.1 in PCa tissues and cells. Moreover, downregulation of CAV3.1 expression by complementary shRNA, leads to a decreased cell growth, clone formation, and migration by targeting Akt signaling in PCa cells. Our results raise the possibility that CAV3.1 may be useful as novel and effective therapeutics for PCa.
Materials and methods
Patients and tissue specimens
The 72 paraffin-embedded archival PCa tissue specimens (40 PCas with metastasis and 32 without metastasis) between January 2013 and December 2014 were obtained from the Second Xiangya Hospital of Central South University (Changsha, China) at the time of diagnosis before any therapy. In addition, 20 benign prostatic hyperplasia (BPH) tissues were also collected. Moreover, clinicopathological features of patients, including age at diagnosis, prostate-specific antigen level, Gleason score, and metastasis status were also collected. Written informed consent was obtained from all patients for use of the tissue samples and clinical records. The study protocol was performed under the approval by the Ethic Committee of the Second Xiangya Hospital of Central South University.
Immunohistochemistry
Immunohistochemical staining was performed using UltraSensitiveTM streptavidin-peroxidase IHC Kit (MaiXin, Fuzhou, China) as described previously.18 Briefly, after dewaxing, antigen retrieval, and H2O2 treatment, the paraffin-embedded tissue slides were successively incubated with the CAV3.1 antibody (cata. sc-16260; Santa Cruz Biotechnology, Santa Cruz, CA, USA) overnight at 4°C; incubated with biocatalytic secondary antibody followed by avidin-biotin peroxidase complex. Finally, tissue sections were incubated with 3′, 3′-diaminobenzidine until a brown color developed and was countersigned with Harris’ modified hematoxylin. The immunoreactions were evaluated independently by 2 pathologists. Evaluation of staining was assessed using the Intensity Reactivity Score, according to published paper.19
Cell culture
PCa cell lines, PC-3 and DU145, and the immortalized human prostate epithelial cell line, RWPE1, were purchased from the Shanghai Cell Bank (Shanghai, China). PC-3 and DU145 were cultured in Roswell Park Memorial Institute (RPMI)-1640 medium supplemented with 10% fetal bovine serum (FBS; BI, Jerusalem, Israel) and RWPE1 cells were cultured in Keratinocyte-SFM (Invitrogen, Carlsbad, CA, USA) supplemented with 0.05 mg/mL bovine pituitary extract and 5 ng/mL epidermal growth factor at 37°C in a humidified 5% CO2 incubator.
Quantitative reverse transcription polymerase chain reaction (qPCR)
Total cell RNAs were extracted using TRIzol reagent (Invitrogen) according to manufacturer’s instruction. Subsequently, 1 µg RNA was used to synthesize cDNA using HiScript first Strand cDNA Synthesis Kit (Vazyme, Nanjing, China). Then, the relative mRNA expression of CAV3.1 was detected by Applied Biosystems Vii7 real-time PCR Systems (ABI, Vernon, CA, USA) using glyceraldehyde-3-phosphate dehydrogenase (GAPDH) as internal control. The primer sequences were listed as follows: CAV3.1, forward: 5′-ACACTTGGAACCGGCTTGAC-3′, reverse: 5′-AGCACACGGACTGTCCTGA-3′; GAPDH, forward: 5′-CAGCAAGAGCACAAGAGGAA-3′, reverse: 5′-ATGGTACATGACAAGGTGCGG-3′.19
Western blotting
The procedure for Western blot is mentioned in our previous work.20 Briefly, cells were disrupted with radioimmunoprecipitation assay buffer (Beyotime, Shanghai, China), then, total proteins were isolated by high-speed centrifugation. After protein concentration detection and denaturation, the protein samples were separated by 12% sodium dodecyl sulfate polyacrylamide gel electrophoresis (40 µg/lane), electrophoretically transferred to polyvinylidene difluoride membranes. Subsequently, the membranes were subjected to blocking with 5% bovine serum albumin, incubation with the corresponding primary antibodies at 4˚C overnight: CAV3.1(Santa Cruz Biotechnology), E-cadherin, N-cadherin, Vimentin (Vim), CCNB1, CCND1, CCNE1, and GAPDH (Abclonal, Woburn, MA, USA), p-Akt (S473), p-Akt (T308), and Akt (CST, Boston, MA, USA), and incubation with the secondary antibody for 1 hour at room temperature. Finally, the immunoreactive bands were developed with a chemiluminescent HRP substrate (Millipore, Billerica, MA, USA) and pictured by a FluorChem FC3 system (Proteinsimple, San Jose, CA, USA).
Establishment of cell lines with lentiviral particles infection
Stable PCa cell lines with altered CAV3.1 expression were constructed by lentiviral particles infection. PC-3 and DU145 cells were infected with CAV3.1 shRNA particles (GENECHEM, Shanghai, China). One day later, 2 µg/mL puromycin were added into the culture medium for 2 weeks and the knockdown efficacy was further identified by Western blot. The control cell lines were obtained from cells infected with control lentiviral particles in the same procedure.
Plasmid transfection pcDNA3.1-Akt and pcDNA3.1 vector plasmids were introduced into cells by Neofect™ DNA transfection reagent (Neofect, Beijing, China). Briefly, the culture mediums were replaced with fresh medium 2 hours before transfection. Up to transfection, 2 µg plasmid and 3 µL transfection reagent were mixed and incubated in 100 µL RPMI-1640 medium for 15 minutes. Then, the medium containing transfection complex comprising DNA and cationic polymer was added into culture medium. Six hours later, the culture mediums were replaced again, and the functional analysis was applied 24 hours later.
siRNA transfection
siRNA targeting CAV3.1 and control siRNA were synthesized by RiboBio Inc (Guangzhou, China). The sense sequence was 5′-GUGCGACGCAAGUACAACUUU-3′,21 whose target region is different to shCAV3.1 lentivirus. SiCAV3.1 and sicontrol RNA were introduced into PC-3 and DU145 cells by LipofectamineTM 2000 according to manufacturer’s instructions.
Cytosolic-free calcium measurement
Fluo-4 AM (Beyotime) was used to measure the intracellular calcium according to manufacturer’s guideline. Simply, cells were seeded in 6-well plates. Twenty-four hours later, cells were washed with PBS 3 times and incubated with Fluo-4 AM working solution for 1 hour. Then, cells were washed with PBS three times and harvested with trypsinization. After another washing with PBS, cells were collected to analyze the intracellular calcium with flow cytometry using the FACScalibur (BD, Franklin Lakes, NJ, USA)
CCK-8 assay
Cell proliferation was detected by using a CCK-8 kit according to manufacturer’s instruction. Briefly, cells were plated at 1×10³ cells/well in 96-well plates, and then grew for 6 days. For every day, 10 µL per well CCK-8 reagent (Beyotime) was added and incubated for 1 hour. The absorbance at 450 nm of each well was read by Epoch (Bio-Tek, Winooski, VT, USA). The CCK-8 assay was performed 3 times in triplicate.
Plate clone formation assay
Plate clone formation assay was done as described in the published paper.22 First, cells were trypsinized and seeded in 6-well plates at the density of 1,000 cells/well. Eight days later, the cultured cells were fixed with methanol and stained with 0.4% crystal violet. Colonies containing 50 cells at least were counted under inverse microscope (Nikon, Tokyo, Japan) and the clone amounts were analyzed subsequently.
EdU incorporation assay
Cell proliferation was measured using Cell-Light™ EdU Apollo®567 In Vitro Imaging Kit (RiboBio, Guangzhou, China) according to manufacturer’s instruction. Briefly, the cells were cultured in 96-well plates at the density of 2×10⁴ cells/well). First, the cells were treated with 50 µM EdU for 2 hours at 37°C, and then were fixed with 4% formaldehyde for 15 minutes, followed by addition of 200 µL 2 mg/mL glycine (Amresco, Solon, OH, USA). Five minutes later, the cells were incubated with 0.5% Triton X-100 for 10 minutes at room temperature. Following washing with PBS for 5 minutes, 1× Apollo reaction reagent was added and incubated at room temperature in the dark for 30 minutes, and then the cells were stained with 200 µL Hoechst 33,342 for an additional 30 minutes in the dark. Cells labeled and unlabeled by EdU were counted under an inverse microscope system (Nikon), and pictures were taken. The assay was performed 3 times in triplicate.
Cell cycle analysis
Cell cycle was analyzed by flow cytometer using Cell Cycle Analysis Kit (Beyotime) according to manufacturer’s instruction. Briefly, cells were harvested, washed twice in PBS, and fixed by 70% ethanol overnight, then stained by RNase and propidium iodide for 30 minutes at room temperature. Samples were analyzed with flow cytometry using the FACScalibur (BD) and ModFit TL 4.1 (Verity, Topsham, ME, USA).
Scratch wound-healing assay
Cell migration was analyzed by scratch wound-healing assay according to a previous study.23 Briefly, cells were seeded into 6-well plate at the proper density ensuring the 95%–100% monolayer cell confluence in the next day. Then cells were wounded by dragging a 200 µL pipette tip. Cellular debris were removed by PBS wash and fresh RPMI-1640 medium without FBS was added. Simultaneously, the primary wound images were acquired by inverse microscope (Nikon). Twenty-four hours later, the healed wound images were taken again to analyze the migration ability alteration.
Transwell invasion assay
Transwell assay was done as described in our previous paper.23 Briefly, 8 mm pore size transwell chambers precoated with Matrigel (Corning, Brooklyn, NY, USA) were applied to analyze cell invasion according to the manufacturer’s instruction. Simply, 2.5×10⁴ cells with 0.5 mL RPMI 1640 medium containing 0.1% FBS were added into upper chamber. The lower chamber was filled with 0.75 mL RPMI 1640 medium containing 10% FBS as a chemoattractant. After incubation at 37°C for 48 hours, dropping the medium, fixing the cell with methanol, and staining the cells with 0.5% crystal violet. Removing the cells above the member with a swab, acquired the images of migratory cells and calculating the average of migratory cell amount from 5 randomly selected microscopic fields.
Statistical analysis
All experiments were carried out at least 3 times. Data were presented as the mean ± SD. Statistical analysis was conducted using SPSS18.0 software and GraphPad prism 6. For comparisons between 2 groups, a Student’s t-test or chi-squared test was used. P<0.05 was considered to be statistically significant.
Results
CAV3.1 is upregulated in PCa tissue specimens and cell lines
At beginning, we compared the expression level of CAV3.1 between PCa and normal tissue samples using 2 independent microarray datasets in Oncomine Database (www.oncomine.com). Analysis of the datasets containing 6 normal specimens and 7 PCa specimens showed that the CAV3.1 mRNA level was significantly higher in PCa tissues than that in normal tissues, which was confirmed by analysis of other dataset containing 50 normal and 52 PCa specimens (Figure 1A). Moreover, we detected CAV3.1 levels in 92 paraffin-embedding specimens, including 20 BPH and 72 PCa specimens, respectively, collected from the pathology department of our hospital by immunohistochemistry. The results demonstrated that CAV3.1 was moderately or strongly expressed in PCa tissues, but negatively or weakly expressed in BPH tissues. Moreover, CAV3.1 showed stronger staining in metastatic PCa tissues than that in local PCa tissues (Figure 1B, Tables 1 and 2). The subcellular location of staining was observed both in the cytoplasm and cytomembrane. Then, we also measured CAV3.1 levels in prostate and PCa cells by qPCR and Western blot. The results revealed that PC-3 and DU145, PCa cells, exhibited evidently higher CAV3.1 level than that in RWPE1 cells, prostate cells both at mRNA and protein levels (Figure 1C). Moreover, we also detected the expression of CAV3.2, another T-type Ca2+ channel subunit, which has important roles in NED of PCa, in PC-3 and DU145 cells. Comparable expression of CAV3.2 to that of CAV3.1 was detected by qPCR confirming the expression of CAV3.2 in PCa (Figure 1D). Therefore, we proved that CAV3.1 is upregulated in PCa.
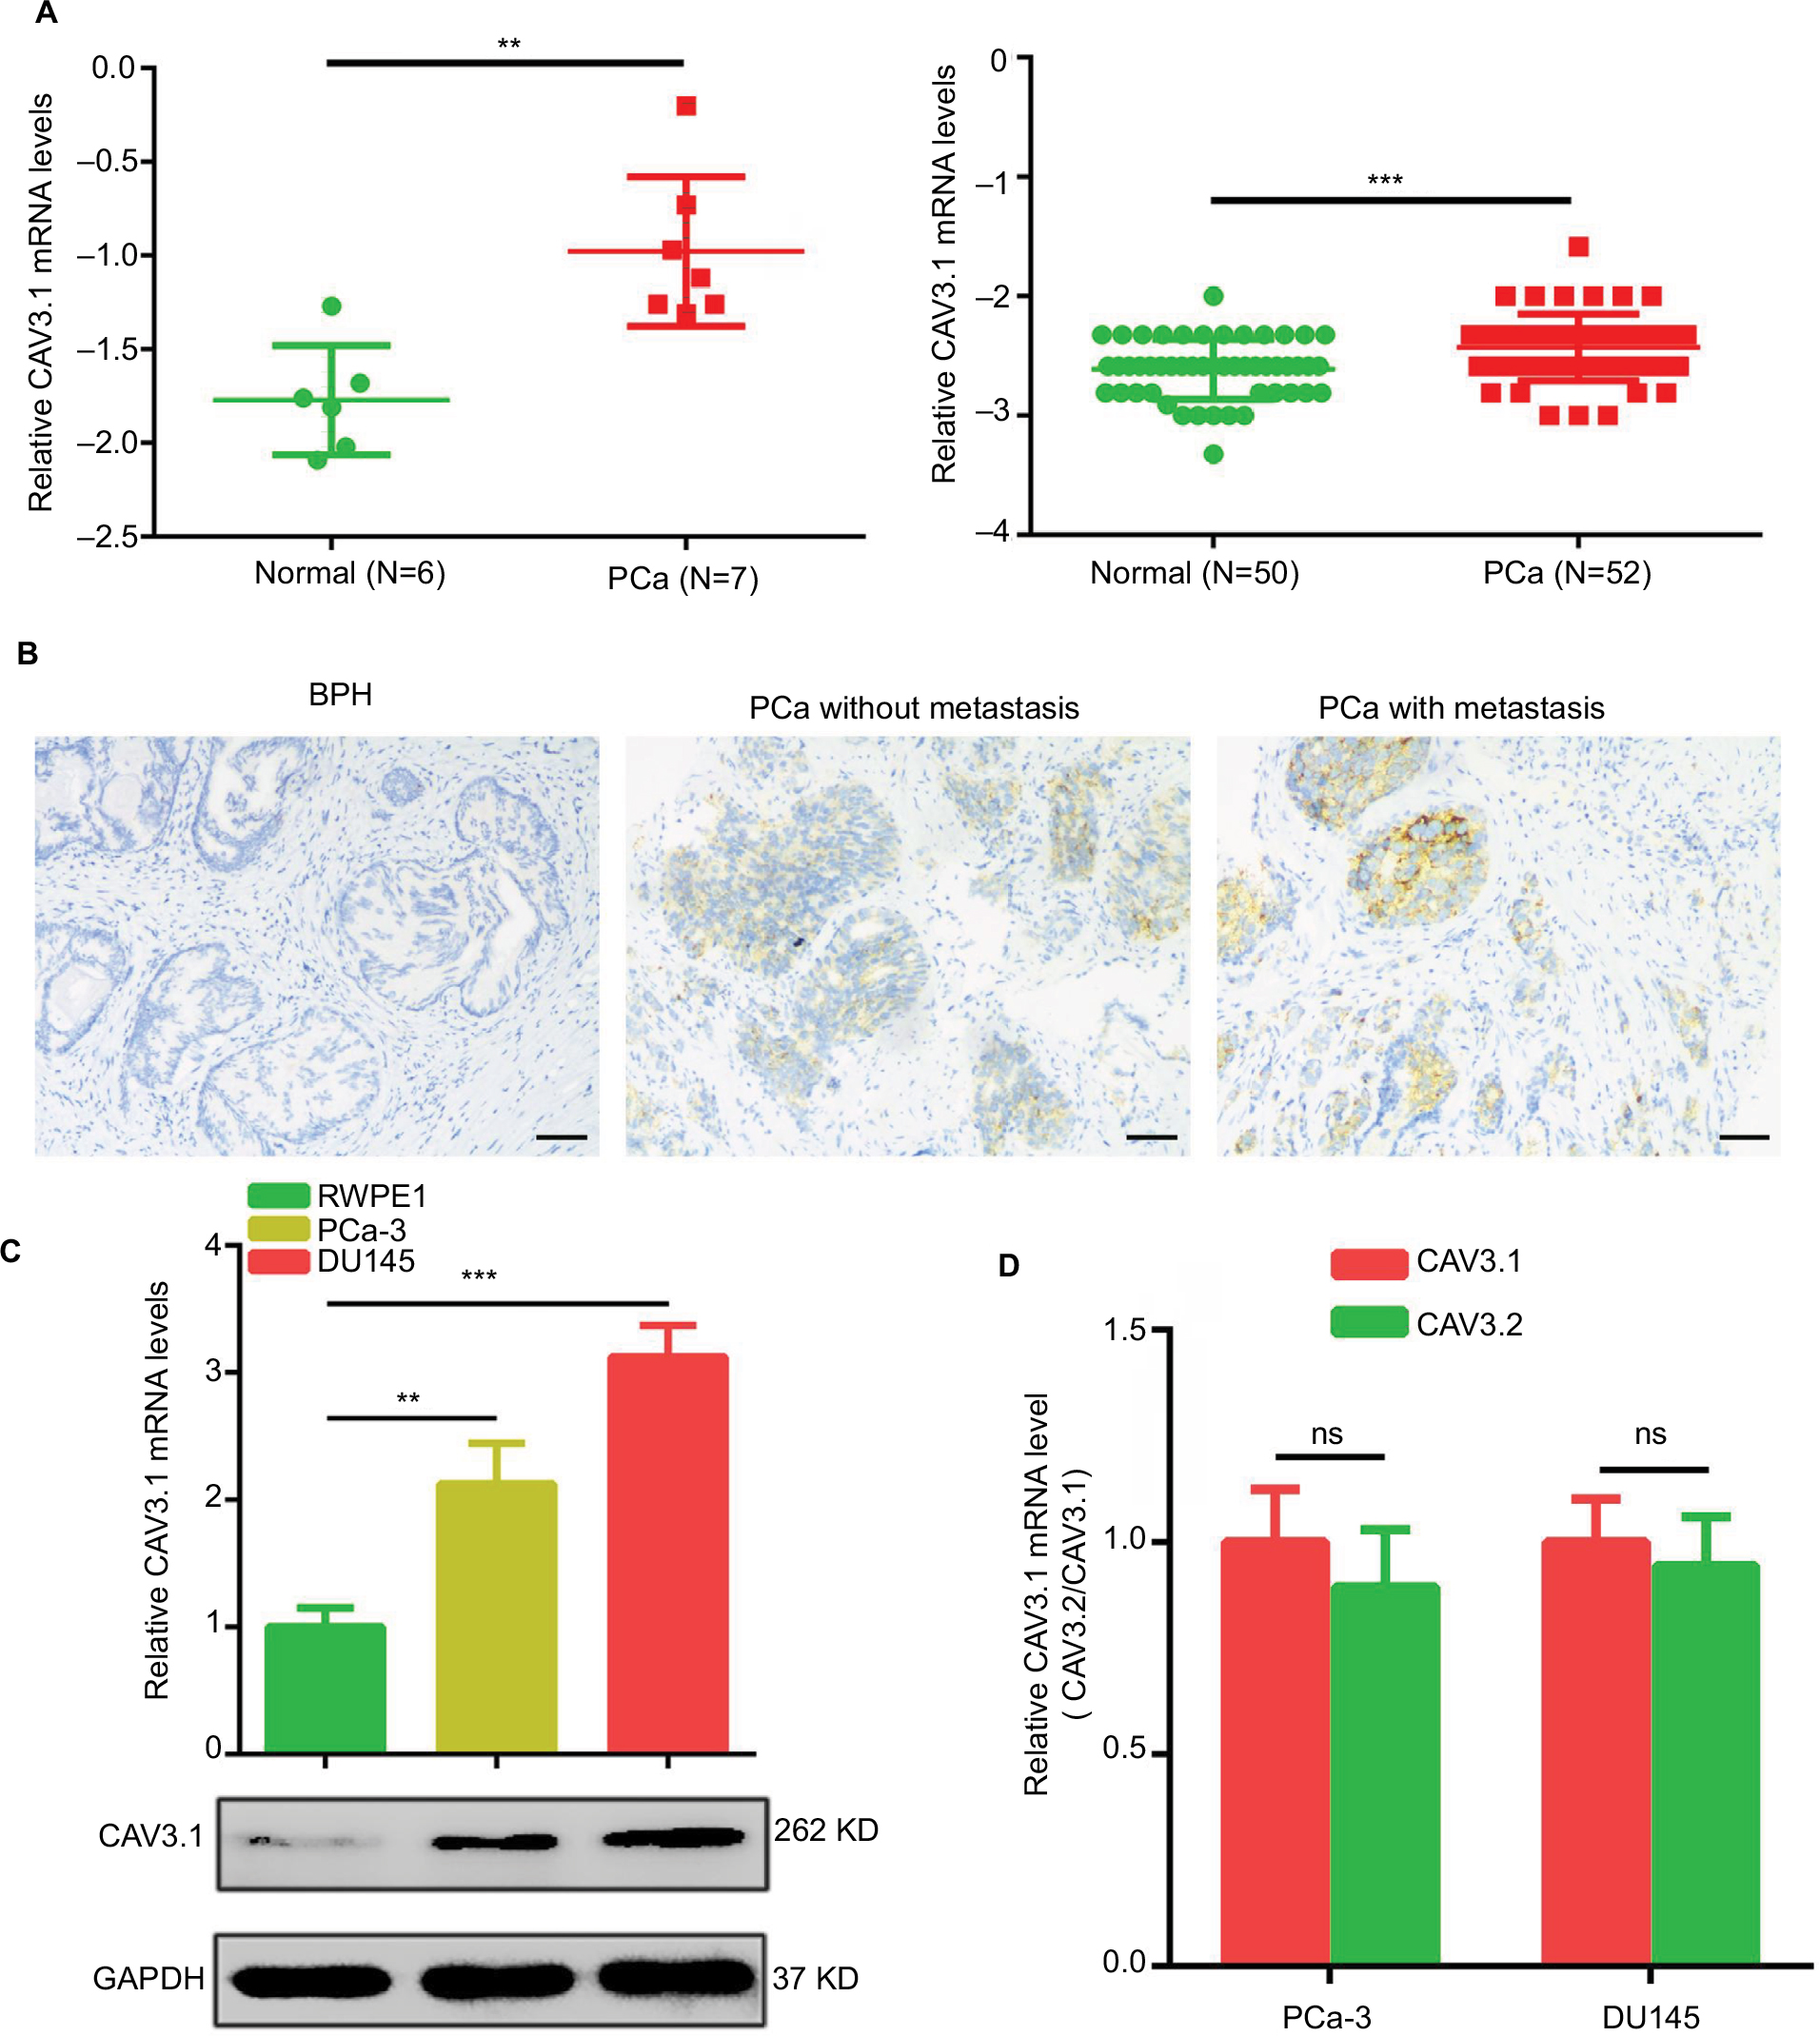 | Figure 1 CAV3.1 is upregulated in PCa tissues and cells. Notes: (A) Increased CAV3.1 expressions in PCa tissues were demonstrated by data from Oncomine database. (B) IHC results showed that CAV3.1 level was higher in PCa tissues than that in BPH tissues. (C) Increased CAV3.1 expressions were also observed in PCa cells indicated by qPCR and Western blot results. (D) CAV3.1 and CAV3.2 showed a comparable expression levels in PC-3 and DU145 cells indicated by qPCR analysis. **P<0.01, ***P<0.001. Magnification ×100. Abbreviations: BPH, benign prostatic hyperplasia; GAPDH, glyceraldehyde-3-phosphate dehydrogenase; IHC, immunohistochemistry; PCa, prostate cancer; ns, no significance; qPCR, quantitative reverse transcription polymerase chain reaction. |
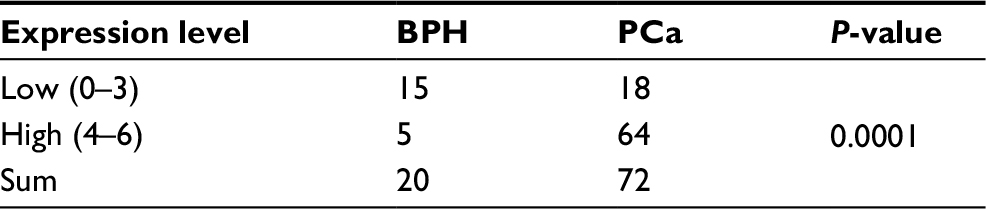 | Table 1 The expression level of CAV3.1 in the BPH and PCa tissues Abbreviations: BPH, benign prostatic hyperplasia; PCa, prostate cancer. |
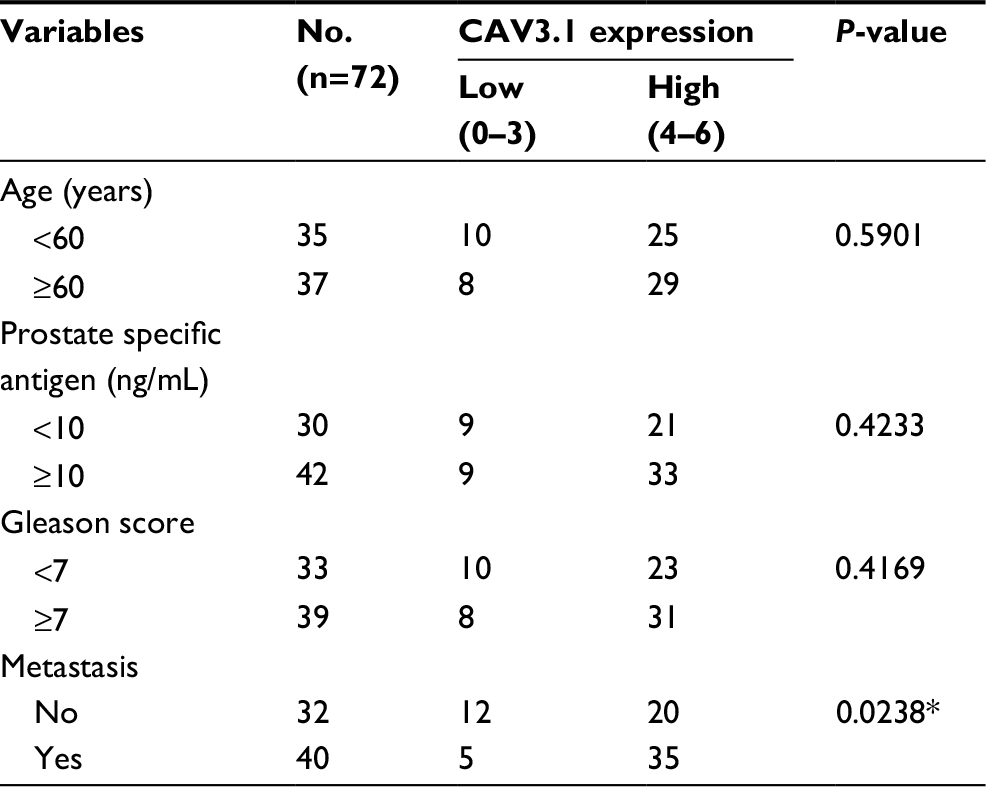 | Table 2 Correlation of CAV3.1 expression with clinicopathologic features in 72 cases of prostate cancer Notes: *P<0.05. |
CAV3.1 knockdown suppressed PCa cell proliferation by inhibiting the G1/S transition
To explore CAV3.1’s functions in PCa, CAV3.1 knockdown was successfully achieved in PC-3 and DU145 cells by shCAV3.1 specific lentivirus infection or siCAV3.1 transfection demonstrated by Western blot results (Figures 2A and S1A). First, we examined the effect of CAV3.1 knockdown on intracellular Ca2+ level by flow cytometer using Fluo-4 AM. The results showed no significant changes in intracellular calcium levels suggesting that the functions of CAV3.1 may be independent to Ca2+ regulation in PCa (Figure 2B). Subsequently, the influence of CAV3.1 on PCa cell survival and proliferation was analyzed by CCK-8, clone formation, EdU incorporation, and cell cycle assays. The CCK-8 and clone formation assay results indicated that the growth rate and colony formation ability of PC-3 and DU145 were significantly inhibited (Figures 2C, D and Figures S1B, C). The EdU incorporation assay indicated that the DNA synthesis was constrained in PC-3 and DU145 cells with CAV3.1 knockdown (Figure 2E) suggested that CAV3.1 may involve in cell cycle regulation. Next, the cell cycle distribution was detected by flow cytometer. Indeed, inhibited the G1/S transition, demonstrated by significantly increased G1 proportion and significantly decreased S proportion (Figure 2F), was observed in PC-3 and DU145 cells with CAV3.1 knockdown, which was confirmed by decreased CCND1, 1 key cyclin protein in promoting G1/S transition of cell cycle, in the same circumstance (Figures 4A and S1E). Therefore, those results suggested that CAV3.1 knockdown suppressed PCa cell proliferation by inhibiting the G1/S transition.
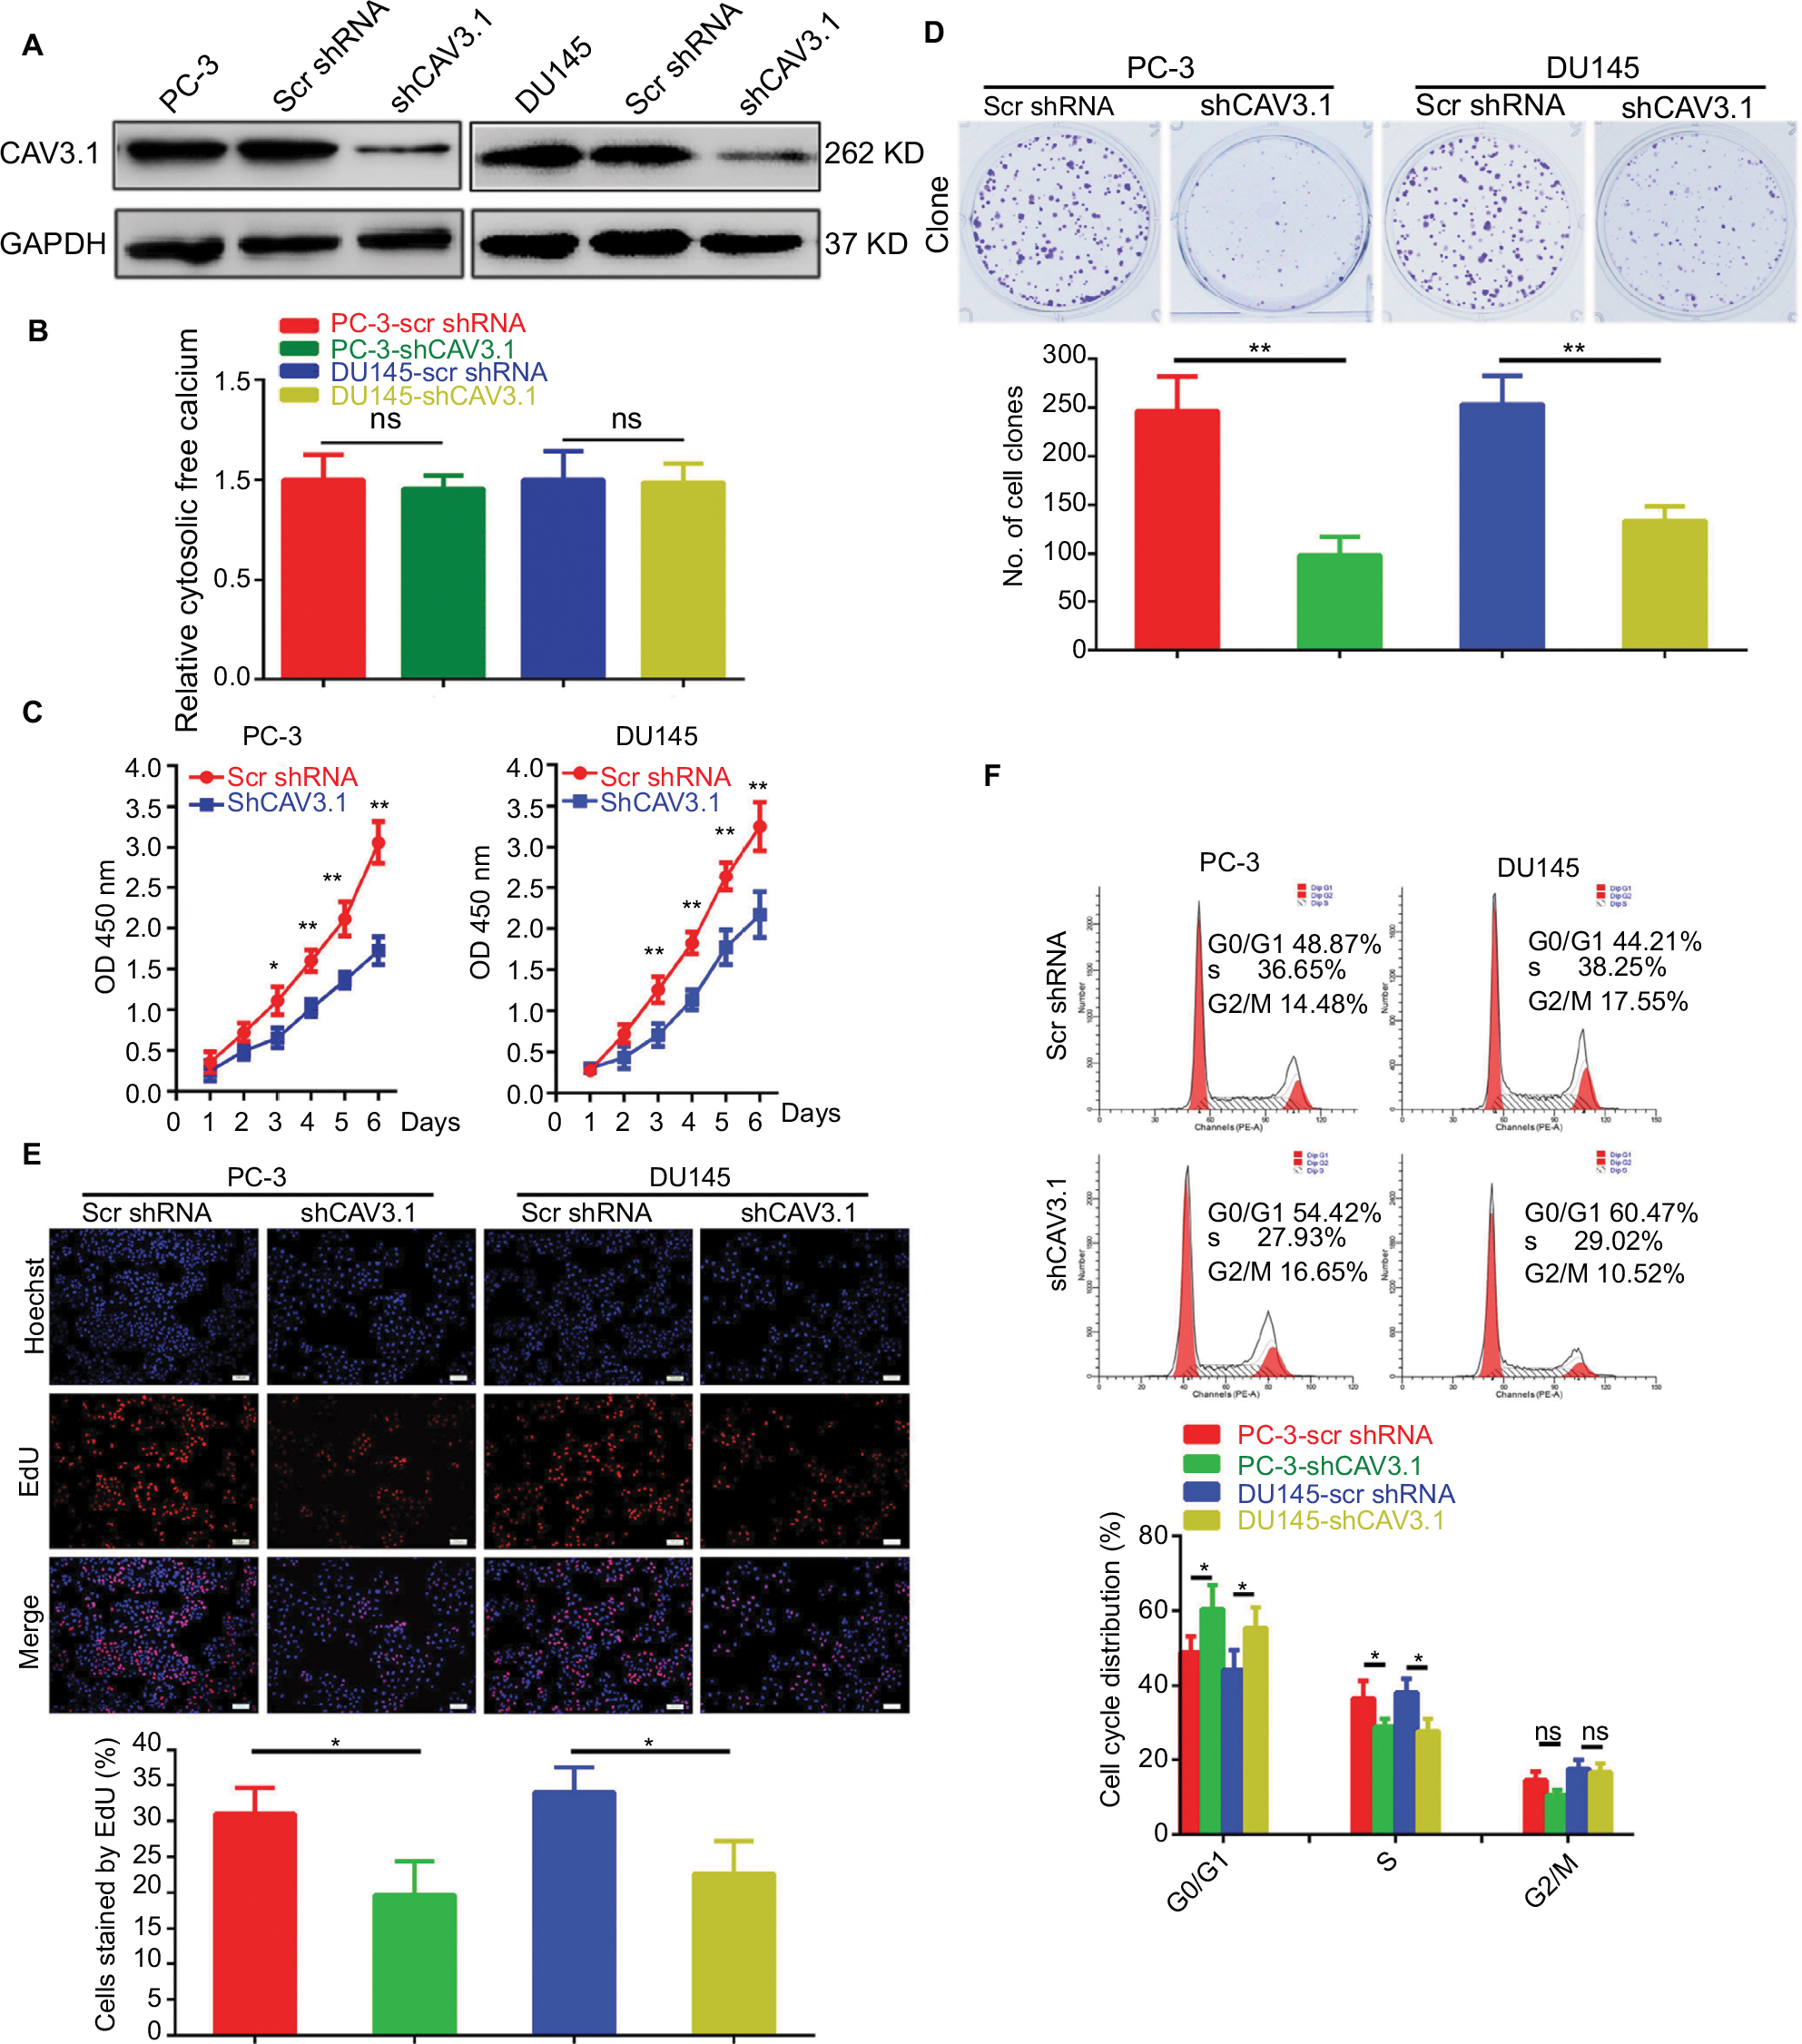 | Figure 2 CAV3.1 knockdown suppressed proliferation of PCa cells. Notes: (A) Stable PC-3 and DU145 cell lines with CAV3.1 knockdown were successfully constructed indicated by Western blot. (B) CAV3.1 knockdown exerted no significant effects on cellular Ca2+ level indicated by flow cytometer analysis. Significant inhibitory effects of CAV3.1 knockdown on PC-3 and DU145 cell proliferation were revealed by decreased OD 450 nm value (C), clone number (D), EdU incorporated rates (E) and percentage of cell at S stage (F), respectively. *P<0.05, **P<0.01. Magnification ×100. Abbreviations: Edu, 5-Ethynyl-2’-deoxyuridine; BPH, benign prostatic hyperplasia; ns, no significance; PCa, prostate cancer. |
CAV3.1 knockdown impaired migration and invasion of PCa cells
Further, we explored the effect of CAV3.1 knockdown on CAV3.1 migration and invasion ability of PCa cells. Wound-healing assay showed that the mobility and migration ability was significantly inhibited in PC-3 and DU145 cells with CAV3.1 knockdown (Figure 3A). Transwell assay also revealed that the invasion of PC-3 and DU145 cells was also impaired upon CAV3.1 knockdown (Figures 3B and S1D). Considering the key functions of epithelial–mesenchymal transition (EMT) in metastasis, we also detected the expression of EMT markers in the same system. Western blot results revealed that E-cadherin and epithelial marker were upregulated and N-cadherin and Vim, mesenchymal markers, were downregulated in PC-3 and DU145 cells with CAV3.1 knockdown (Figures 4A and S1E), indicating that EMT was inhibited upon CAV3.1 knockdown in PCa cells. Collectively, our results showed that CAV3.1 knockdown impaired migration and invasion of PCa cells maybe by inhibiting EMT.
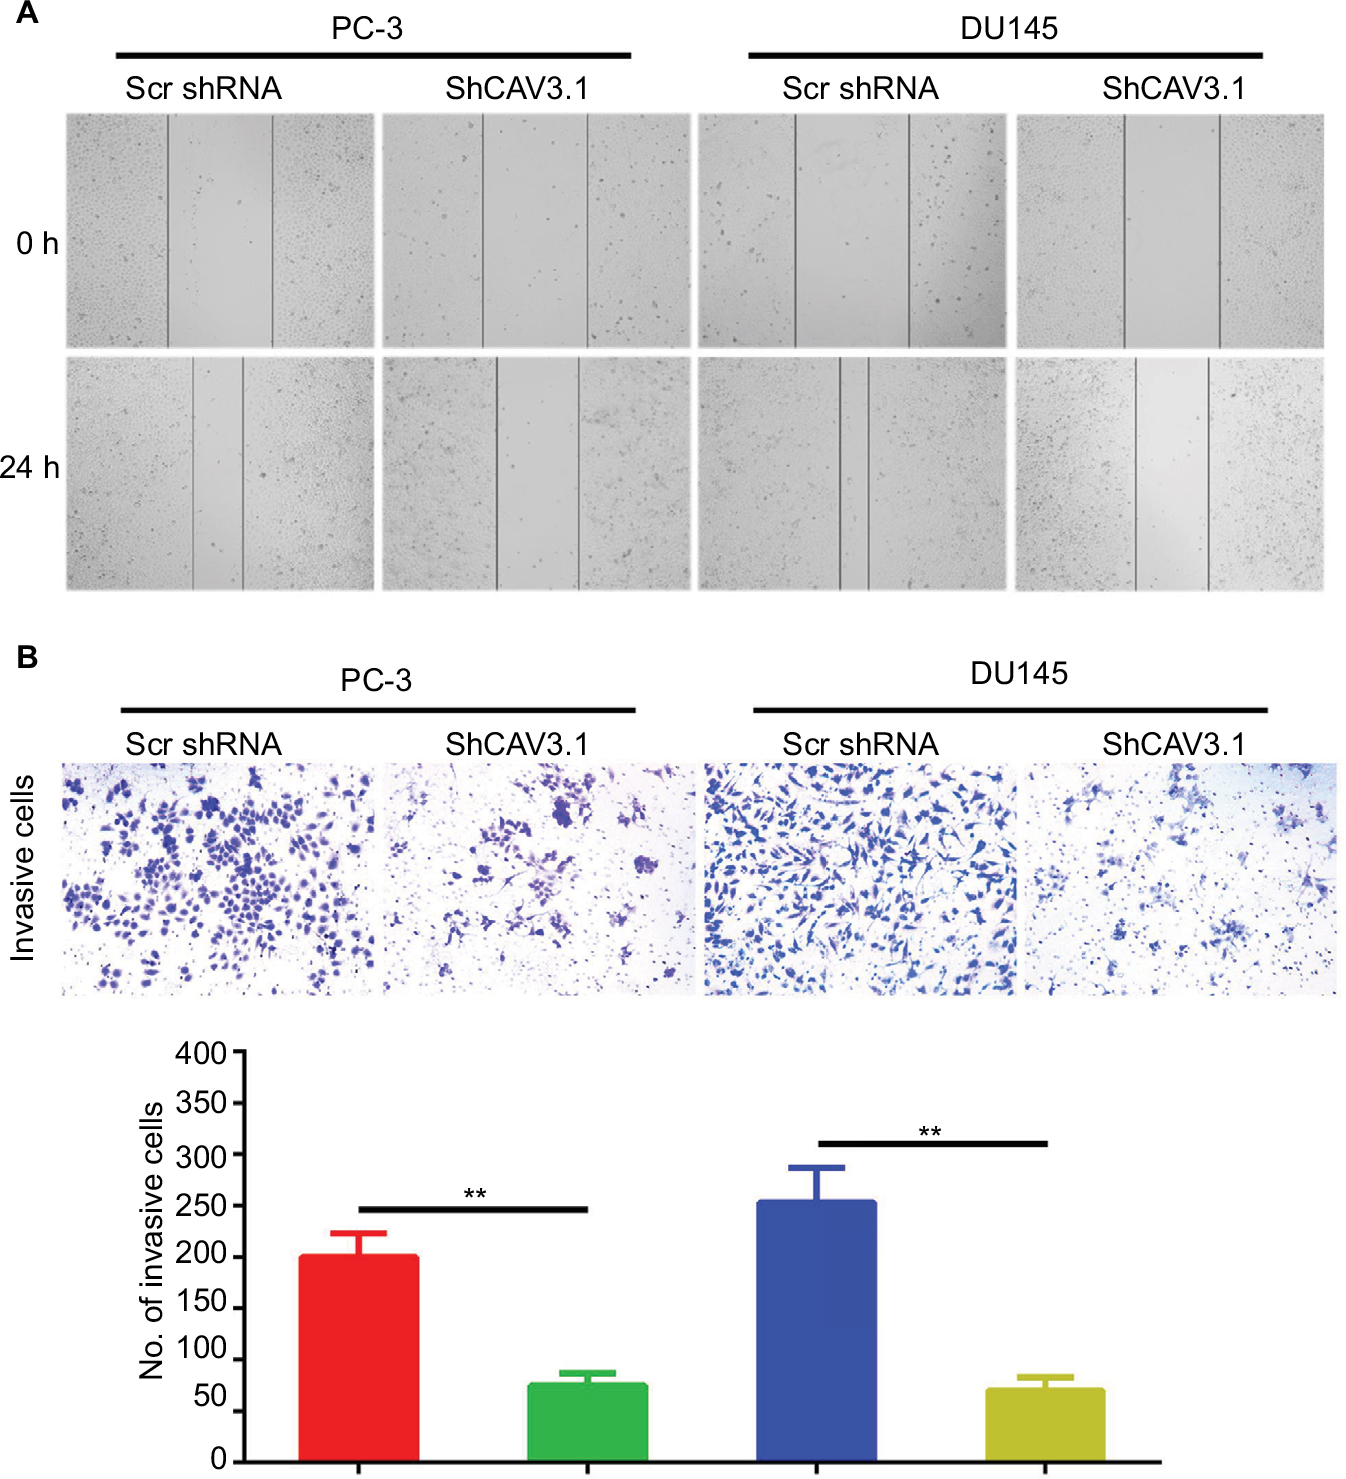 | Figure 3 CAV3.1 knockdown suppressed migration and invasion of PCa cells. Notes: (A) CAV3.1 knockdown led to shorter migration distance for PC-3 and DU145 cells. (B) CAV3.1 knockdown led to fewer invasive cells for PC-3 and DU145 cells. **P<0.01. Magnification ×100. Abbreviation: PCa, prostate cancer. |
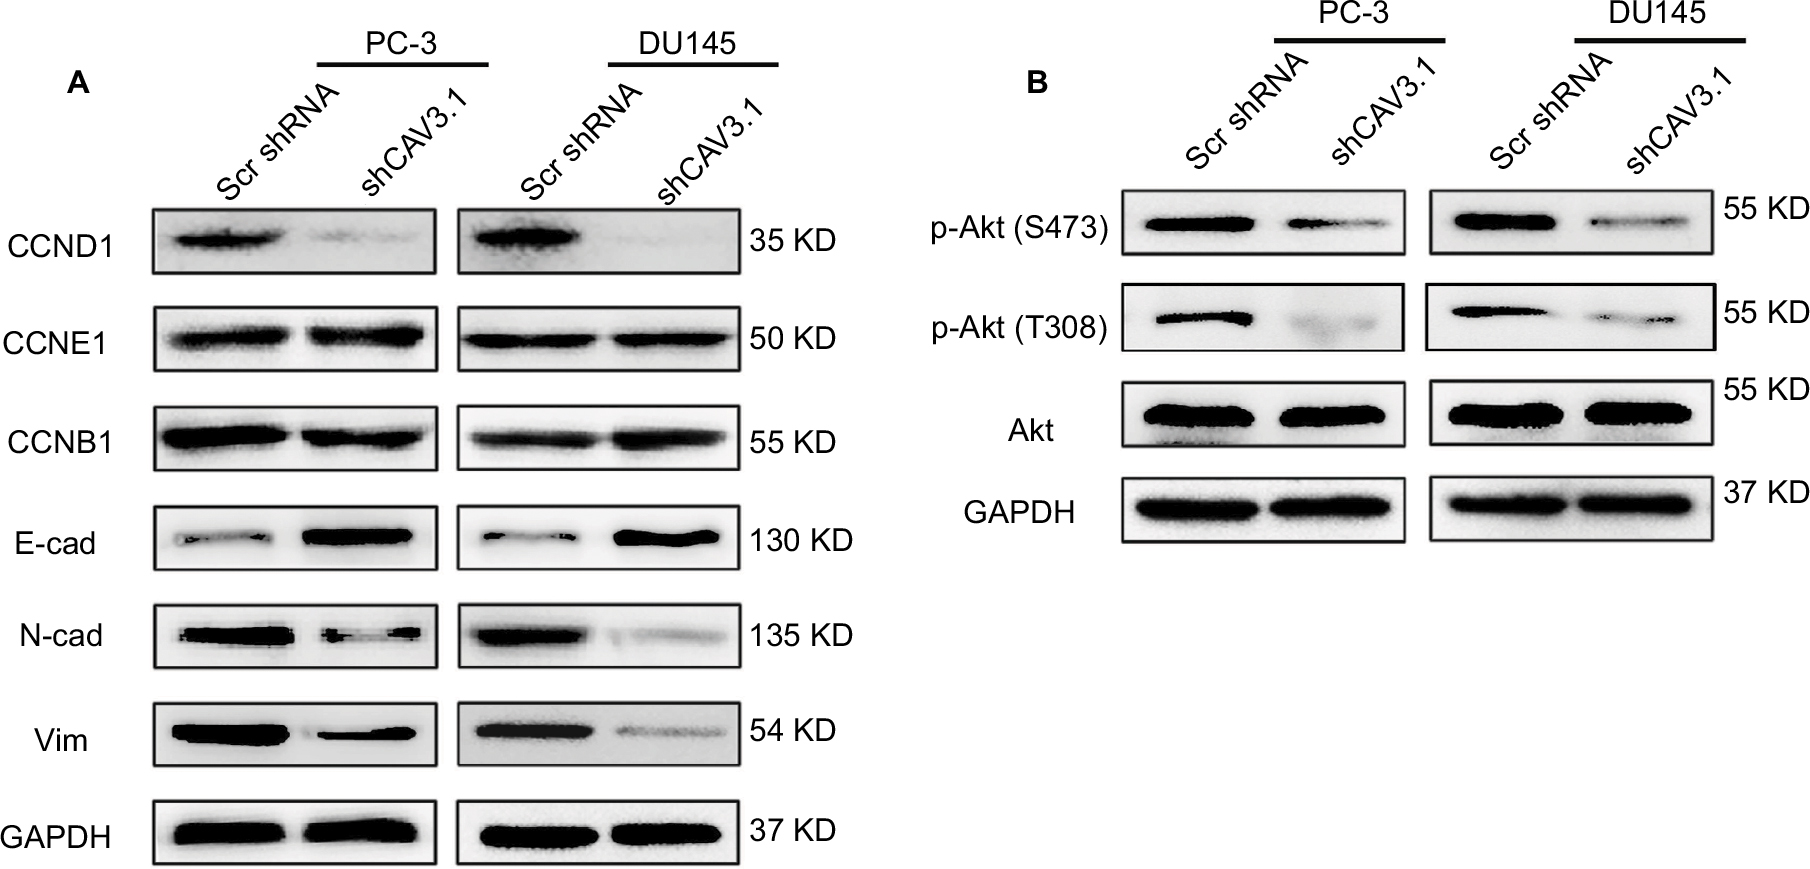 | Figure 4 The influences of CAV3.1 knockdown on expressions of proteins involving cell cycle, EMT, and Akt activity in PCa cells. Notes: (A) CAV3.1 knockdown led to decreased CCND1, but not for CCNE1 and CCNB1 in PC-3 and DU145 cells. Moreover, CAV3.1 knockdown led to decreased N-cad and Vim, 2 mesenchymal markers, and increased E-cad, an epithelial marker. (B) CAV3.1 knockdown led to decreased p-Akt (S473) and p-Akt (T308) in PC-3 and DU145 cells. Abbreviations: E-cad, E-cadherin; EMT, epithelial–mesenchymal transition; GAPDH, glyceraldehyde-3-phosphate dehydrogenase; N-cad, N-cadherin; PCa, prostate cancer. |
CAV3.1 knockdown inhibited PCa proliferation and invasion by suppressing AKT signaling
Finally, we focused our minds on the molecular mechanism of CAV3.1-associated functions. As reported in previous studies, the activity of Akt was suppressed by T-type Ca2+ channels inhibitors (such as mibefradil) treatment or CAV3.1 knockdown in glioblastoma cells.24 Therefore, we also detected the activity of Akt in PCa cells upon CAV3.1 knockdown. As the Western blot showed that the p-Akt (S473) and p-Akt (T308) levels were obviously decreased in PC-3 and DU145 with CAV3.1 knockdown indicating that Akt may mediate the functions of CAV3.1 in PCa (Figure 4B). Thus, we further analyzed the influences of ectopic Akt expression on the functions of CAV3.1 in PCa cells. As the Western blot showed, Akt almost rescued the effects of CAV3.1 knockdown on CCND1, E-cadherin, N-cadherin, and Vim (Figure 5A). Then, the inhibitory effects on PCa proliferation and invasion caused by CAV3.1 knockdown were also reversed by forced Akt expression indicated by colony formation, EdU incorporation and transwell assays (Figure 5B–D). Hence, those results suggested that CAV3.1 knockdown can suppress cell proliferation and invasion by inhibiting AKT signaling in PCa.
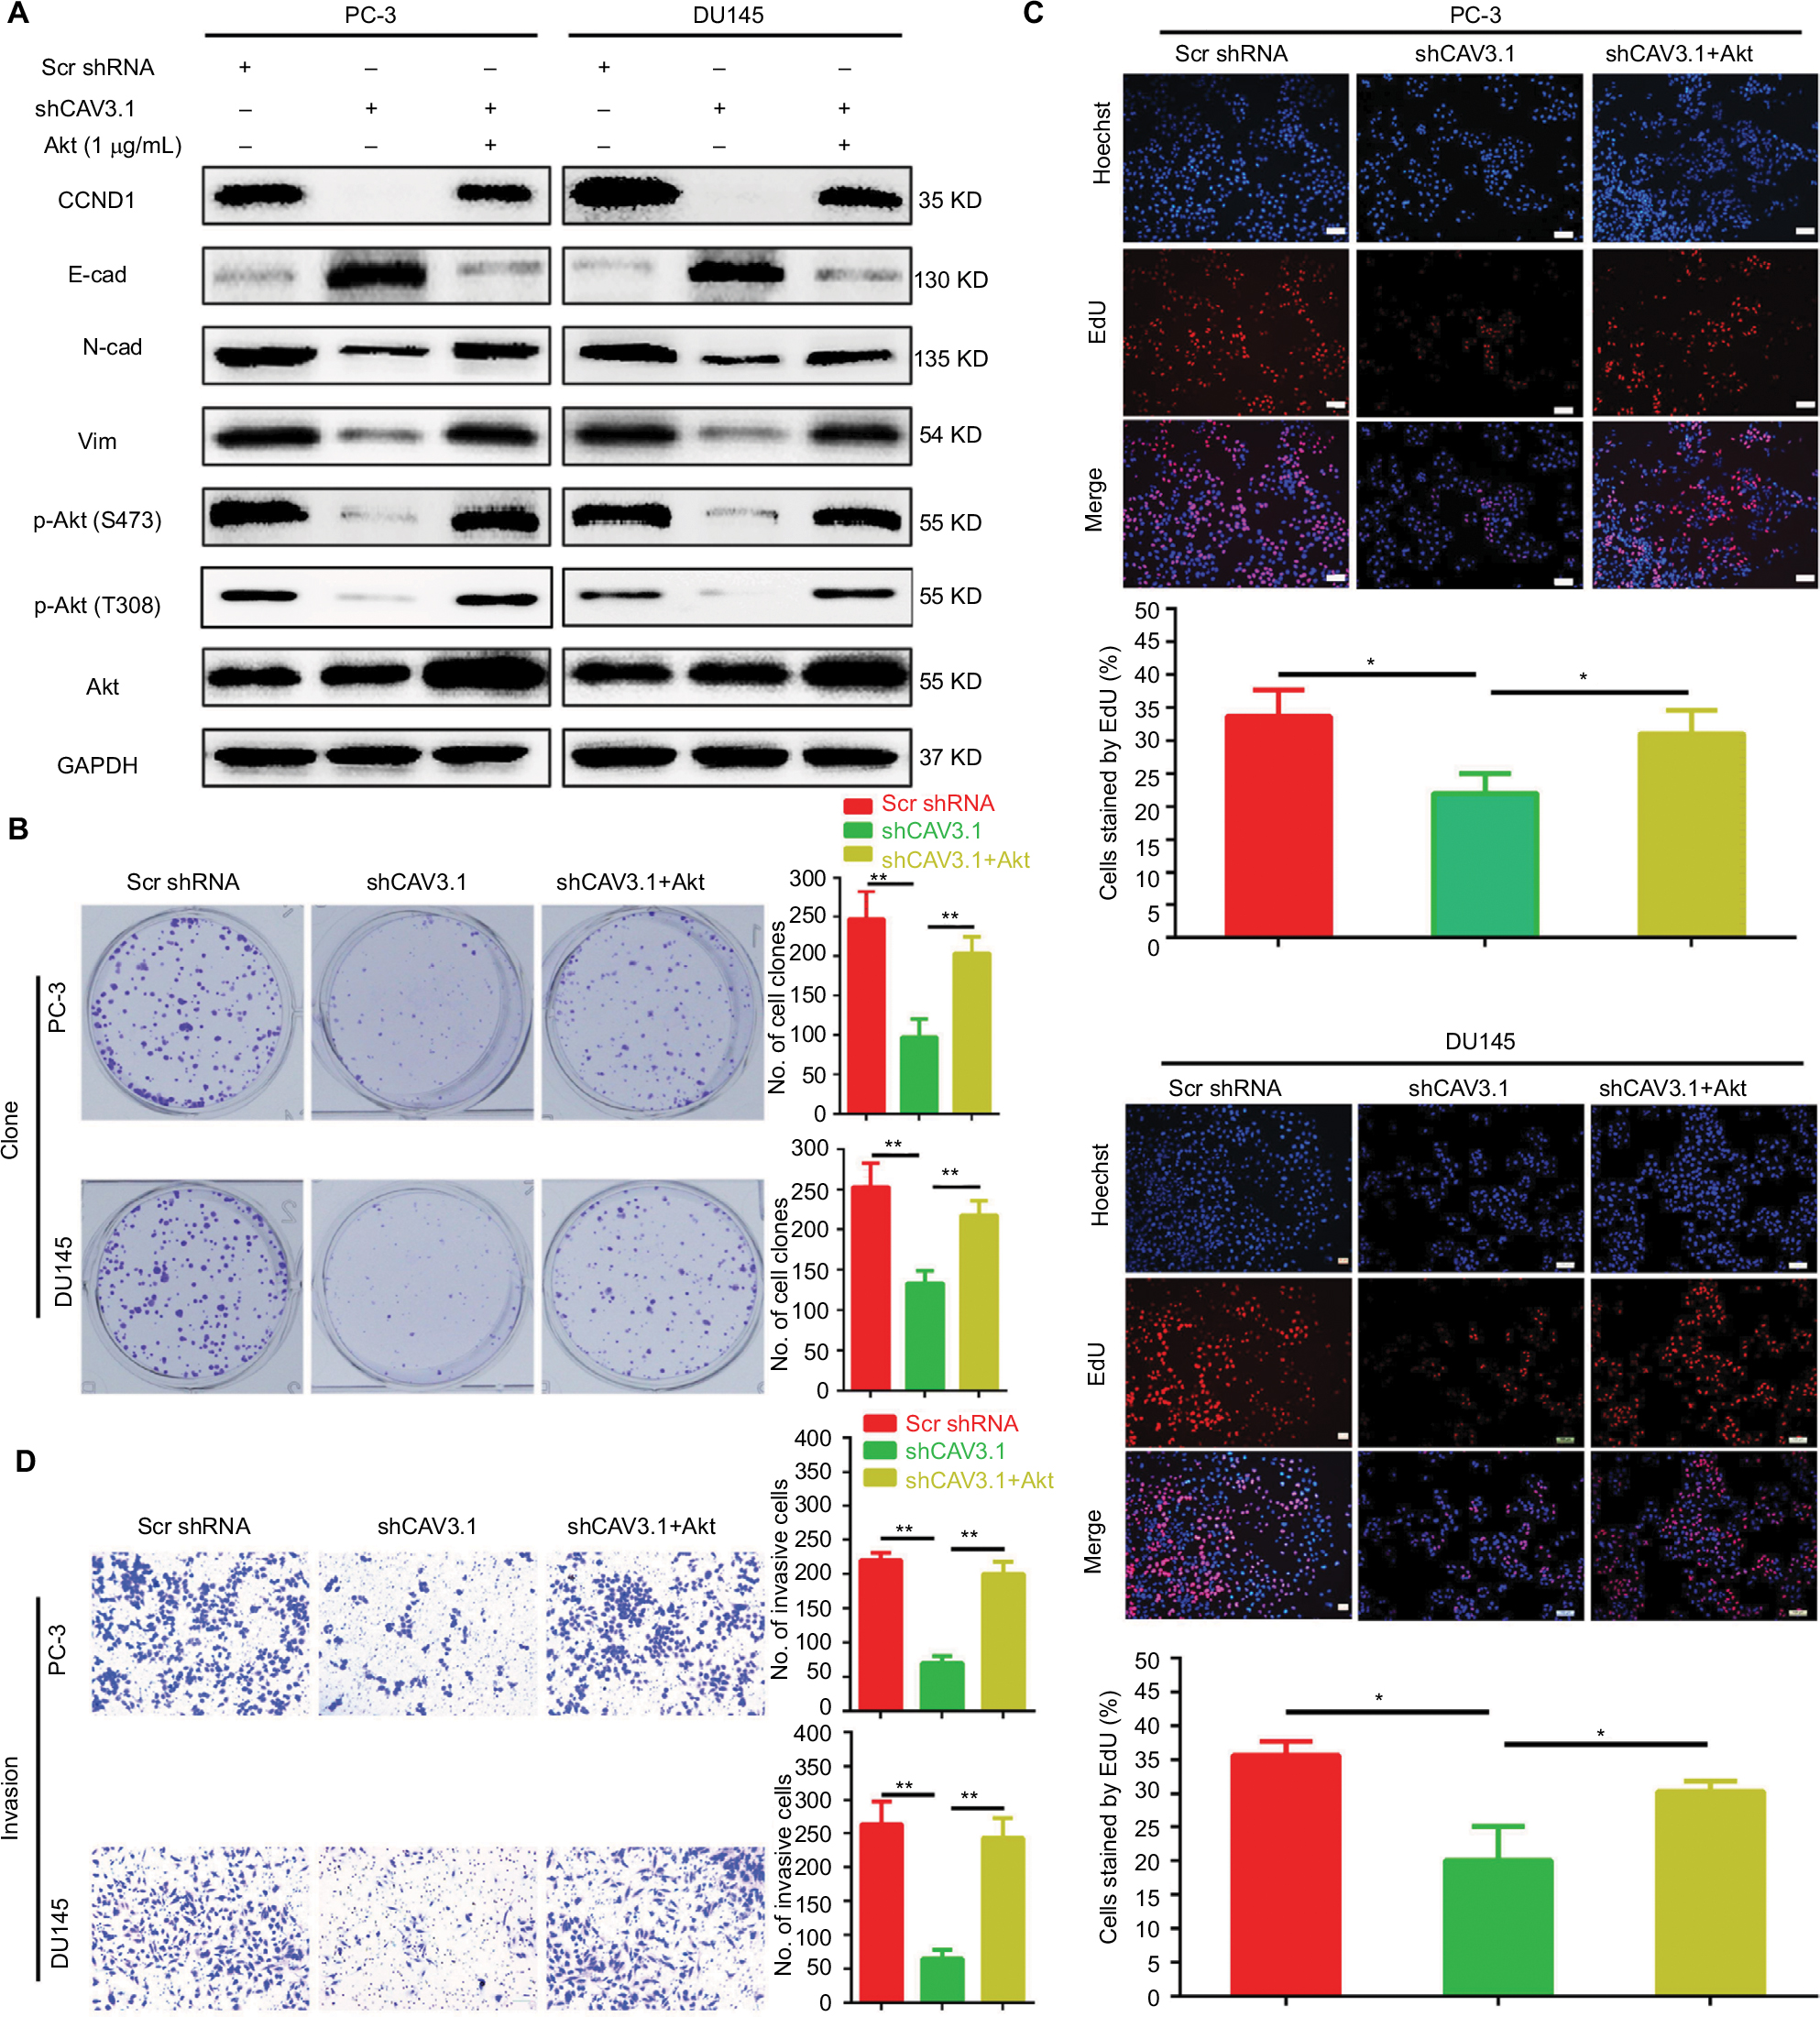 | Figure 5 Ectopic expression of Akt reversed the inhibitory effects on proliferation and invasion of PCa cells caused by CAV3.1 knockdown. Notes: (A) Ectopic expression of Akt antagonized the effects of CAV3.1 knockdown on CCND1, E-cad, N-cad, Vim, p-Akt (S473), and p-Akt (T308) in PCa cells. Ectopic expression of Akt reversed the clone number (B), EdU incorporated rates (C), and invasive cells (magnification ×200) (D) in PC-3 and DU145 cells with CAV3 (magnification ×100).1 knockdown. *P<0.05, **P<0.01. Abbreviations: E-cad, E-cadherin; EMT, epithelial–mesenchymal transition; GAPDH, glyceraldehyde-3-phosphate dehydrogenase; N-cad, N-cadherin; PCa, prostate cancer. |
Discussion
As an important class of Ca2+ channels, T-type Ca2+ channels have gained recognition as important in the regulation of in a multitude of cellular processes, both physiological and pathological, including cancer.7,8,13 Up to now, the roles of CAV3.1 and CAV3.2, 2 key T-type Ca2+ channels, in regulating cell proliferation have been revealed in multiple cancers, including glioblastoma,10 breast cancer,11 ovarian cancer,25,26 melanoma,12 esophageal carcinoma,27 hepatocellular carcinoma,28 lung cancer,14 and colon cancer,15 etc. As for PCa, the upregulated CAV3.2 and its function in accelerating secretory in neuroendocrine-differentiated PCa cells were extensively elucidated.16,17 However, the direct evidence for the roles of CAV3.1 in PCa is deficient. In the present study, we have shown that the mRNA and protein levels of CAV3.1 are significantly elevated in PCa tissues and cells. Moreover, we also revealed that CAV3.1 serves as a positive regulator in promotion of proliferation and invasion by activating Akt signaling in PCa cells.
Physiologically, CAV3.1 is expressed in several types of tissues with a high basal metabolic rate, including brain, heart, kidney, and smooth muscle.7 Similarly, aberrant upregulation of CAV3.1 in tumor cells is necessary to maintain its high metabolic levels and sustain its malignant characteristics. Significantly upregulated CAV3.1 has been observed in ovarian cancer, glioblastoma, colon cancer, hepatocellular carcinoma, melanoma, and lung cancer, etc. with a similar subcellular distribution pattern at cytoplasm and cell membrane.10,12,15,25,28 Similarly, our work revealed that CAV3.1 is upregulated in PCa in concert with the data from Human Protein Atlas database. Moreover, the upregulation of CAV3.1 is at least partly due to increased transcription of CAV3.1 supported by data from Oncomine and our qPCR analysis. Thus, the aberrant upregulation of CAV3.1 suggested that it may play an important role in PCa.
The relationship between CAV3.1 and proliferation has been revealed in multiple cancers. Most studies indicated the positive roles in regulation of proliferation. In ovarian cancer, CAV3.1 knockdown led to cell growth arrest, which accounted for the molecular mechanisms for NNC 55-0396, a specific inhibitor of T-type Ca2+ channels, induced cell proliferation inhibition.25 CAV3.1 knockdown can also mimic the inhibitory effects of mibefradil treatment on proliferation of glioblastoma cells.24 The similar effects were observed in hepatocellular carcinoma,28 colon cancer,15 and melanoma.12 Moreover, the mechanism for CAV3.1-driven proliferation seems due to alteration of cell cycle progression. Cell cycle arrest at G1/S or G2/M transition has been indicated in cancer cells with CAV3.1 knockdown.25 Here, our results also displayed that CAV3.1 knockdown impaired the proliferation of PCa cells. Besides, increased G1 and decreased S proportions plus decreased, CCND1, a key protein in G1/S checkpoint, indicated that constrained G1/S transition may contribute to the molecular mechanism for CAV3.1 knockdown induced proliferation in PCa. Apart from proliferation regulation, the roles of T-type Ca2+ channels in regulating migration and invasion have been displayed in glioblastoma cells.24 Accordingly, we also revealed that significant inhibitory effects were observed upon CAV3.1 knockdown in PCa cells.
As a second message, Ca2+ flux is necessary for the activation of downstream signaling molecules, such as multiple protein kinases, among which Akt, also known as protein kinase B, is of great importance in regulating most malignant properties.29 Moreover, distinct mechanisms of Akt activation, that Src-induced inhibitory phosphorylation of PP2A or calmodulin-dependent kinase kinase-mediated activated phosphorylation of Akt, are revealed.30 Equally, Akt’s activity is altered upon T-type Ca2+ channels modulation. Deregulated activity of Akt was observed upon specific T -type Ca2+ channels inhibitor treatment or CAV3.1 knockdown in glioblastoma cells.24 Therefore, we would like to know whether this correlation exists in PCa? Indeed, the results turned out that CAV3.1 knockdown led to downregulated p-Akt (S473) and p-Akt (T308) in PCa. Importantly, ectopic expression of Akt rescued the most inhibitory effects on proliferation and invasion induced by CAV3.1 knockdown in PCa. Therefore, CAV3.1 knockdown inhibits PCa progression by targeting Akt.
In conclusion, CAV3.1 was aberrantly upregulated in PCa and CAV3.1 knockdown suppressed Akt’s activity, thereby resulting in reduced proliferation and invasion ability of PCa cells.
Acknowledgment
This study was supported by the National Natural Science Foundation of China (number 81702924 to Wei Huang).
Disclosure
All authors have no conflicts of interest in this work.
References
Salinas CA, Tsodikov A, Ishak-Howard M, Cooney KA. Prostate cancer in young men: an important clinical entity. Nat Rev Urol. 2014;11(6):317–323. | ||
Wolf AM, Wender RC, Etzioni RB, et al. American Cancer Society guideline for the early detection of prostate cancer: update 2010. CA Cancer J Clin. 2010;60(2):70–98. | ||
Wang H, Liu G, Shen D, et al. HOXA1 enhances the cell proliferation, invasion and metastasis of prostate cancer cells. Oncol Rep. 2015;34(3):1203–1210. | ||
Chen FZ, Zhao XK. Prostate cancer: current treatment and prevention strategies. Iran Red Crescent Med J. 2013;15(4):279–284. | ||
Prevarskaya N, Ouadid-Ahidouch H, Skryma R, Shuba Y. Remodelling of Ca2+ transport in cancer: how it contributes to cancer hallmarks? Philos Trans R Soc Lond B Biol Sci. 2014;369(1638):20130097. | ||
Prevarskaya N, Skryma R, Shuba Y. Targeting Ca2+ transport in cancer: close reality or long perspective? Expert Opin Ther Targets. 2013;17(3):225–241. | ||
Panner A, Wurster RD. T-type calcium channels and tumor proliferation. Cell Calcium. 2006;40(2):253–259. | ||
Dziegielewska B, Gray LS, Dziegielewski J. T-type calcium channels blockers as new tools in cancer therapies. Pflugers Arch. 2014;466(4):801–810. | ||
Santoni G, Santoni M, Nabissi M. Functional role of T-type calcium channels in tumour growth and progression: prospective in cancer therapy. Br J Pharmacol. 2012;166(4):1244–1246. | ||
Zhang Y, Cruickshanks N, Yuan F, et al. Targetable T-type Calcium Channels Drive Glioblastoma. Cancer Res. 2017;77(13):3479–3490. | ||
Taylor JT, Huang L, Pottle JE, et al. Selective blockade of T-type Ca2+ channels suppresses human breast cancer cell proliferation. Cancer Lett. 2008;267(1):116–124. | ||
das A, Pushparaj C, Herreros J, et al. T-type calcium channel blockers inhibit autophagy and promote apoptosis of malignant melanoma cells. Pigment Cell Melanoma Res. 2013;26(6):874–885. | ||
Ellis RA. T-type calcium channels as potential biomarkers in melanoma. Br J Dermatol. 2017;176(5):1122. | ||
Suo A, Childers A, D’Silva A, et al. Cav3.1 overexpression is associated with negative characteristics and prognosis in non-small cell lung cancer. Oncotarget. 2018;9(9):8573–8583. | ||
Dziegielewska B, Brautigan DL, Larner JM, Dziegielewski J. T-type Ca2+ channel inhibition induces p53-dependent cell growth arrest and apoptosis through activation of p38-MAPK in colon cancer cells. Mol Cancer Res. 2014;12(3):348–358. | ||
Mariot P, Vanoverberghe K, Lalevee N, Rossier MF, Prevarskaya N. Overexpression of an alpha 1H (Cav3.2) T-type calcium channel during neuroendocrine differentiation of human prostate cancer cells. J Biol Chem. 2002;277(13):10824–10833. | ||
Gackière F, Bidaux G, Delcourt P, et al. CaV3.2 T-type calcium channels are involved in calcium-dependent secretion of neuroendocrine prostate cancer cells. J Biol Chem. 2008;283(15):10162–10173. | ||
Wen Q, Li J, Wang W, et al. Increased expression of flotillin-2 protein as a novel biomarker for lymph node metastasis in nasopharyngeal carcinoma. PLoS One. 2014;9(7):e101676. | ||
Yuan L, Yi HM, Yi H, et al. Reduced RKIP enhances nasopharyngeal carcinoma radioresistance by increasing ERK and AKT activity. Oncotarget. 2016;7(10):11463–11477. | ||
Qu JQ, Yi HM, Ye X, et al. MiRNA-203 Reduces Nasopharyngeal Carcinoma Radioresistance by Targeting IL8/AKT Signaling. Mol Cancer Ther. 2015;14(11):2653–2664. | ||
Kim KH, Kim D, Park JY, et al. NNC 55-0396, a T-type Ca2+ channel inhibitor, inhibits angiogenesis via suppression of hypoxia-inducible factor-1α signal transduction. J Mol Med. 2015;93(5):499–509. | ||
Li LN, Xiao T, Yi HM, Ln L, Hm Y, et al. MiR-125b Increases Nasopharyngeal Carcinoma Radioresistance by Targeting A20/NF-κB Signaling Pathway. Mol Cancer Ther. 2017;16(10):2094–2106. | ||
Feng X, Li C, Liu W, et al. DLC-1, a candidate tumor suppressor gene, inhibits the proliferation, migration and tumorigenicity of human nasopharyngeal carcinoma cells. Int J Oncol. 2013;42(6):1973–1984. | ||
Valerie NC, Dziegielewska B, Hosing AS, et al. Inhibition of T-type calcium channels disrupts Akt signaling and promotes apoptosis in glioblastoma cells. Biochem Pharmacol. 2013;85(7):888–897. | ||
Dziegielewska B, Casarez EV, Yang WZ, et al. T-Type Ca2+ Channel Inhibition Sensitizes Ovarian Cancer to Carboplatin. Mol Cancer Ther. 2016;15(3):460–470. | ||
Li W, Zhang SL, Wang N, Zhang BB, Li M. Blockade of T-type Ca(2+) channels inhibits human ovarian cancer cell proliferation. Cancer Invest. 2011;29(5):339–346. | ||
Lu F, Chen H, Zhou C, et al. T-type Ca2+ channel expression in human esophageal carcinomas: a functional role in proliferation. Cell Calcium. 2008;43(1):49–58. | ||
Li Y, Liu S, Lu F, et al. A role of functional T-type Ca2+ channel in hepatocellular carcinoma cell proliferation. Oncol Rep. 2009;22(5):1229–1235. | ||
Divolis G, Mavroeidi P, Mavrofrydi O, Papazafiri P. Differential effects of calcium on PI3K-Akt and HIF-1α survival pathways. Cell Biol Toxicol. 2016;32(5):437–449. | ||
Fedida-Metula S, Feldman B, Koshelev V, et al. Lipid rafts couple store-operated Ca2+ entry to constitutive activation of PKB/Akt in a Ca2+/calmodulin-, Src- and PP2A-mediated pathway and promote melanoma tumor growth. Carcinogenesis. 2012;33(4):740–750. |
Supplementary material
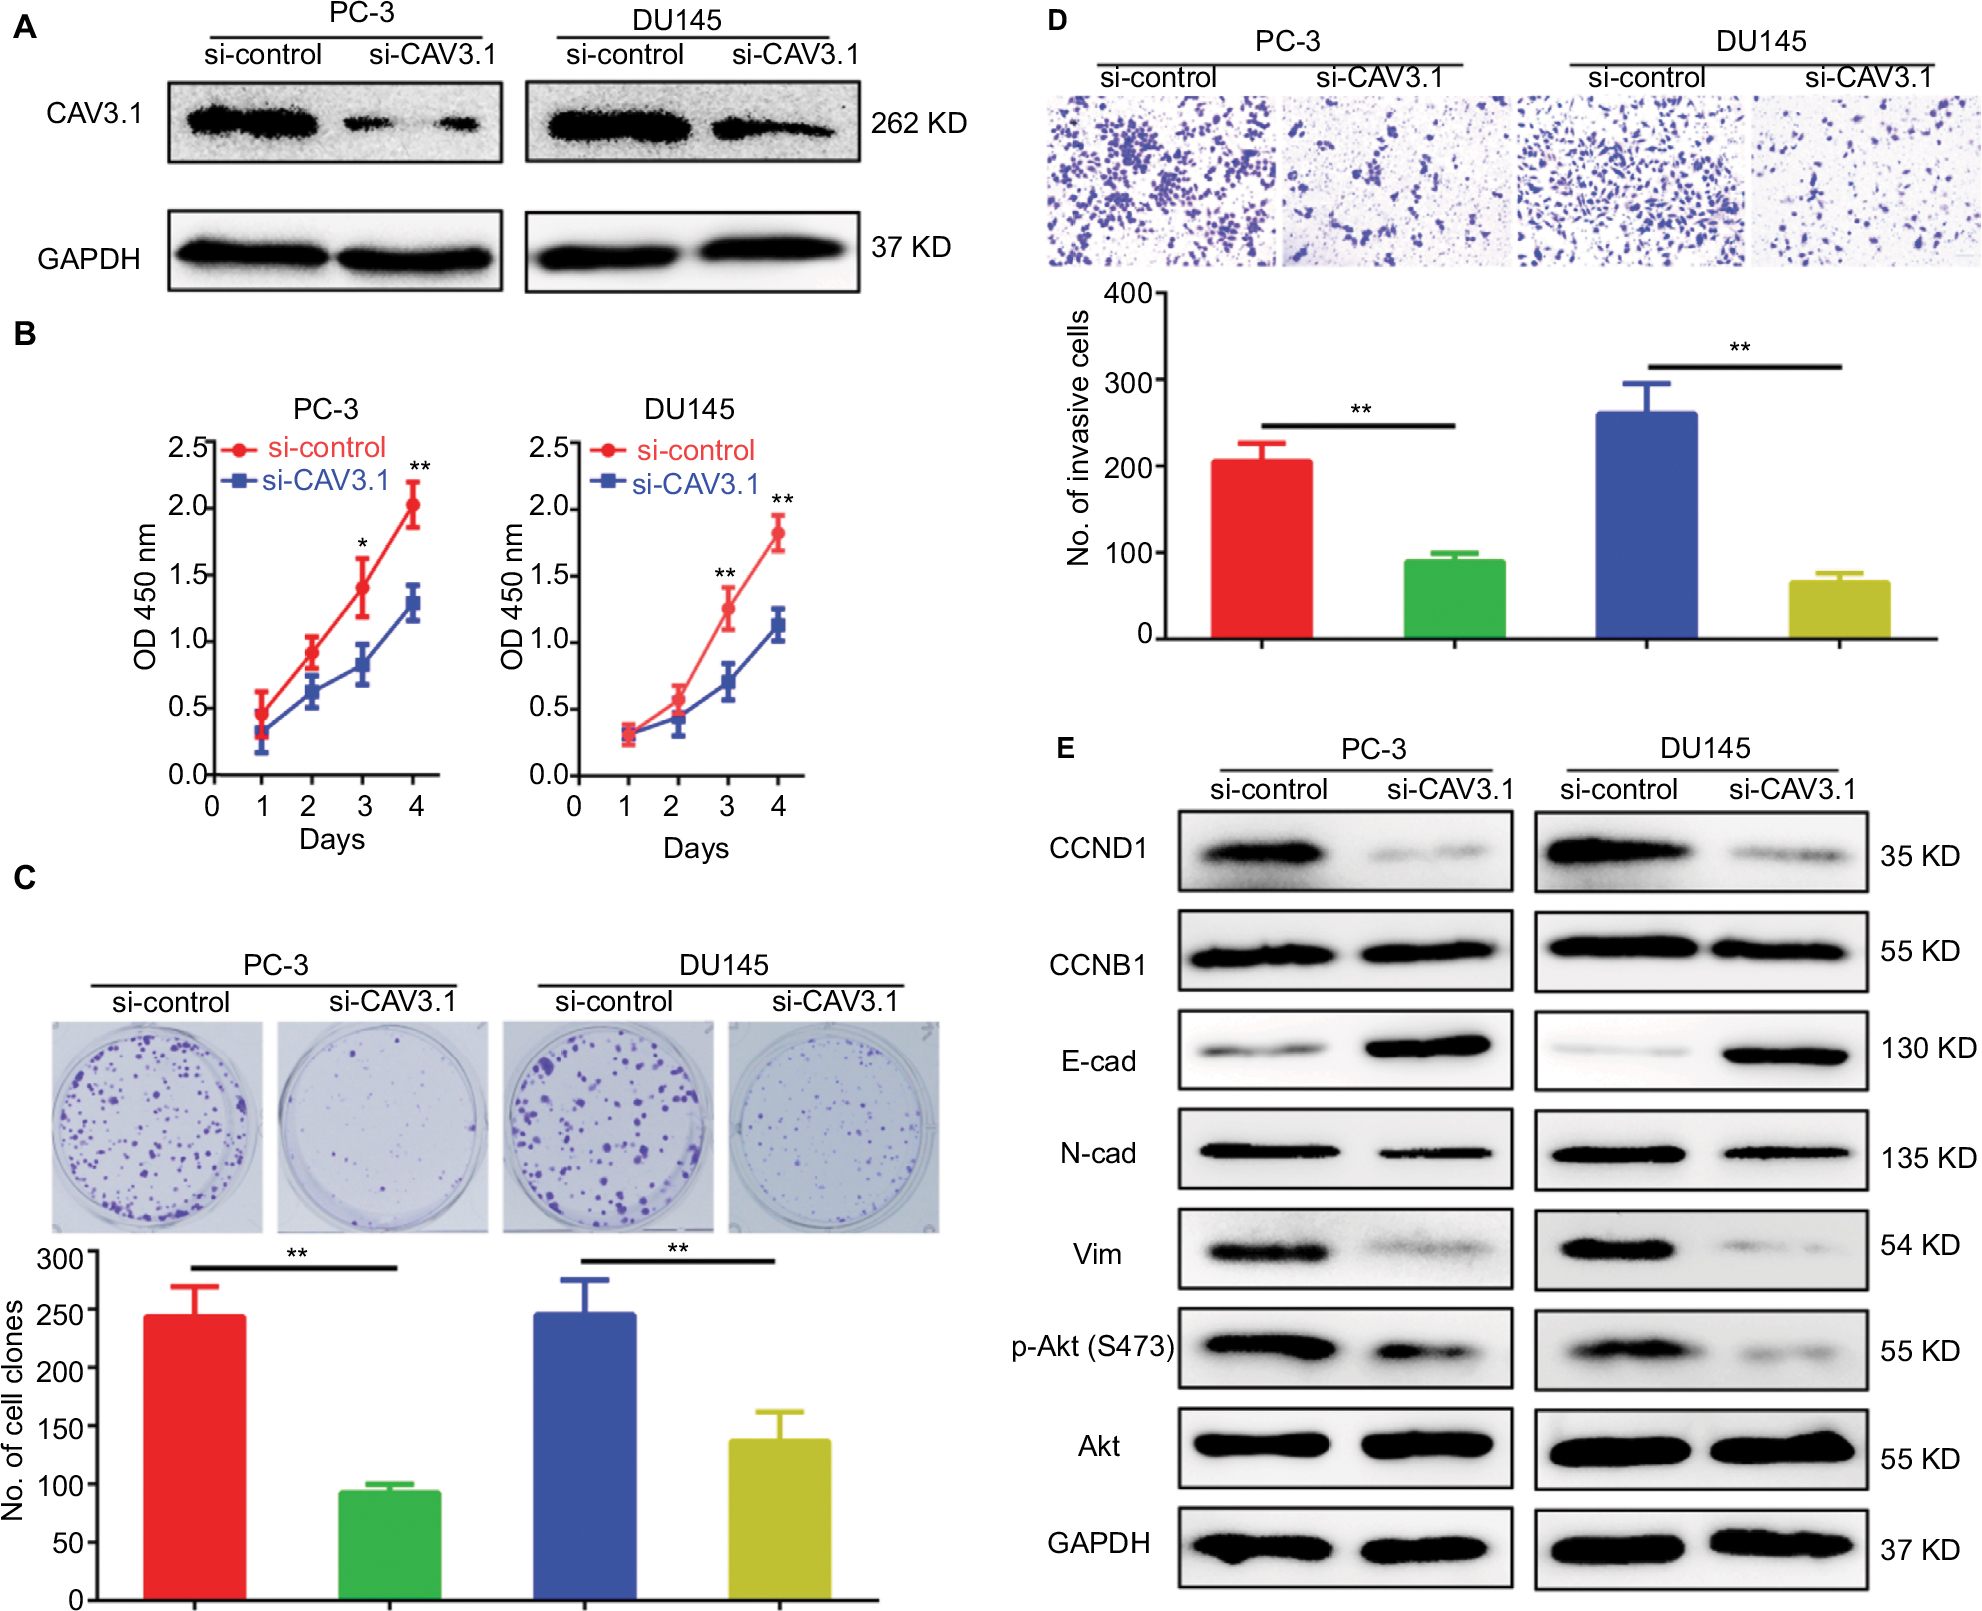 | Figure S1 Specific small interfering RNA targeting CAV3.1 (siCAV3.1) also showed inhibitory effects on proliferation and invasion of PCa cells. Notes: (A) CAV3.1 knockdown was achieved by transfecting siCAV3.1 into PC-3 and DU145 cells. siCAV3.1 mediated CAV3.1 knockdown also shows significant inhibitory effects on PC-3 and DU145 cell proliferation, indicated by decreased OD 450 nm value (B) and less clone number (C), and invasion ability, demonstrating by less invasive cell (D). (E) siCAV3.1 mediated CAV3.1 knockdown also led to similar effects on levels of proteins involving cell cycle transition, EMT and Akt activity. *P<0.05, **P<0.01. Magnification ×100. Abbreviations: E-cad, E-cadherin; EMT, epithelial–mesenchymal transition; GAPDH, glyceraldehyde-3-phosphate dehydrogenase; N-cad, N-cadherin; PCa, prostate cancer. |
 © 2018 The Author(s). This work is published and licensed by Dove Medical Press Limited. The full terms of this license are available at https://www.dovepress.com/terms.php and incorporate the Creative Commons Attribution - Non Commercial (unported, v3.0) License.
By accessing the work you hereby accept the Terms. Non-commercial uses of the work are permitted without any further permission from Dove Medical Press Limited, provided the work is properly attributed. For permission for commercial use of this work, please see paragraphs 4.2 and 5 of our Terms.
© 2018 The Author(s). This work is published and licensed by Dove Medical Press Limited. The full terms of this license are available at https://www.dovepress.com/terms.php and incorporate the Creative Commons Attribution - Non Commercial (unported, v3.0) License.
By accessing the work you hereby accept the Terms. Non-commercial uses of the work are permitted without any further permission from Dove Medical Press Limited, provided the work is properly attributed. For permission for commercial use of this work, please see paragraphs 4.2 and 5 of our Terms.