")
Back to Journals » Journal of Pain Research » Volume 9
Categorizing the severity of pain using questions from the 2012 National Health Interview Survey
Authors Nahin RL
Received 30 October 2015
Accepted for publication 16 December 2015
Published 1 March 2016 Volume 2016:9 Pages 105—113
DOI https://doi.org/10.2147/JPR.S99548
Checked for plagiarism Yes
Review by Single anonymous peer review
Peer reviewer comments 2
Editor who approved publication: Dr Michael Schatman
Richard L Nahin
National Center for Complementary and Integrative Health, National Institutes of Health, Bethesda, MD, USA
Background: Based on qualitative and mixed-method approaches, Miller and Loeb have proposed a coding system that combines questions on pain persistence and bothersomeness to create discrete categories of increasing pain severity for use in large population-based surveys. In the current analyses, using data from the 2012 National Health Interview Survey, we quantitatively assess the pain category definitions proposed by Miller and Loeb and compare this original definition to ten alternative definitions.
Methods: Using multivariate analysis of variance, each definition was related simultaneously to four dependent measures – the Kessler 6 score for measuring psychological distress, the number of health-related bed-disability days, the number of visits to a health professional, and the number of emergency room visits. Following the protocol of Serlin et al, the definition yielding the largest F score was considered the optimal definition.
Results: The Miller and Loeb definition produced the largest F value (185.87), followed consecutively by several alternative definitions #5 (184.17), #10 (180.95), and #9 (179.5). A nearly identical ordering was found when looking at the mean F value generated from 100 random samples. We also examined the frequencies with which each alternative definition achieved the optimal F value over the 100 random samples. Only two definitions had achieved the optimal F value >5% of the time: the Miller and Loeb definition was optimal 46% of the time, while alternative definition #5 was optimal 41% of the time. Similar results were seen in subpopulations with back pain and joint pain.
Conclusion: Additional support was provided for the Miller and Loeb coding of pain persistence and bothersomeness to produce discrete categories of increasing pain severity. This two-question coding scheme may prove to be a viable option for assessing pain severity in clinical settings where clinician time and patient burden are limiting factors.
Keywords: cross-sectional study, pain frequency, pain severity, MANOVA
Introduction
Since 2010, the US National Health Interview Survey (NHIS) has included questions assessing pain persistence and pain bothersomeness. These questions were developed and piloted as part of an international initiative under the purview of the Washington Group on Disability Statistics,1 constituted by the United Nations Statistical Commission. The goal of the Washington Group is to “promote and coordinate international cooperation in the area of health statistics focusing on disability measures suitable for censuses and national surveys” and “to develop tools to collect the basic data necessary to provide information on disability that is comparable throughout the world.”2
Based on qualitative and mixed-method studies performed in the United States and other countries affiliated with the Washington Group, Miller and Loeb3 have proposed a coding system that combines data from the NHIS questions on pain persistence and bothersomeness to create discrete categories of increasing pain severity. In a previous study,4 we not only demonstrated the concurrent validity of the coding system, with the pain categories discriminating between different levels of health status, disability, and health care use, but also identified steps that needed to be taken before the coding scheme could be fully incorporated into the armamentarium of the pain clinician or scientist. In particular, we noted that the category cut points for the coding system needed to be confirmed in quantitative analyses and in different anatomical sites of pain. Such data would offer additional support as to whether the coding system proposed by Miller and Loeb3 provides a valid measure of an individual’s current pain experience. Should the Miller and Loeb pain categories eventually fulfill all the criteria of a well validated and clinically useful pain scale, then the brevity of the Miller and Loeb approach will make it an excellent choice in situations where clinician time and patient burden are limiting factors.
In the current analyses, using data from the 2012 NHIS, we quantitatively assessed the pain category definitions proposed by Miller and Loeb3 by adapting a statistical approach widely used in the pain field for grading pain intensity with functional interference.5 Three goals that guided this study are 1) to assess whether the cut point analysis method proposed by Serlin et al5 can be applied to pain severity categories defined by self-reported pain persistence and bothersomeness, using measures of health status and health care use as cut point criteria; 2) to determine whether the optimal pain category definitions identified in the entire 2012 NHIS adult samples would be evidenced in randomly derived subsamples of the full sample; and 3) to determine if the same optimal pain category definitions would be evidenced in back pain and joint pain subpopulations.
Methods
Population
The data used in this study are from the 2012 NHIS Sample Adult Core and the NHIS Adult Functioning and Disability (AFD) supplement.6 The NHIS is an annual survey of the health of the US civilian, noninstitutionalized population conducted by the National Center for Health Statistics, Centers for Disease Control and Prevention. This in-person survey contains four main modules: household, family, sample child, and sample adult. The first two modules collect health and sociodemographic information on each member of all families residing within a sampled household. Within each family, additional information is collected from one randomly selected adult (the “sample adult”) aged 18 years or older. Bilingual interviewers or interpreters were recruited to interview all respondents who preferred the use of a language other than English. A Spanish language version is available for participants who prefer speaking in Spanish. The survey uses a multistage clustered sample design and oversamples Black, Asian, and Hispanic populations. When combined with Centers for Disease Control and Prevention-derived sampling weights, this design allows accurate extrapolation of findings to the civilian, noninstitutionalized US adult population.
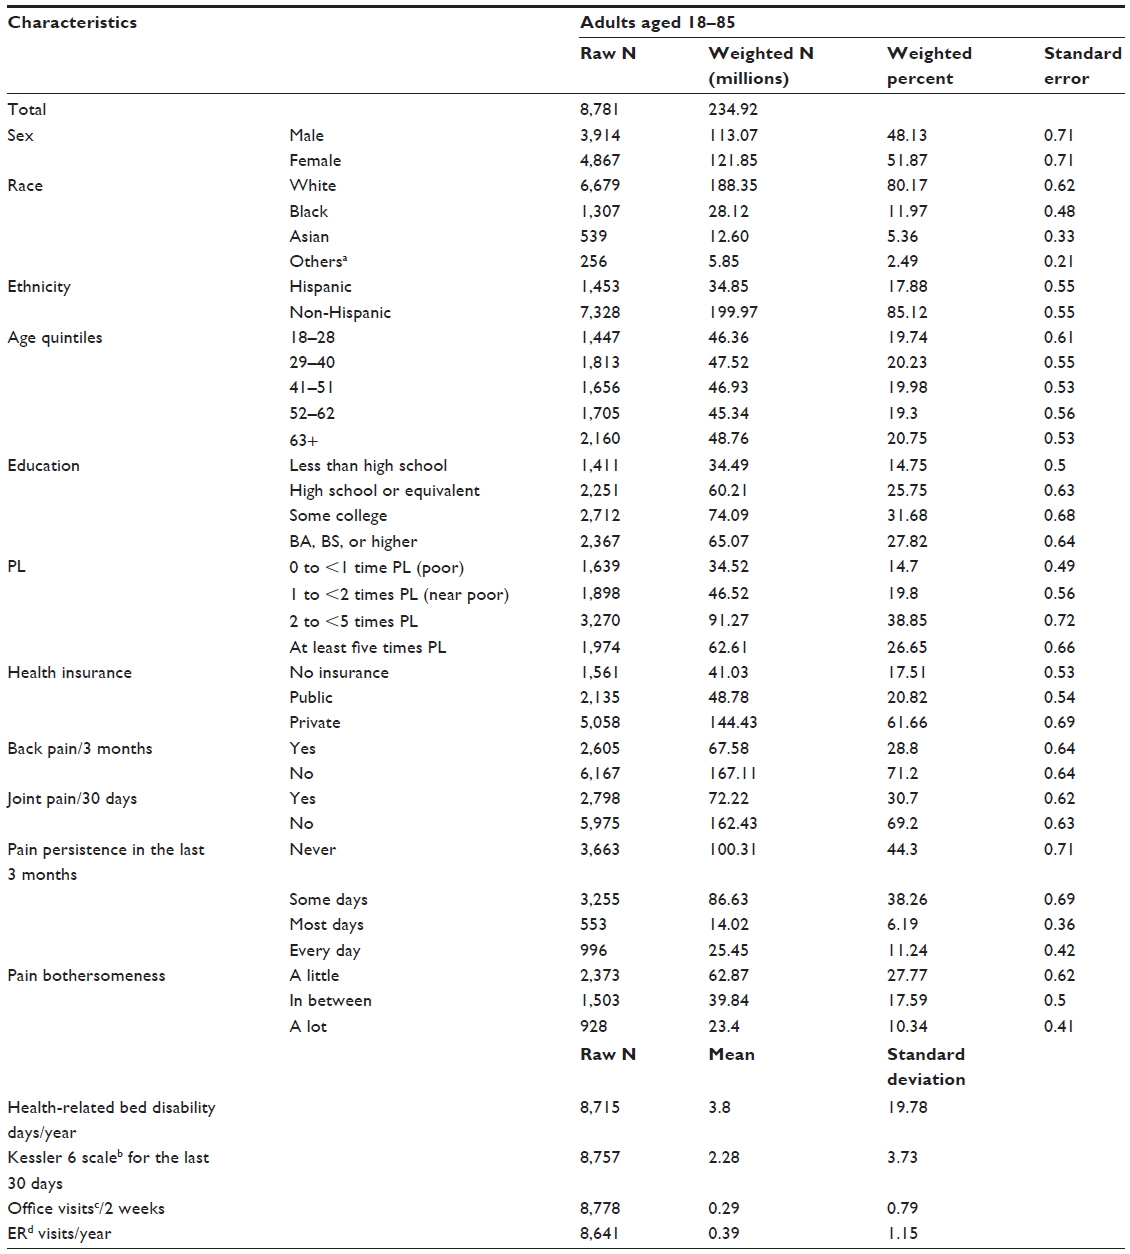
For the 2012 interview sample, there were 42,366 households consisting of 108,131 persons in 43,345 families. The total household response rate was 77.6%. From the households interviewed, 34,525 adults completed interviews, resulting in an overall sample adult response rate of 79.7%. Approximately one-quarter of sampled adults were randomly chosen to participate in the AFD supplement. Almost all chosen adults (8,781) completed the supplement resulting in a 98% supplement response. The demographic characteristics of the AFD sample are presented in Table 1.
 | Table 1 Demographic characteristics of the study population, National Health Interview Survey 2012 |
The 2012 NHIS was approved by the National Center for Health Statistics Research Ethics Review Board. Verbal consent was obtained from all survey respondents.
Dependent variable: assessment of pain
The AFD collected information on the persistence and bothersomeness of self-reported pain in the previous 3 months. Respondents were first asked how often they had pain in the previous 3 months: never, some days, most days, or every day. Data from this question provide estimates of the 3-month persistence (period prevalence) of pain. For those who had pain on at least some days, a follow-up question assessing bothersomeness was asked: “Thinking about the last time you had pain, how much pain did you have – a little, between a little and a lot, or a lot.” Ninety-six percent of AFD participants completed these pain questions. Given this high response rate, no attempt was made to impute missing data.
Miller and Loeb3 have suggested a coding scheme that combines persistence and bothersomeness of pain to create four discrete categories of increasingly severe pain (Figure 1). This coding scheme was tested and validated using a variety of qualitative assessments such as cognitive testing and mixed methods analyses2,3,7 and has been shown to have concurrent validity.4
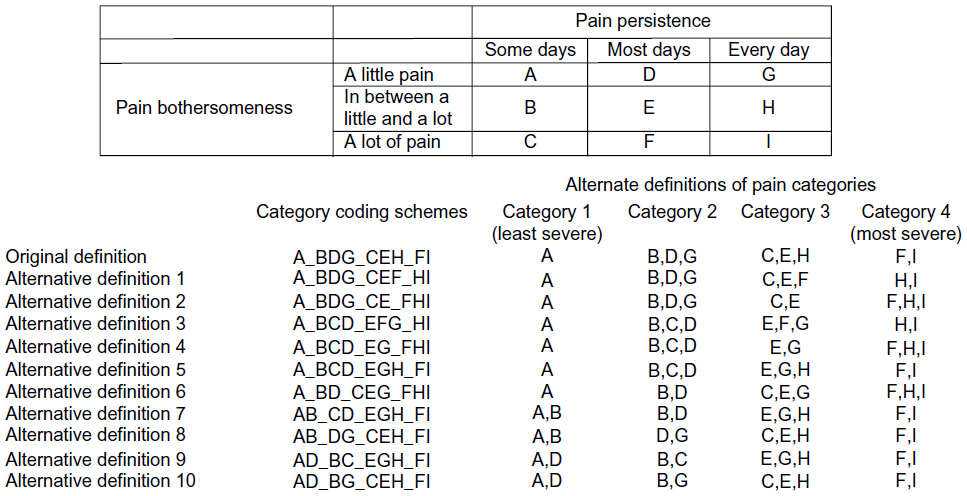 | Figure 1 Alternative definitions of pain severity categories based on pain persistence and bothersomeness. |
Alternative definitions of the four pain categories
In order to be consistent with the original pain category definitions of Miller and Loeb,3 the alternative definitions studied were restricted to four discrete categories that varied in only in their distributions of pain persistence and bothersomeness. To aid in identifying a set of alternative pain category definitions, we visually explored the relationship between nine pain persistence/bothersomeness combinations and measures of health status and health care use as defined later.
Psychological distress
Chronic pain often predicts the onset of psychological distress.8,9 In turn, psychological distress has been identified as one of the factors mediating pain’s relationship to disability.10 The NHIS measures nonspecific psychological distress over a 30-day recall period with the Kessler 6 (K6) scale.11 The K6 scale asks respondents about six manifestations of psychological distress: “During the past 30 days, how often did you feel (a) So sad that nothing could cheer you up? (b) Nervous? (c) Restless or fidgety? (d) Hopeless? (e) That everything was an effort? and f) Worthless?” Possible responses are “all of the time”, “most of the time”, “some of the time”, “a little of the time”, and “none of the time”. Scoring of the individual questions is based on a scale of between 0 and 4 points, according to increased frequency of the problem, yielding a total score on the scale from 0 (no psychological distress) to 24 (extreme psychological distress).11 This was examined as a continuous variable.
Health-related disability
Pain often results in disability days.12–14 Health-related bed-disability days were assessed with the survey question: “During the past 12 months, about how many days did illness or injury keep you in bed more than half of the day (include days while an overnight patient in a hospital)?” This was examined as a continuous variable.
Health care use
Pain is associated with increased health care use,13,15,16 including visits to emergency departments.17,18 Health care use was examined with two NHIS survey questions: 1) “How many times did you visit a doctor or other health care professional during the last 2 weeks?” and 2) “during the past 12 months, how many times have you gone to a hospital emergency room about your own health (this includes emergency room visits that resulted in a hospital admission)?” The data from these two questions were treated as continuous variables.
Pain-related health conditions
The 2012 NHIS Adult Core included questions on the presence of low back pain within the previous 3 months (yes and no), and on the presence of joint, aching or stiffness in the last 30 days (yes and no).
Statistical analyses
We studied the alternative definitions of the four pain categories using a variation of the statistical method described by Serlin et al.5 Each alternative definition was related simultaneously to four dependent measures – the K6 score, the number of health related bed-disability days, the number of visits to a health professional, and the number of emergency room visits – using multivariate analysis of variance (MANOVA). The MANOVA yields F values, based on Wilk’s lambda, for the between-category effect on the dependent variables. Following Serlin et al,5 the pain category definition yielding the best model fit, as measured by the F value, is considered the optimal definition. As suggested by Hirschfeld and Zernikow,19 we quantified the variability in the F value by running MANOVA in 100 random samples (with replacement) of 2,000 participants chosen from the entire sample population of 8,781. For each alternate definition, we calculated F score means and 95% confidence intervals (CIs) around the means. Also as suggested by Hirschfeld and Zernikow,19 we counted the number of times that each alternate definition was identified as the optimal definition based on MANOVA F scores generated from the random samples. In the 12 cases where F scores were tied, each definition was counted as optimal. Finally, using the approach described above, the alternative pain category definitions were further explored in two disease-specific populations: 1) those with back pain and 2) those with joint pain.
Results
Figure 2A–D shows the relationships between the nine combinations of pain persistence and bothersomeness and measures of health status and health care use. Those with “a lot of pain” either “most days” or “every day” had the highest mean K6 scores, 6.28 and 6.23, respectively (Figure 2A), indicating they were in more psychological distress then individuals with other combinations of pain persistence and pain severity. Conversely, those individuals with “a little pain” “some days” had the lowest mean K6 score (2.07) and least amount of psychological distress. Similar patterns were seen when examining the mean number of health-related bed days (Figure 2B), the mean number of office visits (Figure 2C), and the mean number of emergency room visits (Figure 2D), with those with “a lot of pain” either “most days” or “every day” having the highest values (mean number of bed days, 9.73 and 17.31, respectively; mean number of office visits, 0.69 and 0.77, respectively; and for mean number of ER visits, 1.35 and 1.38, respectively) and those with “a little pain” “some days” having the lowest values (mean number of bed days, 2.41; mean number of office visits, 0.24; and for the mean number of ER visits, 0.27). Two other consistent patterns were seen 1) individuals with “between a little and a lot of pain” either “most days” or “every day” had the third and fourth highest mean K6 score (3.74 and 4.07, respectively) and had the third and fourth highest mean number of bed days (8.74 and 9.27, respectively) and office visits (0.56 and 0.69, respectively) and 2) those with “a lot of pain” “some days” had the fourth lowest value for the K6 score (3.29) and the fourth lowest mean number of bed days (5.5) and office visits (0.46). The ranking of the other categories defined by pain persistence and pain severity varied considerably depending on the specific dependent measure.
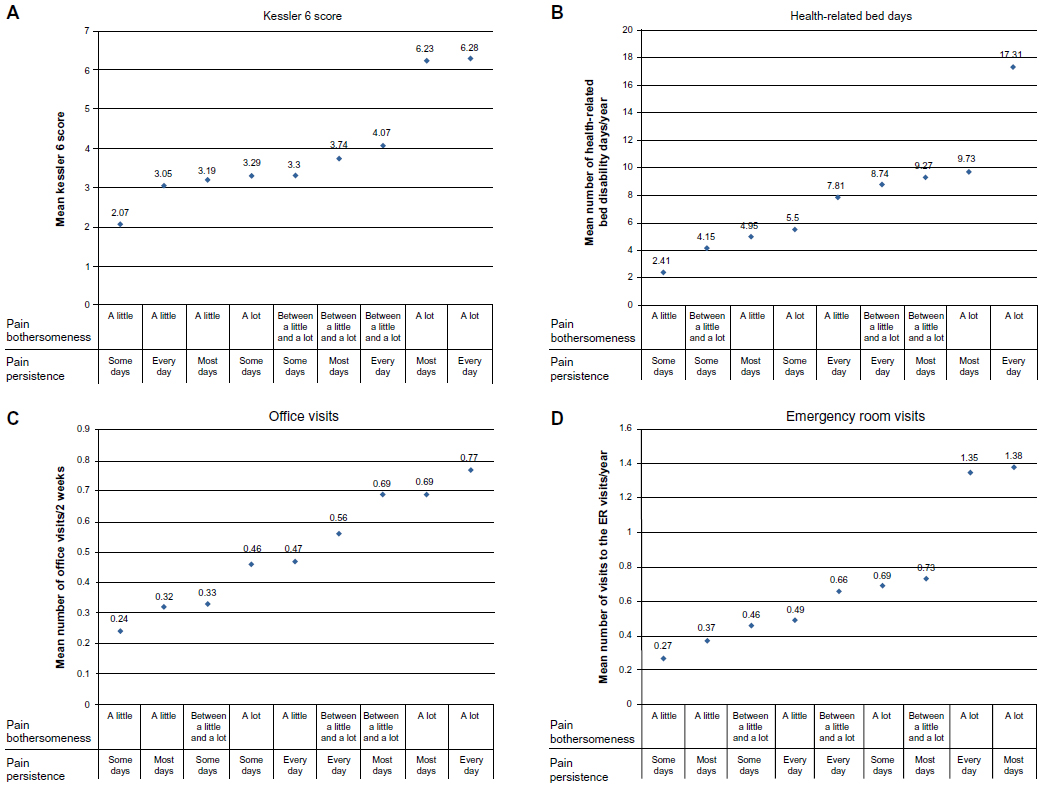 | Figure 2 Relationship between pain persistence and bothersomeness and measures of health status and health care use: (A) Kessler 6 score, (B) health-related bed days, (C) office visits, and (D) emergency room visits. |
Given the variability in the data, visual inspection of the graphs in Figure 2A–D was used to suggest alternative definitions of Miller and Loeb’s3 original pain categories (Figure 1; alternative definitions 1–10). For instance, the original definition and alternative definitions #1 and #2 defined pain categories 1 and 2 identically but varied in how they defined pain categories 3 and 4. Conversely, alternative definitions #8 and #10 had pain categories 3 and 4 in common with the original definition but varied in how they defined pain categories 1 and 2. Alternative definition #5 coded pain category 1 and pain category 4 identical with the original definition but varied in the other pain categories. Alternative definitions #3, #4, #6, #7, and #9 shared only one pain category in common with the original definition.
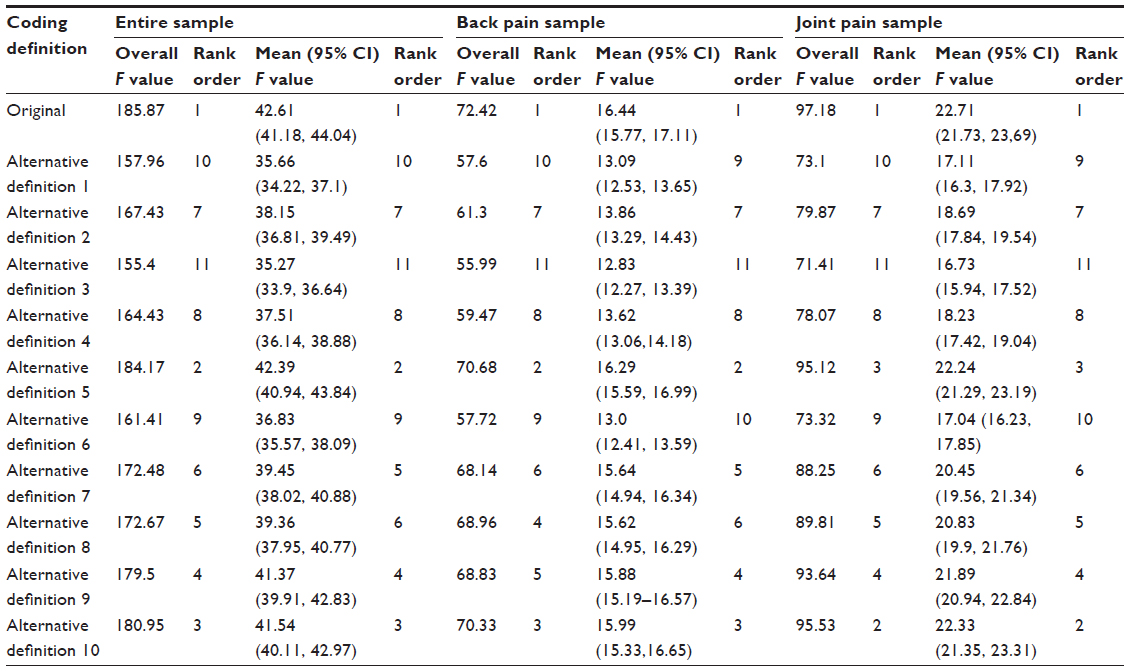
Along with the original definition, these alternate definitions were assessed using MANOVA as described earlier. Table 2 shows the Wilk’s lambda F values calculated from the entire sample of 8,781 for each of the alternative definitions. The original definition produced the largest F value (185.87) followed consecutively by alternative definitions #5 (184.17), #10 (180.95), and #9 (179.5). Nearly identical ordering was found when looking at the mean F value means generated from 100 random samples (Table 2). However, considerable overlap was seen between the 95% confidence interval (CI) for the original definition and alternative definition #5, #9, and #10. Figure 3 presents the frequencies with which each alternative definition achieved the optimal F value over the 100 random samples. Interestingly, while there are only small differences seen in either the overall F values or mean F values (Table 2), large differences were seen in the observed frequencies – only two definitions had achieved the optimal F value >5% of the time: the original definition (46%) and alternative definition #5 (41%).
 | Table 2 Overall and mean MANOVA F values for possible alternative definitions of pain severity categories relative to health status and health care |
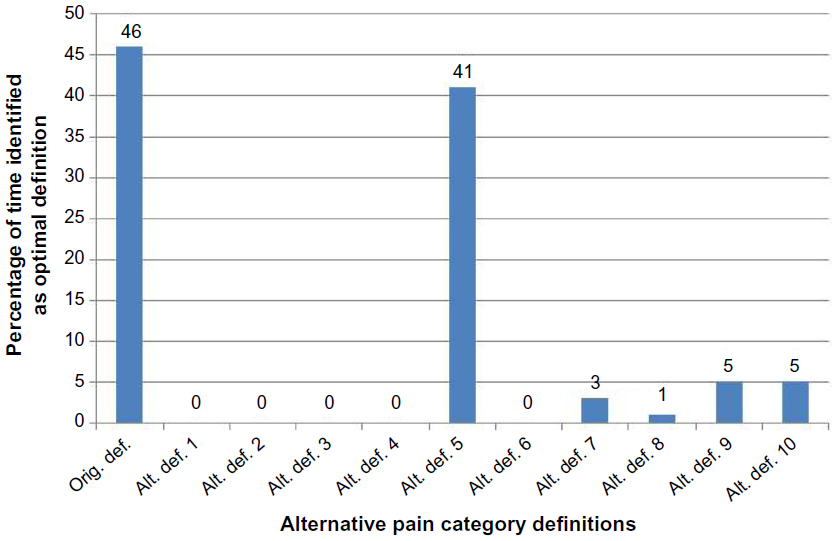 | Figure 3 Frequencies of optimal MANOVA F values for possible alternative definitions of pain severity categories, relative to health status and health care use in the general population. |
Table 2 also shows the overall F values and the mean F values in those with back pain or joint pain, while Figures 4 and 5 show the frequency of the optimal F values in those with back pain and joint pain, respectively. For both those with back pain (Table 2; Figure 4) and those with joint pain (Table 2; Figure 5), the original definition had the highest overall F value (back pain, 72.42; joint pain, 97.18) and the highest mean F value (back pain, 16.44; joint pain, 22.71). As in the overall adult sample, small differences in F values translated into large differences in the percent of time a given definition had the optimal F value. In the random samples of those with back pain (Figure 4), 38% of the time the original definition was identified as having the optimal F value across the 100 samples, followed by alternative definition #5 at 36%. In those with joint pain (Figure 5), the frequencies were more divergent: 49% for the original definition and 28% for alternative definition #5.
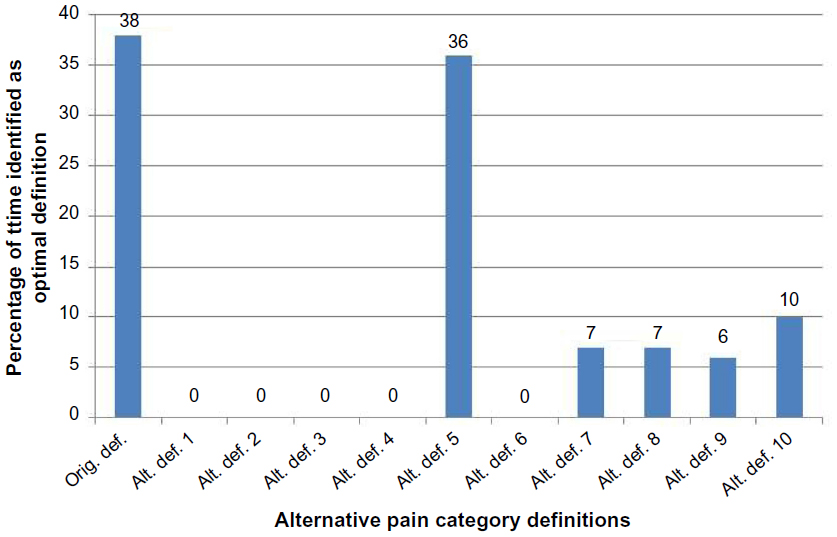 | Figure 4 Frequencies of optimal MANOVA F values for possible alternative definitions of pain severity categories, relative to health status and health care use in those with self-identified back pain. |
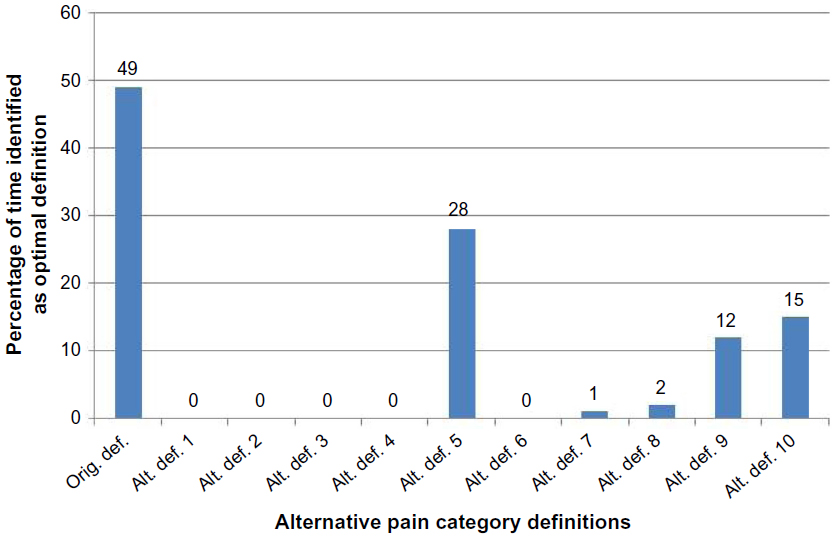 | Figure 5 Frequencies of optimal MANOVA F values for possible alternative definitions of pain severity categories, relative to health status and health care use in those with self-identified joint pain. |
Discussion
Using a series of MANOVA, we sought to identify the optimal definition of discrete pain categories using existing NHIS questions that assessed pain persistence and severity. The results of MANOVA on a large nationally representative sample of adults indicated that the original pain category definitions suggested by Miller and Loeb3 provided the best model fit versus ten alternative definitions. We confirmed this finding in 100 random samples of the total sample, as well as in two disease-specific subpopulations, those with back pain and those with joint pain. Therefore, the present data provide additional support that the NHIS coding system proposed by Miller and Loeb3 is a valid measure of an individual’s current pain experience.
Given the large number of statistical tests employed in this analysis (>300), it is possible that some of our observations occurred purely by chance. This multiple-test issue has been suggested as a possible weakness of the Serlin approach.19 To overcome the multiple-test issue, Hirschfeld and Zernikow19 suggest examining the variability of the observed optimal definitions, which we have done in the present report. Data based on F values for the entire sample, mean F values with 95% CIs derived from the random samples, and the frequency with which optimal definitions are observed produced the same conclusion, that the coding scheme proposed by Miller and Loeb3 is the optimal definition. However, the data additionally show that one alternative definition (#5) also does very well across comparisons. The original definition and alternative definition #5 code pain category 1 (least severe pain) and pain category 4 (most severe pain) identically and vary only slightly in how pain persistence and bothersomeness are combined to create pain categories 2 and 3; specifically, the original definition places slightly more emphasis on grouping by pain bothersomeness, while alternative definition #5 places slightly more emphasis on grouping by pain persistence. Future analyses, such as that using receiver operating characteristic curves, might help clarify the test characteristics of these two definitions.
There are several additional limitations to this study. First, the categories we used were based on only pain persistence and bothersomeness, and therefore do not reflect the multidimensional nature of pain. Second, potential confounders or effect modifiers, such as age, education, race, and sex were not included in this study as we were first concerned with exploring alternative cut points in the general population versus optimizing the MANOVA for specific demographic groups. Whether the Miller and Loeb definition remains the optimal definition in specific demographic populations will need to be assessed in future. Third, the NHIS did not include a well-validated scale for measuring pain-related disability. Instead, we were limited to only a handful of variables measuring health status and health care use and for which continuous data were collected (required for MANOVA). As shown by Zelman et al20 and Fejer et al,21 the conclusions from cut point analyses vary depending on the dependent variables used. Other results may have been found using the Brief Pain Inventory, other pain-related disability measures, or more widely used generic measures of function such the SF-36. Therefore, the present results are suggestive rather than definitive and await corroboration in different samples. Finally, in order to be consistent with the original pain category definitions suggested by Miller and Loeb,3 we have limited our analyses to alternative definitions derived to create four discrete pain categories. It is not known if fewer or greater numbers of categories would better explain the variance in MANOVA. Future research might clarify this issue.
Conclusion
This study provides additional support for the coding of NHIS-derived pain as proposed by Miller and Loeb.3 We demonstrated that the Miller and Loeb3 coding scheme provided optimal MANOVA cut points for pain severity relative to health status and health care use, both in the general population and in disease-specific subpopulations. Still to be explored is how well the NHIS questions correlate with established validated measures of pain and whether they are sensitive enough to assess changes in pain severity over time. With further validation, the Miller and Loeb approach may prove to be a brief, viable option for assessing pain severity in clinical and research settings.
Acknowledgments
The author thanks Ms Danita Byrd-Clark of Social and Scientific Systems for her programming skills, Mr Bryan Ewsichek of National Center for Complementary and Integrative Health (NCCIH), National Institutes of Health (NIH), for his help with graphic design, and most of the NCCIH staff who read and commented on earlier versions of this work.
Disclosure
The author’s time and effort on this project were supported as part of his official duties as a federal employee. No outside financial support was provided. The author reports no other conflicts of interest in this work.
References
Centers for Disease Control and Prevention [webpage on the Internet]. Washington Group on Disability Statistics. 2015. Available from: http://www.cdc.gov/nchs/washington_group.htm. Accessed April 23, 2015. | |
Madans JH, Loeb ME, Altman BM. Measuring disability and monitoring the UN Convention on the Rights of Persons with Disabilities: the work of the Washington Group on Disability Statistics. BMC Public Health. 2011;11(suppl 4):S4. | |
Miller K, Loeb M [web page on the Internet]. Mixed-method assessment of validity and cross-subgroup comparability. AAPOR 69th Annual Conference. Anaheim, CA: 2014. Available from: http://www.aapor.org/AAPORKentico/AAPOR_Main/media/MainSiteFiles/Abstract_Book_FNL.pdf. Accessed April 22, 2014. | |
Nahin RL. Estimates of pain prevalence and severity in adults: United States, 2012. J Pain. 2015;16(8):769–780. | |
Serlin RC, Mendoza TR, Nakamura Y, Edwards KR, Cleeland CS. When is cancer pain mild, moderate or severe? Grading pain severity by its interference with function. Pain. 1995;61(2):277–284. | |
National Center for Health Statistics. Data File Documentation, National Health Interview Survey, 2012. Hyattsville, MD: National Center for Health Statistics, Centers for Disease Control and Prevention; 2013. | |
Madans JH, Loeb M. Methods to improve international comparability of census and survey measures of disability. Disabil Rehabil. 2013;35:1070–1073. | |
Harris T, Cook DG, Victor C, DeWilde S, Beighton C. Onset and persistence of depression in older people – results from a 2-year community follow-up study. Age Ageing. 2006;35(1):25–32. | |
Landi F, Onder G, Cesari M, et al; SILVERNET-HC Study Group. Pain and its relation to depressive symptoms in frail older people living in the community: an observational study. J Pain Symptom Manage. 2005;29(3):255–262. | |
Lee H, Hübscher M, Moseley GL, et al. How does pain lead to disability? A systematic review and meta-analysis of mediation studies in people with back and neck pain. Pain. 2015;156(6):988–997. | |
Kessler RC, Andrews G, Colpe LJ, et al. Short screening scales to monitor population prevalences and trends in non-specific psychological distress. Psychol Med. 2002;32:959–976. | |
Carey TS, Evans A, Hadler N, Kalsbeek W, McLaughlin C, Fryer J. Care-seeking among individuals with chronic low back pain. Spine (Phila Pa 1976). 1995;20(3):312–317. | |
Häuser W, Wolfe F, Henningsen P, Schmutzer G, Brähler E, Hinz A. Untying chronic pain: prevalence and societal burden of chronic pain stages in the general population – a cross-sectional survey. BMC Public Health. 2014;14:352. | |
Ren XS, Selim AJ, Fincke G, et al. Assessment of functional status, low back disability, and use of diagnostic imaging in patients with low back pain and radiating leg pain. J Clin Epidemiol. 1999;52(11):1063–1071. | |
Stockbridge EL, Suzuki S, Pagán JA. Chronic pain and health care spending: an analysis of longitudinal data from the Medical Expenditure Panel Survey. Health Serv Res. 2015;50(3):847–870. | |
Von Korff M, Wagner EH, Dworkin SF, Saunders KW. Chronic pain and use of ambulatory health care. Psychosom Med. 1991;53(1):61–79. | |
Blyth FM, March LM, Brnabic AJ, Cousins MJ. Chronic pain and frequent use of health care. Pain. 2004;111(1–2):51–58. | |
Milbrett P, Halm M. Characteristics and predictors of frequent utilization of emergency services. J Emerg Nurs. 2009;35(3):191–198. | |
Hirschfeld G, Zernikow B. Variability of “optimal” cut points for mild, moderate, and severe pain: neglected problems when comparing groups. Pain. 2013;154(1):154–159. | |
Zelman DC, Hoffman DL, Seifeldin R, Dukes EM. Development of a metric for a day of manageable pain control: derivation of pain severity cut-points for low back pain and osteoarthritis. Pain. 2003;106(1–2):35–42. | |
Fejer R, Jordan A, Hartvigsen J. Categorizing the severity of neck pain: establishment of cut-points for use in clinical and epidemiological research. Pain. 2005;119(1–3):176–182. |
 © 2016 The Author(s). This work is published and licensed by Dove Medical Press Limited. The full terms of this license are available at https://www.dovepress.com/terms.php and incorporate the Creative Commons Attribution - Non Commercial (unported, v3.0) License.
By accessing the work you hereby accept the Terms. Non-commercial uses of the work are permitted without any further permission from Dove Medical Press Limited, provided the work is properly attributed. For permission for commercial use of this work, please see paragraphs 4.2 and 5 of our Terms.
© 2016 The Author(s). This work is published and licensed by Dove Medical Press Limited. The full terms of this license are available at https://www.dovepress.com/terms.php and incorporate the Creative Commons Attribution - Non Commercial (unported, v3.0) License.
By accessing the work you hereby accept the Terms. Non-commercial uses of the work are permitted without any further permission from Dove Medical Press Limited, provided the work is properly attributed. For permission for commercial use of this work, please see paragraphs 4.2 and 5 of our Terms.