")
Back to Journals » International Journal of Nanomedicine » Volume 17
Cascade-Enhanced Catalytic Nanocomposite with Glutathione Depletion and Respiration Inhibition for Effective Starving-Chemodynamic Therapy Against Hypoxic Tumor
Authors Zhang Y, Hu H, Deng X, Song Q , Xing X, Liu W, Zhang Y
Received 19 July 2022
Accepted for publication 5 November 2022
Published 21 November 2022 Volume 2022:17 Pages 5491—5510
DOI https://doi.org/10.2147/IJN.S382750
Checked for plagiarism Yes
Review by Single anonymous peer review
Peer reviewer comments 2
Editor who approved publication: Dr Phong A Tran
Yiran Zhang,1– 4,* Hongzhi Hu,5,* Xiangtian Deng,6,* Qingcheng Song,2 Xin Xing,2,3 Weijian Liu,5 Yingze Zhang1– 3
1School of Medicine, Nankai University, Tianjin, 300071, People’s Republic of China; 2Department of Orthopaedic Surgery, Third Hospital of Hebei Medical University, Shijiazhuang, Hebei, 050051, People’s Republic of China; 3NHC Key Laboratory of Intelligent Orthopaedic Equipment, Third Hospital of Hebei Medical University, Shijiazhuang, Hebei, People’s Republic of China; 4HeBei Ex&Invivo Biotechnology Co. Ltd, Shijiazhuang, Hebei, 050051, People’s Republic of China; 5Department of Orthopaedics, Union Hospital, Tongji Medical College, Huazhong University of Science and Technology, Wuhan, 430022, People’s Republic of China; 6Orthopaedics Research Institute, Department of Orthopaedics, West China Hospital, Sichuan University, Chengdu, Sichuan, People’s Republic of China
*These authors contributed equally to this work
Correspondence: Yingze Zhang; Weijian Liu, Email [email protected]; [email protected]
Background: Although chemodynamic therapy (CDT) has attracted enormous attention in anti-tumor studies for converting endogenous hydrogen peroxide (H2O2) into toxic hydroxyl radicals (•OH) by Fenton-type reaction, the treating effects of using CDT alone is still unsatisfying. Recently, glucose oxidase (GOx) was reported to be co-delivered with Fenton agent for synergistic starvation therapy (ST) and CDT. However, the overexpressed glutathione (GSH) and hypoxia in tumor microenvironment (TME) restrict the therapeutic efficacy of ST/CDT.
Methods and Results: In this work, a novel nanoplatform composed of GOx plus Fenton agent (Cu2+) encapsulated core and metformin (MET)-loaded manganese dioxide nanosheets (MNSs) shell was prepared and further functionalized by arginine-glycine-aspartate (RGD). With the RGD-mediated affinity with cancer cells, the nanocomposite (GOx-CuCaP@MNSs-MET@PEG-RGD, GCMMR) could accomplish targeting delivery and TME-activated release of cargos. The intracellular GSH was depleted by MnO2/Cu2+ and abundant H2O2 was generated along with the GOx-induced glucose deprivation, which process was further enhanced by MET-mediated hypoxia relief via inhibiting mitochondria-associated respiration. Subsequently generated •OH from Cu+-mediated Fenton-like reaction exerts severe intracellular oxidative stress and cause apoptosis. Moreover, significant inhibition of tumor growth was detected in a subcutaneous xenograft model of osteosarcoma (OS) after GCMMR treatment.
Conclusion: The excellent therapeutic efficacy and biosafety of the nanoplatform were confirmed both in vitro and in vivo. Collectively, this study provides an appealing strategy with catalytic cascade enhancement on targeted ST/CDT for cancer treatment, especially for hypoxic solid tumors.
Keywords: chemodynamic therapy, starvation therapy, glucose oxidase, Fenton reaction, biomineralization, metformin
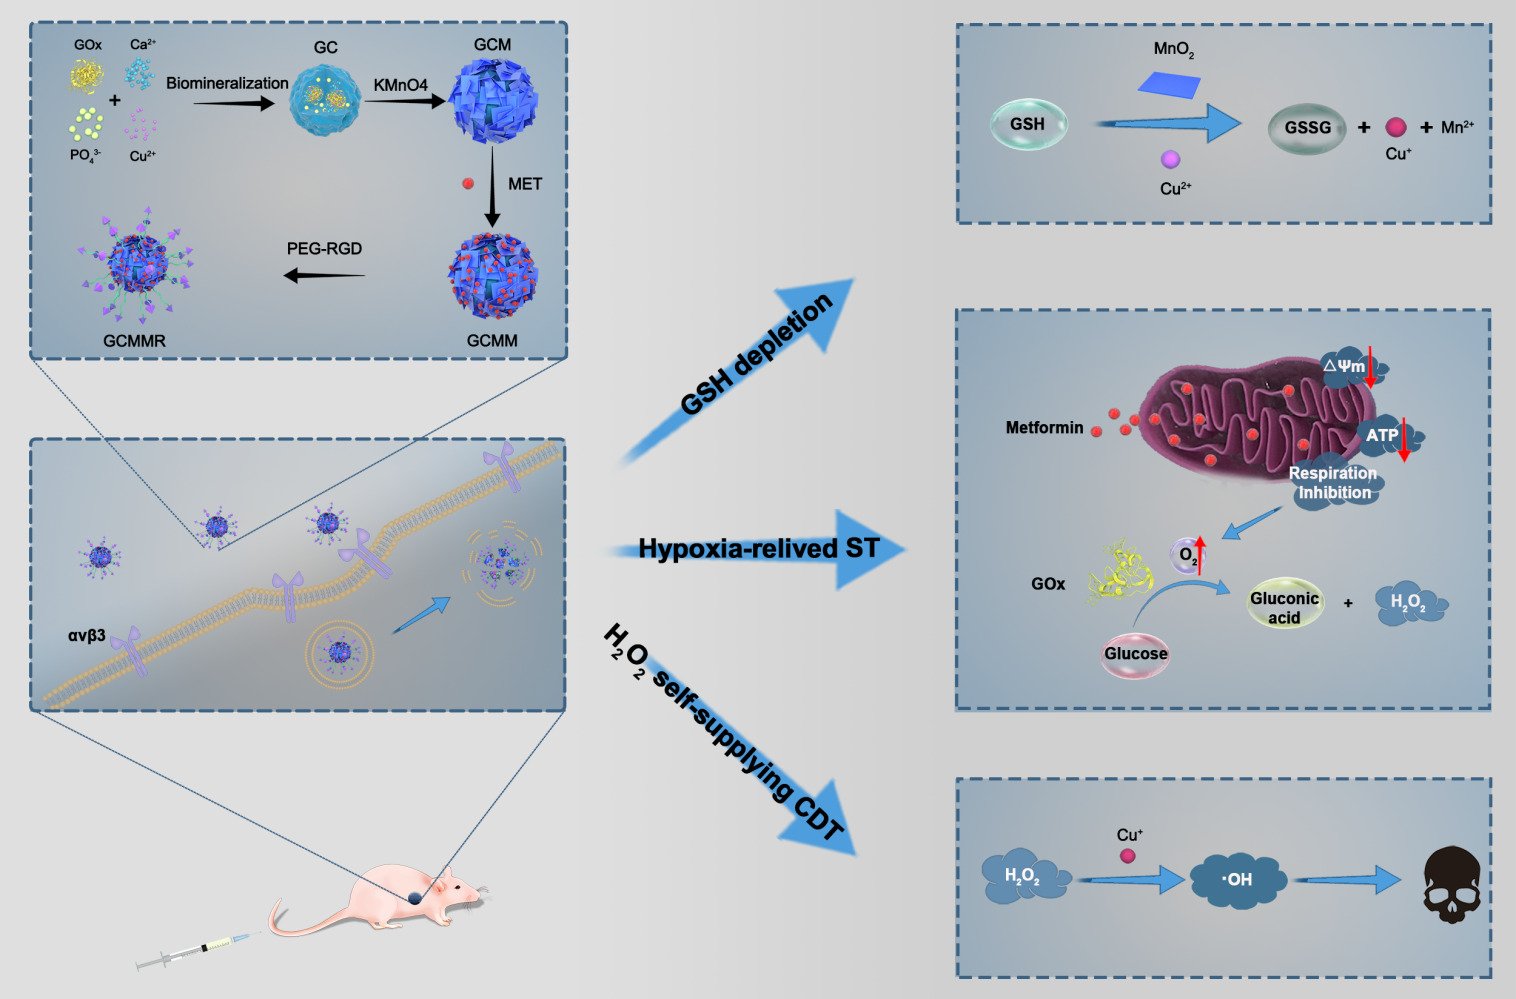
Graphical Abstract:
Introduction
Among numerous reactive oxygen species (ROS)-based anticancer strategies, chemodynamic therapy (CDT) is attracting particular attention.1,2 This nanocatalytic modality selectively converts endogenous hydrogen peroxide (H2O2) in tumor microenvironment (TME) to cytotoxic hydroxyl radicals (•OH) through Fenton-type reaction thus avoiding damage to normal tissues.3 However, the relative insufficiency of H2O2 and overexpressed intracellular glutathione (GSH) in TME restrict the anticancer effect of CDT.4–6 Glucose oxidase (GOx), as a natural catalyst, can convert glucose into gluconic acid and generate H2O2 within tumor cells.7,8 Thus, GOx was recently explored to be co-delivered with Fenton/Fenton-like agents to realize cascade catalysis.9–11 Moreover, the glucose-consuming feature of GOx can perturb energy metabolism in tumor cells, fulfilling synergistic starvation therapy (ST).12 Nevertheless, this GOx-mediated catalytic process is O2-reliant and would be limited by hypoxic microenvironment in solid tumors.13 In this regard, to improve the cascade catalytic effect of starving-chmodynamic therapy, this hypoxia-associated obstacle must be conquered.
Previous studies showed the hypoxia of tumor cells was mainly due to the over-consumption of oxygen during the oxidative phosphorylation in mitochondria, along with which adenosine triphosphate (ATP) was produced.14,15 Thus, interfering with the process of mitochondria-associated oxidative phosphorylation could lead to inhibition of O2 consumption and ATP production. Metformin (MET), a first-line oral drug for type 2 diabetes, has recently gained growing attention for its anti-tumor property.16 It is reported that MET showed potent inhibition of mitochondrial function by interfering with complex I (NADH dehydrogenase) in electron transport chain (ETC), which acts as a fundamental part in the oxidative phosphorylation.17 Hence, the introduction of MET could enhance the starving-chemodynamic therapy via boosting the cascade catalytic effect of GOx and Fenton agent. In this strategy, MET could alleviate intratumoral hypoxia to strengthen the GOx-induced starving therapy, during which abundant H2O2 was produced for CDT. Meanwhile, the dual blocking of intracellular energy supply by GOx and MET could remove the tumoral self-repairing capabilities against CDT-mediated oxidative stress damage. Nevertheless, loading a large size biocatalyst like GOx (6.0nm × 5.2nm × 7.7nm)18 by conjugation or adsorption is low-efficient and may result in inactivation as well as leakage. More importantly, the excess glutathione empowers tumor cells with elevated ROS scavenging ability,6 which might compromise the CDT-induced antitumor effect. Therefore, we intend to develop a smart nanosystem with GSH-depletion ability to achieve targeted co-delivery of GOx, MET and Fenton agent while protecting the cargos from leakage or inactivation.
Biomineralization is a natural process during which inorganic substances take organics as core for deposition.19 Due to its excellent performance in protecting the bioactivity of enzymes and pH-responsive drug release characteristic,20 biomineralization has recently inspired a series of biomimetic synthesis strategies to form GOx-loaded nanoparticles (NPs) for synergistic ST and CDT.9,11,21 For instance, in suit mineralization was performed to synthesize GOx/copper-doped calcium phosphate (CaP).21 Once at the tumor site, the decomposition of CaP will be triggered by the acidic microenvironment to release GOx and Cu2+, following which GSH was consumed and •OH was generated during the two-way conversion between Cu2+ and Cu+. However, the aggravation of hypoxia by the O2 consumption during GOx-induced catalysis yields a heavy constraint on H2O2 production and glucose depletion.22 Even worse, those bare GOx-mediated mineralized cores (GMCs) with no targeting system lacked the capability to specifically aggregate within tumor cells, which made the unsealed delivery systems potential risks to normal tissues. To deal with the aforementioned shortcomings and increase the drug-loading efficiency, it is desirable to construct a shell with large surface-to-volume ratio outside the GMC. Manganese dioxide (MnO2) nanosheets are emerging biofriendly 2D nanomaterials23 with good adsorption, excellent biocompatibility and redox activity, which have recently been developed as TME-responsive vector.24,25 Of note, MnO2 could confront intratumoral anti-oxidant by promoting the GSH oxidation, thus removing the intracellular resistance to CDT-mediated oxidative stress.26 Moreover, the adsorbable and modifiable surface of MnO2 nanosheets (MNSs) makes it possible for further functionalization. In view of the above findings, we hypothesized that, with rational designs, GMC NPs coated by MET-loaded MNSs could accomplish targeted delivery and improved cascade catalysis for effective starving-chemodynamic therapy.
Herein, for the first time, we successfully synthesized a multifunctional core-shell nanoplatform composed of GOx/Cu2+ encapsulated mineralized core and MET-loaded MnO2 nanosheets shell, which can simultaneously achieve targeted delivery, hypoxia relief, GSH elimination and H2O2 supply for synergistically enhanced ST/CDT. As shown in Scheme 1A, GOx-CuCaP (GC) NPs were firstly prepared according to previous description with mild modification. Subsequently, the formation of MNSs shell was constructed on the outer surface of GC NPs, followed by the loading of MET. Finally, the NPs were further coated with arginine-glycine-aspartate (RGD) peptide functionalized poly (ethylene glycol) (PEG) for improved targeting ability and aqueous solubility. RGD peptide has been reported to interact with αvβ3 and αvβ5 integrin receptors, which are diffusely expressed in various kinds of cancer cells, including the OS cells we selected in the present study.27,28 The obtained GOx-CuCaP@MNSs-MET@PEG-RGD nanoparticle was abbreviated as GCMMR. As illustrated in Scheme 1B, once the GCMMR NPs were endocytosed by cancer cells through the RGD-mediated targeting affinity, the outer PEG was destroyed in the acidic TME, following which MNSs converted GSH into glutathione disulfide (GSSG) and released MET to alleviate the hypoxia of TME as well as interfere with energy supply by inhibiting mitochondria-mediated respiration. Afterwards, the degradation of GOx-mediated mineralized core was triggered by the glucose-containing and low-pH TME, releasing GOx and Cu2+. The remaining intracellular antioxidant was further depleted during the conversion of Cu2+ to Cu+ and the GOx-mediated glucose deprivation provided abundant H2O2 for Cu+-induced Fenton-like reaction. Consequently, substantial amount of hydroxyl radicals provoked severe oxidative stress, which exerted irreversible damage and cause apoptosis. Overall, this work provided a cascade-enhanced nanocatalytic strategy against hypoxic tumor by integrating respiration inhibition, GSH depletion and targeted delivery for effective starving-chemodynamic therapy.
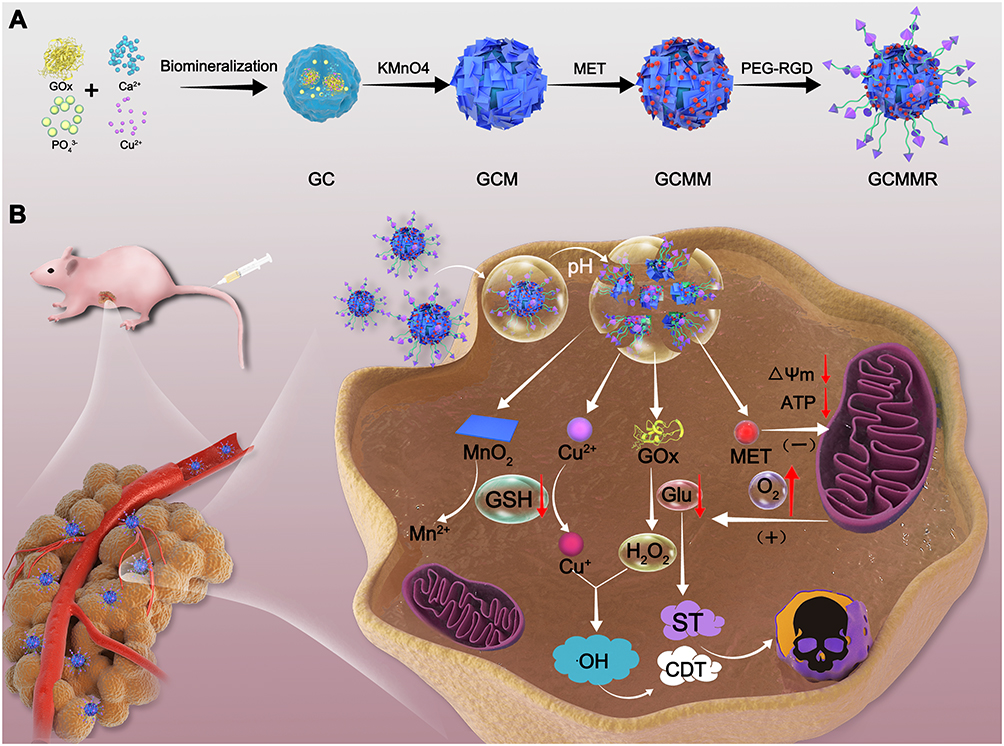 |
Scheme 1 (A) Schematic illustration of the preparation of GCMMR NPs. (B) Application of GCMMR in the cascade-enhanced starving-chemodynamic therapy. |
Materials and Methods
Materials
1-ethyl-3-(3’-dimethylaminopropyl) carbodiimide (EDC), N-hydroxysuccinimide (NHS), Glucose oxidase (GOx) from Aspergillus niger were purchased from Sigma-Aldrich (St. Louis, MO, USA). Poly (ethylene glycol) (SH-PEG-COOH, Mw = 2000) was purchased from JenKem Technology Co., Ltd (Beijing, China). RGD peptide (Arg-Gly-Asp, purity > 97%) was obtained from GL Bio-Chem Co., Ltd (Shanghai, China). Calcium chloride (CaCl2), copper chloride (CuCl2), L-ascorbic acid (AA), Methylene blue (MB), and Metformin hydrochloride (MET) were purchased from Macklin Biochemical Co., Ltd (Shanghai, China). All other reagents and chemicals were commercially purchased at highest grade available and used as received.
Synthesis of GOx-CuCaP (GC)
The GC NPs were prepared according to a previous study with slight changes.20 In brief, 16 mg of GOx and 20 μL of CuCl2 (0.1 mol/L) were dissolved in 2 mL glucose-free DMEM and incubated at 37°C for 8 h. Subsequently, 20 μL of CaCl2 (1 mol/L) was added for further 24 h of incubation. Afterwards, the obtained GC NPs were collected by centrifugation (13,000 rpm, 20 min), washed with ultra-pure water for three times and then freeze-dried for further use. Meanwhile, the calcium phosphate (CaP) NPs (blank control) were prepared under the same conditions without adding GOx.
Synthesis of GOx-CuCaP@MnO2 (GCM)
The above GC NPs were redispersed with 5 mL of ultra-pure water and incubated with 5 mL of KMnO4 (4 mol/L) under ultrasonic bath for 24 h. Thereafter, the GCM NPs were collected and washed by centrifugation (8000 rpm, 10 min) with ultra-pure water for several times.
Synthesis of GOx-CuCaP@MnO2-MET@PEG-RGD(GCMMR)
For loading of metformin, 10 mg GCM was dispersed in 10 mL deionized water and stirred evenly, after which 10 mg MET (in 10 mL PBS) was added into the solution and then stirred for 12 h at room temperature. The GCMM NPs were acquired by centrifugation (8000 rpm, 10 min) and then repeatedly washed via deionized water. The obtained GCMM NPs were resuspended in 5 mL of ultra-pure water for further use and the supernatant was collected for measurement of loading efficacy via UV-vis spectrum.
For the synthesis of GCMMR NPs, RGD-conjugated poly (ethylene glycol) (RGD-PEG) was firstly prepared via a classic amide condensation reaction.29 Briefly, EDC (5 mg), NHS (3 mg) and SH-PEG-COOH (20 mg) was mixed in 1 mL of DMSO and magnetic stirred for 6 h. Afterwards, RGD molecules were added (1.6: 1 molar ratio of RGD: SH-PEG-COOH), stirred for further 24 h at room temperature and purified by a dialysis bag (molecular weight cutoff at 3500) for further use. Subsequently, the obtained SH-PEG-RGD solution was mixed with GCMM (5 mL, 2 mg/mL) solution, stirred for 12 h, centrifugated (10,000 rpm, 30 min), washed with ultra-pure water and finally freeze-dried for later use. Meanwhile, the control group of GCMR NPs were prepared without the loading of MET while keeping the other conditions consistent.
Characterizations
Transmission electron microscopy (TEM) images were acquired by a Hitachi HT7800 electron microscopy operating at 120.0 kV. Size distribution and zeta potential were evaluated by a Malvern Zetasizer Nano ZS90 equipment. Thermogravimetric analysis was performed on a STA 449C simultaneous thermal analyzer (Netzsch, Germany). X-ray powder diffraction (XRD) patterns were recorded on a D8 Advance diffractometer (Bruker, Germany). Fourier transform infrared (FTIR) spectra were collected on a Thermo Nicolet iS50 FTIR spectrometer. The X-ray photoelectronic spectroscopy (XPS) analysis was performed using a Thermo Scientific K-Alpha spectrophotometer. The contents of released Cu and Mn elements were measured by an inductively coupled plasma instrument (ICP-OES, PerkinElmer Optima 5300 DV). UV-vis absorption spectra were recorded by a spectrophotometer (UV-3600, Shimadzu, Japan). Electron spin resonance (ESR) spectra were performed by an EMXplus spectrometer (Bruker, Germany). The fluorescence experiments were performed with a Hitachi F-7000 fluorescence apparatus at room temperature.
In vitro Degradation
1mL of GCMR (2 mg/mL) was placed in dialysis bags (MWCO = 3500) and dialyzed against PBS at different pH values (7.4 and 5.0) in the presence or absence of GSH. The incubating system was placed at 37°C under constant shaking. At certain time points, 1 mL of the outer media was extracted for measurement of the concentrations of copper and manganese ions via ICP analysis and the curves were plotted according to the cumulative released ions.
Catalytic Ability
Glucose Catalysis Activity
To detect the catalytic ability against glucose, the NPs (10 μg/mL) were immersed in various concentrations of glucose solutions (0–1000 μg/mL) at room temperature. At pre-determined time points, the solutions were collected and analyzed by a H2O2 assay kit (Grace Bio-Labs) and a pH meter (SX 620 pH tester) for measurement of the H2O2 concentrations and pH values, respectively.
Hydroxyl Radical Generation Activity
For detection of •OH generation by MB degradation analysis, GCMR NPs (50 μL, 2 mg/mL) were mixed with PBS containing various concentrations of GSH (0, 2, 4, 6, 8, 12, 16 mmol/L) with a total volume of 800 μL. After incubation with constant shaking at 37°C in the dark for 1 h, glucose (100 μL, 4 mg/mL) and MB (100 μL, 100 μg/mL) were added into the system and then incubated at 37°C for 5 h. Finally, the remaining MB in the supernatant was measured by UV-vis spectrophotometer (UV-3600, Shimadzu, Japan) at 664nm. For detection of •OH generation by fluorescence experiments, the hydroxyphenyl fluorescein (HPF) were employed as the fluorescent probe and added into the above systems with a final concentration of 10μM. After 1 h of incubation, the solutions were photoexcited at 490 nm and the fluorescence intensity was recorded.
In vitro Drug Release
To evaluate the drug release behavior, 2 mg amount of GCMMR was added into 2 mL of phosphate buffer solution at different pH values (7.4 and 5.0) in the presence or absence of GSH (10mM) and incubated at 37°C in a shaking bath. At certain time points, 1 mL of the supernatant was collected by centrifugation. The amount of released MET was detected by the UV-vis absorption at 232 nm of the supernatant and the cumulative release curves were plotted accordingly.
Cellular Experiments
Cell Culture
The human osteosarcoma cell line (MNNG/HOS) and human bone marrow stromal cells (hBMSCs) were obtained from Cell Band of Shanghai Institute of Biochemistry and Cell Biology, Chinese Academy of Sciences. The MNNG/HOS cells were cultured with Dulbecco’s Modified Eagle medium (DMEM) containing 10% fetal bovine serum (FBS) and 1% antibiotics (penicillin-streptomycin). The hBMSCs were cultured with DMEM/F12 containing 15% FBS and 1% penicillin-streptomycin. All the above cells were cultured at 37°C under an atmosphere of 5% CO2.
Cellular Uptake
MNNG/HOS cells were seeded into 6-well plates at a density of 1×10⁵ cells per well and incubated for 24 h. Subsequently, the cells were incubated with ICG@GCM and ICG@GCMR NPs (at equivalent 15 μg mL−1) for 6 h. For competitive assay, cells were pretreated with free RGD (2 mg mL−1) for 2 h and then co-cultured with ICG@GCMR NPs for another 6 h. The cells were washed with PBS for three times and then stained with Hoechst 33342 for 10 min. After being washed with PBS for another three times, the cells were observed by a fluorescence microscope (Olympus Corporation, Tokyo, Japan).
Cell Viability Assay
Cell viability was quantified by Cell counting kit-8 (CCK-8) assay and the data represents the mean value of three parallel measurements. Briefly, cells were seeded into 96 well plates at a density of 5000 cells per well and incubated for 24 h. After that, the media were replaced with fresh medium that containing correspondingly various concentrations of glucose (0, 200, 400, 600, 800 μg/mL), AA (0, 50, 100 μg/mL), and NPs (0, 0.3125, 0.625, 1.25, 2.5, 5 μg/mL). After incubation for another 24 h, the supernatant was discarded. The cells were washed twice with PBS and then co-cultured with 100μL fresh medium containing 10% CCK-8 solution for 24 h in dark. Finally, the absorbance of supernatant at 450 nm was measured by a microplate reader (Biotek, Winooski, VT, USA).
Cellular ROS Observation
2’,7’-dichlorodihydrofluorescein diacetate (DCFH-DA) was employed as a fluorescent probe for detecting the ROS generated within MNNG/HOS cells. In brief, cells were seeded in a 6-well plate (5 × 10⁴ cells per a well) and cultured for 24 h. Subsequently, the media were replaced with fresh medium containing various agents (PBS, GOx, GC and GCMR) for further 6 h incubation. After that, the cells were rinsed and stained by DCFH-DA (10 μmol/L) under 37°C for 30 min. Finally, the cells were washed with PBS and then observed by a fluorescence microscopy.
Cellular GSH Detection
The intracellular GSH concentration was detected by a GSH/GSSG Assay Kit (Beyotime Biotechnology, China). Briefly, after corresponding treatments, MNNG/HOS cells were collected, resuspended in protein removal buffer and then lysed through freeze-thaw cycles. Cells treated with PBS were used as the negative control. After centrifugation (10,000 rpm, 10 min), the obtained supernatant was measured and the intracellular ratio of GSH to GSSG was calculated according to the manufacturer’s protocol.
Mitochondrial Function and Hypoxic Condition
MNNG/HOS cells were seeded in 6-well plates at a density of 1×10⁵ and cultured for 24 h. Then, the medium was withdrawn and fresh medium containing corresponding formulations (PBS, MET, GCMR, GCMMR) were added for another 6 h of incubation. For Mitochondrial membrane potential (MMP) analysis, the cells were stained by 5,5′,6,6′-tetrachloro-1,1′,3,3′-tetraethylbenzimidazolocarbocyanine iodide (JC-1) (5 μg/mL) for 20 min and then washed with PBS for three times. Subsequently, the cells were observed under a fluorescence microscopy. For detection of the activity of mitochondrial complex I in MNNG/HOS cells, Complex I Activity Assay Kit (Cayman Chemical, Michigan, USA) was employed and all assays were carried out at 25°C. Briefly, 50 μL of the contents of tube A and 20 μL of vehicle diluted in Assay buffer were added into each well. Afterward, 30 μL of the contents of tube B was quickly added into the system and the absorbance at 340 nm was measured. The Complex I Activity (%) was then calculated according to the manufacturer’s instructions. For cellular adenosine triphosphate (ATP) detection, the cells were collected, lysed and centrifugated for 5 min (4°C, 12,000 rpm). The supernatant of the samples was harvested and ATP concentration was determined according to the standard curve from the manufacturer’s protocol (Beyotime Biotechnology, China). The hypoxic and normoxic conditions were established according to a previous reported method.20 Briefly, MNNG/HOS cells were firstly seeded in cell culture dishes and incubated for 24 h. Subsequently, the cells were incubated under a normoxic (an atmosphere of 21% O2) or hypoxic (1% O2) condition with 5% CO2 at 37°C for 12 h.
Live and Dead Staining and Apoptosis Evaluation
MNNG/HOS cells were seeded into 6-well plates at a density of 1×10⁵ cells per well and incubated 24 h for adherence. After corresponding treatments for another 24 h, the cells were replaced with fresh medium. For living/dead staining, Calcein-AM (2μM) and propidium iodide (PI) (2μM) were added. After 15 min incubation, cells were washed twice with PBS and observed by a fluorescence microscopy. For cell apoptosis evaluation, cells were co-stained with Annexin V-fluorescein isothiocyanate (FITC)/PI and assessed by flow cytometry (Becton Dickinson, Franklin Lakes, New Jersey, USA).
Hemolysis Assay
Red blood cells (RBCs) were isolated from 1mL anticoagulated whole blood samples by centrifugation (4°C, 8000 rpm, 5 min), washed three times and diluted with 2mL PBS. Afterward, 0.3 mL RBC diluted suspensions was mixed with 1.2 mL of ultrapure water as positive control, PBS as negative control and different concentrations of GCMMR NPs (5–200 μg/mL), respectively. All of the mixtures were incubated in a shaker table at 37°C for 2 h and then centrifuged for 5 min (4°C, 8000 rpm). The absorbance at 541 nm of the supernatant was subsequently measured by a UV-vis spectrophotometer and hemolysis percentage was finally calculated according to the following equation: Hemolysis percentage = (A sample – A (-)) / (A (+) – A (-)) × 100%. A sample, A (+), and A (-) represent the absorbance of the sample, negative control and positive control, respectively.
In vivo Experiments
Tumor Models
Female athymic BALB/c nude mice aged 4–5 weeks were purchased from Beijing HFK bioscience Co. Ltd. All animal experiments were conducted according to protocols approved by the Experimental Animal Ethics Committee of HeBei Ex&Invivo Biotechnology Co. Ltd (SYXK:2019-008, SY2020-01). For the establishment of subcutaneous xenograft models, MNNG/HOS cells (1 × 10⁻⁷) suspended in 150 μL cold PBS were subcutaneously injected into the right flank of 5–6 weeks nude mice. The length and width represented the longest and shortest dimension of the tumor, respectively. The volume of tumor was calculated by the following formula: Tumor volume = 0.5 × length × (width)2. When tumors reached around 100 mm3, the mice were used for in vivo therapy experiments.
In vivo Fluorescence Imaging and Biodistribution
MNNG/HOS tumor-bearing nude mice (n=3) were intravenously injected with 200 μL of ICG labeled GCMMR NPs (ICG@GCMR 2 mg/mL). At appointed time points (0, 2, 4, 8, 12, 24h) post injection, the mice were anesthetized and imaged by a small animal in vivo imaging system (IVIS, PerkinElmer Inc, Waltham, USA).
In vivo Antitumor Effect and Biosafety
The tumor-bearing mice were randomly divided into 6 groups (n=5/group: (1) control, (2) MET, (3) GOx, (4) GC, (5) GCMR and (6) GCMMR) when the tumor sizes reached about 100 mm3. All mice received four times of intravenous injection at day 0, 3, 6, and 10 with corresponding agents (PBS (pH = 7.4) for control group). The doses of GOx, Cu2+, MnO2, and MET at each injection were 2, 0.1, 1.48, and 0.61 mg kg−1, respectively. The weight of mice and volume of tumor were recorded every two days. At 14 days post treatment, the mice were sacrificed to collect the tumors and main organs (heart, liver, lung, spleen, kidney). After being weighed and photographed, the tumor tissues were soaked in 10% formalin solution for further examination of hematoxylin and eosin (H&E) staining, proliferation marker protein Ki-67 and terminal deoxynucleotidyl transferase-mediated dUTP nick end labeling (TUNEL) assay. The organ tissues were extracted for H&E staining assay and blood samples for hematology analysis.
Statistical Analysis
The quantitative data were presented as mean ± standard deviation (SD) and all of the experiments were performed three times. Student’s t-test, one-way and two-way analysis of variance (ANOVA) were applied to test the statistical significance. P < 0.05 was considered as statistically significant (* P<0.05, ** P<0.01, *** P<0.001, **** P<0.0001).
Results and Discussion
Preparation and Characterization
The preparation process of the NPs was illustrated in Scheme 1A, wherein the GOx entrapped core, GOx-CuCaP (GC) NPs were firstly fabricated GOx-CuCaP (GC) NPs were firstly fabricated according to a previously reported method with slight modifications.20 Briefly, GOx was incubated in glucose-free, calcium and copper containing Dulbecco’s modified Eagle medium (DMEM) at 37°C. The negatively charged GOx in neutral solution30 absorbed cationic Ca2+ and Cu2+ ions to concentrate and increase the local supersaturation level,31 which acts as the nucleation sites for in suit mineralization of copper-doped calcium phosphate (CuCaP).32 Subsequently, with the participation of anionic phosphate, copper-doped calcium phosphate nucleation spontaneously generates crystals round GOx and gradually assemble to form the GOx entrapped structured spherical aggregates which are the mineralized core denoted as GOx-CuCaP.33 Afterward, a MnO2 nanosheets layer was formed on the surface of GC NPs by potassium permanganate (KMnO4) decomposition method34 to obtain GOx-CuCaP@MnO2 (GCM) NPs. With dynamic light scattering (DLS) evaluating the hydrodynamic sizes and polydispersity index (PDI) values of GCM NPs at various mass ratios (Table S1), the optimal mass ratio of GC: KMnO4 was determined to be 1:0.8. Therefore, the formulation ratio of therapeutic agent was calculated to be m(GOx): m(Cu2+): m(MnO2) = 20:1:14.8. Subsequently, MET was loaded onto GCM NPs to obtain GOx-CuCaP@MnO2-MET (GCMM), in which the formulation ratio of therapeutic agent was m(GOx):m(Cu2+):m(MnO2):m(MET)= 20:1:14.8:6.1 (according to the drug loading efficiency described later). Finally, RGD-modified PEG was functionalized on the outer surface of GCMM NPs to get GOx-CuCaP@MnO2-MET@PEG-RGD (GCMMR) NPs.
According to the TEM images, the GOx-mediated mineralized cores displayed spherical structure (Figure 1A), of which the average size detected by TEM was around 97.1 nm. As shown in Figure 1B, the outer shell composed of MnO2 lamellas revealed an irregular morphology, which was probably due to the rough surface of the GC NPs. After coated by PEG-RGD, a more compact core-shell structure was observed, providing GCMMR potential for biomedical applications (Figure 1C). The TEM mapping (Figure 1D) further confirmed the core-shell structure of the GCMMR NPs, which showed the main elemental compositions of the mineralized core (Cu, Ca, P), MnO2 shell (Mn) and encapsulated GOx/MET (N). In addition, the XPS analysis of GCMMR NPs revealed evident copper, manganese, carbon, oxygen and nitrogen signals (Figure S1), where the characteristic peaks of Mn 2p3/2 and Mn 2P1/2 at around 641.5 eV and 653.2 eV indicating +4 valence of Mn provided further evidence for the successful formation of MnO2 coating.35 Meanwhile, The high-resolution spectrum of Cu 2p indicated that the Cu existed primarily in the form of Cu2+ (2p3/2 at 934.3 eV and 2p1/2 at 954.1 eV) with shakeup satellite peaks (Figure S1C),36 thus providing great potential for GSH depletion via redox reaction and for subsequent chemodynamic therapy via Fenton-like reaction.37 According to the XRD analysis (Figure 1E), both GC and GCM were in an amorphous state, which is favorable for the triggered degradation of the nanocarrier and the on-demand release of the therapeutic agents. The thermogravimetric analysis revealed that the water content was 12.23%, the inorganic component was 63.37% and the total organic content in the GCMMR NPs was around 20.4% (Figure S2).
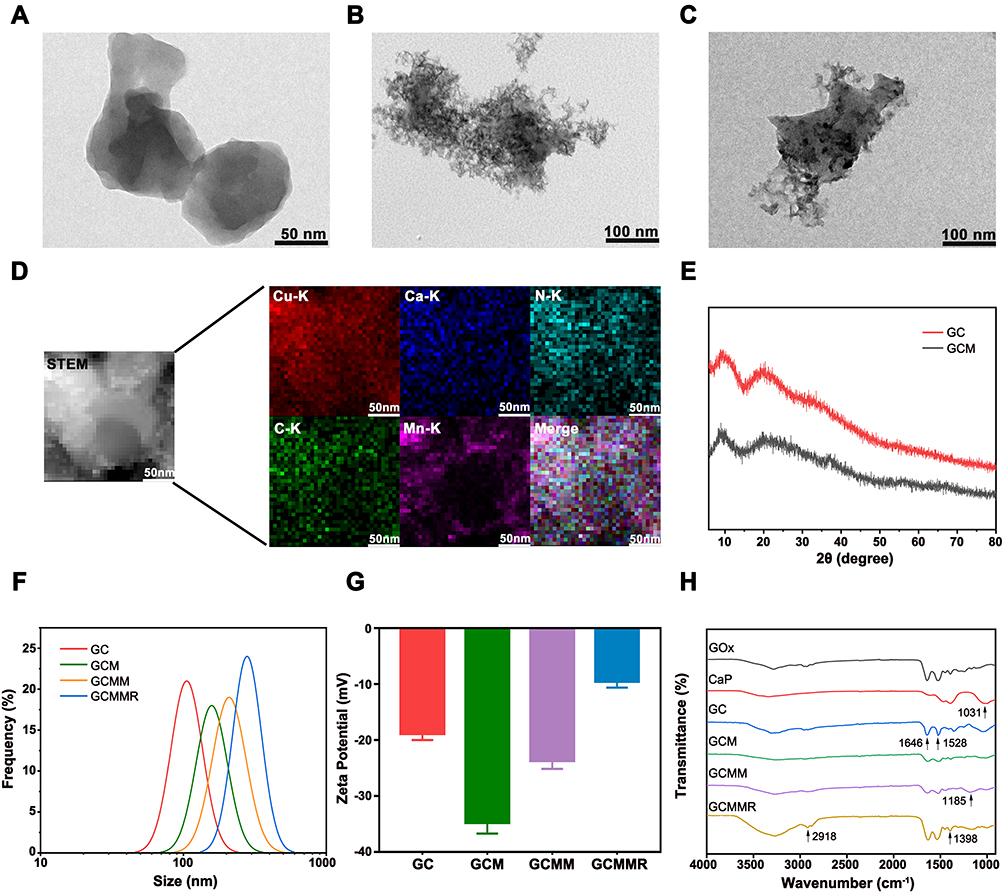 |
Figure 1 Characterization of the prepared nanoparticles. Representative TEM images of GC (A), GCM (B) and GCMMR (C). (D) Elemental mapping of the GCMMR NPs. (E) XRD pattern of GC and GCM NPs. The DLS size (F) and Zeta potential (G) of GC, GCM, GCMM, and GCMMR NPs. (H) FT-IR spectra of GOx, CaP, GC, GCM, GCMM and GCMMR. |
As displayed in Figure 1F, the hydrated diameters of GC, GCM, GCMM and GCMMR were about 115.7, 173.9, 233.7 and 303.3 nm, respectively. Compared with the results obtained from TEM images, the larger sizes measured by DLS might be ascribed to the hydration of NPs in water.38 Remarkably, inconspicuous changes were found in the hydrodynamic diameters of the GCMMR NPs during the 7 days incubation in different mediums (Figure S3), indicating excellent colloidal stability. Due to the incorporation of the PEG-RGD ligands, the GCMMR NPs could be well dispersed in H2O, DMEM culture medium with FBS as well as DMEM culture medium without FBS and maintain no obvious precipitation after one-week store. The good dispersity and stability in physiological solution described above possessed the as-prepared GCMMR NPs great potential for further use in blood circulation.
As shown in Figure 1G, the changes of zeta potentials confirmed the stepwise preparation and modification of the samples. Furthermore, the procedures of synthesis and drug loading were also validated by FTIR spectroscopy. As revealed in Figure 1H, the peak at 1031 cm−1 represents the P-O vibration of PO43- of the calcium phosphate (CaP), which can also be identified on the afterwards samples. After GOx mediated-mineralization, the obtained GC NPs demonstrated characteristic peak of GOx at 1646cm−1 (C=O vibration), confirming the successfully synthesis of protein-mineral composites. The loading of MET caused the emergence of a stretching peak at 1185 cm−1, which is attributed to the -C-N stretching vibrations.39 Subsequently, the characteristic peaks of amide I and amide II were clearly shown after the incorporation of PEG-RGD. Meanwhile, the peaks appeared at 2918 cm−1 and 1398 cm−1 were assigned to the -CH2- stretching of the PEG and -CH2C=O groups of the RGD peptide, respectively.40 Taken the above results all together, we concluded that the GCMMR NPs were successfully synthesized.
In vitro pH/GSH-Responsive Degradation
Since the MnO2 shell and Cu2+/GOx encapsulated core are both sensitive to the pH value and GSH level,21,41 we first evaluated the pH- and GSH-responsive degradation by immersing GCMR in biomimetic PBS solutions under different pH values (7.4 and 5.0) with or without GSH added. As shown in Figure 2A and B, the release of Mn and Cu ions that respectively represents the degradation of outer shell and inner core remained low (18.19% and 8.35%) after 48 h under the normal pH of 7.4. By contrast, the released amount of Mn and Cu ions increased up to 41.02% and 21.19% within the same incubation time at the tumor-lysosome-resembling pH of 5.0. Notably, the degradation of GCMR dramatically accelerated with the addition of GSH, while the acidic condition further enhanced the process, reaching 72.19% for Mn and 46.99% for Cu within 12 h. Collectively, those above findings confirmed the pH- and GSH-responsive behavior of GCMR, suggesting excellent stability under physiological conditions and TME-sensitive characteristic, which provided potential for avoiding drug leakage and controlled release.
 |
Figure 2 Catalytic properties and release profiles of GCMMR NPs in vitro. (A and B) Mn and Cu release profiles from GCMR in PBS of different pH values with or without the addition of GSH (10mM). (C) Generation of H2O2 after 5 h incubation of GCMR (10 μg mL−1) and different concentrations of glucose. (D) Decrease of pH values after 5 h incubation of GCMR (10 μg mL−1) and different concentrations of glucose. (E) Enzyme activity variation of GCMR overtime at room temperature. (F) UV-vis spectra of MB after 5 h of incubation with GCMR (1 mg mL−1) in the presence of glucose (800 μg mL−1) and different concentrations of GSH. (G) ESR spectra of different reaction systems with DMPO as the spin trap. (H) UV-vis spectra of MET, GCMR and GCMMR. (I) UV-vis absorption of metformin with various concentrations. |
Extracellular Cascade Catalytic Activity
Glucose Depletion and pH Decrease
As illustrated in Scheme 1B, the cascade catalytic properties were mainly reflected in the sequential process of glucose depletion by GOx-mediated oxidation and •OH generation by Fenton-type reaction. Thus, the catalytic ability of GCMR against glucose was first examined. As revealed in Figure 2C and D, higher level of glucose induced more generation of H2O2 as well as obvious pH decrease within 5 h. Notably, the generation of H2O2 by GCMR is relatively low when the concentration of glucose is less than 200 μg/mL. However, when incubated with more glucose (> 400 μg/mL), the generation of H2O2 is dramatically increased, indicating that compared with bare GOx and mineralized core (GC), the enzyme activity of GCMR is negligibly affected. Furthermore, the catalytic reactivity could be well maintained (> 80%) after being stored at room temperature for 7 days (Figure 2E), indicating excellent protect of the enzyme activity by biomineralization, which is favorable for improving the efficacy of in vivo delivery. As is known, gluconic acid is generated along with the GOx-mediated glucose oxidation which leads to pH variation during the degradation of the NPs. According to Figure 2D, the acidification process mediated by gluconic acid results in pH decrease from 7.4 to 4.14 within 5 h under high glucose condition (1000 μg/mL). This sustainable decrease of pH could in turn facilitate the corruption of the nanoparticle and accelerate the release of the therapeutic agents, thus making GCMR an excellent nanocarrier for controlled release and glucose depletion.
GSH Depletion and •OH Generation
Given the fact that the as-prepared GCMR can facilitate the glucose oxidation with high efficacy and generate abundant H2O2 to react with Fenton-like agents for subsequent CDT. We next evaluate the GCMR-mediated GSH depletion and •OH generation in the presence of glucose. Methylene blue (MB) was employed as an indicator since it can be depleted by the existing •OH
showing the variation of maximum absorbance at 664nm. According to Figure 1F and Figure S4A, no significant changes of the absorbance can be observed without either glucose or GSH, suggesting that glucose and GSH are both indispensable for the generation of •OH, which two are essential for the generation of H2O2 and Cu+ Fenton agent, respectively. Under the condition of glucose and GSH, MB showed concentration-dependent degradation within 5 h (Figure S4B). Of note, with abundant glucose, the absorbance of MB showed no obvious decrease until the concentration of GSH reached 4 mmol/L, suggesting that low level of GSH (<2 mmol/L) are insufficient for effective generation of •OH. This could be explained by the stepwise GSH-depletion by the outer surface and inner core of GCMR. GSH was partly consumed by the MnO2 shell first and then further depleted by the Cu2+ encapsulated core, during which the key Fenton-like agent Cu+ was generated. It’s also notable that the concentration-dependent variation of MB absorbance shifted from decrease to increase when GSH reached 16 mmol/L, which was attributed to the •OH scavenging ability of extra GSH.37
The hydroxyphenyl fluorescein (HPF), which is nonfluorescent in original form and emits strong fluorescence in reaction with OH radical, was used to confirm the generation of OH radical.42,43 As shown in Figure S5A, the fluorescence of HPF was remarkably enhanced when the concentration of GSH was 12 mmol/L, while the fluorescence was subsequently attenuated under the condition of 16 mmol/L GSH. This GSH-related variation of fluorescence validated the as-described MB degradation analysis. To further verify the formation of OH radical, thiourea was employed as a selective scavenger of •OH to quench the fluorogenic reaction.44 As displayed in Figure S5B, a negative linear association with thiourea concentration was found for the fluorescence intensity of HPF, confirming the OH radical was responsible for the variation of fluorescence. Moreover, ESR spectra with 5,5-dimethyl-1-pyrroline-N-oxide (DMPO) as •OH trapping agent was performed to further corroborate the aforementioned findings. As revealed in Figure 2G, the typical 1:2:2:1 peak of intensity confirmed the generation of •OH in the reaction system coinstantaneous containing glucose, GSH and GCMR. Given the results above, the as-prepared GCMR possesses excellent cascade catalytic properties for starvation and chemodynamic therapy within tumor microenvironment, where higher GSH and glucose concentrations are expected to be utilized by GCMR to fulfill enhanced •OH generation.
Drug Loading and Release
Next, GCMR was tested as a drug delivery system for MET to confirm its ability against premature leakage and controlled release. As revealed in Figure 2H, the characteristic peak at 232 nm validated the successful loading of MET into GCMR. The standard curve (Figure S6) of MET was established based on the absorption spectra of MET at different concentrations (Figure 2I). According to the standard concentration curve, the loading efficiency of MET was calculated to be 17.24%. Subsequently, similar pH- and GSH-responsive release behavior of MET was confirmed by incubating GCMMR in PBS solutions of different pH values (Figure S7), indicating the as-prepared nanocomposite is promising for TME-triggered drug release and sustained treatment.
Cellular Uptake Study
Effective delivery of the therapeutic agents into tumors is of vital importance for nanoplatform-based treatment.45 The obtained RGD functionalized NPs are expected to possess enhanced internalization ability into the ανβ3 integrin-overexpressing OS cells. To validate the cellular uptake behavior of the NPs, MNNG/HOS cells were co-cultured with ICG-labeled NPs with or without RGD functionalization. After 6 h incubation, the uptake behavior was assessed according to the intracellular red fluorescence intensity of ICG by a fluorescence microscopy. As revealed in Figure 3A, the cells treated with ICG@GCMR NPs exhibited obviously stronger fluorescence signals in cytoplasm as compared to those treated with ICG@GCM NPs, indicating enhanced internalization mediated by RGD peptide. Nevertheless, the intracellular fluorescence intensity of MNNG/HOS cells with free RGD peptide pretreatment demonstrated remarkable decrease, further confirming the elevated uptake of GCMR NPs was through the preferable interaction of RGD peptide and ανβ3 integrin. Those above results demonstrated that our RGD-functionalized nanoplatform could fulfill effective internalization by MNNG/HOS cells, providing potential for delivery of therapeutic agents.
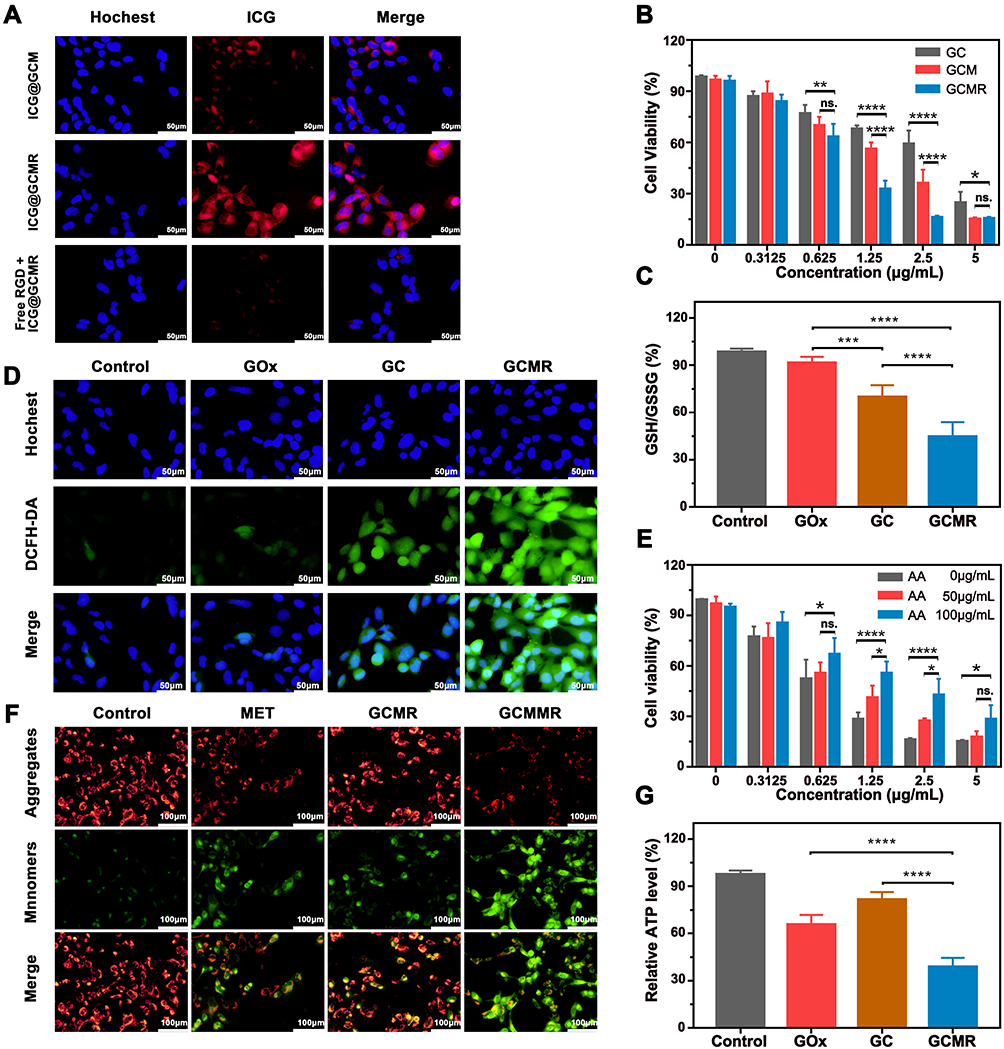 |
Figure 3 In vitro cellular assay. (A) Fluorescence images of MNNG/HOS cells after 6 h co-culture with ICG@GCM or ICG@GCMR NPs. (B) Cell viability of MNNG/HOS cells after incubation with GC, GCM or GCMR for 24 h in the presence of glucose (400 μg mL−1) (*P<0.05, **P<0.01, ****P<0.0001). (C) Quantification of the ratio of intracellular GSH to GSSG after incubation with NPs in 400 μg mL−1 glucose containing DMEM for 6 h (***P<0.001, ****P<0.0001). (D) Fluorescence images of MNNG/HOS cells after different treatments in 400 μg mL−1 of glucose-containing DMEM for 6 h. (E) Cell viability of MNNG/HOS cells after incubation with different concentrations of GCMR and AA for 24 h in the presence of glucose (400 μg mL−1) (*P<0.05, ****P<0.0001). (F) Variation of mitochondrial membrane potential after corresponding treatments. (G) Relative intracellular ATP level after different treatments (**** P<0.0001). |
Intracellular Cascade Catalysis Performance for ST/CDT
To investigate the cytotoxicity induced by cascade catalysis of glucose/GSH-depletion and •OH-generation activity, the MNNG/HOS cells were incubated with GC, GCM or GCMR in DMEM media that contained 0–800 μg/mL glucose. As CCK-8 results shown in Figure 3B and Figure S8A, either increasing the concentration of glucose or NPs could lead to a lower cell viability, suggesting the cytotoxicity of GC was dependent on glucose level as well as GC concentration. Since glucose is a fundamental nutrient for tumoral proliferation and growth, the GOx-induced glucose deprivation could damage intracellular energy supply so as to achieve starvation therapy. In addition, the generated H2O2 during glucose oxidation were subsequently converted to cytotoxic •OH via Fenton type reaction, causing oxidative stress and cell death. After coated by MnO2 nanosheets, the NPs showed increased suppression against cell viabilities (Figure 3B and Figure S8B), which is attributed to the enhanced GSH depletion ability mediated by MnO2. This has been revealed in Figure 3C, where the most significant oxidization of GSH into GSSG was spotted in MNNG/HOS cells when co-cultured with GCMR compared to GC NPs. Also, the functionalization of PEG-RGD possessed GCMR NPs with further improved cytotoxicity (Figure 3B and Figure S8C), which could be explained by the enhanced cellular uptake behavior. Furthermore, L-ascorbic acid (AA), a cellular protective agent against oxidative damage, was added into the co-culture media containing 400 μg/mL glucose and different concentrations of GCMR NPs for rescue experiments. As revealed in Figure 3E, the suppression against cell viabilities was gradually relieved by increasing the level of AA, indicating that the toxicity of GCMR NPs was induced by the •OH-mediated intracellular oxidative damage. In addition, the toxicity of the NPs to normal cells was investigated on human bone marrow stromal cells (hBMSCs). As expected, the NPs were not significantly toxic to normal cells, even at a concentration of 5 μg/mL (Figure S9). According to “Warburg effect”, the hypermetabolic tumor cells are more vulnerable to GOx-mediated glucose deprivation due to its inefficient energy supply pattern.46 Moreover, the higher GSH level and unstable redox state of cancer cells6 were utilized by the materials to initiate Fenton-type reaction, causing severe oxidative stress and irreversible damage.47 Thus, the as-prepared NPs exhibited a strong cell viability inhibition effect on cancer cells while showed a mild effect on non-cancerous cells.
Subsequently, to detect the intracellular oxidative stress caused by the •OH-mediated CDT, DCFH-DA was employed as a fluorescence probe for the measurement of ROS in cells. As presented in Figure 3D, no green fluorescence was observed in the control group. By contrast of the negligible fluorescence in the GOx group, the cells administered with GC NPs exhibited a visibly fluorescence, indicating the intracellular •OH generation via Cu+-mediated Fenton type reaction promoted by GOx-induced H2O2 supply and Cu2+-induced GSH depletion. Of note, the strongest fluorescence was observed in the GCMR group, suggesting enhanced •OH production which is attributed to the further depletion of GSH by outer MnO2, as mentioned above (Figure 3C). Taken together, we can conclude that GCMR could promote •OH generation within tumor cells by simultaneously achieving H2O2 supply, GSH depletion and uptake elevation for synergetic starving and chemodynamic therapy.
MET-Mediated Hypoxia Relief and Enhancement of ST/CDT
Metformin is reported to act on respiratory chain complex I to initiate potent inhibition of mitochondrial function, causing dual decrease of intracellular energy generation and oxygen consumption.17 Accordingly, we firstly explored the activity of complex I after various treatments using a mitochondrial complex I activity kit. As revealed in Figure S10, compared to the PBS and GCMR group, the activity of complex I in MET (61.67 ± 7.02%) and GCMMR (49 ± 6%) groups were significantly decreased, exhibiting the excellent respiratory inhibiting performance mediated by MET. Subsequently, the changes of mitochondrial membrane potential (ΔΨm) in MNNG/HOS cells after different treatments were detected by means of JC-1 assays. As shown in Figure 3F, compared to the normally polarized mitochondria (red aggregates) in control and GCMR groups, cells cultured with MET and GCMMR demonstrated huge amounts of mitochondria with abnormal depolarization (green monomer), further indicating the MET-induced inhibition on mitochondrial function. Meanwhile, the corresponding influence on mitochondria-mediated ATP production was monitored by using ATP determination kit. As revealed in Figure 3G, the most dramatic decrease of intracellular ATP concentration was detected in the GCMMR treated cells, suggesting excellent energy blocking effect.
In view of the MET-induced inhibition of mitochondria was based on the interference with respiratory activity, we then investigated if the introduction of MET could alleviate the intracellular hypoxia so as to further promote the GOx-mediated glucose consumption. The oxygen content of MNNG/HOS cells after various treatments under normoxic and hypoxic conditions were monitored according to a previous study.48 As displayed in Figure 4A, after 24 h of incubation, the oxygen content decreased from 9.0 ppm to 3.4 ppm in GCMR group. In contrast, the GCMMR group demonstrated relatively slow decline from 9.2 to 7.7 ppm. Consistently, same trend was detected under hypoxia condition (Figure 4B), confirming the hypoxia relief via MET-induced restriction on cell respiration and oxygen consumption. As mentioned above, the generation of cytotoxic •OH from Fenton type reaction was based on H2O2, which was produced from the oxygen dependent catalytic process by GOx. Hence, we continued to investigate if MET could further enhance intracellular CDT activity via alleviating hypoxia. As shown in Figure 4D, compared to the normoxic condition, the fluorescence signals in GCMR group under TME-mimic hypoxic condition were dramatically decreased. Extraordinarily, the fluorescence intensity in GCMMR group was mildly influenced by the hypoxic environment, indicating MET-mediated higher intracellular O2 content stability for abundant H2O2 generation and •OH conversion. Collectively, all these results above demonstrated that the introduction of MET could achieve dual enhancement of starvation therapy and chemodynamic therapy, proving the as-prepared GCMMR NPs is of great potential for cascade-enhanced therapeutic efficiency against hypoxic tumor.
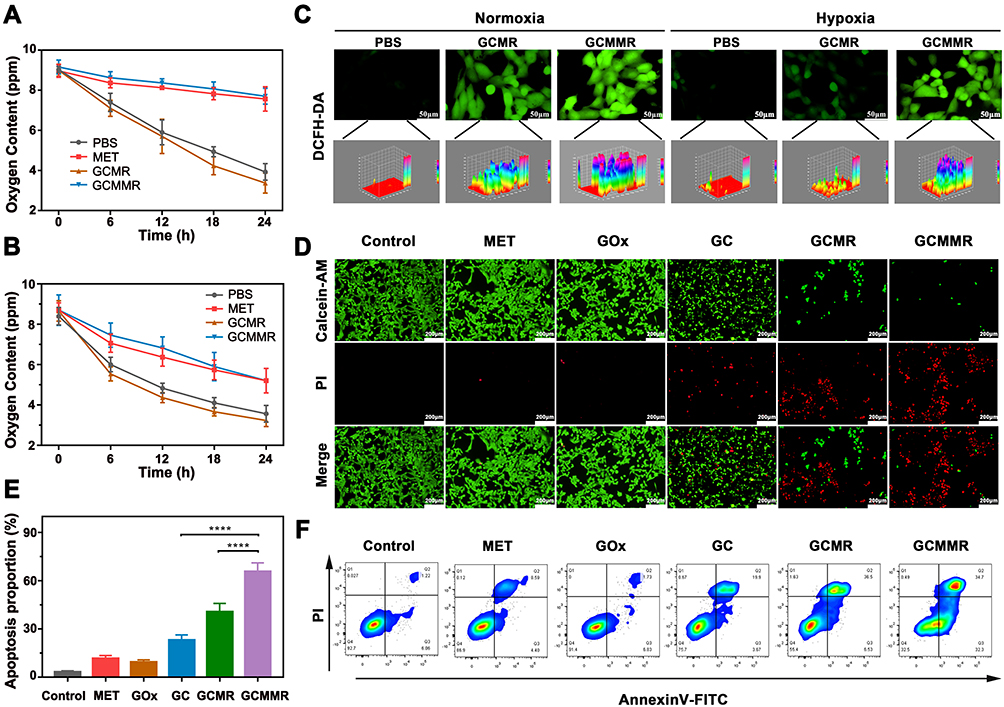 |
Figure 4 MET-mediated Hypoxia relief and dual enhancement of ST/CDT. (A) Oxygen content curve of MNNG/HOS cells after corresponding treatments under normoxic condition. (B) Oxygen content curve of MNNG/HOS cells after corresponding treatments under hypoxic condition. (C) ROS generation of MNNG/HOS cells after various treatments under normoxic or hypoxic conditions. (D) Fluorescence microscopy images of MNNG/HOS cells stained with Calcein-AM and PI after corresponding treatments. (E) Quantified analysis of apoptosis ratios after different treatments (*P<0.05, **P<0.01, ***P<0.001, ****P<0.0001). (F) Flow cytometry analysis of apoptosis for MNNG/HOS cells incubated with various formulations in the presence of glucose. |
Encouraged by the above findings, we next evaluated the cooperative therapeutic effects of the MET-loaded nanoplatform on MNNG/HOS cells. As shown in Figure S8D, GCMMR exhibited further improved cytotoxicity under the same conditions, suggesting improved ST/CDT activity mediated by MET. Nevertheless, as shown in Figure S11, GCMMR was found to have a low toxicity to non-cancerous cells (hBMSCs), which is probably due to the fact that the cell killing effect of GCMMR is based on the higher GSH level6 and increased vulnerability to oxidative stress47 of cancer cells. For visual observation of the killing effects on MNNG/HOS cells of various treatments, Calcein-AM and PI were employed as fluorescent indicators of living (green) and dead (red) cells, respectively. As displayed in Figure 4D, the cells in control group exhibited good vitalities as evidenced by the bright and strong green fluorescence. Negligible red fluorescence was detected in GOx or MET group, suggesting insignificant therapeutic effects could be accomplished without the delivery system. Red fluorescence was partially detected in GC group and more obvious in GCMR group, indicating the combined starvation therapy and chemodynamic therapy got initially enhanced by MnO2-mediated GSH depletion. Notably, the most significant killing effect was determined by the strong red signals in GCMMR group, confirming that the MET-mediated synergistic enhanced ST/CDT with targeting ability achieved the best therapeutic efficacy. To further verify the apoptosis of MNNG/HOS cells after different treatments, the flow cytometry analysis was performed with Annexin V-FITC/PI apoptosis detection kit. Consistent with the living-dead analysis and cytotoxicity tests, the most severe cell apoptosis was induced by GCMMR NPs (Figure 4E and F), further exhibiting the advantages of cascade-enhanced targeted ST/CDT (Figure 5).
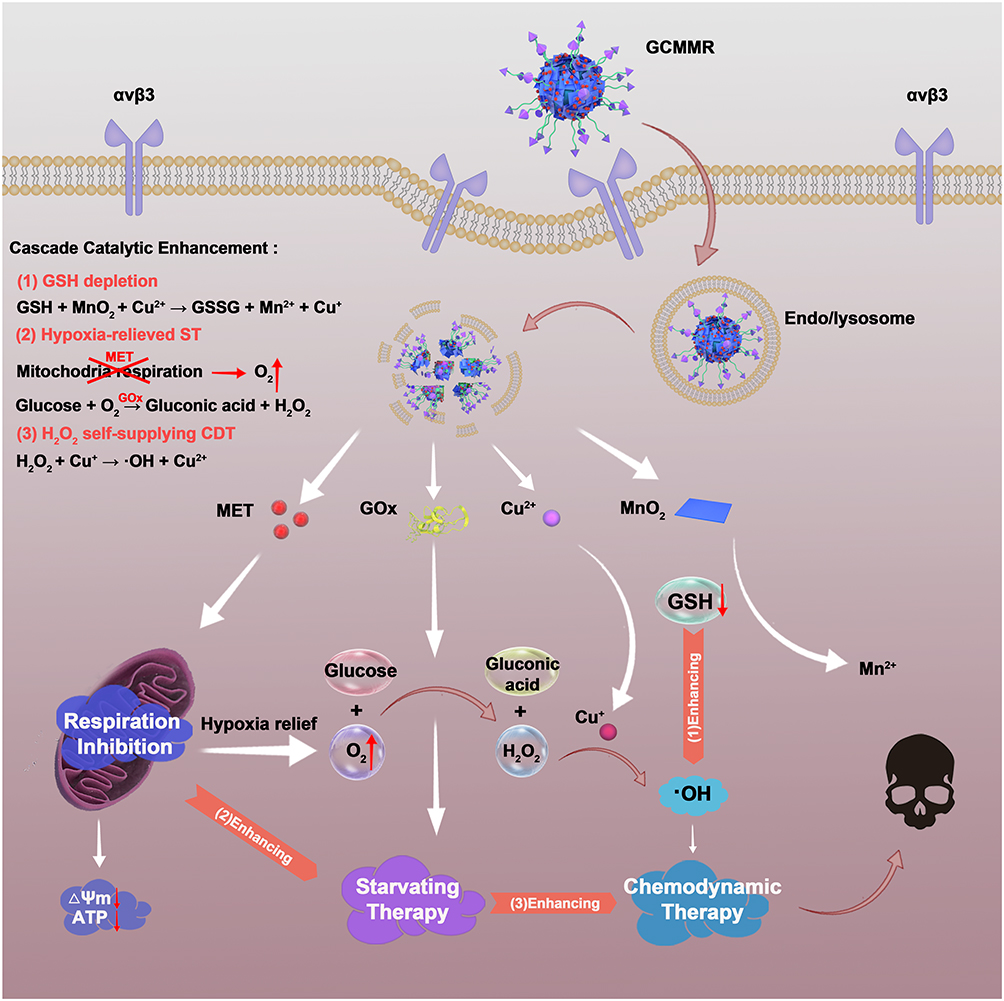 |
Figure 5 Schematic illustration of the mechanisms of the cascade-enhanced catalytic activity for effective starving-chemodynamic therapy. |
In vivo Antitumor Study
In view of the promising therapeutic effects of GCMMR NPs in vitro, we next evaluate the in vivo antitumor efficacy via a MNNG/HOS tumor xenograft mouse model. Firstly, the hemolysis test was conducted for assessment of the biocompatibility and biosafety of the as-prepared GCMMR NPs. As displayed in Figure S12, the positive control group (H2O) demonstrated bright red due to released hemoglobin from the broken RBCs, while negligible hemolysis could be detected in the PBS and GCMMR groups, indicating excellent hemocompatibility of the NPs.
Subsequently, to evaluate the in vivo biodistribution of the NPs, MNNG/HOS tumor-bearing mice were intravenously injected with ICG labeled NPs (ICG@GCMR) and imaged at various time points by an IVIS spectrum system. As shown in Figure 6A, no fluorescence signal was observed before injection. Afterwards, the fluorescence signals in tumor region gradually increased and reached a maximum level after 12 h post-injection, indicating the NPs could effectively accumulate within the tumors. At 24 h post injection, relative strong fluorescence was still detected at tumor site, demonstrating the excellent retention performance of the NPs. Collectively, these results confirmed the effective tumor accumulation and long retention ability of the NPs, which are owing to both the RGD-mediated targeting attachment and enhanced permeability and retention (EPR) effect.49 Meanwhile, the fluorescence intensity of liver and kidney areas were found to be temporary strong, suggesting the metabolic clearance pathways of the NPs.50 In view of that, we evaluated the levels of the hepatic and renal function markers (ALT, AST, BUN and CREA). As shown in Figure S13, the ignorable variations further demonstrated the favorable biosafety of the NPs.
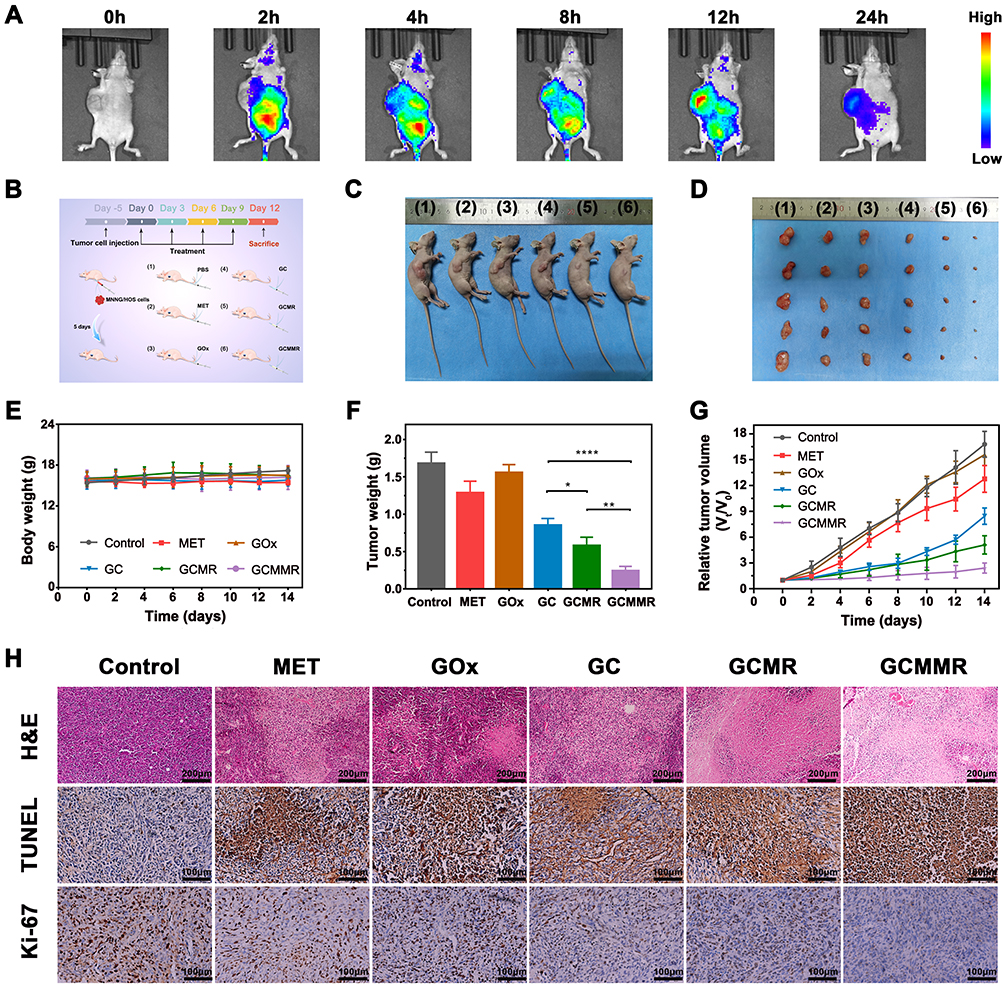 |
Figure 6 In vivo antitumor study. (A) In vivo fluorescence images of MNNG/HOS tumor-bearing nude mice at various time points post intravenous injection of ICG labeled NPs. (B) Schematic illustration of in vivo treating process. (C) Representative photographs of the MNNG/HOS tumor-bearing mice after different treatments. (D) Photographs of excised tumors from the mice after corresponding treatments. ((1) control, (2) MET, (3) GOx, (4) GC, (5) GCMR, (6) GCMMR). (E) Body weight changes of the tumor-bearing mice during the treatment. (F) Average tumor weights after various treatments (*P<0.05, **P<0.01, ****P<0.0001). (G) Tumor growth curves of the mice treated with different formulations. (H) H&E staining and immunohistochemical (TUNEL and Ki-67) analysis of tumor tissues from various groups. |
Inspired by the excellent biosafety and efficient tumor accumulation of the nanocomposite, we continued to explore the in vivo antitumor effect of the synergistic treatment. The total in vivo treating process was revealed in Figure 6B. The doses of GOx, Cu2+, MnO2, and MET at each injection were 2, 0.1, 1.48, and 0.61 mg kg−1, respectively. It could be seen from Figure 6C–G that the growth of tumors was negligibly affected by treating with GOx or MET alone, suggesting those therapeutic agents could not be effectively accumulated at tumor sites without proper delivery system. Comparatively, the tumors of mice treated with GC and GCMR demonstrated approximately 49.71% and 69.53% inhibition (Figure 6G), respectively. These results suggested that the therapeutic effect of ST/CDT was firstly improved by GSH depletion and RGD-mediated enhanced tumor accumulation of the NPs. Unsurprisingly, a superior therapeutic effect (85.64%) was observed in the GCMMR group, demonstrating MET-induced further improvement of the cascade catalytic activity for effective starving-chemodynamic therapy.
Furthermore, the excellent therapeutic effect was validated by H&E staining of the tumor tissues (Figure 6H), where the most significant death of cells was observed in the GCMMR group. Additionally, the expression of proliferation marker protein Ki-67 and TUNEL assay were also performed to evaluate the proliferation and apoptosis of the tumor cells. As expected, tumor cells of GCMMR group exhibited the highest level of apoptosis and lowest expression of antigen Ki-67, further confirming the remarkable therapeutic effects of GCMMR (Figure 6H). Of note, among all groups no significant weight loss were detected during the treatment (Figure 6E), indicating negligible systemic toxicity of the NPs. Meanwhile, among all groups, no obvious histological changes or inflammation lesions were observed on the H&E staining images of major organs (Figure S14). Collectively, these results fully validated the excellent biocompatibility and biosafety of as-designed NPs.
Conclusion
In summary, we have successfully constructed a multifunctional nanoplatform that is composed of GOx/Cu2+ encapsulated core, MET-loaded MnO2 shell and RGD-functionalized PEG coat (GCMMR). With respiration inhibition and GSH depletion ability, this nanocomposite could realize cascade-enhanced catalytic activity for effective starving-chemodynamic therapy. Both in vitro and in vivo studies confirmed the excellent therapeutic efficacy and biosafety of the nanoparticle. Collectively, this study provides an appealing strategy with catalytic cascade enhancement on targeted ST/CDT for cancer treatment, especially for hypoxic solid tumors.
Disclosure
The authors report no conflicts of interest in this work.
References
1. Chen W, Liu J, Zheng C, et al. Research progress on improving the efficiency of CDT by exacerbating tumor acidification. Int J Nanomed. 2022;17:2611–2628. doi:10.2147/IJN.S366187
2. Yang B, Chen Y, Shi J. Nanocatalytic medicine. Adv Mater. 2019;31(39):e1901778. doi:10.1002/adma.201901778
3. Tang Z, Liu Y, He M, Bu W. Chemodynamic therapy: tumour microenvironment-mediated Fenton and Fenton-like reactions. Angewandte Chemie. 2019;58(4):946–956. doi:10.1002/anie.201805664
4. Liu Y, Ji X, Tong WWL, et al. Engineering multifunctional RNAi nanomedicine to concurrently target cancer hallmarks for combinatorial therapy. Angewandte Chemie. 2018;57(6):1510–1513. doi:10.1002/anie.201710144
5. Wang S, Wang Z, Yu G, et al. Tumor-specific drug release and reactive oxygen species generation for cancer chemo/chemodynamic combination therapy. Adv Sci. 2019;6(5):1801986. doi:10.1002/advs.201801986
6. Mura S, Nicolas J, Couvreur P. Stimuli-responsive nanocarriers for drug delivery. Nat Mater. 2013;12(11):991–1003. doi:10.1038/nmat3776
7. Zhang L, Wan S, Li C, Xu L, Cheng H, Zhang X. An adenosine triphosphate-responsive autocatalytic Fenton nanoparticle for tumor ablation with self-supplied H2 O2 and acceleration of Fe(III)/Fe(II) conversion. Nano Lett. 2018;18(12):7609–7618. doi:10.1021/acs.nanolett.8b03178
8. Feng W, Han X, Wang R, et al. Nanocatalysts‐augmented and photothermal‐enhanced tumor‐specific sequential nanocatalytic therapy in both NIR‐I and NIR‐II biowindows. Adv Mater. 2018;1805919. doi:10.1002/adma.201805919
9. Fu L, Hu Y, Qi C, et al. Biodegradable manganese-doped calcium phosphate nanotheranostics for traceable cascade reaction-enhanced anti-tumor therapy. Acs Nano. 2019;13(12):13985–13994. doi:10.1021/acsnano.9b05836
10. Zhang X, He C, Chen Y, et al. Cyclic reactions-mediated self-supply of H2O2 and O2 for cooperative chemodynamic/starvation cancer therapy. Biomaterials. 2021;275:120987. doi:10.1016/j.biomaterials.2021.120987
11. Zhao Y, Kong W, Wang P, et al. Tumor-specific multipath nucleic acid damages strategy by symbiosed nanozyme@enzyme with synergistic self-cyclic catalysis. Small. 2021;17(28):e2100766. doi:10.1002/smll.202100766
12. Zhang Y, Qiu W, Zhang M, Zhang L, Zhang X. MnO2 motor: a prospective cancer-starving therapy promoter. Acs Appl Mater Inter. 2018;10(17):15030–15039. doi:10.1021/acsami.8b01818
13. Cheng H, Zhu J, Li S, et al. An O2 self-sufficient biomimetic nanoplatform for highly specific and efficient photodynamic therapy. Adv Funct Mater. 2016;26(43):7847–7860. doi:10.1002/adfm.201603212
14. Grimes DR, Kelly C, Bloch K, Partridge M. A method for estimating the oxygen consumption rate in multicellular tumour spheroids. J Royal Soc Interface. 2014;11(92):20131124. doi:10.1098/rsif.2013.1124
15. Moreno-Sánchez R, Marín-Hernández A, Saavedra E, Pardo JP, Ralph SJ, Rodríguez-Enríquez S. Who controls the ATP supply in cancer cells? Biochemistry lessons to understand cancer energy metabolism. Int J Biochem Cell Biol. 2014;50:10–23. doi:10.1016/j.biocel.2014.01.025
16. Heckman-Stoddard BM, DeCensi A, Sahasrabuddhe VV, Ford LG. Repurposing metformin for the prevention of cancer and cancer recurrence. Diabetologia. 2017;60(9):1639–1647. doi:10.1007/s00125-017-4372-6
17. Madiraju AK, Erion DM, Rahimi Y, et al. Metformin suppresses gluconeogenesis by inhibiting mitochondrial glycerophosphate dehydrogenase. Nature. 2014;510(7506):542–546. doi:10.1038/nature13270
18. Huo M, Wang L, Chen Y, Shi J. Tumor-selective catalytic nanomedicine by nanocatalyst delivery. Nat Commun. 2017;8(1):357–412. doi:10.1038/s41467-017-00424-8
19. Wang W, Liu X, Zheng X, Jin HJ, Li X. Biomineralization: an opportunity and challenge of nanoparticle drug delivery systems for cancer therapy. Adv Healthc Mater. 2020;9(22):e2001117. doi:10.1002/adhm.202001117
20. Chen W, Wang G, Yung BC, Liu G, Qian Z, Chen X. Long-acting release formulation of exendin-4 based on biomimetic mineralization for type 2 diabetes therapy. Acs Nano. 2017;11(5):5062–5069. doi:10.1021/acsnano.7b01809
21. Fu L, Wan Y, Qi C, et al. Nanocatalytic theranostics with glutathione depletion and enhanced reactive oxygen species generation for efficient cancer therapy. Adv Mater. 2021;33(7):e2006892. doi:10.1002/adma.202006892
22. Gu Z, Dang TT, Ma M, et al. Glucose-responsive microgels integrated with enzyme nanocapsules for closed-loop insulin delivery. Acs Nano. 2013;7(8):6758–6766. doi:10.1021/nn401617u
23. Chen J, Meng H, Tian Y, et al. Recent advances in functionalized MnO2 nanosheets for biosensing and biomedicine applications. Nanoscale Horiz. 2019;4(2):321–338. doi:10.1039/C8NH00274F
24. Zhao P, Zhu Y, Yang X, et al. Multifunctional MnO2 nanosheet-modified Fe3O4@SiO2/NaYF4: Yb, Er nanocomposites as novel drug carriers. Dalton Transact. 2014;43(2):451–457. doi:10.1039/c3dt52066h
25. He D, He X, Wang K, et al. Redox-responsive degradable honeycomb manganese oxide nanostructures as effective nanocarriers for intracellular glutathione-triggered drug release. Chem Commun. 2015;51(4):776–779. doi:10.1039/c4cc08172b
26. Xu X, Duan J, Liu Y, et al. Multi-stimuli responsive hollow MnO(2)-based drug delivery system for magnetic resonance imaging and combined chemo-chemodynamic cancer therapy. Acta Biomater. 2021;126:445–462. doi:10.1016/j.actbio.2021.03.048
27. Martinez-Velez N, Xipell E, Jauregui P, et al. The oncolytic adenovirus Δ24-RGD in combination with cisplatin exerts a potent anti-osteosarcoma activity. J Bone Mineral Res. 2014;29(10):2287–2296. doi:10.1002/jbmr.2253
28. Fang Z, Sun Y, Xiao H, et al. Targeted osteosarcoma chemotherapy using RGD peptide-installed doxorubicin-loaded biodegradable polymeric micelle. Biomed Pharmacother. 2017;85:160–168. doi:10.1016/j.biopha.2016.11.132
29. Zhang R, Luo W, Zhang Y, et al. Particle-based artificial three-dimensional stem cell spheroids for revascularization of ischemic diseases. Sci Adv. 2020;6(19):eaaz8011–eaaz8011. doi:10.1126/sciadv.aaz8011
30. Hao H, Sun M, Li P, Sun J, Liu X, Gao W. In situ growth of a cationic polymer from the N-terminus of glucose oxidase to regulate H2 O2 generation for cancer starvation and H2 O2 therapy. Acs Appl Mater Inter. 2019;11(10):9756–9762. doi:10.1021/acsami.8b20956
31. Hartgerink JD, Beniash E, Stupp SI. Self-assembly and mineralization of peptide-amphiphile nanofibers. Science. 2001;294(5547):1684–1688. doi:10.1126/science.1063187
32. Yu S, Cölfen H, Tauer K, Antonietti M. Tectonic arrangement of BaCO3 nanocrystals into helices induced by a racemic block copolymer. Nat Mater. 2005;4(1):51–55. doi:10.1038/nmat1268
33. Boal A, Ilhan F, DeRouchey J, Thurn-Albrecht T, Russell T, Rotello V. Self-assembly of nanoparticles into structured spherical and network aggregates. Nature. 2000;404(6779):746–748. doi:10.1038/35008037
34. He T, Jiang C, He J, et al. Manganese‐dioxide‐coating‐instructed plasmonic modulation of gold nanorods for activatable duplex‐imaging‐guided nir‐ii photothermal‐chemodynamic therapy. Adv Mater. 2021;33(13):2008540. doi:10.1002/adma.202008540
35. Zeng W, Zhang H, Deng Y, et al. Dual-response oxygen-generating MnO2 nanoparticles with polydopamine modification for combined photothermal-photodynamic therapy. Chem Eng J. 2020;389:124494. doi:10.1016/j.cej.2020.124494
36. Wu H, Chen F, Gu D, You C, Sun B. A pH-activated autocatalytic nanoreactor for self-boosting Fenton-like chemodynamic therapy. Nanoscale. 2020;12(33):17319–17331. doi:10.1039/d0nr03135f
37. Liu C, Wang D, Zhang S, et al. Biodegradable biomimic copper/manganese silicate nanospheres for chemodynamic/photodynamic synergistic therapy with simultaneous glutathione depletion and hypoxia relief. Acs Nano. 2019;13(4):4267–4277. doi:10.1021/acsnano.8b09387
38. Wu S, Liu X, Ren J, Qu X. Glutathione depletion in a benign manner by MoS2 ‐based nanoflowers for enhanced hypoxia‐irrelevant free‐radical‐based cancer therapy. Small. 2019;15(51):1904870. doi:10.1002/smll.201904870
39. Meng X, Song J, Lei Y, et al. A metformin-based nanoreactor alleviates hypoxia and reduces ATP for cancer synergistic therapy. Biomater Sci. 2021;9(22):7456–7470. doi:10.1039/D1BM01303C
40. Ingavle GC, Gehrke SH, Detamore MS. The bioactivity of agarose-PEGDA interpenetrating network hydrogels with covalently immobilized RGD peptides and physically entrapped aggrecan. Biomaterials. 2014;35(11):3558–3570. doi:10.1016/j.biomaterials.2014.01.002
41. Zhang Z, Ji Y. Nanostructured manganese dioxide for anticancer applications: preparation, diagnosis, and therapy. Nanoscale. 2020;12(35):17982–18183. doi:10.1039/d0nr04067c
42. Setsukinai K, Urano Y, Kakinuma K, Majima HJ, Nagano T. Development of novel fluorescence probes that can reliably detect reactive oxygen species and distinguish specific species. J Biol Chem. 2003;278(5):3170–3175. doi:10.1074/jbc.M209264200
43. Zhen W, Liu Y, Wang W, et al. Specific “unlocking” of a nanozyme‐based butterfly effect to break the evolutionary fitness of chaotic tumors. Angewandte Chemie. 2020;59(24):9491–9497. doi:10.1002/anie.201916142
44. Wasil M, Halliwell B, Grootveld M, Moorhouse CP, Hutchison DC, Baum H. The specificity of thiourea, dimethylthiourea and dimethyl sulphoxide as scavengers of hydroxyl radicals. Their protection of alpha 1-antiproteinase against inactivation by hypochlorous acid. Biochem J. 1987;243(3):867–870. doi:10.1042/bj2430867
45. Wu H, Chen F, You C, Zhang Y, Sun B, Zhu Q. Smart porous core-shell cuprous oxide nanocatalyst with high biocompatibility for acid-triggered chemo/chemodynamic synergistic therapy. Small. 2020;16(45):e2001805. doi:10.1002/smll.202001805
46. Biswas S, Lunec J, Bartlett K. Non-glucose metabolism in cancer cells--is it all in the fat? Cancer Metastasis Rev. 2012;31(3–4):689–698. doi:10.1007/s10555-012-9384-6
47. Lin L, Song J, Song L, et al. Simultaneous Fenton-like ion delivery and glutathione depletion by MnO(2) -based nanoagent to enhance chemodynamic therapy. Angewandte Chemie. 2018;57(18):4902–4906. doi:10.1002/anie.201712027
48. Yang Z, Wang J, Liu S, et al. Defeating relapsed and refractory malignancies through a nano-enabled mitochondria-mediated respiratory inhibition and damage pathway. Biomaterials. 2020;229:119580. doi:10.1016/j.biomaterials.2019.119580
49. Yang J, Luo Y, Xu Y, et al. Conjugation of iron oxide nanoparticles with RGD-modified dendrimers for targeted tumor MR imaging. Acs Appl Mater Inter. 2015;7(9):5420–5428. doi:10.1021/am508983n
50. Tang H, Yang S, Yang Y, et al. Blood clearance, distribution, transformation, excretion, and toxicity of near-infrared quantum dots Ag2 Se in mice. Acs Appl Mater Inter. 2016;8(28):17859–17869. doi:10.1021/acsami.6b05057
 © 2022 The Author(s). This work is published and licensed by Dove Medical Press Limited. The full terms of this license are available at https://www.dovepress.com/terms.php and incorporate the Creative Commons Attribution - Non Commercial (unported, v3.0) License.
By accessing the work you hereby accept the Terms. Non-commercial uses of the work are permitted without any further permission from Dove Medical Press Limited, provided the work is properly attributed. For permission for commercial use of this work, please see paragraphs 4.2 and 5 of our Terms.
© 2022 The Author(s). This work is published and licensed by Dove Medical Press Limited. The full terms of this license are available at https://www.dovepress.com/terms.php and incorporate the Creative Commons Attribution - Non Commercial (unported, v3.0) License.
By accessing the work you hereby accept the Terms. Non-commercial uses of the work are permitted without any further permission from Dove Medical Press Limited, provided the work is properly attributed. For permission for commercial use of this work, please see paragraphs 4.2 and 5 of our Terms.