")
Back to Journals » Clinical Epidemiology » Volume 13
Cardiovascular Disease Prediction by Machine Learning Algorithms Based on Cytokines in Kazakhs of China
Authors Jiang Y, Zhang X, Ma R, Wang X, Liu J, Keerman M, Yan Y, Ma J, Song Y, Zhang J , He J, Guo S , Guo H
Received 29 March 2021
Accepted for publication 17 May 2021
Published 9 June 2021 Volume 2021:13 Pages 417—428
DOI https://doi.org/10.2147/CLEP.S313343
Checked for plagiarism Yes
Review by Single anonymous peer review
Peer reviewer comments 3
Editor who approved publication: Dr Eyal Cohen
Yunxing Jiang,1,* Xianghui Zhang,1,* Rulin Ma,1 Xinping Wang,1 Jiaming Liu,1 Mulatibieke Keerman,1 Yizhong Yan,1 Jiaolong Ma,1 Yanpeng Song,1,2 Jingyu Zhang,1 Jia He,1 Shuxia Guo,1,3 Heng Guo1
1Department of Public Health, Shihezi University School of Medicine, Shihezi, Xinjiang, People’s Republic of China; 2The First Affiliated Hospital of Shihezi University Medical College, Shihezi, Xinjiang, People’s Republic of China; 3Department of Pathology and Key Laboratory of Xinjiang Endemic and Ethnic Diseases (Ministry of Education), Shihezi University School of Medicine, Shihezi, Xinjiang, People’s Republic of China
*These authors contributed equally to this work
Correspondence: Shuxia Guo; Heng Guo
Department of Public Health, Shihezi University School of Medicine, North 2th Road, Shihezi, Xinjiang, People’s Republic of China
Tel +8618009932625
Fax +8609932057153
Email [email protected]; [email protected]
Background: Cardiovascular disease (CVD) is the leading cause of mortality worldwide. Accurately identifying subjects at high-risk of CVD may improve CVD outcomes. We sought to systematically examine the feasibility and performance of 7 widely used machine learning (ML) algorithms in predicting CVD risks.
Methods: The final analysis included 1508 Kazakh subjects in China without CVD at baseline who completed follow-up. All subjects were randomly divided into the training set (80%) and the test set (20%). L1-penalized logistic regression (LR), support vector machine with radial basis function (SVM), decision tree (DT), random forest (RF), k-nearest neighbors (KNN), Gaussian naive Bayes (NB), and extreme gradient boosting (XGB) were employed for prediction CVD outcomes. Ten-fold cross-validation was used during model developing and hyperparameters tuning in the training set. Model performance was evaluated in the test set in light of discrimination, calibration, and clinical usefulness. RF was applied to obtain the variable importance of included variables. Twenty-two variables, including sociodemographic characteristics, medical history, cytokines, and synthetic indices, were used for model development.
Results: Among 1508 subjects, 203 were diagnosed with CVD over a median follow-up of 5.17 years. All 7 models had moderate to excellent discrimination (AUC ranged from 0.770 to 0.872) and were well calibrated. LR and SVM performed identically with an AUC of 0.872 (95% CI: 0.829– 0.907) and 0.868 (95% CI: 0.825– 0.904), respectively. LR had the lowest Brier score (0.078) and the highest sensitivity (97.1%). Decision curve analysis indicated that SVM was slightly better than LR. The inflammatory cytokines, such as hs-CRP and IL-6, were identified as strong predictors of CVD.
Conclusion: SVM and LR can be applied to guide clinical decision-making in the Kazakh Chinese population, and further study is required to ensure their accuracies.
Keywords: cardiovascular disease, prediction model, machine learning, Kazakh population
Introduction
Cardiovascular disease (CVD), the leading cause of mortality in the world, has been an important public health concern globally, causing massive socioeconomic burdens on patients, families, and countries every year.1 Risk stratification can be used to identify high-risk subjects of having CVD through predictive models, and then interventions, such as lifestyle changes and initiation of statins use, specific to this target population can reduce the risk of developing CVD and promote the primary prevention of CVD.2,3 Several guidelines on the assessment and management of CVD recommended applying predictive models to identify the high-risk population and support clinical decision-making.4 Widely used predictive models, such as the Pooled Cohort Equations (PCE)5 and the Framingham CV risk equation (FRS)6 have been externally validated in multiple populations, however, the results demonstrated that both of them were in moderate discrimination and poorly calibrated.7–9
Our previous analysis showed that the PCE and FRS underestimated the risk of CVD in the Uyghur and Kazakh Chinese population, leaving a large part of the population at risk of CVD unidentified, so they cannot be used to guide clinical practice. Most of the existing predictive models were developed by traditional statistical methods, such as logistic regression and Cox proportional hazard model,6,10 which require the assumptions of linearity and predictors’ independence, thus limiting the predictive performance and leaving room for improvement.
Machine learning (ML) algorithms have emerged as highly effective methods for prediction in cardiovascular research.3,11,12 They can capture the complex interactions between predictors and nonlinear relationships between predictors and outcomes, producing better predictive performance than traditional statistical models. Studies suggested that random forest (RF),13 support vector machine (SVM),14,15 outperformed traditional models. However, results are still inconsistent, a recently published meta-analysis showed that ML-based predictive models do not perform better than logistic regression.16
The Kazakh ethnic population live in the remote northwest of China, Xinjiang, and they have similar genetic backgrounds to Caucasians. Most of them live in mountainous pastures, and this population has a relatively high incidence rate of CVD due to their unique lifestyle, dietary habits, and genetic characteristics.17 Therefore, it is crucial to identify high-risk subjects who may benefit from targeted interventions using CVD predictive models for the prevention of CVD.
Consequently, we sought to assess the potential value of several widely used ML algorithms in predicting future CVD events in this Kazakh Chinese population and explored which ML-based model generated the best predictive performance and most accurate prediction. Then we evaluated the clinical usefulness of the best model through decision curve analysis and determined whether it could be used to guide CVD prevention and support the clinical decision-making process.
Methods
Study Population
Multistage (prefecture-county-township-village) stratified cluster random sampling was employed to choose participants. Firstly, we chose a representative prefecture (Yili) of Kazakh population in Xinjiang. Secondly, we randomly selected one county in each prefecture and one township from each county. Finally, a stratified sampling method was used to select the corresponding villages in each township. The prospective cohort used in this study was conducted in Nalati town, Xinjiang Kazakh Autonomous Region. A total of 1771 local Kazakh Chinese subjects aged ≥18 years who had resided in the village for at least 6 months were successfully enrolled between 2009 and 2013, and 1508 of them with complete information were followed up for a median of 5.17 years by the end of 2016. Subjects with a previous history of CVD before the baseline survey were excluded. All participants provided written informed consent prior to enrollment in the study. The Institutional Ethics Review Board of the First Affiliated Hospital of Shihezi University approved the study (IERB no. SHZ2010LL01).
Assessment of Variables
We compiled 31 candidate variables for analysis in this study, including sociodemographic characteristics, medical history, lifestyle habits, laboratory tests, and synthetic indices. Anthropometric measurements, such as height, weight, waist circumference, hip circumference, and blood pressure were obtained by trained professionals. Blood pressure was measured three times in each subject after a 5-min seated rest using a mercury sphygmomanometer, and the average value was calculated. A 5-mL fasting blood sample was collected from each subject. Current cigarette smoking status and alcohol drinking status was self-reported by participants. The family history of diabetes was defined as diabetes history in at least a parent or sibling, the same as the family history of hypertension. Hypertension was defined as systolic blood pressure (SBP) ≥140 mmHg or diastolic blood pressure (DBP) ≥90 mmHg, or treatment with antihypertensive medications. The fasting blood glucose (FBG), low-density lipoprotein cholesterol (LDL), high-density lipoprotein cholesterol (HDL), total cholesterol (TC) and triglycerides (TG) were examined by a modified hexokinase enzymatic method using an Olympus AV2700 Biochemical Automatic Analyzer (Olympus, Japan) in the Biochemistry Laboratory of the First Affiliated Hospital of Shihezi University School of Medicine. Metabolic syndrome and dyslipidemia were defined according to IDF diagnostic criteria18 and the China Adult Dyslipidemia Prevention Guide (2007),19 respectively. Cytokines, including nonesterified fatty acids (NEFAs), high-sensitivity C-reactive protein (hs-CRP), adiponectin (ADP), insulin (INS), and interleukin-6 (IL-6) were detected by kits purchased from Randox Laboratories Ltd. (Shanghai, China) and Elabscience Biotechnology (Wuhan, China). We also calculated some synthetic indices, including BMI (body mass index, weight (kg)/height2 (m)), BAI (body adiposity index, (hip circumference)/(height1.5) −18),20 LHR (LDL/HDL ratio), TGHR (TG/HDL ratio), TCHR (TC/HDL ratio), WHR (waist-to-hip ratio), WHtR (waist-to-height ratio) and MAP (Mean arterial pressure, (DBP)*(2/3)+ (SBP)*(1/3)). This study used the same method of our previous research, and the methods description partly reproduces their wording.21
CVD Event Ascertainment
The primary outcome of the analysis in this study was the first recorded diagnosis of CVD. A CVD event was defined as hospitalization or death during follow-up period for ischemic heart disease, cerebrovascular disease, or other related diseases (ICD9: Codes 390–495). We identified CVD events from local hospital medical records, health insurance claims, questionnaire responses, death registries from the morbidity and mortality surveillance system, and questionnaire responses during follow-up period. We conducted two follow-ups in 2012 and 2016, respectively. The questionnaire responses were acquired by professional investigators during a face-to-face visit. We usually followed up the subjects in November. First of all, we would record the basic demographic information and follow-up time in the questionnaire. If the subject died during the follow-up period, their family members were asked about the time of death, the place of death and the cause of death, and then the information was checked with the information obtained from the cause of death monitoring system. If the subjects survived, they would be asked whether they were hospitalized, and the reasons and time of hospitalization, and then the information would be verified with medical insurance data and medical record information to record their hospitalization diagnosis.21
Derivation and Validation of ML Models
We investigated 7 widely used ML algorithms because of their increasing popularities and promising abilities in predicting future CVD events, including decision tree (DT),22 random forests (RF),23 k-nearest neighbors (KNN),24 Gaussian naive Bayes (NB),25 support vector machine (SVM),26 extreme gradient boosting (XGB),27 logistic regression with L-1 penalization (LR).28
For the development and validation of ML models, the final dataset was randomly split into training (1206 subjects, 80%) and test (302 subjects, 20%) sets using methods in Scikit-learn. The training set was used for model development and hyperparameter tuning, and the test set for comparison of predictive performance. To eliminate the dimensional impact on model performance, we standardized continuous variables by removing the mean and scaling to unit variance on training and test set independently. Multicollinearity among variables might cause model overfitting; hence, we developed an RF model with all 31 variables and performed hierarchical clustering to handle this problem, eventually leaving 22 variables for the final model development. Hyperparameters for each ML model were tuned by using Bayesian optimization29 or grid search with 10-fold cross-validation on the training set to find the optimal hyperparameters which produced the best performance measured by area under the receiver operating characteristic curve (AUC). The final model was fit on the entire training set using the optimal hyperparameter.
ML algorithms are usually used to predict classes and apply a 0.5 decision threshold by default to decide a subject whether having a CVD event or not. However, the dataset we use is an imbalanced set in which the subjects who have CVD are much fewer than those who do not, so we use all the models to predict probabilities instead of classes. Some of these algorithms we use do not directly generate predictions of probabilities, and the predicted probabilities from these models will likely be uncalibrated, so we perform Platt Scaling to calibrate probabilities for better predictive performance.30
Statistical Analysis
For model comparison, we reported each ML model’s discrimination, calibration, and clinical usefulness using the test set. Discrimination was assessed by AUC and DeLong test31 was used to compare each ML model’s AUC. The optimal threshold probability for identifying high-risk subjects of each model was determined by the highest Youden index, which maximizes the sum of specificity and sensitivity. Under the optimal threshold, we also reported other diagnostic test metrics, including specificity, sensitivity, negative predictive value (NPV), positive predictive value (PPV). Calibration was evaluated by Brier score32 and plotting calibration curve. The confidence interval of Brier score was calculated by 1000 times bootstrap. A Hosmer-Lemeshow chi-square statistic (χ2) was calculated, and a score <20 or P-value >0.05 indicates good calibration.33 The clinical usefulness was assessed by using the decision curve analysis (DCA)34 for the best-performing model, which was determined by a combination of discrimination and calibration.
Comparisons of baseline characteristics were conducted using Student’s t-test or the Mann–Whitney test for continuous variables where appropriate and chi-square tests for categorical variables. We report our findings in compliance with the Transparent Reporting of a Multivariable Prediction Model for Individual Prognosis or Diagnosis (TRIPOD).35 We performed all statistical analyses using scikit-learn in Python version 3.7 (Python Software Foundation) and R version 3.3 (http://www.r-project.org/, The R Foundation). A 2-sided P value <0.05 was considered statistically significant.
Results
Characteristics of the Study Population
A total of 1508 subjects who were free of CVD at baseline were included for final analysis, the mean age (standard deviation [SD]) of these subjects was 45.78 (13.18) years, and 662 (43.9%) of them were men. Over a median follow-up of 5.17 years, 203 (13.46%) subjects were diagnosed with CVD events. Subjects with CVD had a higher level of FPG, SBP, IL-6, and CRP on the training set. The person who had MetS or a family history of hypertension was more likely to develop CVD events. Further characteristics of CVD and non-CVD subjects on both training and test set are presented in Table 1.
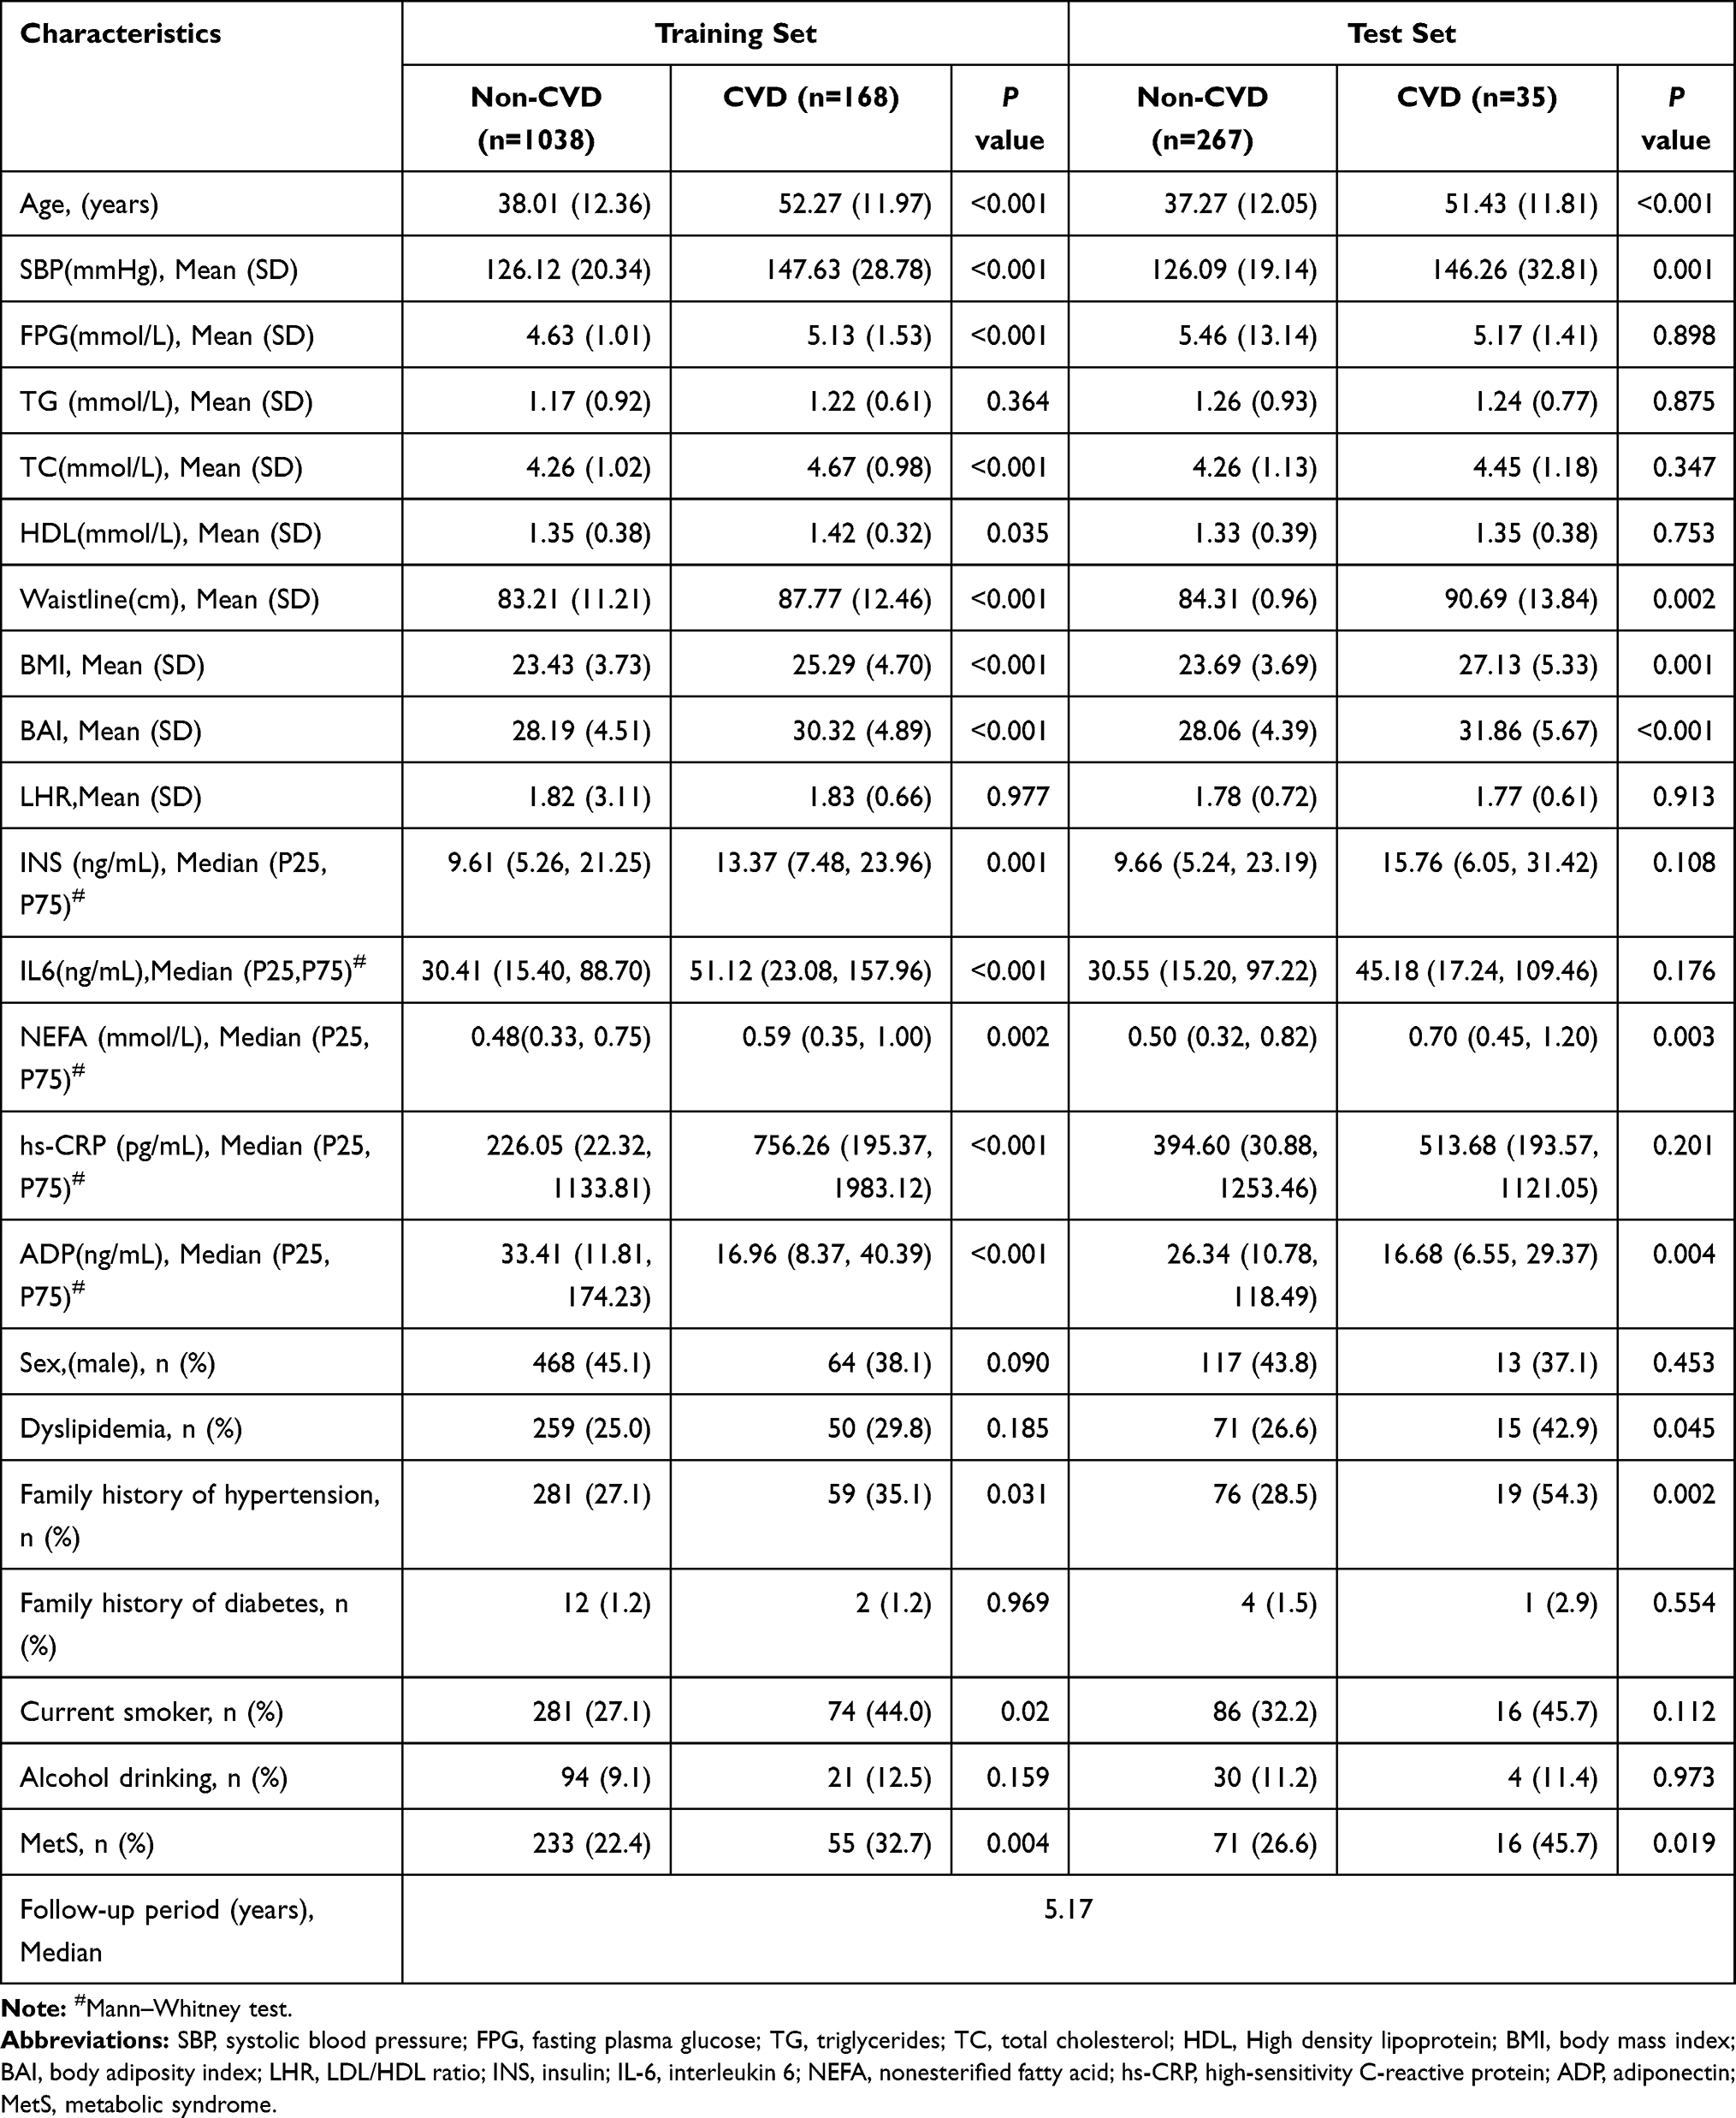 |
Table 1 Baseline Characteristics of Study Subjects in This Chinese Kazakhs |
Variable Importance
We can measure the importance of a variable by the mean decrease impurity (Gini importance) of all decision trees in a tuned RF model. The variable importance of included variables obtained from the tuned RF model is presented in Figure 1. As expected, age, SBP, TC and FPG were among the top 10 risk factors. In addition to these standard risk factors, cytokines, including CRP, ADP, IL6, NEFA, and synthetic indices (BAI, LHR) were also identified as top-ranked risk factors.
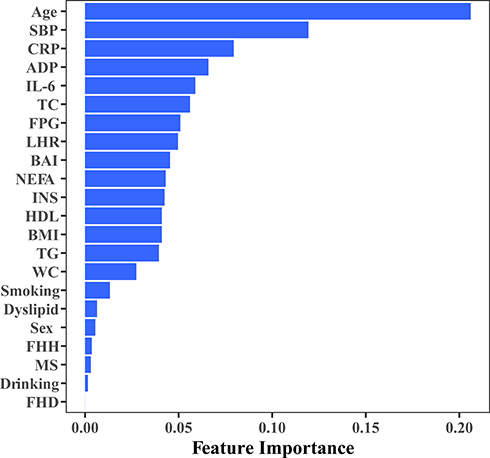 |
Figure 1 Feature importance of included variables obtained from a tuned random forest model. Abbreviations: SBP, systolic blood pressure; FPG, fasting plasma glucose; TG, triglycerides; TC, total cholesterol; HDL, high density lipoprotein; BMI, body mass index; BAI, body adiposity index; LHR, LDL/HDL ratio; INS, insulin; IL-6, interleukin 6; NEFA, nonesterified fatty acid; hs-CRP, high-sensitivity C-reactive protein; ADP, adiponectin; MetS, metabolic syndrome; FHH, family history of hypertension; FHD, family history of diabetes. |
Comparisons of Predictive Performance
The summary predictive performance metrics of all 7 ML models are shown in Table 2. All ML models had moderate to excellent discrimination (the AUCs ranged from 0.770 to 0.872). LR (AUC 0.872, 95% CI: 0.829–0.907), SVM (AUC 0.868, 95% CI: 0.825–0.904), KNN (AUC 0.845, 95% CI: 0.800–0.884), RF (AUC 0.840, 95% CI: 0.794–0.880) and NB (AUC 0.791, 95% CI: 0.740–0.835) performed similarly in discrimination and outperformed DT (AUC 0.770, 95% CI: 0.719–0.817). The discrimination of XGB (AUC 0.804, 95% CI: 0.754–0.847) was similar to that of DT but worse than that of LR, SVM, RF. The comparison of ROC was presented in Figure 2.
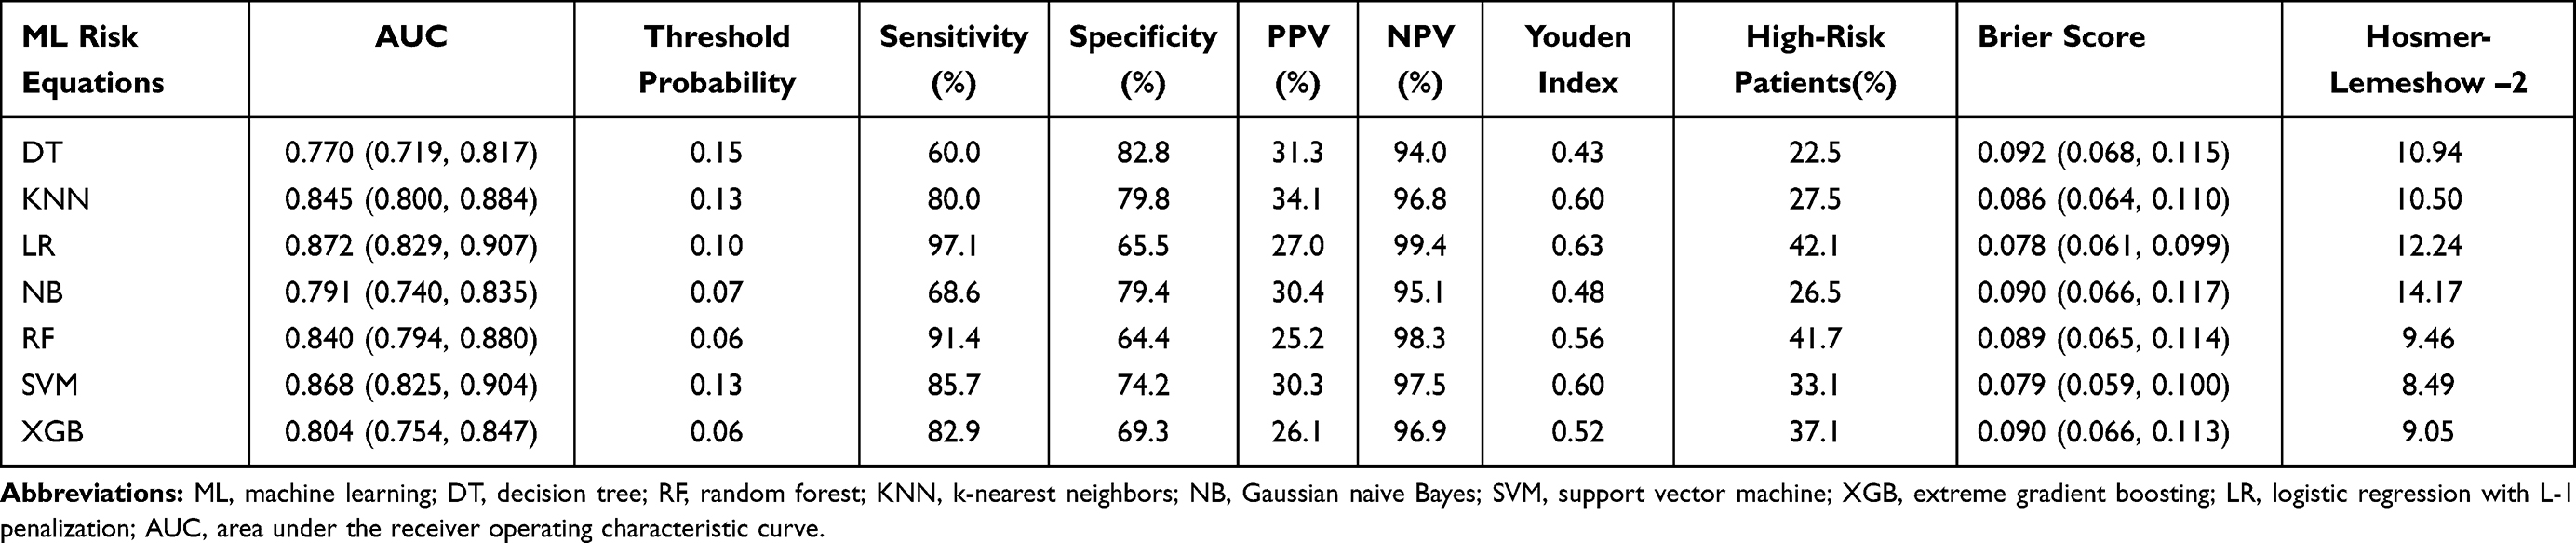 |
Table 2 Predictive Performance Metrics and Diagnostic Test Metrics of 7 ML-Based Models |
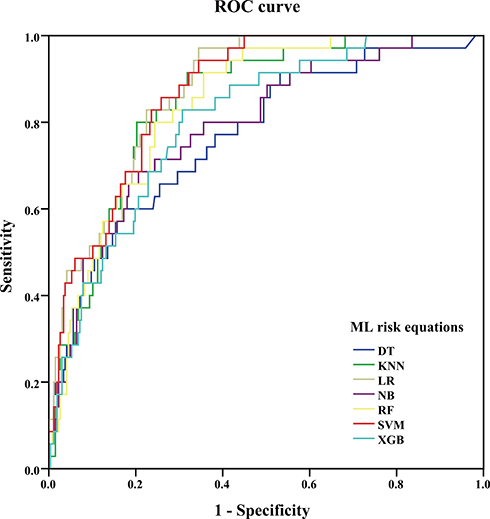 |
Figure 2 Receiver operator characteristic curves for 7 ML models in predicting CVD outcomes in Chinese Kazakhs. Abbreviations: CVD, cardiovascular disease; ML, machine learning; DT, decision tree; RF, random forest; KNN, k-nearest neighbors; NB, Gaussian naive Bayes; SVM, support vector machine; XGB, extreme gradient boosting; LR, logistic regression with L-1 penalization. |
Under an optimal threshold probability (0.10 for LR) which was determined by Youden index (0.63 for LR) to identify high-risk subjects, LR achieved a sensitivity of 97.1%, a specificity of 65.5%, a PPV of 27.0%, and an NPV of 99.4%, leaving 42.1% of subjects being identified as high risk. The optimal threshold for SVM was 0.13 with a lower Youden index (0.60), resulting in a sensitivity of 85.7%, a specificity of 74.2%, a PPV of 30.3%, and an NPV of 97.5%, and SVM predicted that nearly 33.1% of participants would develop CVD events. The KNN also had a relatively high Youden index (0.60), a sensitivity of 80.0%, a specificity of 79.8%, and the highest PPV of 34.1%. LR and DT had the highest sensitivity (97.1%) and specificity (82.8%), respectively. We could see from the results that all 7 ML models had low PPV and high NPV, which was induced by the low incidence rate of CVD in this study, this might influence their clinical utilities due to false-positive results.
As can be seen in Figure 3, each ML model had a different range of predicted probabilities, and the distribution of predicted risks for LR was similar to that of SVM. The predicted risks for subjects who developed CVD events were apparently higher than those who did not in each ML model. The plots also demonstrated that the risks of some subjects who did not develop CVD events were overestimated by all ML models, thus model predictive performance might be influenced.
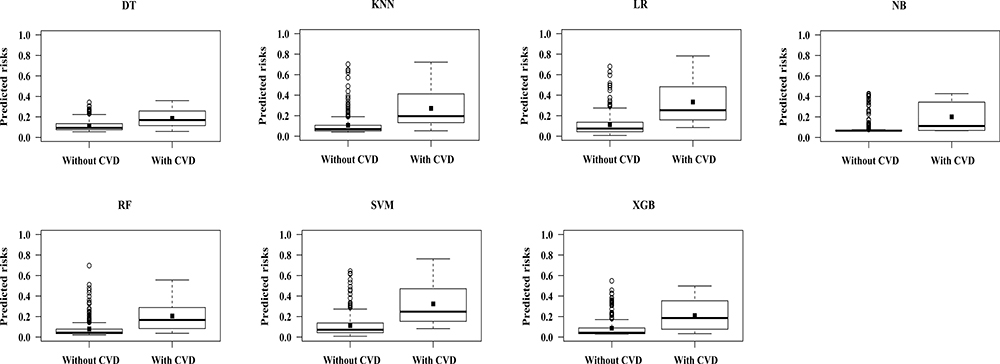 |
Figure 3 Distribution of predicted probabilities for subjects who developed CVD versus those who did not. Abbreviations: CVD, cardiovascular disease; ML, machine learning; DT, decision tree; RF, random forest; KNN, k-nearest neighbors; NB, Gaussian naive Bayes; SVM, support vector machine; XGB, extreme gradient boosting; LR, logistic regression with L-1 penalization. |
All ML models were well calibrated according to the Hosmer–Lemeshow test (all chi-square values <20 and all P values >0.05 in Table 2) in the test set. However, we could see from calibration plots in Figure 4 that LR nearly overestimated risks across all deciles and SVM demonstrated better calibration. SVM also overpredicted the risk of lowest deciles and had more accurate calibration in top deciles. LR had the lowest Brier score (0.078, 95% CI: 0.061–0.099), which was similar to that of SVM (0.079, 95% CI: 0.059–0.100). DT had the worst brier score of 0.092 (95% CI: 0.068–0.115).
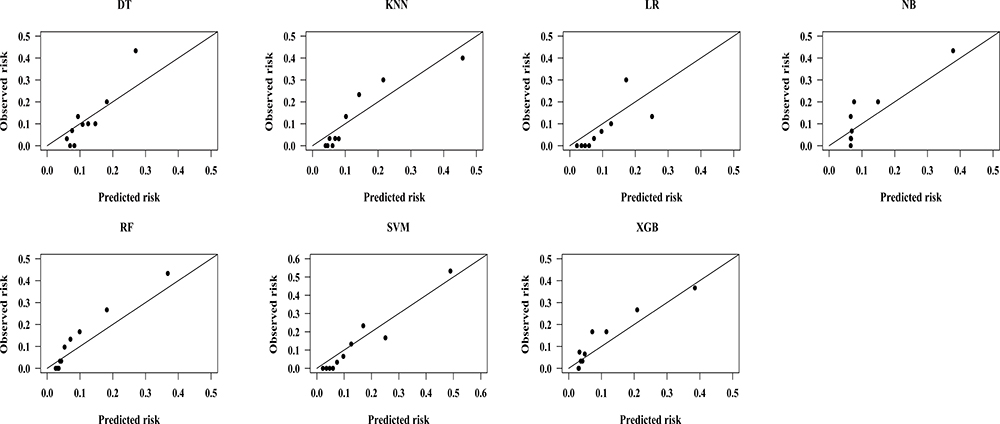 |
Figure 4 Calibration plots of 7 ML models in predicting CVD outcomes in Chinese Kazakhs. Abbreviations: CVD, cardiovascular disease; ML, machine learning; DT, decision tree; RF, random forest; KNN, k-nearest neighbors; NB, Gaussian naive Bayes; SVM, support vector machine; XGB, extreme gradient boosting; LR, logistic regression with L-1 penalization. |
LR and SVM had better predictive performance than other ML models in light of discrimination and calibration. Consequently, we performed DCA to examine their clinical usefulness and the results are shown in Figure 5 and Table 3. The DCA showed that they performed similarly. Under their optimal thresholds, LR achieved a net benefit of 0.077, indicating that use of the LR, compared with assuming that all subjects did not have CVD, led to the equivalent of a net 77 true-positive results per 1000 subjects without increasing the number of false-positive results, and the net benefit was higher than that of SVM (0.064). However, compared with assuming treating all subjects, use of the SVM would lead to the equivalent of 535 reductions in avoidable statins use per 1000 subjects without CVD and not increase the number of subjects with CVD left unscreened, the corresponding value of LR was slightly lower (533).
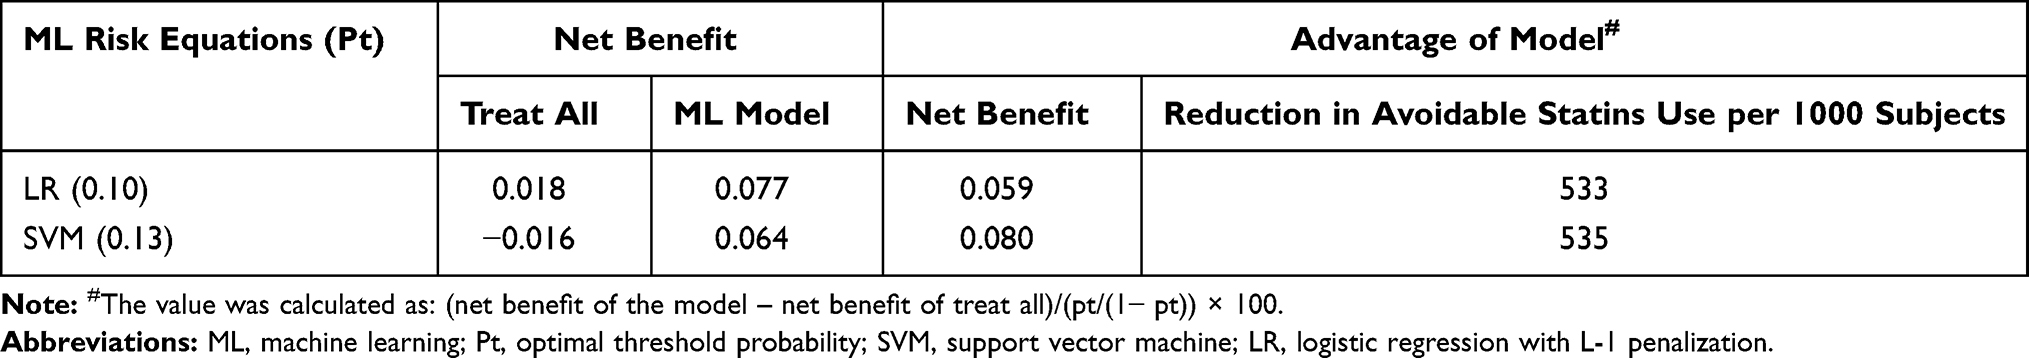 |
Table 3 Net Benefits for Identifying High-Risk Subjects with LR or SVM Using Their Own Optimal Threshold Probability |
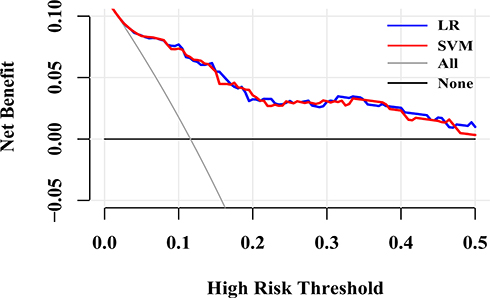 |
Figure 5 Decision curves for predicting CVD outcomes in Chinese Kazakhs using LR and SVM. Abbreviations: CVD, cardiovascular disease; SVM, support vector machine; LR, logistic regression with L-1 penalization. |
Discussions
In this study, the Kazakh Chinese population has a higher incidence of CVD compared with other reports, due to their genetic backgrounds, and high-salt and high-fat diets. A risk model for identifying the high-risk populations of developing CVD is in need. We aimed to examine the feasibility and usefulness of 7 ML-based models in predicting CVD risks. The results indicated that all of them had moderate to excellent discrimination and were well calibrated. The penalized LR had a similar predictive performance to SVM in predicting CVD risk and outperformed other ML models. The sensitivity of LR was higher than that of SVM, while the specificity had the opposite result. A higher specificity might be preferred in this Kazakh Chinese population, in which most of them were nomadic and the accessibility of medical resources was poor. Moreover, SVM performed slightly better than LR in light of calibration and DCA. Therefore, SVM and LR might be chose to identify high-risk subjects of developing CVD in this population and determine if taking risk-mitigation measures for the identified population to improve CVD outcomes in the process of clinical decision-making.
LR has been widely used for constructing predictive models in the clinic because of its interpretability and simplicity. A study designed to predict myocardial ischemia demonstrated that the predictive performance of LR was similar to that of SVM,36 which was consistent with our study. A recently published systematic review also suggested that ML showed no performance benefit over LR for clinical prediction models. They concluded that ML algorithms were data-hungry and when ML algorithms were used for small datasets and the predictors used for prediction are limited, LR might outperform ML models.37 The relatively small sample size and the L1 penalized method used in this study might be the reason why LR performed better than other ML models except for SVM.
SVM, a classical supervised ML algorithm used for classification, has gained its success in many fields.14,15 The basic idea of SVM is to find the hyperplane which has the maximum geometric margin and can separate the data correctly. It also has powerful kernel functions to solve the nonlinear classification problem efficiently. SVM has excellent performance in addressing the classification problems on the small sample, non-linear and high-dimensional data. SVM performed better than other ML models in our study, such as RF, consistent with results from Hyeonyong Hae.36 Results in our study indicated that SVM was suitable for the classification of CVD in this Kazakh Chinese population.
RF, one of ensemble learning methods, has proven to be a superior classifier in many cases.12,13,38,39 However, it only had moderate predictions as compared to LR and SVM. The small sample size in this study might limit the predictive performance of RF. We used RF to find potential predictors for CVD based on variable importance. Studies have suggested that RF could identify important but unexpected predictors.11
As expected, the result of feature selection based on RF showed that age was the most important predictor in the classification of CVD. However, several widely considered risk factors of CVD, such as smoking and alcohol drinking, were less predictive in this study. The synthetic indices, BAI and LHR were identified as strong predictors of CVD, consistent with previous studies.40–44 Inflammation is of vital importance in the formation and progression of atherosclerotic plaques and plays a critical role in the incidence of CVD.45 Several inflammatory cytokines have been identified as potential risk factors of CVD, such as hs-CRP and IL-6. Hs-CRP, an indicator of inflammation, was included as a predictor of CVD in the Reynolds Risk Score.46 Other epidemiological studies also indicated that hs-CRP was a decisive predictor of CVD and it has been recognized as a mediator in the pathogenesis of vascular disease and a reflection of endothelial dysfunction.47–50 Studies demonstrated that hs-CRP would destabilize atherosclerotic plaques through NO, IL-6, and prostacyclin, and increase the risk of plaque rupture.51 Moreover, hs-CRP might promote thrombosis and increase hypoxia-induced apoptosis of cardiomyocytes,52 which also provides evidence of hs-CRP as a critical risk factor of CVD. IL-6 was proven to be a maker of progressive atherosclerosis and might promote the growth of atherosclerotic plaques, thus it possibly brought about the incidence of CVD.53 For the prevention and control of CVD, we should pay more attention to the subjects with inflammation, who can use drugs, such as statins to reduce the risk of developing CVD. Hs-CRP and IL-6 can also be used as biomarkers in clinical to identify the high-risk subjects of CVD in the early stage.
Our study found that decreased ADP was associated with elevated risks of CVD. ADP, a hormone secreted by adipocytes, exerts anti-inflammatory effects by downregulating hs-CRP, reducing recruitment of lymphocytes in atherosclerotic lesions, inhibiting expressions of TNF-α, and promoting the production of anti-inflammatory cytokines.54–56 However, some studies have shown that increased ADP has a positive relationship with ischemic stroke.57 Studies have suggested that increased NEFA concentrations might be associated with CVD, which were similar to our study.58,59 Potential mechanisms of NEFA affecting CVD included a role in the development of type 2 diabetes, hypertension, metabolic syndrome, and endothelial damage.60–63 The risk of CVD can be reduced by controlling inflammation and treating subjects with decreased ADP.
Risk prediction models (eg, PCE and FRS) currently used in CVD fields were developed by traditional statistical methods; however, various studies have indicated that they were ill-calibrated while validating in external populations. ML algorithms have emerged as superior methods used for prediction with high dimensional and complex data in cardiology.64,65 No priori assumptions made by ML algorithms allows for more accurate and robust models with all available data, and ML can model more complex relationships between outcomes and predictors. Potential interactions between marginal predictors might be found ML to improve risk-stratification. Krittanawong et al66 suggested that ML could better identify new genotypes and phenotypes from heterogeneous CVDs, also had the power to identify additional risk factors of CVD. More advanced ML algorithms, such as deep learning and artificial neural network, have gained their successes in medical image recognition, early detection, diagnosis, outcome prediction, and prognosis evaluation.67–69 ML models may serve as accurate alternatives to current CVD risk-stratifications and can better facilitate cardiologists in clinical decision-making in the future. However, most ML models are difficult to interpret and complex to use for clinicians, this may limit their widespread use in the clinic.
Limitations
Our study also has some limitations. First, although we believe that this population is a good representation of the general Kazakh Chinese population, the sample size is relatively small. ML algorithms are data-hungry, the small sample size with limited predictors in this study may limit their performance in predictions. Second, a large proportion of subjects (14.85%) were lost to follow-up due to their nomadic lifestyle, the cohort is ongoing and we will try to supplement relevant information in the next follow-up. Third, there is no independent external validation population used in this study, the generalization of SVM and LR to other ethnic groups requires further investigation to ensure its accurate and robust prediction. Fourth, the influences of imbalanced data on predictive performance of prediction models have been well described.70,71 However, we did not use undersampling or oversampling methods to deal with imbalanced data.72,73 Instead, we obtained the optimal threshold probability by the Youden index instead of using the default 0.5 as the classification criterion of CVD and Non-CVD. Fifth, we only used data based on a single baseline measurement to develop models, but some variables may change over time. The time-varying effects or censoring were not taken into consideration while developing models, this may influence models’ predictive performance. There are several ML algorithms suitable for survival data, such as Bagging Survival Trees and Random Survival Forest, further study is required to verify the predictive accuracies of these ML algorithms in this population.
Conclusions
We investigated the feasibility and usefulness of 7 ML models in predicting CVD risks in this Kazakh Chinese population. We found that SVM and LR had a superior prediction than other ML models in light of discrimination, calibration, and DCA. SVM and LR can be applied to aid in clinical decision-making and improve CVD outcomes. Future research is needed to validate ML models’ accuracies with high dimensional data in this population.
Data Sharing Statement
The data used to support the findings of this study are available from the corresponding author (Shuxia Guo, [email protected]) upon reasonable request.
Ethics Approval and Consent to Participate
This study was approved by the Institutional Ethics Review Board (IERB) of the First Affiliated Hospital of Shihezi University School of Medicine (IERB No. SHZ2010LL01). All of the participants provided their written informed consent prior to the start of the study. All methods were carried out in accordance with relevant guidelines and regulations.
Acknowledgments
We sincerely thank those who participated in the study. We would also like to acknowledge the clinical laboratory of First Affiliated Hospital of Shihezi University School of Medicine for their work.
Author Contributions
All authors made a significant contribution to the work reported, whether that is in the conception, study design, execution, acquisition of data, analysis and interpretation, or in all these areas; took part in drafting, revising or critically reviewing the article; gave final approval of the version to be published; have agreed on the journal to which the article has been submitted; and agree to be accountable for all aspects of the work.
Funding
This study was funded by the Shihezi University Innovation Outstanding Young Talents Program (Natural Science) (No. CXPY201908), the National Natural Science Foundation of China (No. 81560551) and the Key Programs for Science and Technology from Xinjiang Production and Construction Corps (No. 2018AB017).
Disclosure
The authors declare that they have no conflicts of interest.
References
1. Zhou M, Wang H, Zhu J, et al. Cause-specific mortality for 240 causes in China during 1990–2013: a systematic subnational analysis for the Global Burden of Disease Study 2013. Lancet. 2016;387(10015):251–272. doi:10.1016/S0140-6736(15)00551-6
2. Collaborators GMaCoD. Global, regional, and national age-sex specific all-cause and cause-specific mortality for 240 causes of death, 1990–2013: a systematic analysis for the Global Burden of Disease Study 2013. Lancet. 2015;385(9963):117–171. doi:10.1016/S0140-6736(14)61682-2
3. Goldstein BA, Navar AM, Carter RE. Moving beyond regression techniques in cardiovascular risk prediction: applying machine learning to address analytic challenges. Eur Heart J. 2017;38(23):1805–1814. doi:10.1093/eurheartj/ehw302
4. Joint Task Force for Guideline on the Assessment and Management of Cardiovascular Risk in China. [Guideline on the Assessment and Management of Cardiovascular Risk in China]. Chin J Prev Med. 2019;53(1):13.
5. Goff DC
6. D’Agostino RB
7. Cook NR, Ridker PM. Calibration of the pooled cohort equations for atherosclerotic cardiovascular disease: an update. Ann Intern Med. 2016;165(11):786–794. doi:10.7326/M16-1739
8. Jung KJ, Jang Y, Oh DJ, et al. The ACC/AHA 2013 pooled cohort equations compared to a Korean risk prediction model for atherosclerotic cardiovascular disease. Atherosclerosis. 2015;242(1):367–375. doi:10.1016/j.atherosclerosis.2015.07.033
9. Lee CH, Woo YC, Lam JK, et al. Validation of the Pooled Cohort equations in a long-term cohort study of Hong Kong Chinese. J Clin Lipidol. 2015;9(5):640–646.e642. doi:10.1016/j.jacl.2015.06.005
10. Yang X, Li J, Hu D, et al. Predicting the 10-year risks of atherosclerotic cardiovascular disease in Chinese population: the China-PAR project (prediction for ASCVD risk in China). Circulation. 2016;134(19):1430–1440. doi:10.1161/CIRCULATIONAHA.116.022367
11. Ambale-Venkatesh B, Yang X, Wu CO, et al. Cardiovascular event prediction by machine learning: the Multi-Ethnic Study of Atherosclerosis. Circ Res. 2017;121(9):1092–1101. doi:10.1161/CIRCRESAHA.117.311312
12. Mortazavi BJ, Downing NS, Bucholz EM, et al. Analysis of machine learning techniques for heart failure readmissions. Circ Cardiovasc Qual Outcomes. 2016;9(6):629–640. doi:10.1161/CIRCOUTCOMES.116.003039
13. Ross EG, Shah NH, Dalman RL, Nead KT, Cooke JP, Leeper NJ. The use of machine learning for the identification of peripheral artery disease and future mortality risk. J Vasc Surg. 2016;64(5):1515–1522.e1513. doi:10.1016/j.jvs.2016.04.026
14. Berikol GB, Yildiz O, Özcan IT. Diagnosis of acute coronary syndrome with a support vector machine. J Med Syst. 2016;40(4):84. doi:10.1007/s10916-016-0432-6
15. Arslan AK, Colak C, Sarihan ME. Different medical data mining approaches based prediction of ischemic stroke. Comput Methods Programs Biomed. 2016;130:87–92. doi:10.1016/j.cmpb.2016.03.022
16. Christodoulou E, Ma J, Collins GS, Steyerberg EW, Verbakel JY, Van Calster B. A systematic review shows no performance benefit of machine learning over logistic regression for clinical prediction models. J Clin Epidemiol. 2019;110:12–22. doi:10.1016/j.jclinepi.2019.02.004
17. Mao L, Zhang X, Hu Y, et al. Nomogram based on cytokines for cardiovascular diseases in Xinjiang Kazakhs. Mediators Inflamm. 2019;2019:4756295. doi:10.1155/2019/4756295
18. Alberti KG, Zimmet P, Shaw J. The metabolic syndrome–a new worldwide definition. Lancet. 2005;366(9491):1059–1062. doi:10.1016/S0140-6736(05)67402-8
19. Joint Committee for Developing Chinese guidelines on Prevention and Treatment of Dyslipidemia in Adults. [Chinese guidelines on prevention and treatment of dyslipidemia in adults]. Zhonghua Xin Xue Guan Bing Za Zhi. 2007 May;35(5):390–419. Chinese.
20. Bergman RN. A better index of body adiposity. Obesity (Silver Spring). 2012;20(6):1135. doi:10.1038/oby.2012.99
21. Jiang Y, Ma R, Guo H, et al. External validation of three atherosclerotic cardiovascular disease risk equations in rural areas of Xinjiang, China. BMC Public Health. 2020;20(1):1471. doi:10.1186/s12889-020-09579-4
22. Quinlan R. Induction of decision trees. Mach Learn. 1986;1(1):81–106. doi:10.1007/BF00116251
23. Breiman L. Random forests. Mach Learn. 2001;45(1):5–32. doi:10.1023/A:1010933404324
24. Altman SN. An introduction to kernel and nearest-neighbor nonparametric regression. Am Stat. 1992;46(3):175–185.
25. Zhang H. The optimality of Naive Bayes. In:
26. Cortes C, Vapnik V. Support-vector networks. Mach Learn. 1995;20(3):273–297. doi:10.1007/BF00994018
27. Chen T, Guestrin C. XGBoost: a scalable tree boosting system. In:
28. Li L, Liu ZP. Biomarker discovery for predicting spontaneous preterm birth from gene expression data by regularized logistic regression. Comput Struct Biotechnol J. 2020;18:3434–3446. doi:10.1016/j.csbj.2020.10.028
29. Mockus J, Tiesis V, Zilinskas A. The Application of Bayesian Methods for Seeking the Extremum. 1978.
30. Platt J. Probabilistic outputs for support vector machines and comparisons to regularized likelihood methods. Adv Large Margin Classif. 2000;10.
31. DeLong ER, DeLong DM, Clarke-Pearson DL. Comparing the areas under two or more correlated receiver operating characteristic curves: a nonparametric approach (0006-341X (Print)). Biometrics. 1988:837–45.
32. Rufibach K. Use of brier score to assess binary predictions. J Clin Epidemiol. 2010;63(8):938–939; author reply 939. doi:10.1016/j.jclinepi.2009.11.009
33. Lemeshow S, Hosmer DW
34. Vickers AJ, Elkin EB. Decision curve analysis: a novel method for evaluating prediction models. Med Decis Making. 2006;26(6):565–574. doi:10.1177/0272989X06295361
35. Moons KG, Altman DG, Reitsma JB, et al. Transparent reporting of a multivariable prediction model for individual prognosis or diagnosis (TRIPOD): explanation and elaboration. Ann Intern Med. 2015;162(1):W1–73. doi:10.7326/M14-0698
36. Hae H, Kang SJ, Kim WJ, et al. Machine learning assessment of myocardial ischemia using angiography: development and retrospective validation. PLoS Med. 2018;15(11):e1002693. doi:10.1371/journal.pmed.1002693
37. van der Ploeg T, Austin PC, Steyerberg EW. Modern modelling techniques are data hungry: a simulation study for predicting dichotomous endpoints. BMC Med Res Methodol. 2014;14:137. doi:10.1186/1471-2288-14-137
38. Kakadiaris IA, Vrigkas M, Yen AA, Kuznetsova T, Budoff M, Naghavi M. Machine learning outperforms ACC/AHA CVD risk calculator in MESA. J Am Heart Assoc. 2018;7(22):e009476–e009476. doi:10.1161/JAHA.118.009476
39. Yang L, Wu H, Jin X, et al. Study of cardiovascular disease prediction model based on random forest in eastern China. Sci Rep. 2020;10(1):5245. doi:10.1038/s41598-020-62133-5
40. Moliner-Urdiales D, Artero EG, Lee D-C, España-Romero V, Sui X, Blair SN. Body adiposity index and all-cause and cardiovascular disease mortality in men. Obesity (Silver Spring). 2013;21(9):1870–1876. doi:10.1002/oby.20399
41. Nimkuntod P, Tongdee P. Plasma low-density lipoprotein cholesterol/high-density lipoprotein cholesterol concentration ratio and early marker of carotid artery atherosclerosis. J Med Assoc Thai. 2015;98(Suppl 4):S58–63.
42. Chen QJ, Lai HM, Chen BD, et al. Appropriate LDL-C-to-HDL-C ratio cutoffs for categorization of cardiovascular disease risk factors among uygur adults in Xinjiang, China. Int J Environ Res Public Health. 2016;13(2):235. doi:10.3390/ijerph13020235
43. Panagiotakos DB, Pitsavos C, Skoumas J, et al. Importance of LDL/HDL cholesterol ratio as a predictor for coronary heart disease events in patients with heterozygous familial hypercholesterolaemia: a 15-year follow-up (1987–2002). Curr Med Res Opin. 2003;19(2):89–94.
44. Fujihara K, Suzuki H, Sato A, et al. Carotid artery plaque and LDL-to-HDL cholesterol ratio predict atherosclerotic status in coronary arteries in asymptomatic patients with type 2 diabetes mellitus. J Atheroscler Thromb. 2013;20(5):452–464. doi:10.5551/jat.14977
45. Kosmas CE, Silverio D, Sourlas A, Montan PD, Guzman E, Garcia MJ. Anti-inflammatory therapy for cardiovascular disease. Ann Transl Med. 2019;7(7):147. doi:10.21037/atm.2019.02.34
46. Ridker PM, Paynter NP, Rifai N, Gaziano JM, Cook NR. C-reactive protein and parental history improve global cardiovascular risk prediction: the reynolds risk score for men. Circulation. 2008;118(22):2243–2251. doi:10.1161/CIRCULATIONAHA.108.814251
47. Dong Y, Wang X, Zhang L, et al. High-sensitivity C reactive protein and risk of cardiovascular disease in China-CVD study. J Epidemiol Community Health. 2019;73(2):188–192. doi:10.1136/jech-2018-211433
48. Devaraj S, Kumaresan PR, Jialal I. C-reactive protein induces release of both endothelial microparticles and circulating endothelial cells in vitro and in vivo: further evidence of endothelial dysfunction. Clin Chem. 2011;57(12):1757–1761. doi:10.1373/clinchem.2011.169839
49. Wilson PW, Pencina M, Jacques P, Selhub J, D’Agostino R
50. Sung KC, Ryu S, Chang Y, Byrne CD, Kim SH. C-reactive protein and risk of cardiovascular and all-cause mortality in 268,803 East Asians. Eur Heart J. 2014;35(27):1809–1816. doi:10.1093/eurheartj/ehu059
51. Montecucco F, Mach F. New evidences for C-reactive protein (CRP) deposits in the arterial intima as a cardiovascular risk factor. Clin Interv Aging. 2008;3(2):341–349. doi:10.2147/CIA.S2706
52. Badimon L, Peña E, Arderiu G, et al. C-reactive protein in atherothrombosis and angiogenesis. Front Immunol. 2018;9:430. doi:10.3389/fimmu.2018.00430
53. Zhang B, Li XL, Zhao CR, Pan CL, Zhang Z. Interleukin-6 as a predictor of the risk of cardiovascular disease: a meta-analysis of prospective epidemiological studies. Immunol Invest. 2018;47(7):689–699. doi:10.1080/08820139.2018.1480034
54. Woodward L, Akoumianakis I, Antoniades C. Unravelling the adiponectin paradox: novel roles of adiponectin in the regulation of cardiovascular disease. Br J Pharmacol. 2017;174(22):4007–4020. doi:10.1111/bph.13619
55. Ebrahimi-Mamaeghani M, Mohammadi S, Arefhosseini SR, Fallah P, Bazi Z. Adiponectin as a potential biomarker of vascular disease. Vasc Health Risk Manag. 2015;11:55–70. doi:10.2147/VHRM.S48753
56. Kumada M, Kihara S, Ouchi N, et al. Adiponectin specifically increased tissue inhibitor of metalloproteinase-1 through interleukin-10 expression in human macrophages. Circulation. 2004;109(17):2046–2049. doi:10.1161/01.CIR.0000127953.98131.ED
57. Hao G, Li W, Guo R, et al. Serum total adiponectin level and the risk of cardiovascular disease in general population: a meta-analysis of 17 prospective studies. Atherosclerosis. 2013;228(1):29–35. doi:10.1016/j.atherosclerosis.2013.02.018
58. Nomura SO, Karger AB, Weir NL, Duprez DA, Tsai MY. Free fatty acids, cardiovascular disease, and mortality in the Multi-Ethnic Study of Atherosclerosis. J Clin Lipidol. 2020;14(4):531–541. doi:10.1016/j.jacl.2020.06.005
59. Mathew M, Tay E, Cusi K. Elevated plasma free fatty acids increase cardiovascular risk by inducing plasma biomarkers of endothelial activation, myeloperoxidase and PAI-1 in healthy subjects. Cardiovasc Diabetol. 2010;9(1):9. doi:10.1186/1475-2840-9-9
60. Khawaja O, Bartz TM, Ix JH, et al. Plasma free fatty acids and risk of atrial fibrillation (from the Cardiovascular Health Study). Am J Cardiol. 2012;110(2):212–216. doi:10.1016/j.amjcard.2012.03.010
61. Fagot-Campagna A, Balkau B, Simon D, et al. High free fatty acid concentration: an independent risk factor for hypertension in the Paris Prospective Study. Int J Epidemiol. 1998;27(5):808–813. doi:10.1093/ije/27.5.808
62. Tripathy D, Mohanty P, Dhindsa S, et al. Elevation of free fatty acids induces inflammation and impairs vascular reactivity in healthy subjects. Diabetes. 2003;52(12):2882–2887. doi:10.2337/diabetes.52.12.2882
63. Zhang HW, Zhao X, Guo YL, et al. Free fatty acids and cardiovascular outcome: a Chinese cohort study on stable coronary artery disease. Nutr Metab (Lond). 2017;14(1):41. doi:10.1186/s12986-017-0195-1
64. Johnson KW, Torres Soto J, Glicksberg BS, et al. Artificial intelligence in cardiology. J Am Coll Cardiol. 2018;71(23):2668–2679. doi:10.1016/j.jacc.2018.03.521
65. Krittanawong C, Zhang H, Wang Z, Aydar M, Kitai T. Artificial intelligence in precision cardiovascular medicine. J Am Coll Cardiol. 2017;69(21):2657–2664. doi:10.1016/j.jacc.2017.03.571
66. Krittanawong C, Johnson KW, Rosenson RS, et al. Deep learning for cardiovascular medicine: a practical primer. Eur Heart J. 2019;40(25):2058–2073. doi:10.1093/eurheartj/ehz056
67. Gulshan V, Peng L, Coram M, et al. Development and validation of a deep learning algorithm for detection of diabetic retinopathy in retinal fundus photographs. JAMA. 2016;316(22):2402–2410. doi:10.1001/jama.2016.17216
68. Krittanawong C, Tunhasiriwet A, Zhang H, Wang Z, Aydar M, Kitai T. Deep learning with unsupervised feature in echocardiographic imaging. J Am Coll Cardiol. 2017;69(16):2100–2101. doi:10.1016/j.jacc.2016.12.047
69. Esteva A, Kuprel B, Novoa RA, et al. Dermatologist-level classification of skin cancer with deep neural networks. Nature. 2017;542(7639):115–118. doi:10.1038/nature21056
70. Blagus R, Lusa L. SMOTE for high-dimensional class-imbalanced data. BMC Bioinform. 2013;14(1):106. doi:10.1186/1471-2105-14-106
71. Li DC, Hu SC, Lin LS, Yeh CW, Zou Q. Detecting representative data and generating synthetic samples to improve learning accuracy with imbalanced data sets. PLoS One. 2017;12(8):e0181853. doi:10.1371/journal.pone.0181853
72. Smith MR, Martinez T, Giraud-Carrier C. An instance level analysis of data complexity. Mach Learn. 2014;95(2):225–256. doi:10.1007/s10994-013-5422-z
73. Han H, Wang W-Y, Mao B-H. Borderline-SMOTE: a new over-sampling method in imbalanced data sets learning. In:
 © 2021 The Author(s). This work is published and licensed by Dove Medical Press Limited. The full terms of this license are available at https://www.dovepress.com/terms.php and incorporate the Creative Commons Attribution - Non Commercial (unported, v3.0) License.
By accessing the work you hereby accept the Terms. Non-commercial uses of the work are permitted without any further permission from Dove Medical Press Limited, provided the work is properly attributed. For permission for commercial use of this work, please see paragraphs 4.2 and 5 of our Terms.
© 2021 The Author(s). This work is published and licensed by Dove Medical Press Limited. The full terms of this license are available at https://www.dovepress.com/terms.php and incorporate the Creative Commons Attribution - Non Commercial (unported, v3.0) License.
By accessing the work you hereby accept the Terms. Non-commercial uses of the work are permitted without any further permission from Dove Medical Press Limited, provided the work is properly attributed. For permission for commercial use of this work, please see paragraphs 4.2 and 5 of our Terms.