")
Back to Journals » International Journal of Chronic Obstructive Pulmonary Disease » Volume 13
Cardiopulmonary exercise test and PaO2 in evaluation of pulmonary hypertension in COPD
Authors Skjørten I, Hilde JM , Melsom MN, Hisdal J , Hansteen V, Steine K, Humerfelt S
Received 26 August 2017
Accepted for publication 22 October 2017
Published 22 December 2017 Volume 2018:13 Pages 91—100
DOI https://doi.org/10.2147/COPD.S150034
Checked for plagiarism Yes
Review by Single anonymous peer review
Peer reviewer comments 2
Editor who approved publication: Dr Richard Russell
Ingunn Skjørten,1,2 Janne Mykland Hilde,3 Morten Nissen Melsom,1 Jonny Hisdal,4 Viggo Hansteen,5 Kjetil Steine,2,3 Sjur Humerfelt6
1Department of Pulmonary Medicine, LHL Glittre Clinic, Hakadal, 2Faculty of Medicine, University of Oslo, Oslo, 3Department of Cardiology, Akershus University Hospital, Lørenskog, 4Section of Vascular Investigations, 5Department of Cardiology, Oslo University Hospital-Aker, 6Clinic of Allergology and Respiratory Medicine, Oslo, Norway
Background: Exercise tolerance decreases as COPD progresses. Pulmonary hypertension (PH) is common in COPD and may reduce performance further. COPD patients with and without PH could potentially be identified by cardiopulmonary exercise test (CPET). However, results from previous studies are diverging, and a unified conclusion is missing. We hypothesized that CPET combined with arterial blood gases is useful to discriminate between COPD outpatients with and without PH.
Methods: In total, 93 COPD patients were prospectively included. Pulmonary function tests, right heart catheterization, and CPET with blood gases were performed. The patients were divided, by mean pulmonary artery pressure, into COPD-noPH (<25 mmHg) and COPD-PH (≥25 mmHg) groups. Linear mixed models (LMMs) were fitted to estimate differences when repeated measurements during the course of exercise were considered and adjusted for gender, age, and airway obstruction.
Results: Ventilatory and/or hypoxemic limitation was the dominant cause of exercise termination. In LMM analyses, significant differences between COPD-noPH and COPD-PH were observed for PaO2, SaO2, PaCO2, ventilation, respiratory frequency, and heart rate. PaO2 <61 mmHg (8.1 kPa) during unloaded pedaling, the only load level achieved by all the patients, predicted PH with a sensitivity of 86% and a specificity of 78%.
Conclusion: During CPET, low exercise performance and PaO2 strongly indicated PH in COPD patients.
Keywords: COPD, pulmonary hypertension, right heart catheterization, cardiopulmonary exercise test, hypoxemia
Introduction
Exercise tolerance in patients with COPD is reduced due to ventilatory limitation, gas exchange abnormalities, and deconditioning as the disease progresses, and this may impair functional capacity and the quality of life.1,2 Pulmonary hypertension (PH) is a common complication in COPD3–5 associated with increased mortality.6,7 COPD patients usually terminate physical activity when the ventilatory requirement exceeds their maximal ventilatory capacity. If they have PH, the altered hemodynamic response may reduce their exercise capacity further.
Impaired exercise tolerance in COPD patients would suggest that cardiopulmonary exercise test (CPET) is a valuable tool to reveal whether they have PH or not. However, results from previous studies are diverging, and it is still considered difficult to separate COPD patients with and without PH based on the CPET variables. Different outcomes are partially explained by differences in study populations of highly selected patients, different exercise protocols, or different methods for diagnosing PH, where right heart catheterization (RHC) represents the gold standard. In the evaluation of PH in COPD patients, it is relevant to consider left heart function, as arterial hypertension and left ventricle diastolic dysfunction, important causes of postcapillary PH, are frequent in COPD and make it difficult to distinguish whether the PH is caused by COPD, left heart disease, or a combination.8,9
Most of the previous studies are retrospective.10–13 There are few prospective, invasive studies of nonselected COPD populations with PH presenting CPET results,14,15 which gives a rationale for the present study where we included COPD outpatients with varying degrees of airway obstruction. The patients represented a typical and stable COPD population, with the important exception that those with any signs of left heart disease had been thoroughly excluded to rule out postcapillary components to PH.
The aim of the present study was to evaluate the entire course of exercise during CPET in COPD outpatients. We hypothesized that CPET with arterial blood gases could discriminate between COPD patients with and without PH.
Methods
Study subjects
The present cross-sectional study enrolled 93 consecutive COPD patients from the pulmonary outpatient clinic at Oslo University Hospital-Aker, during the period 2006–2010. Patients were Caucasians, aged 40–75 years, all current or former smokers with a smoking history of more than 10 pack-years. They had stable disease without exacerbation for the last 2 months. Prior to inclusion, the COPD diagnosis was verified by spirometry before and after bronchodilation,16 and treatment was optimized. Seven patients received long-term oxygen treatment (LTOT), and four patients had oxygen administration only during exercise. Patients underwent thorough pulmonary and cardiologic preinclusion screening, and those with pulmonary disease other than COPD and emphysema, as well as arrhythmia, valvular or coronary heart disease, or left ventricle dysfunction, were excluded. In addition, patients with obstructive sleep apnea syndrome, pulmonary embolism, systemic hypertension ≥160/90 mmHg, inflammatory diseases, hyperthyroidism, renal failure, or inability to exercise on bicycle were excluded. Patients using β-blockers, clopidogrel, or anticoagulating agents were also excluded. A detailed description of the inclusion process has previously been published,4,17 as we have reported on hemodynamic and echocardiographic data, as well as pulmonary function at rest in this cohort. The study was approved by the Regional Ethics Committee South East Norway (274-07127a 1.2007.1085) and performed according to the Declaration of Helsinki. Written informed consent was obtained from all the participants.
Study protocol
All study tests were performed within 2 consecutive days: CPET on the first day and RHC on the next day. Patients were instructed to take their regular medication. All the tests were performed without supplemental oxygen, even for the patients usually receiving LTOT.
Spirometry, body plethysmography, and diffusion capacity for carbon monoxide measurements (MasterScreen™ PFT; Jaeger, Würzburg, Germany) were performed according to the guidelines, and % predicted values were calculated.18–20 Maximal voluntary ventilation maneuver was performed prior to exercise with patients ventilating with maximal effort for 10 seconds to estimate maximal minute ventilation ( E).
E).
CPET was performed on electronically braked cycle ergometer (Ergoline Variobike 550; Jaeger) with all patients breathing ambient air. Oxygen uptake (O2), carbon dioxide output (CO2), and minute E were measured breath by breath (Oxycon Delta; Jaeger). The equipment was calibrated prior to every test. An incremental protocol, with a fixed cadence at 60 rpm, was applied, starting with 4 minutes of unloaded pedaling, 4 minutes of 25 W, followed by increments of 10 W every second minute until exhaustion. Variables for each exercise level were recorded every 30 seconds, and the median value for each level was denoted. Peak workload and O2 were defined as the highest level that could be performed for a minimum of 30 seconds. Oxygen (O2) pulse was calculated by dividing O2 by heart rate (HR). Ventilatory equivalent for CO2 (E/CO2) was calculated, and E/CO2 nadir was defined as the lowest value on the curve during exercise. Norwegian reference values for CPET were applied.21 Arterial blood samples were obtained from a radial artery cannula at rest, every fourth minute during exercise and at peak exercise. Systemic blood pressure was measured invasively (BIOPAC® Systems, Goleta, CA, USA) through the radial artery line. Anaerobic threshold (AT) was defined as the O2 where arterial lactate equaled 3 mmol/L. From two adjacent measurements, we performed linear interpolation of the point where lactate equaled 3 mmol/L with the corresponding O2, well aware that this was a crude estimate, as lactate rises in a curvilinear way; thus, AT could be slightly underestimated.
RHC (Mac-Lab; GE Healthcare, Milwaukee, WI, USA) was performed with the patient in the supine position. Via the antecubital or femoral vein, a 7-F Swan-Ganz™ catheter was advanced to the pulmonary artery guided by fluoroscopy. Pressure was balanced against atmospheric pressure, and the zero reference level was at mid-axillary line at right atrial level. Cardiac output was estimated by thermodilution technique, averaging three or five measurements.22 Measurements of mean pulmonary arterial pressure (mPAP), right atrial pressure, pulmonary capillary wedge pressure (PCWP), and right ventricle pressure were performed at end expiration.
COPD patients with mPAP ≥25 or mPAP <25 mmHg will be referred to as COPD-PH and COPD-noPH, respectively.22
Statistical method
Continuous variables were expressed as mean and standard deviation. Crude differences between COPD-noPH and COPD-PH groups were assessed with independent sample t-test or Mann–Whitney U-test as appropriate. To analyze between-group differences regarding CPET parameters, linear mixed models (LMMs) for repeated measures were fitted. A diagonal covariance structure was used to model dependencies among measurements for each subject at multiple time points during exercise. Each time point represented a certain load. Measurements at every time point (load) were considered, including rest, and LMMs therefore were adjusted for baseline differences. Models for each outcome included measurement occasion (load level), grouping of subjects (COPD-noPH and COPD-PH), and interaction between load level and group. Further, LMMs were adjusted for gender, age, and forced expiratory volume in 1 second (FEV1) (L) to test for potential confounders. Model fit was better for the load levels both groups could perform; therefore, we chose to restrict analyses up to 85 W. However, the results would have been the same if all levels were included.
Receiver operating characteristic (ROC) curve analysis was performed to test diagnostic accuracy and optimal cutoff value for the ability of a CPET variable to discriminate between COPD-noPH and COPD-PH. P-values <0.05 were considered statistically significant; all tests were two-sided. The analyses were performed by using IBM SPSS Statistics, Version 22 (IBM Corporation, Armonk, NY, USA).
Results
PH according to the current guidelines was observed in 24% of the patients with COPD. The majority had mild-to-moderate elevation of mPAP (range 25–35 mmHg) and PCWP <15 mmHg. Three patients, characterized by severe emphysema, had mPAP in the range of 35–40 mmHg.
The COPD-PH patients had more advanced pulmonary disease, with more airway obstruction, hyperinflation, impaired gas diffusion capacity, and hypoxemia (Table 1). There was no difference between the groups in systemic blood pressure (Tables 1 and 2), although well-treated systemic hypertension was present in 31% of the patients. Diabetes was present in 8% of the patients.
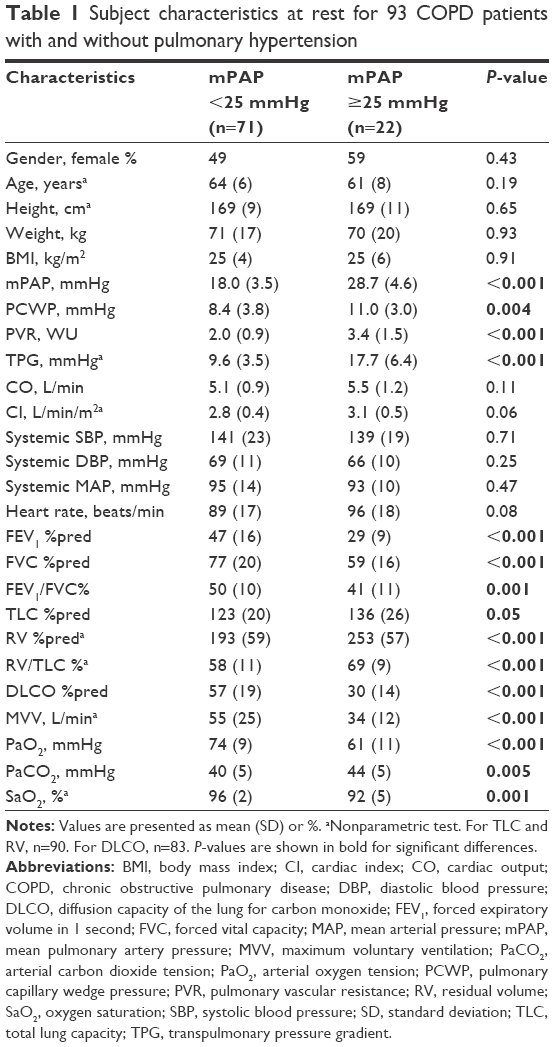 | Table 1 Subject characteristics at rest for 93 COPD patients with and without pulmonary hypertension |
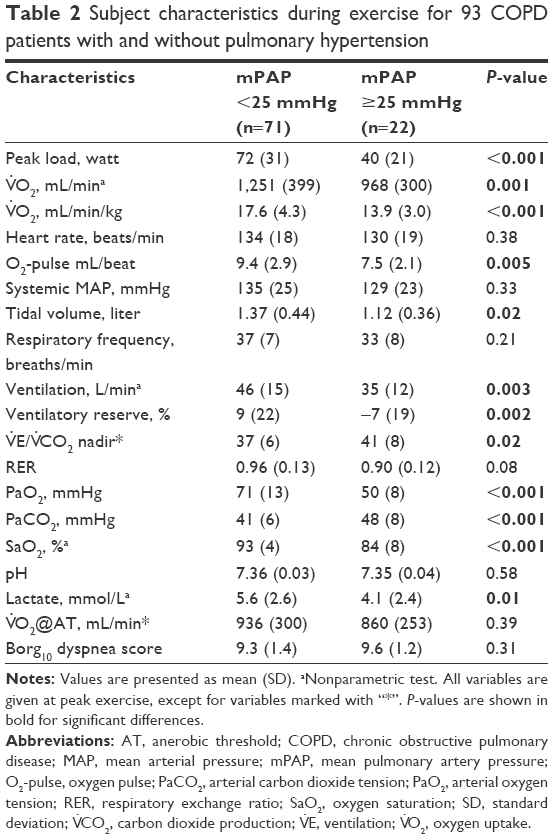 | Table 2 Subject characteristics during exercise for 93 COPD patients with and without pulmonary hypertension |
Ventilatory limitation was the main reason for exercise termination, as 69% of the patients experienced a ventilatory reserve <15%. Hypoxemia was strongly contributing to the low exercise capacity in COPD-PH, as 14 subjects (64%) developed PaO2 <53 mmHg. In total, 23% of the cohort did not reach AT.
Exercise capacity was severely reduced in COPD-PH compared with COPD-noPH (Table 2). The COPD-PH patients achieved significantly lower load, O2, O2-pulse, and E at peak exercise. There was no difference in HR at peak exercise. However, this implies that PH patients achieved the same HR at a significantly lower load than COPD-noPH (40±21 vs 72±31 W, respectively; P<0.001). When comparing exercise responses, it is relevant to compare variables achieved at the same load (Figure 1) and preferably evaluate the entire course of exercise.
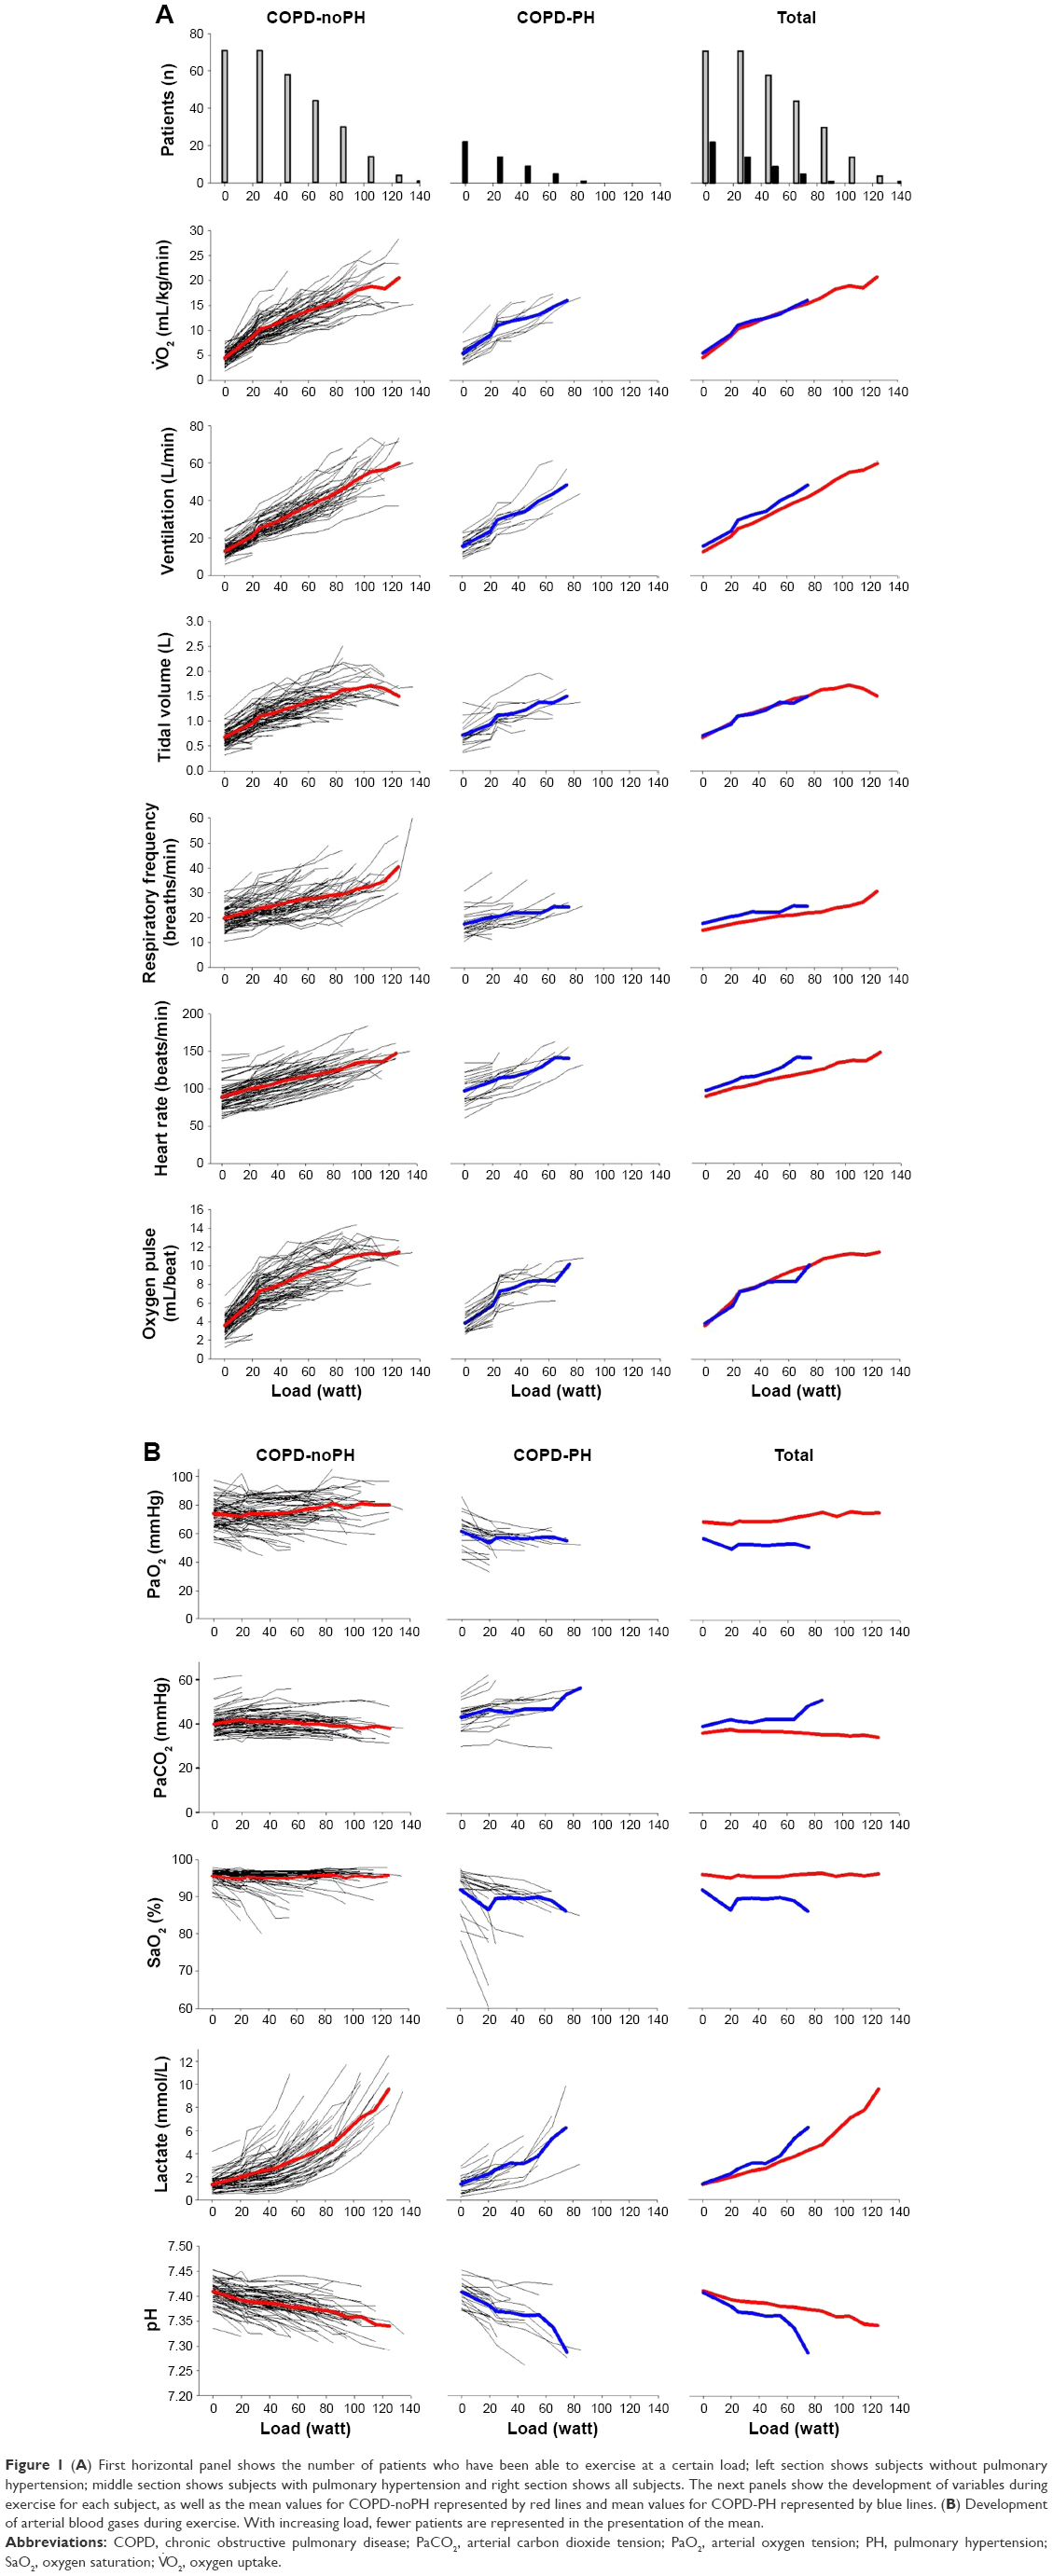 | Figure 1 (A) First horizontal panel shows the number of patients who have been able to exercise at a certain load; left section shows subjects without pulmonary hypertension; middle section shows subjects with pulmonary hypertension and right section shows all subjects. The next panels show the development of variables during exercise for each subject, as well as the mean values for COPD-noPH represented by red lines and mean values for COPD-PH represented by blue lines. (B) Development of arterial blood gases during exercise. With increasing load, fewer patients are represented in the presentation of the mean. |
When applying the LMM analyses, we found that the observed difference in O2/kg between the COPD-PH and COPD-noPH groups was not related to PH, but to load level and gender, as well as FEV1. There was no difference in HR at peak exercise between the two groups, but when we considered all HR measurements during exercise and controlled for gender, age, and airway obstruction, we found that PH affected HR significantly (P=0.01). For O2-pulse, our data revealed the opposite; the difference observed between COPD-noPH and COPD-PH at peak exercise (Table 2) was not associated with PH when we considered all O2-pulse measurements and controlled for gender, age, and FEV1 (Table 3). Arterial oxygen tension (PaO2) and oxygen saturation (SaO2) were lower and carbon dioxide tension (PaCO2) was higher in COPD-PH in comparison with COPD-noPH at peak exercise (Table 2). Similar relationship was also identified when we fitted LMM analyses; adjusted for gender, age, and FEV1, we found that PaO2, SaO2, and PaCO2 were all significantly affected by the presence of PH (P<0.001 for all). E (P=0.01) and respiratory frequency (Rf; P=0.02) were also significantly affected by the presence of PH, whereas tidal volume (VT) and E/CO2 were not. Arterial lactate was not significantly affected by the presence of PH, but pH was (P=0.03).
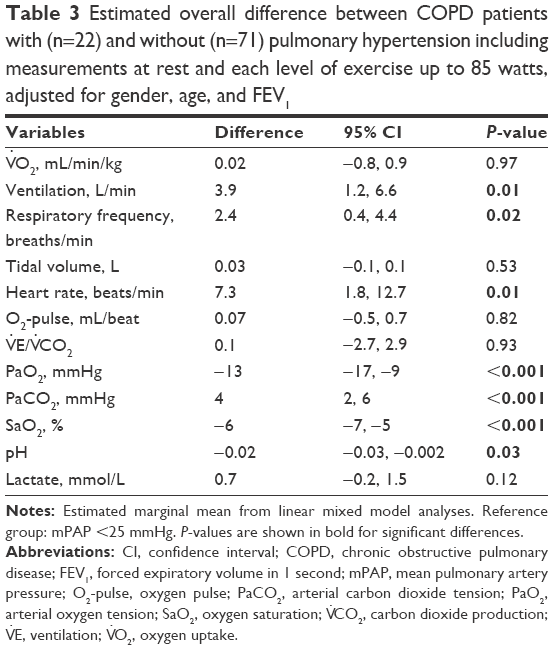 | Table 3 Estimated overall difference between COPD patients with (n=22) and without (n=71) pulmonary hypertension including measurements at rest and each level of exercise up to 85 watts, adjusted for gender, age, and FEV1 |
The most striking difference between patients with and without PH was the difference in the maximal load they could perform (Figure 1). None of the COPD patients with PH were able to bicycle >85 W, whereas 30% of COPD-noPH reached a higher load. To make a simple algorithm in order to predict PH, we focused on the patients who performed ≤85 W. We observed that 8 of 22 (36%) COPD-PH subjects performed unloaded pedaling as their maximal load, in contrast to 8 of 71 (11%) subjects in the COPD-noPH group (Figure 1). To be able to compare COPD-noPH and COPD-PH groups at the same load, we chose unloaded pedaling as our target level and applied ROC curves for the variables associated with PH in our LMM analyses (Figure 2). The ability to discriminate between COPD-noPH and COPD-PH groups was best for PaO2, as ROC curve demonstrated an area under the curve (AUC) of 0.86 (95% confidence interval [CI] [0.78, 0.95], P<0.001), the same result as for SaO2. ROC curve for PaCO2 showed AUC of 0.71 (95% CI [0.57, 0.85], P=0.01). HR gave AUC of 0.64 (95% CI [0.49, 0.79], P=0.06). ROC curves for E, Rf, and pH at unloaded pedaling were not useful in this respect.
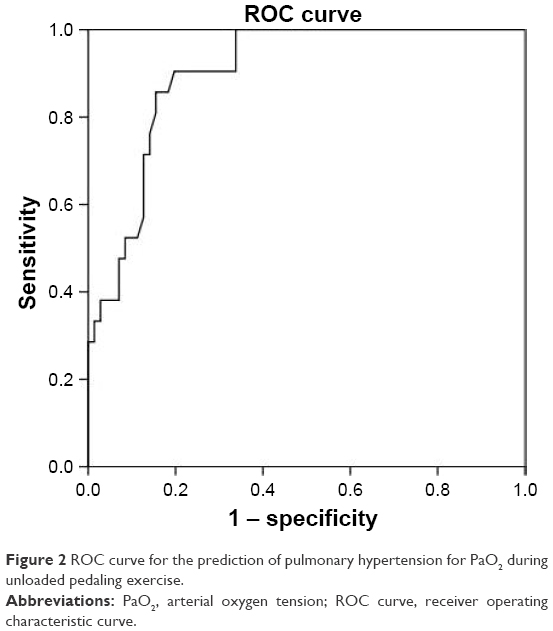 | Figure 2 ROC curve for the prediction of pulmonary hypertension for PaO2 during unloaded pedaling exercise. |
Our data revealed that PH is unlikely if a COPD patient is able to bicycle >85 W. For patients who perform <85 W, the evaluation of PaO2 during unloaded pedaling is useful, as a cutoff value of 61 mmHg will predict PH with a sensitivity of 86% and a specificity of 78% (Figure 3).
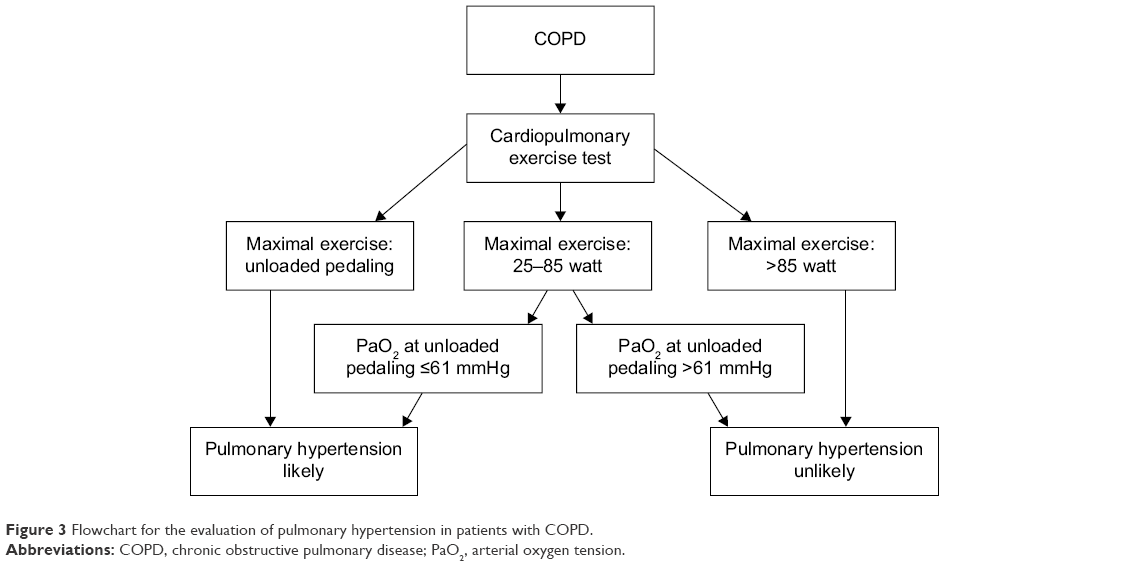 | Figure 3 Flowchart for the evaluation of pulmonary hypertension in patients with COPD. |
Discussion
The present study shows that CPET can be a valuable tool in detecting PH in an outpatient COPD population without any clinical signs of left heart disease. We were not able to discriminate fully between patients with and without PH, as the results were overlapping, but certain CPET findings were highly indicative of PH.
The COPD population studied is characterized by the exclusion of left heart disease to avoid postcapillary components to PH; otherwise, it represents a common, unselected population with a broad range of airway obstruction. However, due to this study design, we found significant differences in pulmonary function between patients with and without PH. One can argue that the observed differences between the two groups are more related to differences in airway obstruction than in pulmonary hemodynamics, and we agree that the differences in pulmonary function may to some extent explain the differences during exercise. To control for differences in load and pulmonary function, we therefore applied a statistical model that allowed us to consider the number of load levels performed, and to minimize the confounding effect of airway obstruction, we corrected for FEV1, as well as gender and age. With this model, we identified significant differences for HR, E, Rf, SaO2, PaO2, PaCO2, and pH.
The strong impact of blood gases is visualized in Figure 1, and calculations confirmed significant differences at rest, peak exercise, and when all exercise levels were included. Hypoxia has a role in the development of PH in pulmonary disease, and we have earlier shown that PaO2 is a strong predictor of mPAP in COPD patients.17 Alveolar hypoxia induces vasoconstriction in pulmonary vessels, and when chronic, it causes remodeling of the small muscular arteries, increasing pulmonary artery pressure. Remodeling of vessels has also been shown in normoxic smokers,23 indicating that inflammatory mechanisms also contribute to PH in COPD patients. The remodeling causes worsening of gas diffusion capacity, which is already low in COPD patients with emphysema. The resulting hypoxemia reflects alveolar hypoxia, pulmonary vascular dysfunction, and E perfusion mismatch and has a detrimental effect on exercise capacity.
In our LMM, O2 was not related to PH, and as shown in Figure 1, both groups had similar O2 at a given load. There was no significant difference in HR at rest or peak exercise; however, LMM analyses confirmed that PH had a significant effect on HR. The higher HR in COPD-PH may reflect increased sympathetic activity, and both hypoxemia and impaired ventricular function are associated with tachycardia. We have previously documented compromised right heart function for the COPD-PH group,24 which might influence both HR and O2-pulse, but in LMM analysis, we were not able to show significant effect of PH regarding O2-pulse. E was lower in COPD-PH at peak exercise, as expected with more severe airway obstruction. However, in LMM analyses, when we considered all measurements and adjusted for airway obstruction, E was actually higher in COPD-PH, possibly due to the effects of PaCO2, PaO2, and lactate. LMM analyses revealed higher breathing frequency in COPD-PH than in COPD-noPH, whereas VT was similar. Unfortunately, inspiratory capacity was not measured during exercise, but these findings may be associated with dynamic hyperinflation.
Despite the differences in pulmonary function between COPD-noPH and COPD-PH in our study, it is relevant to compare our results to those of studies of more uniform COPD cohorts. Unlike our study, most studies have not been able to demonstrate significant differences in peak work load and O2 between COPD patients with and without PH.10,11,14 However, Thirapatarapong et al found significant differences in work load and O2 in a study of comparable size including 98 COPD/emphysema patients with FEV1 <50% predicted evaluated for lung transplant, volume reduction surgery, or rehabilitation.13 Like our study, Thirapatarapong et al also demonstrated that O2-pulse was significantly lower in COPD-PH, although they found lower values in both the groups than we did (5.0 vs 7.5 mL/beat in COPD-PH and 5.2 vs 9.4 mL/beat in COPD-noPH). Other studies have not found differences in O2-pulse.10,11 E/CO2 is an indicator of E/perfusion mismatch, and similar to our observations, Holverda et al found significantly higher E/CO2 nadir in COPD-PH in a study of 25 patients with moderate-to-severe COPD.11 The lower PaO2 and SaO2 at rest and peak exercise in patients with PH in our study are also demonstrated in other studies,11,14,15 emphasizing the important role of blood gases in the evaluation of PH in COPD.
Patients with pulmonary arterial hypertension often demonstrate low AT.25 In COPD patients, AT is more difficult to evaluate by ventilatory methods, as they often terminate exercise at the moment they reach ventilatory compensation point; thus, we chose to define AT as the O2 where arterial lactate is 3 mmol/L. The arterial cannula made repeated lactate measurements possible and allowed a more accurate evaluation of AT. To have an arterial cannula inserted is more time-consuming and discomforting for the patient; however, we consider it well worth the effort as repeated blood gas and lactate measurements provide very useful information. We did not experience any adverse events related to the arterial cannula.
In our cohort, even for patients with mPAP in the higher range, we found predominantly ventilatory exercise limitation. Mean ventilatory reserve capacity was fully exhausted in COPD-PH, and one can discuss the rationale for identifying mild-to-moderate PH in those patients, as E and hypoxemia were the major contributors to exercise limitation. Moreover, vasodilating agents have a detrimental effect on PaO2 in patients with COPD,26 and PH-specific medication is not recommended.22 However, identifying PH in COPD pinpoints patients at risk who need extra support in terms of bronchodilating treatment and oxygen supplement. In the future, they may be the target of anti-inflammatory treatment inhibiting remodeling of pulmonary vessels. When suspecting PH in COPD, an exercise test demonstrating maximal load <85 W and PaO2 <61 mmHg during unloaded pedaling justifies referral to further investigations by a cardiologist.
Limitations
In order to study only precapillary PH in COPD, many patients with common comorbidities were excluded from the study; thus, our findings may not be applicable to the general COPD population.
COPD patients experience enhanced pressure swings during the respiratory cycle, and the intrathoracic pressure transmits to pulmonary vasculature.27,28 We have measured pulmonary artery pressures at end expiration, which may overestimate mPAP, and unfortunately, we have not been able to compensate for respiratory fluctuations. We do believe, however, that our data do not deviate much from the true result, as the pressure swings are less important at rest compared with during exercise where they are augmented by dynamic hyperinflation.
We have not measured end-tidal pressures of CO2 (PET CO2) as the equipment available for the study did not have this option. PET CO2 could have provided additional information about E/perfusion mismatch.
The reference values we have used for CPET were from treadmill exercise,21 whereas the study patients exercised on a cycle ergometer. About 10% lower O2 would be expected when cycling, leading to a false low O2 %predicted value. However, as the aim was to compare the groups, this limitation did not affect our results.
Conclusion
The present study of COPD outpatients with a broad range of airway obstruction showed significant differences during CPET for COPD patients with and without PH. We observed that although multiple variables differed at rest and peak exercise, only PaO2, PaCO2, SaO2, pH, HR, E, and Rf differed in a statistical model that considered the entire course of exercise and adjusted for gender, age, and FEV1. If load >85 W was achieved, PH was unlikely. If unloaded pedaling was the maximal load achieved, PH was observed in 50%. PaO2 was the parameter that best discriminated between COPD-noPH and COPD-PH. CPET alone was not able to fully diagnose COPD patients with PH, but very low exercise performance and PaO2 strongly indicated PH.
Acknowledgments
The study was funded by the Norwegian Extra Foundation (Ref: 2008/2/0076), South-Eastern Norway Regional Health Authority (Ref: 2007006), and Oslo University Hospital. Staff at Oslo University Hospital participated in data collection. The sponsors were not involved in study design, analysis, or the writing of the manuscript.
Disclosure
The authors report no conflicts of interest in this work.
References
Ketelaars CA, Schlosser MA, Mostert R, Huyer Abu-Saad H, Halfens RJ, Wouters EF. Determinants of health-related quality of life in patients with chronic obstructive pulmonary disease. Thorax. 1996;51(1):39–43. | ||
O’Donnell DE, Elbehairy AF, Faisal A, Webb KA, Neder JA, Mahler DA. Exertional dyspnoea in COPD: the clinical utility of cardiopulmonary exercise testing. Eur Respir Rev. 2016;25(141): 333–347. | ||
Chaouat A, Naeije R, Weitzenblum E. Pulmonary hypertension in COPD. Eur Respir J. 2008;32(5):1371–1385. | ||
Hilde JM, Skjorten I, Hansteen V, et al. Haemodynamic responses to exercise in patients with COPD. Eur RespirJ. 2013;41(5): 1031–1041. | ||
Naeije R. Pulmonary hypertension and right heart failure in chronic obstructive pulmonary disease. Proc Am Thorac Soc. 2005;2(1):20–22. | ||
Andersen KH, Iversen M, Kjaergaard J, et al. Prevalence, predictors, and survival in pulmonary hypertension related to end-stage chronic obstructive pulmonary disease. J Heart Lung Transplant. 2012;31(4):373–380. | ||
Cuttica MJ, Kalhan R, Shlobin OA, et al. Categorization and impact of pulmonary hypertension in patients with advanced COPD. Respir Med. 2010;104(12):1877–1882. | ||
Lam CS, Roger VL, Rodeheffer RJ, Borlaug BA, Enders FT, Redfield MM. Pulmonary hypertension in heart failure with preserved ejection fraction: a community-based study. J Am Coll Cardiol. 2009;53(13):1119–1126. | ||
Paulus WJ, Tschope C. A novel paradigm for heart failure with preserved ejection fraction: comorbidities drive myocardial dysfunction and remodeling through coronary microvascular endothelial inflammation. J Am Coll Cardiol. 2013;62(4):263–271. | ||
Adir Y, Ollech JE, Vainshelboim B, Shostak Y, Laor A, Kramer MR. The effect of pulmonary hypertension on aerobic exercise capacity in lung transplant candidates with advanced emphysema. Lung. 2015;193(2):223–229. | ||
Holverda S, Bogaard HJ, Groepenhoff H, Postmus PE, Boonstra A, Vonk-Noordegraaf A. Cardiopulmonary exercise test characteristics in patients with chronic obstructive pulmonary disease and associated pulmonary hypertension. Respiration. 2008;76(2):160–167. | ||
Pynnaert C, Lamotte M, Naeije R. Aerobic exercise capacity in COPD patients with and without pulmonary hypertension. Respir Med. 2010;104(1):121–126. | ||
Thirapatarapong W, Armstrong HF, Bartels MN. Comparing cardiopulmonary exercise testing in severe COPD patients with and without pulmonary hypertension. Heart Lung Circ. 2014;23(9):833–840. | ||
Vonbank K, Funk GC, Marzluf B, et al. Abnormal pulmonary arterial pressure limits exercise capacity in patients with COPD. Wien Klin Wochenschr. 2008;120(23–24):749–755. | ||
Boerrigter BG, Bogaard HJ, Trip P, et al. Ventilatory and cardiocirculatory exercise profiles in COPD: the role of pulmonary hypertension. Chest. 2012;142(5):1166–1174. | ||
Rabe KF, Hurd S, Anzueto A, et al. Global strategy for the diagnosis, management, and prevention of chronic obstructive pulmonary disease: GOLD executive summary. Am J Respir Crit Care Med. 2007;176(6):532–555. | ||
Skjorten I, Hilde JM, Melsom MN, Hansteen V, Steine K, Humerfelt S. Pulmonary artery pressure and PaO2 in chronic obstructive pulmonary disease. Respir Med. 2013;107(8):1271–1279. | ||
Gulsvik A, Bakke P, Humerfelt S, et al. Single breath transfer factor for carbon monoxide in an asymptomatic population of never smokers. Thorax. 1992;47(3):167–173. | ||
Gulsvik A, Tosteson T, Bakke P, Humerfelt S, Weiss ST, Speizer FE. Expiratory and inspiratory forced vital capacity and one-second forced volume in asymptomatic never-smokers in Norway. Clin Physiol. 2001;21(6):648–660. | ||
Stocks J, Quanjer PH. Reference values for residual volume, functional residual capacity and total lung capacity. ATS Workshop on Lung Volume Measurements. Official Statement of the European Respiratory Society. Eur Respir J. 1995;8(3):492–506. | ||
Edvardsen E, Hansen BH, Holme IM, Dyrstad SM, Anderssen SA. Reference values for cardiorespiratory response and fitness on the treadmill in a 20- to 85-year-old population. Chest. 2013;144(1):241–248. | ||
Galie N, Humbert M, Vachiery JL, et al. 2015 ESC/ERS Guidelines for the diagnosis and treatment of pulmonary hypertension: The Joint Task Force for the Diagnosis and Treatment of Pulmonary Hypertension of the European Society of Cardiology (ESC) and the European Respiratory Society (ERS): endorsed by: Association for European Paediatric and Congenital Cardiology (AEPC), International Society for Heart and Lung Transplantation (ISHLT). Eur Heart J. 2016;37(1):67–119. | ||
Peinado VI, Barbera JA, Ramirez J, et al. Endothelial dysfunction in pulmonary arteries of patients with mild COPD. Am J Physiol. 1998;274(6 Pt 1):L908–L913. | ||
Hilde JM, Skjorten I, Grotta OJ, et al. Right ventricular dysfunction and remodeling in chronic obstructive pulmonary disease without pulmonary hypertension. J Am Coll Cardiol. 2013;62(12):1103–1111. | ||
Sun XG, Hansen JE, Oudiz RJ, Wasserman K. Exercise pathophysiology in patients with primary pulmonary hypertension. Circulation. 2001;104(4):429–435. | ||
Blanco I, Gimeno E, Munoz PA, et al. Hemodynamic and gas exchange effects of sildenafil in patients with chronic obstructive pulmonary disease and pulmonary hypertension. Am J Respir Crit Care Med. 2010;181(3):270–278. | ||
Boerrigter BG, Waxman AB, Westerhof N, Vonk-Noordegraaf A, Systrom DM. Measuring central pulmonary pressures during exercise in COPD: how to cope with respiratory effects. Eur Respir J. 2014;43(5): 1316–1325. | ||
Kovacs G, Avian A, Pienn M, Naeije R, Olschewski H. Reading pulmonary vascular pressure tracings. How to handle the problems of zero leveling and respiratory swings. Am J Respir Crit Care Med. 2014;190(3):252–257. |
 © 2017 The Author(s). This work is published and licensed by Dove Medical Press Limited. The full terms of this license are available at https://www.dovepress.com/terms.php and incorporate the Creative Commons Attribution - Non Commercial (unported, v3.0) License.
By accessing the work you hereby accept the Terms. Non-commercial uses of the work are permitted without any further permission from Dove Medical Press Limited, provided the work is properly attributed. For permission for commercial use of this work, please see paragraphs 4.2 and 5 of our Terms.
© 2017 The Author(s). This work is published and licensed by Dove Medical Press Limited. The full terms of this license are available at https://www.dovepress.com/terms.php and incorporate the Creative Commons Attribution - Non Commercial (unported, v3.0) License.
By accessing the work you hereby accept the Terms. Non-commercial uses of the work are permitted without any further permission from Dove Medical Press Limited, provided the work is properly attributed. For permission for commercial use of this work, please see paragraphs 4.2 and 5 of our Terms.