")
Back to Journals » International Journal of Nanomedicine » Volume 15
Carbon Quantum Dots: In vitro and in vivo Studies on Biocompatibility and Biointeractions for Optical Imaging
Authors Tian X , Zeng A, Liu Z , Zheng C , Wei Y, Yang P , Zhang M , Yang F , Xie F
Received 20 April 2020
Accepted for publication 15 July 2020
Published 28 August 2020 Volume 2020:15 Pages 6519—6529
DOI https://doi.org/10.2147/IJN.S257645
Checked for plagiarism Yes
Review by Single anonymous peer review
Peer reviewer comments 3
Editor who approved publication: Dr Linlin Sun
Xiumei Tian1 ,* Ao Zeng1 ,* Ziying Liu,1 Cunjing Zheng,2 Yuezi Wei,1 Peiheng Yang,1 Minru Zhang,1 Fanwen Yang,1 Fukang Xie1
1School of Basic Medical Sciences, Affiliated Stomatology Hospital, Guangzhou Medical University, Guangzhou 510182, People’s Republic of China; 2Department of Histology and Embryology, Zhongshan School of Medicine, Sun Yat-Sen University, Guangzhou 510080, People’s Republic of China
*These authors contributed equally to this work
Correspondence: Fukang Xie Tel +86 20 136 4231 6682
Email [email protected]
Fanwen Yang Tel +86 20 135 0308 0690
Fax +86 20 3710 3509
Email [email protected]
Background: Understanding the biocompatibility and biointeractions of nano-carbon quantum dots (nano-CQDs) in vitro and in vivo is important for assessing their potential risk to human health. In the previous research, the physical properties of CQDs synthesized by the laser ablation in liquid (LAL) method were analyzed in detail; however, possible bioapplications were not considered.
Materials and Methods: CQDs were prepared by LAL and characterized by atomic force microscopy, fluorescence lifetime, absorption spectrum, Fourier-transform infrared spectroscopy, and dynamic light scattering. Their biocompatibility was evaluated in vitro using assays for cytotoxicity, apoptosis, and biodistribution and in vivo using immunotoxicity and the relative expression of genes. Cells were measured in vitro using fluorescence-lifetime imaging microscopy to analyze the biointeractions between CQDs and intracellular proteins.
Results: There were no significant differences in biocompatibility between the CQDs and the negative control. The intracellular interactions had no impact on the optical imaging of CQDs upon intake by cells. Optical imaging of zebrafish showed the green fluorescence was well dispersed.
Conclusion: We have demonstrated that the CQDs have an excellent biocompatibility and can be used as efficient optical nanoprobes for cell tracking and biomedical labeling except for L929 and PC-3M cells.
Keywords: nanoprobe, immunotoxicity, biodistribution, biointeraction, optical imaging
Corrigendum for this paper has been published
Introduction
Nano-carbon quantum dots (nano-CQDs) have attracted increasing attention for a variety of biomedical applications, such as labels, due to their facile synthesis, chemical stability, and excellent fluorescence.1–5 Notably, CQDs are of great interest in optical imaging, which is a routine method of investigating complex structures in organisms in real time due to their unique biocompatibility, excellent resolution, low invasiveness, and long-term detection.4–7 However, a lack of comprehensive data on their immunotoxicity and the relative expression of genes in vivo and the challenges in optical imaging of CQDs are impediments to their clinical deployment.8–12 They are exogenous substances and can stimulate or suppress immune responses after administration into the body. Hence, an evaluation of both immuno-stimulation and immuno-suppression in vivo may provide sensitive data relating to preclinical safety, such as on immunotoxicity.13–16 Commonly, biodistribution and biointeractions are important in determining the relationship between the properties of nanostructures and their behavior inside biological systems.17 Biodistribution is often evaluated using optical tracers and interactions can be investigated with optical imaging.18 Moreover, the biodistribution of CQDs plays a critical role in their interactions. Therefore, there is a need for the systematic investigation of the immunotoxicity, biodistribution, and biointeractions of CQDs before they can be used for optical imaging.
To the best of our knowledge, until now, there are no comprehensive data on the biointeractions, biodistribution, and immunotoxicity of CQDs, as reported by our group.19–22 In addition, a lack of risk assessments on their immunotoxicity and insufficient data relating to their optical imaging in vitro and in vivo have prevented the preclinical application of CQDs. The main challenge for these studies is the precise detection of CQDs and establishing their interactions with biological systems.17,18
In the past, our group has successfully prepared CQDs by laser ablation in liquid (LAL), as they are potential optical nanoprobes.19–22 In this paper, we extended the study of those CQDs by undertaking comprehensive preclinical research using cells and zebrafish. We systematically investigated the following: ⅰ. Biocompatibility in vitro, including cytotoxicity and apoptosis; ⅱ.Biodistribution in vitro, using scanning electron microscopy, transmission electron microscopy (TEM), and confocal imaging; ⅲ. Immunotoxicity in vivo, including the levels of reactive oxygen species (ROS) and multiple cluster of differentiation (CD) markers in peripheral blood, and the relative expression of genes related to immunotoxicity in the liver; ⅳ. Biointeractions between CQDs and intracellular proteins using fluorescence lifetime imaging (FLIM); ⅴ. Optical confocal imaging of zebrafish.
Materials and Methods
Synthesis of CQDs
The synthesis of CQDs using the LAL protocol was performed as previously described,19–22 the process is in the Supplementary Materials section of the supplementary information.
Characterization
The morphology and size of the CQDs were analyzed using atomic force microscopy (AFM; CoreAFM, Nanosurf, Switzerland). Their optical properties were analyzed using fluorescence lifetimes measured by a microchannel plate-photomultiplier tube (SPC-150, HAM-R3809U-50, Hamamatsu, Japan)23 and using their ultraviolet–visible-light (UV-vis) absorption spectrum detected with a microplate reader (Synergy H1, Bio Tek, VT, USA). The functional groups were analyzed by Fourier-transform infrared (FTIR) spectroscopy (Equinox 55, Bruker, MA, USA) coupled with an infrared microscope.
In vitro Assessment of Biocompatibility and Biodistribution
All cell lines (purchased from the Animal Laboratory Centre, Medical College of Sun Yat-sen University, and the Institutional Review Board (IRB) approved the use of all cells in this study), except for NP69 (normal immortalized nasopharyngeal epithelial cells), were grown in Dulbecco’s modified Eagle’s medium (Gibco, USA), which is a high-glucose medium, containing 10% fetal bovine serum (Gibco, USA) and 5% CO2 at 37°C. The use of the NP69 had ethical review board approval (the Animal Laboratory Centre, Medical College of Sun Yat-sen University), and The NP69 cell line was cultured with keratinocyte-serum-free medium (Gibco, USA) with epidermal growth factor and bovine pituitary extract (Gibco, USA). Cells in the logarithmic growth phase were used for assays.
Cytotoxicity Assay
NP69, RAW264.7 (murine macrophage cells), CNE2 (human nasopharyngeal carcinoma cells), and HepG2 (human hepatocellular carcinoma cells) were used for cell-viability studies. Both the CNE2 and HepG2 cell lines were authenticated via short tandem repeat (STR) profiles. Cells were kept in 96-well plates at a density of 12,500 cells/cm2 and were treated with different concentrations of CQDs (10, 1, and 0.1 mM). The negative control was phosphate-buffered saline (PBS), the positive control was 0.5% dimethyl sulfoxide (DMSO; Sigma, USA), and the clinical treatment group was gadopentetic acid (Gd-DTPA; 10 mM and 1 mM, RuixiBio, China). All groups were cultured for different incubation times (12, 24, and 48 h). Then, 5 µL of Cell Counting Kit 8 (CCK-8; Dojindo, Japan) was added for an additional 4 h of incubation at 37°C. Subsequently, cell viability was measured by a microplate reader (Bio-Rad, CA, USA) at 490 nm.24,25 Each group was tested three times. Cell viability was expressed by the absorbance of the cells incubated with CQDs, which are given in the graphs as means ± standard deviation.
Apoptosis Assay
NP69 and RAW264.7 cells were incubated in a six-well plate for 48 h with CQDs (1× PBS as solvent, pH of 7.4, 10 mM) after they reached the logarithmic growth phase. Solvent (1× PBS), 5% dimethyl sulfoxide (Sigma, USA), and 10 mM Gd-DTPA (RuixiBio, China) were used as the negative control, positive control, and clinical treatment group, respectively. Cells were treated were trypsin (Gibco, USA) and collected. Then, 2 × 10⁴ cells were suspended in 200 µL of binding buffer (1×). They were washed twice with cold PBS before staining with an Annexin V/PI kit (SouthernBiotech, AL, USA). Then, 5 µL of Annexin V-FITC was put into 195 µL of the cell suspension and mixed and incubated for 10 min at room temperature. The cells were washed twice in 200 µL of binding buffer (1×) and resuspended in 190 µL of binding buffer (1×). We then added 10 µL of propidium iodide (20 µg/mL). All samples were analyzed by flow cytometry (CytoFLEX S, Beckman Coulter, CA, USA).26 This experimental protocol was verified by Southern Biotechnology Associates in the USA.
Confocal Microscopy Imaging
The A549 (human lung adenocarcinoma cells), CNE2, PC-3M (human prostate cancer cells), and L929 (mouse fibroblast cells) were incubated with CQDs (1 µM) for 12 h. After co-incubation, the cells were washed with PBS to remove the remaining CQDs and dead cells. The cells were imaged with a confocal microscope (Leica TCS SP8, Germany) operating at excitation wavelengths of 405, 488, and 552 nm.
Biointeraction Assay Using FLIM
L929 and PC-3M cells were incubated with CQDs (1 µM) at 48 h and examined with 400-nm excitation. Control experiments with blank cells without CQDs were used to evaluate the autofluorescence of cells. All assessments were performed using a confocal imaging spectrometer (Renishaw, inVia Reflex, UK). The excitation source was a Ti-sapphire laser (tuning range 690–1040 nm, Mai Tai, Spectra-Physics, USA). The fluorescence from each pixel was measured using a microchannel plate-photomultiplier tube (SPC-150, HAM-R3809U-50, Hamamatsu, Japan) and fed into a time-correlated single-photon counting card (HRT-41, Becker and Hickl) to record the fluorescence lifetime. The FLIM data were collected for 30–60 s, and the fluorescence lifetime data were imported into data analysis software (SPC-Image, v.3.2 Becker and Hickl). The Levenberg–Marquardt algorithm for non-linear fitting was used for the fluorescence decay curve with data collected for each pixel in a 256 × 256 pixel array. The curves were then displayed using color-coded images.23,27
In vivo Assessment of Immunotoxicity
All animal experiments were performed in accordance with China’s animal welfare legislation for the protection of animals used for scientific purposes, and they were approved by the Institutional Animal Care and Use Committee of Sun Yat-Sen University (IACUC-44008500013801). Altogether, 32 male BALB/c mice (6–8 weeks old) were randomly divided into four groups. The tail veins in each group were injected with the following: (1) PBS (100 μL, negative control), (2) lipopolysaccharide (LPS; 5 mg/kg, positive control, Sigma, USA), (3) commercial MRI contrast agents using Gd-DTPA (20 μM/kg, RuixiBio, China), only once, and (4) CQDs (20 μM/kg), only once. The mice were kept in stainless-steel cages and allowed unlimited food and water. Blood samples were obtained from the ophthalmic vein before the mice were sacrificed at 7 days. Their livers were immediately excised and preserved at −80°C and would undergo messenger RNA (mRNA) analysis.26
ROS Level of Peripheral Blood Neutrophils
First, 20 μL of peripheral blood was collected from the ophthalmic vein and added into tubes containing 4 μL of 1% heparin sodium (Abmole, USA). Erythrocytes were removed using ammonium–chloride-potassium lysis buffer (2 mL, Biosharp, China) in the dark for 2 min. The lysate was washed with 2 mL of PBS, and the peripheral blood neutrophils and lymphocytes were kept in the dark for 2 min. Cells were redissolved in PBS and stained with 2′,7′-dichlorodihydrofluorescein diacetate (5 μM, H2DCFDA, ThermoFisher, USA) in the dark for 20 min. The expression of ROS in peripheral blood neutrophils was measured by flow cytometry (CytoFLEX S, Beckman Coulter, USA).
Expression of CD Markers in Peripheral Blood
First, 20 μL of peripheral blood was collected from the ophthalmic vein and added into tubes containing 4 μL of 1% heparin sodium. Red blood cell lysis buffer was added (Biosharp, China) and the blood was lysed in the dark for 2 min. Then, 2 mL of PBS was added to wash off the lysate. Next, the cells were redissolved in PBS and stained in the dark for 30 min with CD206-phycoerythrin (PE), CD11b-PE, CD25-Fluorescein isothiocyanate (FITC), CD69-FITC, and CD71-FITC (eBioscience, USA), separately. The expression levels of immune response CD markers were measured by flow cytometry (CytoFLEX S, Beckman Coulter, USA).
Optical Imaging of Zebrafish with and without CQDs
Zebrafish in 5 days were incubated with CQDs (1 mM) and without CQDs for 12 h. After incubation, the fish were washed with PBS to remove the remaining CQDs. The fish were imaged with an optical confocal microscope (Leica TCS SP8, Germany), operating at 488-nm excitation wavelength.
Statistical Analyses
Data on cell viability, apoptosis rate, ROS levels, CD markers, and mRNA expression were analyzed using IBM SPSS Statistics 23.0 software (IBM, Armonk, NY, USA) for Microsoft Windows. All values were reported as means ± standard deviation unless otherwise specified. A post hoc test and t-test were used to determine if there were significant differences between the treatment and control groups. Moreover, a one-way analysis of variance followed by a least significance difference test was applied for multiple comparisons. Here, p < 0.05 was considered statistically significant.
Results and Discussion
Characterization
In this study, the CQDs were synthesized by the LAL process, as reported by our group,19–22 and then characterized. Figure 1A is an AFM image showing the morphology of CQDs. They were uniform in size with an average radius of ~5.35 nm, and they were well dispersed. For optical properties, the fluorescence lifetime of CQDs at an excitation wavelength of 400 nm was 0.94 ns [Figure 1B]. In addition, the UV-vis absorption spectrum is shown in Figure 1C. Consistent with our earlier work, the absorption of CQDs is strong, with an absorption peak at about 360 nm. These properties can be utilized well by using optical imaging to track their location in vitro and in vivo, as reported in Optical Imaging in vitro and in vivo. Moreover, the functional groups on the surface of the CQDs were mainly covered with carbonyl (–CHO) and carboxylic (–COOH) groups, according to the FTIR spectroscopy [Figure 1D]. These groups might interact with some proteins in cells. Furthermore, CQDs are negatively charged with the zeta potential value of −33.7±2.64 mV (Figure S1) indicating that the CQDs are not easily combined with most proteins (Figures S2 and S4) in blood which also have negative charge. This suggests that the CQDs might be potentially optical tags for cellular studies.
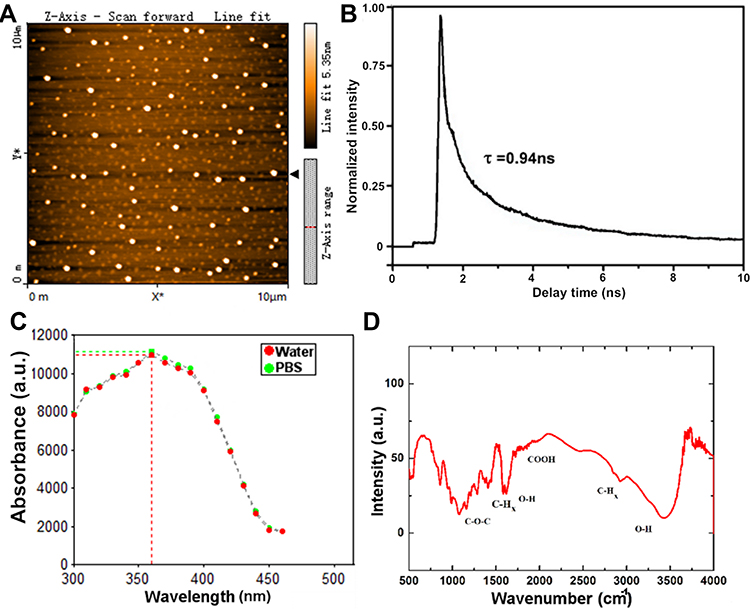 |
Figure 1 Characterization of CQDs. (A) AFM image (two-dimensional view) showing surface morphology of CQDs (1 mg/mL). Scan size is 3 µm × 3 µm. (B) Luminescence decay curves of CQDs at an excitation wavelength of 400 nm and emission signals at 560 nm. (C) UV-vis absorption spectrum of a suspension of CQDs diluted in water and PBS (1 mg/mL). (D) FTIR spectrum of the suspension of CQDs diluted in PBS, showing evidence of functional groups. |
In vitro Assessment of Biocompatibility and Biodistribution
It is crucial for the application of the CQDs in vitro and in vivo that their biocompatibility is satisfactory. Therefore, cytocompatibility of the CQDs was examined by cytotoxicity and apoptosis. Cytocompatibility elucidates the cellular response to a toxicant and is an essential step in establishing the nanotoxicity of CQDs. Therefore, we investigated the impact of CQDs on cell viability, apoptosis, and cellular uptake. Because nano-structure including the size, surface chemistry, and charge of CQDs has a great effect on cell viabilities due to different cell microenvironment.10,11 So that cell viability was measured by CCK-8 after incubating the NP69, CNE2, HepG2, and RAW264.7 cells with different concentrations of CQDs at 12, 24, and 48 h [Figure 2A–D]. As a kind of macrophage cell line, Raw264.7 was more sensitive to the nano-based biomaterials compared to the other cell types.10,11 There were no significant differences between the CQDs and the negative control, suggesting that the CQDs are not toxic to the cell lines. Thus, the CQDs can be considered to be as safe for optical imaging in terms of cell viability.
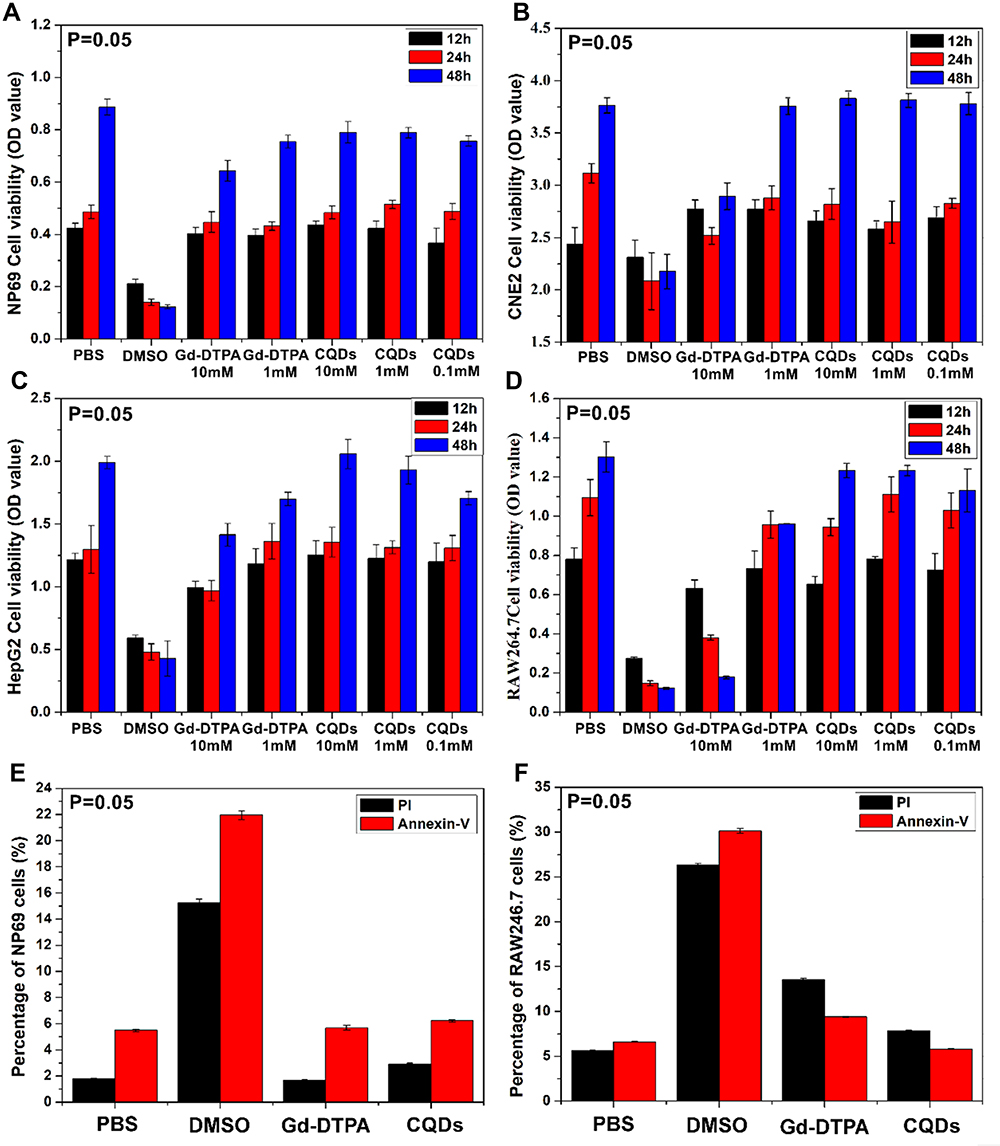 |
Figure 2 Viability of (A) NP69, (B) CNE2, (C) HepG2, and (D) RAW264.7 cells incubated for 12, 24, and 48 h with different concentrations of CQDs (10, 1, and 0.1 mM) that had been prepared in our lab. Apoptosis rates of (E) NP69 and (F) RAW264.7 cells measured by flow cytometry at 48 h after incubation with PBS, Gd-DTPA (10 mM), or CQDs (10 mM). Samples were stained with Annexin V or propidium iodide (PI), P=0.05. |
Apoptosis was studied with flow cytometry using NP69 and RAW264.7 cells stained with Annexin V and propidium iodide (PI). Macrophage might play an important role in protecting exogenous substance by releasing profibrotic cytokines and growth factors.11,14 In this study, we chose the optimum concentration (the higher concentration with good biocompatibility, 10 mM) of CQDs to detect the apoptosis according to cell viability. Cells were incubated with PBS (negative control), DMSO (5%, positive control), Gd-DTPA (10 mM), and CQDs (10 mM) for 48 h [Figure 2E and F, and S2]. No significant differences were detected between the negative control and the CQDs, suggesting that the CQDs had no effect on RAW264.7 and NP69 cell survival. This indicates that the CQDs are less toxic to the immune system in vitro.
Importantly, TEM provided detailed morphological information and the distribution at the subcellular level for PC-3M and A549 cells. TEM images (Figure S3) showed that a few CQDs were absorbed by cells 12 h after incubation and that these were localized in cytoplasm or nucleus. The good dispersibility and small size of the CQDs played a major role in their cellular uptake. These results showed that the integrity of the plasma membranes was maintained. Hence, we proceeded to in vivo studies.
In vivo Assessment of Biocompatibility
To further evaluate the in vivo biocompatibility of CQDs, their immunotoxicity was studied based on levels of ROS and multiple CD markers in peripheral blood, as well as the relative expression of genes relating to immunotoxicity in the livers of BALB/c mice at 7 days (Figure 3).
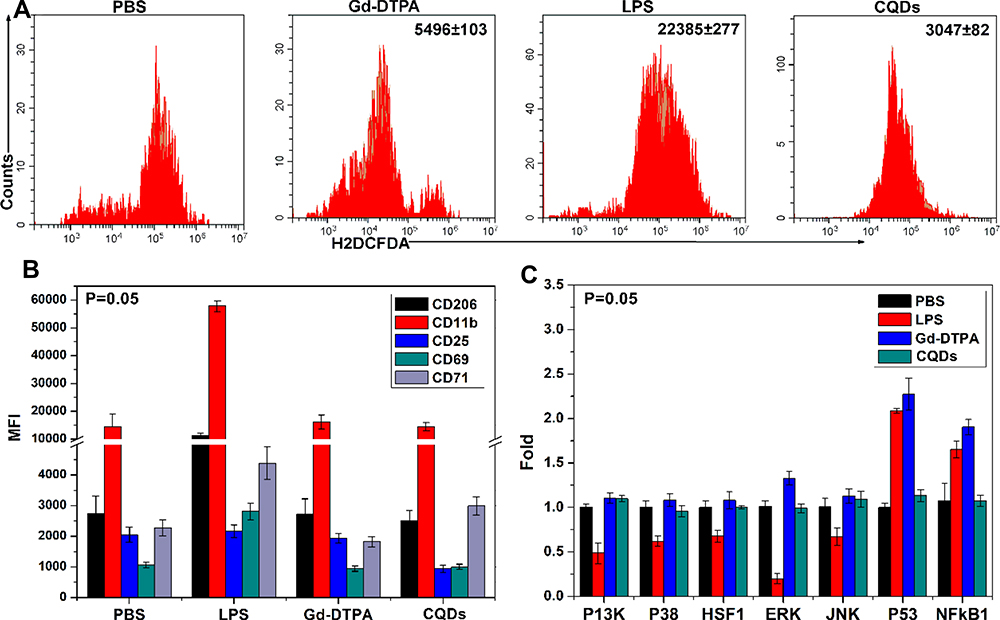 |
Figure 3 (A) Generation of ROS in peripheral blood neutrophils measured by flow cytometry 1 d after injection in BALB/c mice (20 μmol/kg, means ± standard deviation, n = 5). (B) Mean fluorescence intensity (MFI) of different CD markers in monocytes and lymphocytes in peripheral blood at 1 d after injection of CQDs, PBS (100 μL; negative control), LPS (5 mg/kg; positive control), or gadodiamide (20 μmol/kg; clinical control) into the tail veins of BALB/c mice (20 μmol/kg, means ± standard deviation, n = 5 in each group). (C) Relative mRNA expression of PI3K, P38, HSF1, ERK, JNK, P53, and NF-κB1 in liver at 1 d after injection of CQDs, P=0.05. |
Effect of CQDs on ROS Levels and Multiple CD Markers in Peripheral Blood
As the first-line defense against infections and a key effector of host immunity, neutrophils in the peripheral blood can generate up to 95% of circulating myeloperoxidase to catalyze the generation of ROS.11 Therefore, as a key regulator of immunity, ROS of neutrophils in the peripheral blood play an important role in assessing immunotoxicity.14 They can trigger an immune response that stimulates or eliminates immunotoxicity. To some extent, the CD markers assessment reflects the level of the immunotoxicity.11,14 Furthermore, we used CD markers of innate immunity in peripheral blood monocytes/macrophages (CD206, CD11b, and CD71) and CD markers of adaptive immunity in peripheral blood lymphocytes (CD25 and CD69). The ROS levels of peripheral blood neutrophils are shown in Figure 3A. There were no significant differences between the groups treated with the CQDs and the negative control group (p = 0.05). The results demonstrate that the CQDs neither induce oxidative stress after injection nor trigger an immune response during tissue restoration.
In addition, Figure 3B and S4 show the innate and adaptive immunotoxicity of CQDs in peripheral blood. No significant differences in any CD markers were observed between the groups treated with the CQDs and the negative control (p = 0.05). These data further confirm that the CQDs do not stimulate the innate or adaptive immune response in the body. We, thus, concluded that the CQDs are likely not immunotoxic, which is beneficial for further application.
Effect of CQDs on the Relative Expression of Genes Related to Immunotoxicity in the Liver
The liver contains large amounts of antigen-presenting cells and lymphocytes, and it plays a key role in the first-line immune defense. As secondary messengers in cellular signaling, ROS are correlated to a series of pathways, including PI3K, p38, HSF-1, JNK, p53, NF-κB1, and NF-κB2.28,29 To some extent, there is a great correlation between the changes in gene expression levels and changes in the ROS expression level.29 PI3K is an essential factor in manageable toxicity of immune response.30 Therefore, we analyzed the relative expression of various genes (PI3K, P38, HSF1, JNK, ERK, P53, and NF-κB1) to see if the CQDs induced immunotoxicity in the liver. Figure 3C shows the relative mRNA expression of these genes in the liver for PBS, LPS, Gd-DTPA, and CQDs. No significant difference was observed between the groups treated with the CQDs and the negative control in liver (p = 0.05). These results indicate that the CQDs did not trigger an immune response in the liver after injection and have minimal immunotoxicity.
Optical Imaging in vitro and in vivo
As CQDs have good biocompatibility and good optical imaging, they can penetrate into cells, and subsequently, their location in a cell can be tracked with optical imaging. To determine whether CQDs can be used as potential optical tags, we performed optical imaging in vitro and in vivo.
Confocal Microscopy to Assess Biodistribution and Efficiency in vitro
To verify the feasibility of using CQDs as optical nanoprobes, A549, CNE2, PC-3M, and L929 cells incubated with the CQDs were imaged under the laser confocal fluorescence microscope at excitation wavelengths of 405, 488, and 552 nm. Figure 4A–D show bright-field images of these cells incubated with CQDs. The fluorescence in the blue, green, and red channels was excellent, with green being superior. These results demonstrate that after cellular uptake, the CQDs retained their fluorescence and were well dispersed. Moreover, the integrity of the plasma membranes was retained. The data demonstrated that the CQDs are useful for cells imaging except for L929 cells. Because the aggregation of the CQDs is observed from the bright-field images, and the cells seem not in a good state, especially for L929 cells.
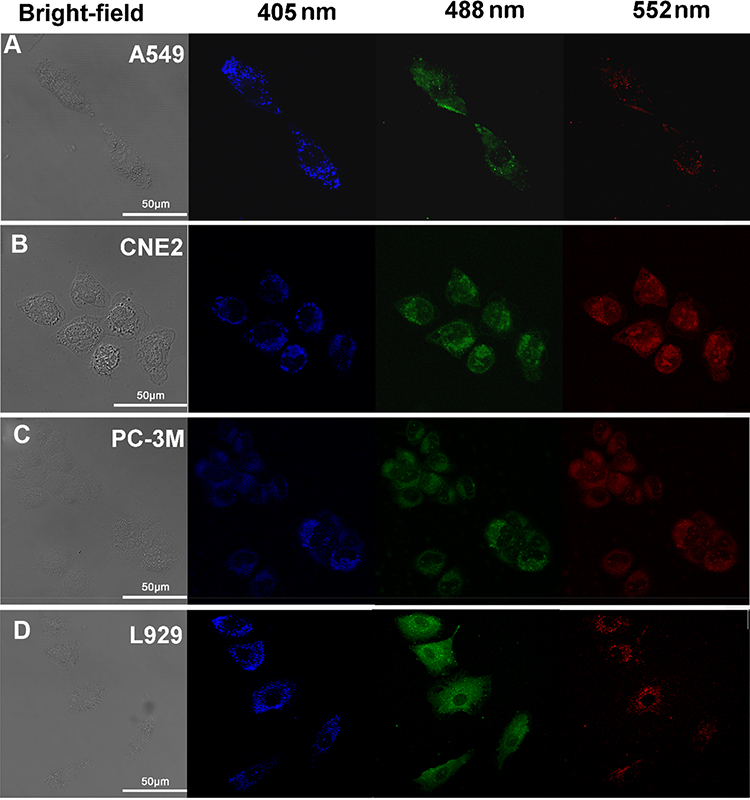 |
Figure 4 Bright-field (left) and fluorescence images (right; λmax excitation = 405nm, 488nm, and 552 nm) taken using confocal microscopy of (A) A549, (B) CNE2, (C) PC-3M, and (D) L929 cells incubated with CQDs (1 µM) for 12 h. |
Biointeractions in L929 and PC-3M Cells Measured Using FLIM
We investigated the interactions between CQDs and the proteins in cells with FLIM. Cells can produce a strong autofluorescence signal under UV excitation between 260 and 400 nm. So that a strong autofluorescence signal under UV excitation between 260 and 400 nm will affect the application of CQDs in labeling. In our experiment, the 400-nm-excited lifetime images were obtained in the 560-nm channel according to our previous research.23 Figure 5A and B show that the average time that molecules remain in the excited state can be fitted well by a mono-exponential function for both types of cells.
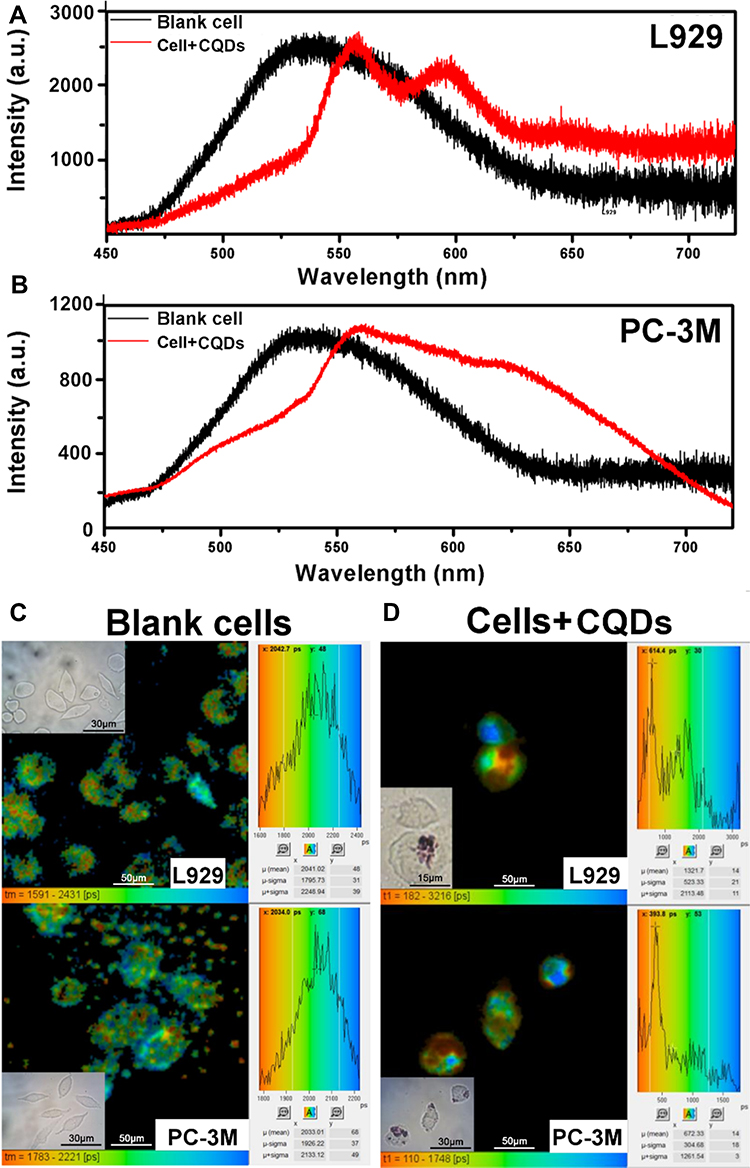 |
Figure 5 Comparison of fluorescence intensity with and without CQDs for 48h at an excitation wavelength of 400 nm in (A) L929 cells and (B) PC-3M cells. Comparison of FLIM images of L929 and PC-3M cells (C) with and (D) without CQDs. The excitation wavelength was 400 nm, and the emission wavelength was 560 nm. Insets: Bright-field images of L929 and PC-3M cells. |
Figure 5C and D demonstrate that the lifetime autofluorescence distributions were similar in L929 (1591–2431 ps) and PC-3M cells (1783–2221 ps) before the intake of CQDs. However, after the uptake of CQDs, their lifetime fluorescence distributions changed. For L929 cells, it changed to 182–3216 ps, and for PC-3M cells, it changed to 110–1748 ps. In essence, the average time that molecules remained in the excited state for L929 cells and PC-3M cells lengthened and shortened, respectively. The average fluorescence lifetime of CQDs was longer than (0.94 ns) when incorporated inside cells in comparison with when measured independently. Therefore, the interaction between CQDs with the proteins in a cell had no impact on the optical imaging of CQDs. Importantly, although the aggregation of the CQDs was also detected from the bright-field images, the results direct the application of the CQDs further. Hence, the CQDs might be suitable for optical imaging of cells except for L929 and PC-3M cells. The mechanisms need to be further study.
Confocal Microscopy Imaging of Zebrafish
Confocal microscopy is an important tool for evaluating fluorescence tagging in vivo. Figure 6A and S5A are bright-field images obtained from confocal microscopy of zebrafish incubated with and without CQDs. Clearly, there are many small black dots everywhere on and within the fish with green fluorescence, particularly in some organs or tissues. However, they are too small to recognize due to some big black dots of fish. There was no change in the morphology of the zebrafish after incubation with CQDs. These results demonstrate that CQDs do not significantly damage the fish.
As shown in Figure 6B and S5B, there is no fluorescence from the fish incubated without CQDs. In contrast, there is significant green fluorescence from the fish incubated with CQDs, which demonstrates that the CQDs have excellent fluorescence emission properties, even after being swallowed by a fish. Merged images are shown in Figure 6C and S5C. These indicate that the abdomen, brain, and dorsum of the fish had taken up some CQDs, confirming that the CQDs could be used as fluorescence tags due to their excellent green fluorescence.
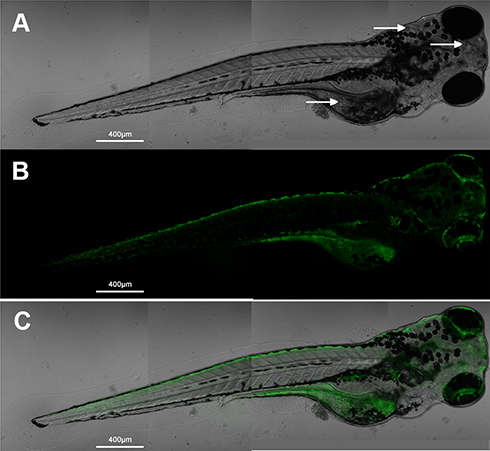 |
Figure 6 (A) Bright-field image, (B) fluorescence image, and (C) merged image of a zebrafish incubated with CQDs at λmax = 488-nm excitation. Small black dots (white arrow). |
Conclusions
In summary, CQDs have stable and strong luminescence as well as satisfactory biocompatibility without exhibiting nanotoxicity. A systematic study of the biocompatibility and optical imaging of CQDs established that they are safe optical nanoprobes with good efficiency, both in vitro and in vivo. Further, the CQDs were found to be efficient fluorescence tags in cells (except L929 and PC-3M cells) and zebrafish. These results may facilitate the development of CQDs as a potential optical nanoprobes in human clinical trials.
Acknowledgments
The authors wish to thank Prof. Guowei Yang and Dr. Jun Xiao (State Key Laboratory of Optoelectronic Materials and Technologies, School of Physics, Sun Yat-sen University, Guangzhou) for providing the CQDs, which allowed us to perform a risk assessment and analyze their efficiency in vitro and in vivo.
Disclosure
The authors report no conflicts of interest in this work.
References
1. Chow HW. Nanodiamonds: the intersection of nanotechnology, drug development, and personalized medicine. Biomedical engineer. 2015;7:1500439.
2. Mochalin VN, Shenderova O, Ho D, Gogotsi Y. The properties and applications of Nanodia- monds. Nat Nanotechnol. 2011;7(1):11–23. doi:10.1038/nnano.2011.209
3. Passeri D, Rinaldi F, Ingallina C, et al. Biomedical applications of nanodiamonds: an overview. J Nanosci Nanotechnol. 2015;15(2):972–988. doi:10.1166/jnn.2015.9734
4. Montalti M, Cantelli A, Battistelli G. Nanodiamonds and silicon quantum dots: ultrastable and biocompatible luminescent nanoprobes for long-term bioimaging. Chem Soc Rev. 2015;44(14):4853–4921. doi:10.1039/C4CS00486H
5. Moham JM. Carbon quantum dots and their biomedical and therapeutic applications: a review. RSC Adv. 2019;9(12):6460. doi:10.1039/C8RA08088G
6. Rosenholm JM, Vlasov II, Burikov SA, Dolenko TA, Shenderova OA. Nanodiamond- based composite structures for biomedical imaging and drug delivery. J Nanosci Nanotechnol. 2015;15(2):959–971. doi:10.1166/jnn.2015.9742
7. Whitlow J, Pacelli S, Paul A. Multifunctional nanodiamonds in regenerative medicine: recent advances and future directions. J Control Release. 2017;261:62–86. doi:10.1016/j.jconrel.2017.05.033
8. Chipaux M, Laan KJ, Hemelaar SR, Hasani M, Zheng T, Schirhagl R. Nanodiamonds and their applications in cells. Small. 2018;14(24):e1704263. doi:10.1002/smll.201704263
9. Lim DG, Prim RE, Kim KH, Kang E, Park K, Jeong SH. Combinatorial nanodiamond in pharmaceutical and biomedical applications. Int J Pharm. 2016;514(1):41–51. doi:10.1016/j.ijpharm.2016.06.004
10. Kunzmann A, Andersson B, Thurnherr T, Krug H, Scheynius A, Fadeel B. Toxicology of engineered nanomaterials: focus on biocompatibility, biodistribution and biodegradation. Biochim Biophys Acta. 2011;1810(3):361–373. doi:10.1016/j.bbagen.2010.04.007
11. Dobrovolskaia MA, Germolec DR, Weaver JL. Evaluation of nanoparticle immunotoxicity. Nat Nanotechnol. 2009;4(7):411–414. doi:10.1038/nnano.2009.175
12. Dobrovolskaia MA, McNeil SE. Immunological properties of engineered nanomaterials. Nat Nanotechnol. 2007;2(8):469–478. doi:10.1038/nnano.2007.223
13. Monaco AM, Giugliano M. Carbon-based smart nanomaterials in biomedicine and neuroengineering. Beilstein J Nanotechnol. 2014;5:1849–1863. doi:10.3762/bjnano.5.196
14. Zolnik BS, Gonzalez-Fernandez A, Sadrieh N, Dobrovolskaia MA. Nanoparticles and the immune system. Endocrinology. 2010;151(2):458–465. doi:10.1210/en.2009-1082
15. Van der Laan K, Hasani M, Zheng T, Schirhagl R. Nanodiamonds for in vivo applications. Small. 2018;14(19):e1703838. doi:10.1002/smll.201703838
16. Petersen LK, Ramer-Tait AE, Broderick SR, et al. Activation of innate immune responses in a pathogen-mimicking manner by amphiphilic polyanhydride nanoparticle adjuvants. Biomaterials. 2011;32(28):6815–6822. doi:10.1016/j.biomaterials.2011.05.063
17. Bhattacharya K, Mukherjee SP, Gallud A, et al. Biological interactions of carbon-based nanomaterials: from coronation to degradation. Nanomedicine. 2016;12(2):333–351. doi:10.1016/j.nano.2015.11.011
18. Wei Q, Wang Y, Wang S, Zhang Y, Chen X. Investigating the properties and interaction mechanism of nano-silica in polyvinyl alcohol/polyacrylamide blends at an atomic level. J Mech Behav Biomed Mater. 2017;75:529–537. doi:10.1016/j.jmbbm.2017.08.027
19. Xiao J, Liu P, Yang GW. Nanodiamonds from coal under ambient conditions. Nanoscale. 2015;7(14):6114–6125. doi:10.1039/C4NR06186A
20. Xiao J, Liu P, Li L, Yang G. Fluorescence origin of nanodiamonds. J Phys Chem C. 2015;119(4):2239–2248. doi:10.1021/jp512188x
21. Xiao J, Li JL, Liu P, Yang GW. A new phase transformation path from nanodiamond to new-diamond via an intermediate carbon onion. Nanoscale. 2014;6(24):15098–15106. doi:10.1039/C4NR05246C
22. Xiao J, Ouyang G, Liu P, Wang CX, Yang GW. Reversible nanodiamond-carbon onion phase transformations. Nano Lett. 2014;14(6):3645–3652. doi:10.1021/nl5014234
23. Wang H, Zhang S, Tian X, et al. High sensitivity of gold nanoparticles co-doped with Gd2O3 mesoporous silica nanocomposite to nasopharyngeal carcinoma cells. Sci Rep. 2016;6:34367. doi:10.1038/srep34367
24. Tian X, Li E, Yang F, et al. In vivo immunotoxicity of SiO2@(Y0.5Gd0.45Eu 0.05)2O3 as dual-modality nanoprobes. Int J Mol Sci. 2014;15(8):13649–13662. doi:10.3390/ijms150813649
25. Tian X, Guan X, Luo N, et al. In vivo immunotoxicity evaluation of Gd2O3 nanoprobes prepared by laser ablation in liquid for MRI preclinical applications. J Nanoparticle Res. 2014;16(9):2594. doi:10.1007/s11051-014-2594-9
26. Chen F, Li G, Zhao ER, et al. Cellular toxicity of silicon carbide nanomaterials as a function of morphology. Biomaterials. 2018;179:60–70. doi:10.1016/j.biomaterials.2018.06.027
27. Tian X, Yang F, Yang C, et al. Toxicity evaluation of Gd2O3@SiO2 nanoparticles prepared by laser ablation in liquid as MRI contrast agents in vivo. Int J Nanomedicine. 2014;9:4043–4053. doi:10.2147/IJN.S66164
28. Valko M, Leibfritz D, Moncol J, Cronin MT, Mazur M, Telser J. Free radicals and antioxidants in normal physiological functions and human disease. Int J Biochem Cell Biol. 2007;39(1):44–84. doi:10.1016/j.biocel.2006.07.001
29. Yang Y, Bazhin AV, Werner J, Karakhanova S. Reactive oxygen species in the immune system. Int Rev Immunol. 2013;32(3):249–270. doi:10.3109/08830185.2012.755176
30. Fruman DA, Bismuth G. Fine tuning the immune response with PI3K. Immunol Rev. 2009;228(1):253–272. doi:10.1111/j.1600-065X.2008.00750.x
 © 2020 The Author(s). This work is published and licensed by Dove Medical Press Limited. The full terms of this license are available at https://www.dovepress.com/terms.php and incorporate the Creative Commons Attribution - Non Commercial (unported, v3.0) License.
By accessing the work you hereby accept the Terms. Non-commercial uses of the work are permitted without any further permission from Dove Medical Press Limited, provided the work is properly attributed. For permission for commercial use of this work, please see paragraphs 4.2 and 5 of our Terms.
© 2020 The Author(s). This work is published and licensed by Dove Medical Press Limited. The full terms of this license are available at https://www.dovepress.com/terms.php and incorporate the Creative Commons Attribution - Non Commercial (unported, v3.0) License.
By accessing the work you hereby accept the Terms. Non-commercial uses of the work are permitted without any further permission from Dove Medical Press Limited, provided the work is properly attributed. For permission for commercial use of this work, please see paragraphs 4.2 and 5 of our Terms.