")
Back to Journals » International Journal of Nanomedicine » Volume 11
Carbon nanospheres mediated delivery of nuclear matrix protein SMAR1 to direct experimental autoimmune encephalomyelitis in mice
Authors Chemmannur S, Bhagat P, Mirlekar B, Paknikar K , Chattopadhyay S
Received 1 August 2015
Accepted for publication 14 January 2016
Published 12 May 2016 Volume 2016:11 Pages 2039—2051
DOI https://doi.org/10.2147/IJN.S93571
Checked for plagiarism Yes
Review by Single anonymous peer review
Peer reviewer comments 3
Editor who approved publication: Dr Thomas Webster
Sijo V Chemmannur,1,* Prasad Bhagat,2,* Bhalchandra Mirlekar,1 Kishore M Paknikar,2 Samit Chattopadhyay1,3
1Disease and Chromatin Biology Laboratory, National Center for Cell Science, Pune University Campus, Pune, Maharashtra, India; 2Center for Nanobioscience, Agharkar Research Institute, Pune, Maharashtra, India; 3Indian Institute of Chemical Biology, Kolkata, India
*These authors have contributed equally to this work
Abstract: Owing to the suppression of immune responses and associated side effects, steroid based treatments for inflammatory encephalitis disease can be detrimental. Here, we demonstrate a novel carbon nanosphere (CNP) based treatment regime for encephalomyelitis in mice by exploiting the functional property of the nuclear matrix binding protein SMAR1. A truncated part of SMAR1 ie, the DNA binding domain was conjugated with hydrothermally synthesized CNPs. When administered intravenously, the conjugate suppressed experimental animal encephalomyelitis in T cell specific conditional SMAR1 knockout mice (SMAR-/-). Further, CNP-SMAR1 conjugate delayed the onset of the disease and reduced the demyelination significantly. There was a significant decrease in the production of IL-17 after re-stimulation with MOG. Altogether, our findings suggest a potential carbon nanomaterial based therapeutic intervention to combat Th17 mediated autoimmune diseases including experimental autoimmune encephalomyelitis.
Keywords: carbon nanospheres, EAE, IL-17, SMAR1, Th17
Introduction
Globally, more than 2.3 million people are affected by multiple sclerosis (MS), an autoimmune disorder.1 It is an inflammatory disease caused by the destruction of the myelin sheath of the central nervous system (CNS). The pathogenesis is due to the deregulated immune responses mediated by a subset of T cells known as Th17 cells.2 MS causes physical and mental complications due to partial paralysis, lack of co-ordination, and aberrant neuronal communication from the brain and spinal cord.3 There is no known cure for the disease though immunosuppressive and immunomodulatory therapy is currently employed to alleviate MS.4 Moreover, the immunomodulatory (steroids and interferon) or replenishing (glatiramer acetate) treatment for MS has adverse side effects.5,6 Experimental autoimmune encephalomyelitis (EAE) is an animal model of human CNS demyelinating diseases, including MS and acute disseminated encephalomyelitis. It serves as a typical disease model of T cell mediated autoimmune disease. Purified myelin or myelin proteins such as MBP, PLP, MOG or its peptide are used to induce EAE in rodents.7 Recent interest in the field of T cell biology envisaged the molecular mechanism of EAE disease and elucidated that IL-17 secreting Th17 subset of T cells was the causative mediator of the disease.8 EAE disease progression can be prevented by factors or signaling molecules that control Th17 immune reaction, IL-17 secretion or its gene expression. Thus, EAE is considered to be a Th17 driven autoimmune inflammatory disease.9
In the present study, we hypothesized that using nanoparticles to deliver an anti-inflammatory protein SMAR1 could combat the EAE disease progression. SMAR1 was identified as a nuclear matrix binding protein attached to an AT-rich MARβ region of the TCRβ locus.10 Aberrant expression of SMAR1 had physiological consequences with modulation of T cell repertoire and perturbation of mounting effective immune responses.11 A recent report suggested a critical role of SMAR1 in the orchestration of T cell differentiation programs and its implications in asthma disease progression. SMAR1 binds to AT-rich MAR regions present on the promoters of T-bet and IL-17 with its C-terminal DNA binding domain (DBD). It functions as a negative regulator of Th1 and Th17 cell differentiation.12 SMAR1 epigenetically modulates the target genes by the recruitment of chromatin modifying complexes and altering the gene transcription machinery.13,14 Since deficiency of SMAR1 leads to increased Th17 responses, we hypothesized that SMAR1 deficiency might aggravate Th17 driven EAE disease. We assumed that SMAR1 could function as a therapeutic protein for Th17 mediated autoimmune diseases. The gated channels and membrane proteins in cells tightly regulate protein delivery, which is a challenge in an in vivo scenario. The development of protein transduction platforms would therefore significantly increase the scope of potential applications for protein therapeutics. Nanoscale drug delivery systems are used for delivery of drugs/proteins due to their small size and a high surface to volume ratio. Recently, various nanoparticles were used for protein transport, including nanoparticle stabilized nano-capsules,15 hollow polymeric nanoparticles,16 and chitosan nanoparticles.17,18 For delivery of SMAR1 to the site of inflammation, we employed carbon nanospheres (CNPs) as a carrier. CNPs have been explored as drug carriers and have been shown to penetrate the biological barriers with low cytotoxicity.19,20 Utilizing this property, we investigated the efficacy of carbaon nanoparticle based treatment in the EAE disease model.
Materials and methods
Animal model
T cell specific (Lck [early]-Cre SMAR1f/f) conditional knockout mice (SMAR1−/−)10 and wild type (WT) C57BL/6J mice were inbred in the animal facility of the National Centre for Cell Science (Pune, India). Animal experiments were done with 6–8-week-old mice. All animal-handling procedures were performed according to the Guide for the Care and Use of Laboratory Animals of the National Institutes of Health and followed the guidelines of the Animal Welfare Act. All animal experiments were approved by the Animal Ethical Committee of National Center for Cell Science, Pune, India.
Synthesis of nanoparticles
Dextrose (0.6 M; HiMedia, Mumbai, India) solution was transferred to a Teflon-lined stainless steel vessel. The sealed vessel was kept in a muffle furnace at 180°C for 2 hours. The vessel was immediately removed after the reaction time and allowed to cool. The brown color colloidal suspension formed during the reaction was collected, washed, and re-suspended in deionized water for further use.
Size and zeta potential
The size and zeta potential of the CNPs was examined by dynamic light scattering using Delsa Nano Zeta sizer (Beckman Coulter Incorporation, Brea, CA, USA). For estimating size, 0.1 mg/mL CNP in de-ionized water was used. The same sample was used for zeta potential analysis to establish the charge on the CNPs.
Fourier transform infrared spectroscopy analysis
CNP powder mixed with potassium bromide (Sigma-Aldrich Co., St Louis, MO, USA) was pelleted and analyzed for functional groups present by fourier transform infrared spectroscopy (FTIR) (Model Spectrum One; PerkinElmer Inc., Waltham, MA, USA). Spectra were recorded in the 4,000–500 cm−1 wave number range.
Atomic force microscopy analysis
A diluted sample of CNPs in deionized water was air dried on a coverslip and imaged under non-contact mode using an atomic force microscopy (AFM) (Witech, Ulm, Germany) with budget sensor probes. The nanoparticle conjugated protein sample was prepared as above and imaged in contact mode. The measurements were performed under ambient conditions with a scan speed of the 1 μm/s.
MTT assay
Splenocytes were isolated from mice and CD4+ T cells were further enriched using negative magnetic separation and flow cytometry. CD4+ T cells were cultured with a density of 2×10⁶ cells/mL in Roswell Park Memorial Institute (RPMI) 1640 complete medium with 10% fetal bovine serum (FBS) with plate bound CD3 and CD28 for 48 hours. Different concentrations of CNPs (0.1, 1, and 10 μg/mL) were added and the cells were incubated for 24 hours followed by addition of 10 μL of 5 mg/mL MTT (Sigma-Aldrich Co.). After 4 hours the formazan crystals were dissolved in 100 μL of dimethyl sulfoxide and the plate was read at 570 nm.
Internalization of CNPs by FACS using CD4 and fluorescein isothiocyanate
Splenocytes were isolated from C57BL/6J mice to analyze the internalization of CNPs inside the cells. Cells (1×10⁶/mL) were cultured in RPMI 1640 complete medium supplemented with 10% FBS with antibiotics and kept at 37°C in a humidified atmosphere saturated with 5% CO2. CNP-fluorescein isothiocyanate (FITC) conjugate was prepared by overnight incubation of CNPs and FITC. CNPs or CNP-FITC (25 μg/mL) were added to the cells for different time periods (2 hours and 24 hours). Cells were washed thoroughly 4–5 times and stained with CD4-allophycocyanin (APC) (1:1,000) for 30 minutes at 4°C. Cells were then washed with excess fluorescence-activated cell sorting (FACS) buffer (phosphate buffered saline [PBS] +2% FBS) and resuspended in 300 μL of FACS buffer. The cells were analyzed for FITC internalization and CD4 staining using FACS CANTO (BD Biosciences, San Jose, CA, USA). Data from the flow cytometer were then analyzed using FACS DIVA software (BD Biosciences).
Immune response of CNPs in sera of mice
To understand whether the CNP-conjugate elicits any antigen-specific immune responses in vivo, CNP-conjugate (50 μg/mice) was injected intravenously. The immunoglobulin measurements were done after 7 days using a mouse immunoglobulin assay kit (BD Biosciences). All the immunoglobulins, including IgG1, IgG2a, IgG2b, IgG3, IgM, IgA, Igλ, and Igκ were measured and a graph was plotted with dilution versus optical density (OD).
FACS
Anti-CD4, anti-CD62L, anti-CD44, anti-CD25, and anti-IL-17 were purchased from BD Biosciences. Naïve T cell isolation was done as previously described.10 CD4+ T cells were first enriched by magnetic-activated cell sorting beads (autoMACS; Miltenyi Biotec, San Jose, CA, USA), and then further purified using FACS ARIA (BD Biosciences) with >95% purity.
In vitro Th17 polarization from naïve T cells
Sorted naïve CD4+ CD25− CD62LhiCD44lo T cells were activated with plate-bound anti-CD3e (1 μg/mL; 2C11) and anti-CD28 (2 μg/mL; 37.51) in the presence of IL-6 (10 ng/mL), TGF-β (R&D Systems, Inc., Minneapolis, MN, USA) (5 ng/mL), anti-IFN-γ (10 μg/mL), and anti-IL-4 (10 μg/mL). All the antibodies were obtained from BD Pharmingen (San Jose, CA, USA) unless mentioned otherwise. Cells were cultured in RPMI 1640 (Gibco, Thermo Fisher Scientific, Waltham, MA, USA) supplemented with 10% FBS with antibiotics and kept at 37°C in a humidified atmosphere saturated with 5% CO2. CD4+ T cells primed for 4 days in wells were expanded on day 4 with/without (for Th17 culture) 50UmL−1 IL-2 until day 7.
EAE induction
Induction of EAE in mice was performed as described earlier.8 Briefly, active EAE was induced by immunization with 300 (for survival analysis) or 150 μg (for all other experimental analysis) MOG p35–55 emulsified in complete Freund’s adjuvant (CFA) (Sigma-Aldrich Co.), supplemented with 400 μg/mL Mycobacterium tuberculosis. Flanks of each leg received emulsions as four subcutaneous injections (50 μL). Also, 200 ng pertussis toxin (Sigma-Aldrich Co.) dissolved in 200 μL PBS was injected intraperitoneally on days 0 and 2 after immunization. Data of survival group of mice during experimentation was plotted using GraphPad Prism software. Clinical assessment of EAE was performed daily after disease induction according to the following criteria: 0, no disease; 1, decreased tail tone; 2, hind limb weakness or partial paralysis; 3, complete hind limb paralysis; 4, forelimb and hind limb paralysis; 5, moribund state. Daily clinical scores were calculated as the average of all individual disease scores of each group, including mice not developing clinical signs of EAE.
Re-stimulation experiments with MOG
This experiment was done to check the efficiency of the CD4+ T cells from control and CNP-conjugate treated mice to secrete pro-inflammatory cytokine IL-17. Briefly, splenocytes were isolated from control and treated mice 20 days post-immunization for EAE disease. These cells were cultured in the presence of increasing concentrations (10 and 50 μg/mL) of MOG to re-stimulate the T cells. Supernatants were analyzed to quantify the secretion of IL-17 measured with DuoSet enzyme-linked immunosorbent assay (ELISA) kits (R&D Systems, Inc.). ELISA plates were developed with 3,3′,5,5′-Tetramethylbenzidine (TMB) substrate (BD Pharmingen), and read with a microplate reader (Bio-Rad Laboratories Inc., Hercules, CA, USA).
Intracellular cytokine staining
For intracellular cytokine staining, in vitro cultured cells were re-stimulated with phorbol myristate acetate (Sigma-Aldrich Co.; 50 ng/mL) and ionomycin (Sigma-Aldrich Co.; 1 mM) for 4 hours. GolgiStop (BD Biosciences) was added during the last 3 hours of re-stimulation. After staining for extracellular markers, cells were fixed, permeabilized, and stained intracellularly for specific cytokines. IL-17-PE and CD4-PerCP Cy5.5, (BD Biosciences) were used. Cells were analyzed on a FACS CANTO flow cytometer (BD Biosciences), and data analyzed by FACS DIVA software.
Dot blot assay
In this assay, the promoter fragment of IL-17 was amplified by polymerase chain reaction (PCR) and spotted on the membrane and allowed to bind at 37°C. The membrane was blocked with BSA followed by addition of conjugate of gold nanoparticles and SMAR1 DBD. For the conjugation of gold nanoparticles and protein, the pH of synthesized gold nanoparticles was adjusted to 9 by using potassium carbonate, followed by protein addition and incubation for 10 minutes at room temperature. After centrifugation at 10,000 rpm for 10 minutes, 2 μL of the conjugated pellet was used for the assay. The membrane was washed several times with the buffer and checked for the red color formation indicating the binding of the protein to the promoter fragment.
Chromatin immunoprecipitation assay
Chromatin immunoprecipitation (ChIP) assays were done as previously described.10 In brief, naïve CD4+ T cells polarized under various conditions were treated with 1% formaldehyde to crosslink protein to DNA. Cells were lysed, and chromatins were sheared to ~500 bp using a bioruptor (Diagenode, Rue Bois Saint-Jean, Seraing, Belgium). Cells were then subjected to immunoprecipitation with anti-pSTAT3 (Santa Cruz Biotechnology Inc., Dallas, TX, USA). Control isotype (purified rabbit IgG) was also used to normalize the non-specific binding. After de-crosslinking, the immunoprecipitated chromatin DNA was PCR amplified for STAT binding region of the SMAR1 promoter (SPr) forward: 5′-GCCACTGAACGAGCCCGGAA-3′ and reverse: 5′-AGTCTCTGCGGCCATGATTT-3. PCR conditions used were: 95°C for 5 minutes, 95°C for 30 seconds, 58°C for 30 seconds, 72°C for 45 seconds (40 cycles), and 72°C for 10 minutes. The resulting DNA was also analyzed by real-time PCR to determine the relative enrichment (2^ (ΔCt of the control–ΔCt of the sample)).
Immunofluorescence staining
Purified naïve CD4+ T cells were cultured under unstimulated conditions (Th0). Cells were harvested and fixed in 4% paraformaldehyde, permeabilized with 0.1% Triton X-100, and incubated with anti-SMAR1 (Bethyl Laboratories, Montgomery, TX, USA) or anti-SMAD, (Santa Cruz Biotechnology Inc.) antibodies. They were counterstained using the anti-mouse or anti-rabbit fluorescently labeled secondary antibodies (EMD Millipore, Billerica, MA, USA). For nuclear staining, cells were treated with 4,6-diamidino-2-phenylindole dihydrochloride (Fluka, St Louis, MO, USA). Cytospinning was done to mount the cells onto the confocal slides. Coverslips were then mounted with fluorescent mounting media (Dako Denmark A/S, Glostrup, Denmark) and examined under a Zeiss LSM-510 meta confocal laser scanning microscope (Carl Zeiss Meditec AG, Jena, Germany).
Quantitative real-time PCR and Western blotting
Gene expression was examined using a thermocycler (Eppendorf, Hauppauge, New York, NY, USA) with an iQ SYBR Green Real-Time PCR kit (Bio-Rad Laboratories Inc.). Data were normalized to expression of GAPDH (reference gene). Transcripts of SMAR1 forward: 5′-GCATTGAGGCCAAGCTGCAAGCTC-3′, reverse: 5′-CGGAGTTCAGGGTGATGAGTGTGAC-3′, GAPDH forward: 5′-AATTCAACGGCACAGTCAAAGCCGAGAATG-3′, reverse: 5′-GCGGCACGTCAGATCCACGCAGGAC-3′ were amplified by PCR. For immunoblot analysis, 50 μg of protein from whole T cell lysates was resolved by sodium dodecyl sulfate–polyacrylamide gel electrophoresis. After transferring the proteins to polyvinyl difluoride membrane it was probed using SMAD1/2/3, pSTAT3 (Santa Cruz Biotechnology Inc.), SMAR1 (Bethyl Laboratories), and β-actin (Santa Cruz Biotechnology Inc.) antibodies using a standard protocol.
Results
Synthesis and characterization of nanospheres
The carbon nanoparticles were synthesized in a Teflon lined vessel containing 0.6 M dextrose solution at 180°C for 2 hours. After the reaction, the particles were washed and suspended in deionized water for further use. The synthesized nanoparticles were imaged by AFM in contact and non-contact mode with probes supplied by budget sensors. Measurements were performed in ambient conditions. Image resolution was between 256×256 pixels with a scan speed of 1 μm/s. Next, we sought to analyze the shape of the nanoparticles. For this, we utilized AFM. From the data we received from AFM, we confirmed that the particles had symmetrical spherical morphology (Figure 1A). After conjugating the protein with nanoparticles, the particles have a tendency to aggregate into small clusters deviating from their natural colloidal nature which is clearly evident in the AFM images (Figure 1B). To avoid this clustering, the particles were sonicated for 15 seconds to bring them back to their colloidal nature, making them functionally active. The functional groups on nanoparticles were measured using FTIR. By using this technique, we acquired infrared spectrum of absorption of the nanoparticles. The surface functional groups on carbon nanospheres were mainly the -OH and the C=O groups confirmed by FTIR. The band observed at 1,725–1,700 cm−1 can be assigned to the carbonyl groups of aldehydes. The broad band at 2,900–3,200 cm−1 can be allocated to -OH bonds (Figure 1C). The presence of hydroxyl and carbonyl groups made the CNPs hydrophilic, and the particles were readily dispersible in water. The conjugated nanoparticles showed an increased size (Figure 1D). The interaction of nanoparticles with the biological samples depends on the charge of the nanoparticles. The zeta potential of the carbon nanospheres dispersed in deionized water was found to be −22 mV. When the carbon nanospheres were conjugated with DBD of SMAR1, coated with PEG (~8,000 MW), the zeta potential shifted to positive, confirming conjugation (Figure 1E). The schematic representation of nanoparticles conjugated with the SMAR1 protein is represented in Figure 1F.
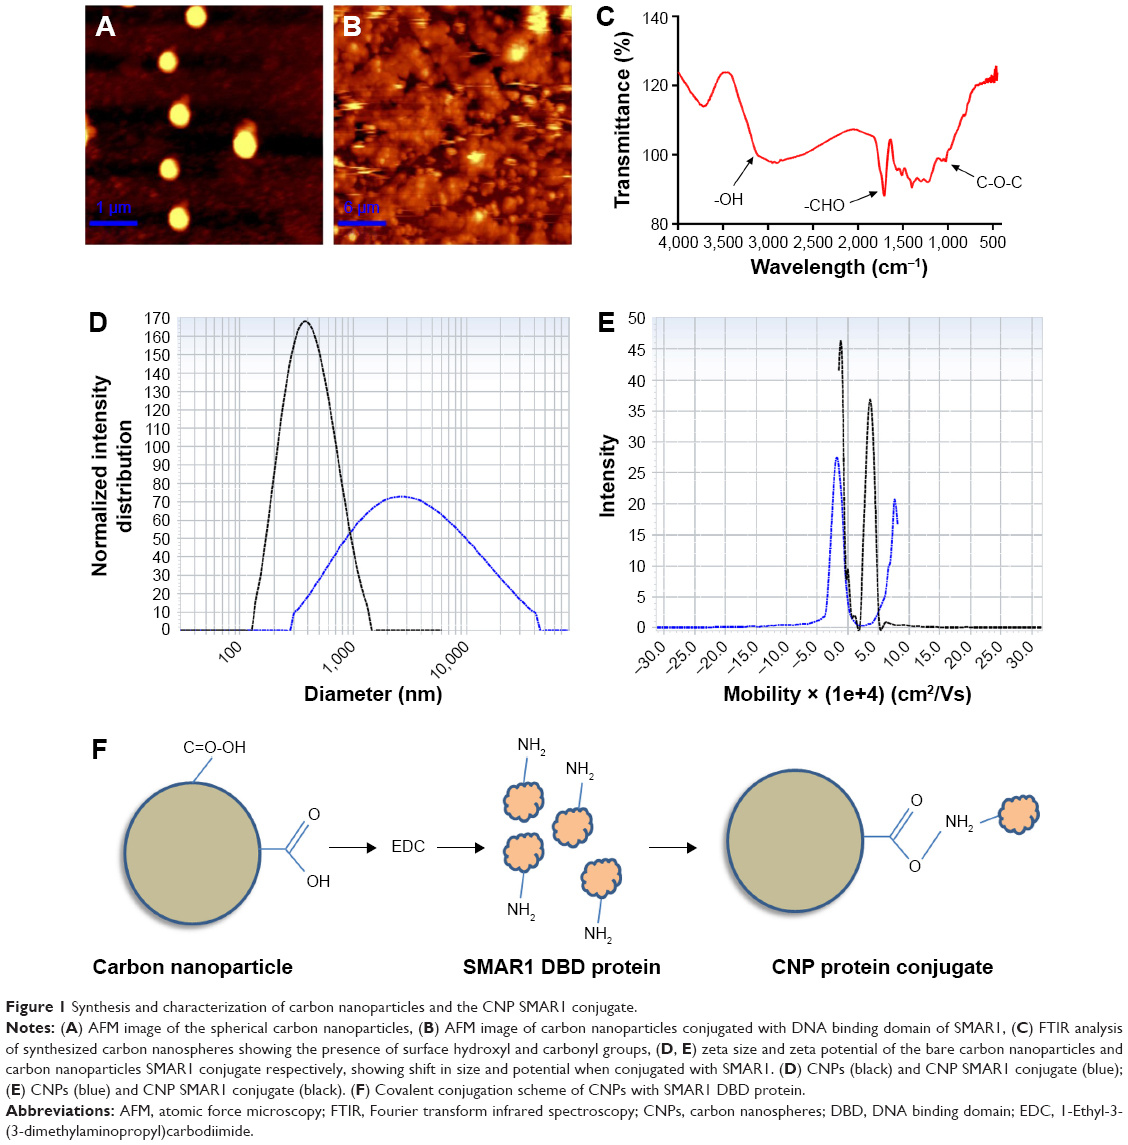 | Figure 1 Synthesis and characterization of carbon nanoparticles and the CNP SMAR1 conjugate. |
Toxicity and internalization of carbon nanospheres
After synthesizing the carbon nanospheres, they were further evaluated for toxicity in T cells using MTT assay. As shown in Figure 2A, increasing the concentration of CNPs did not have any toxic effect on the cells. No toxicity was shown in 100 ng and 1 μg of nanoparticles. While the increasing concentration of nanoparticles (10 μg/mL) hindered the absorbance, no toxicity was shown in 100 ng and 1 μg of nanoparticles. These data conclude that CNPs were non-toxic to the survival of T cells.
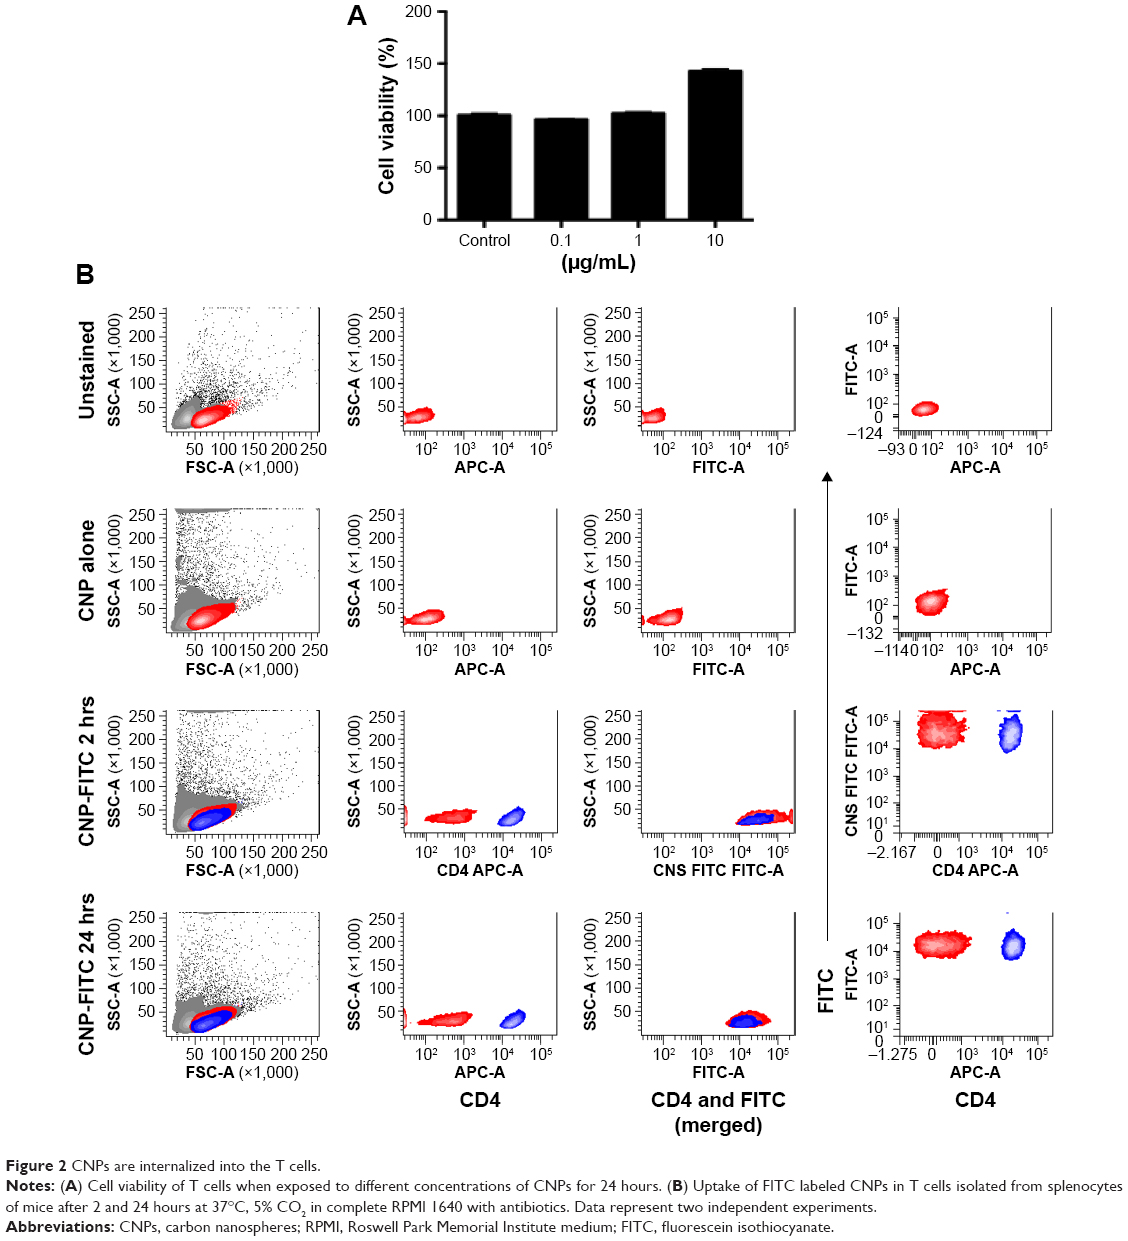 | Figure 2 CNPs are internalized into the T cells. |
Since we noticed that CNPs were non-toxic to T cells, their uptake by the T cells was analyzed using FACS. As shown in Figure 2B, uptake of nanoparticles was observed in T cells within 2 hours of treatment. This result shows that CNPs can efficiently pass through the cell membrane of T cells, which might be through non-specific pinocytosis.
Immune response of carbon nanospheres
Since we knew that the CNPs were non-toxic to the T cells, it intrigued us to investigate the effect of these nanoparticles in vivo. One of the major hurdles of nanoparticle research is to avoid the unwanted and non-specific physiological effects or side effects of the nanoparticles. To verify whether the CNP-SMAR1 conjugate induces any unwanted immune responses in mice, 50 μg of the CNP-protein conjugate was injected intravenously. A complete immunoglobulin profiling was done in the sera of these mice 7 days after injection. Sera were diluted 1,000 times, and serial dilutions were made to analyze significant changes in the antibody titration by measuring the OD at 600 nm. As shown in Figure 3, no specific immune response was elicited against the CNPs evidenced by the similar levels of IgGs. IgM showed marginal induction that may be due to negligible non-specific immune response. The results suggested that CNPs did not induce endogenous immune response even after intravenous administration.
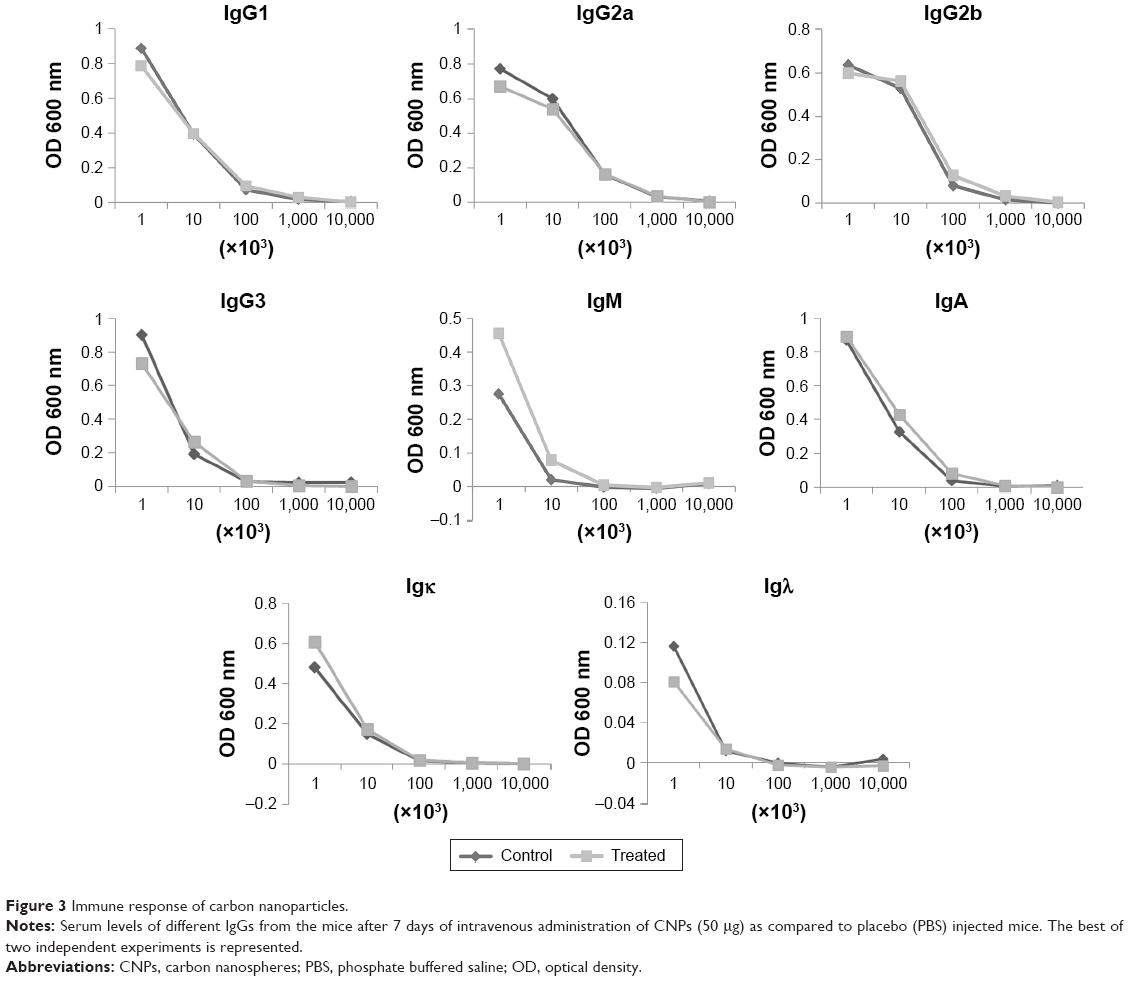 | Figure 3 Immune response of carbon nanoparticles. |
Regulation of SMAR1 during Th17 differentiation
Recent research interest in T cell biology focused more on the regulation of Th17 cells as they are crucial for elicitation of inflammatory and autoimmune responses.2 Our previous report suggested that SMAR1 is downregulated in both pro-inflammatory Th1 and Th17 cells.10 A series of experiments were performed to check the role of SMAR1 in Th17 differentiation. Western blot analysis showed reduced SMAR1 expression at different time points of Th17 differentiation that is inversely correlated with increased pSTAT3 and SMAD activation (Figure 4A). We have described a crucial MAR binding site on the IL-17A promoter where SMAR1 binds through direct interaction.12 To validate the binding ability of SMAR 1 proteins’ DBD (SMAR1 DBD) with the IL-17 promoter, it was evaluated by dot blot assay. In this test the promoter fragment amplified by PCR was spotted and allowed to bind to the membrane at 37°C. Subsequently, the membrane was blocked with BSA and then the conjugate of gold nanoparticles and SMAR1 DBD was added. The membrane was washed several times with the buffer and checked for a red color formation that indicated the binding of protein to the IL-17 promoter (Figure 4B). This experiment showed the direct binding interaction of SMAR1 DBD to the IL-17 promoter in the absence of full-length protein. SMAR1 down-regulation during Th17 differentiation was further verified by confocal analysis with TGF-β or IL-6 alone or combined. The result revealed a drastic down-regulation of SMAR1 (red) under TGF-β and IL-6 combined signaling. SMAD1/2/3 proteins (green) were used as positive controls (Figure 4C).
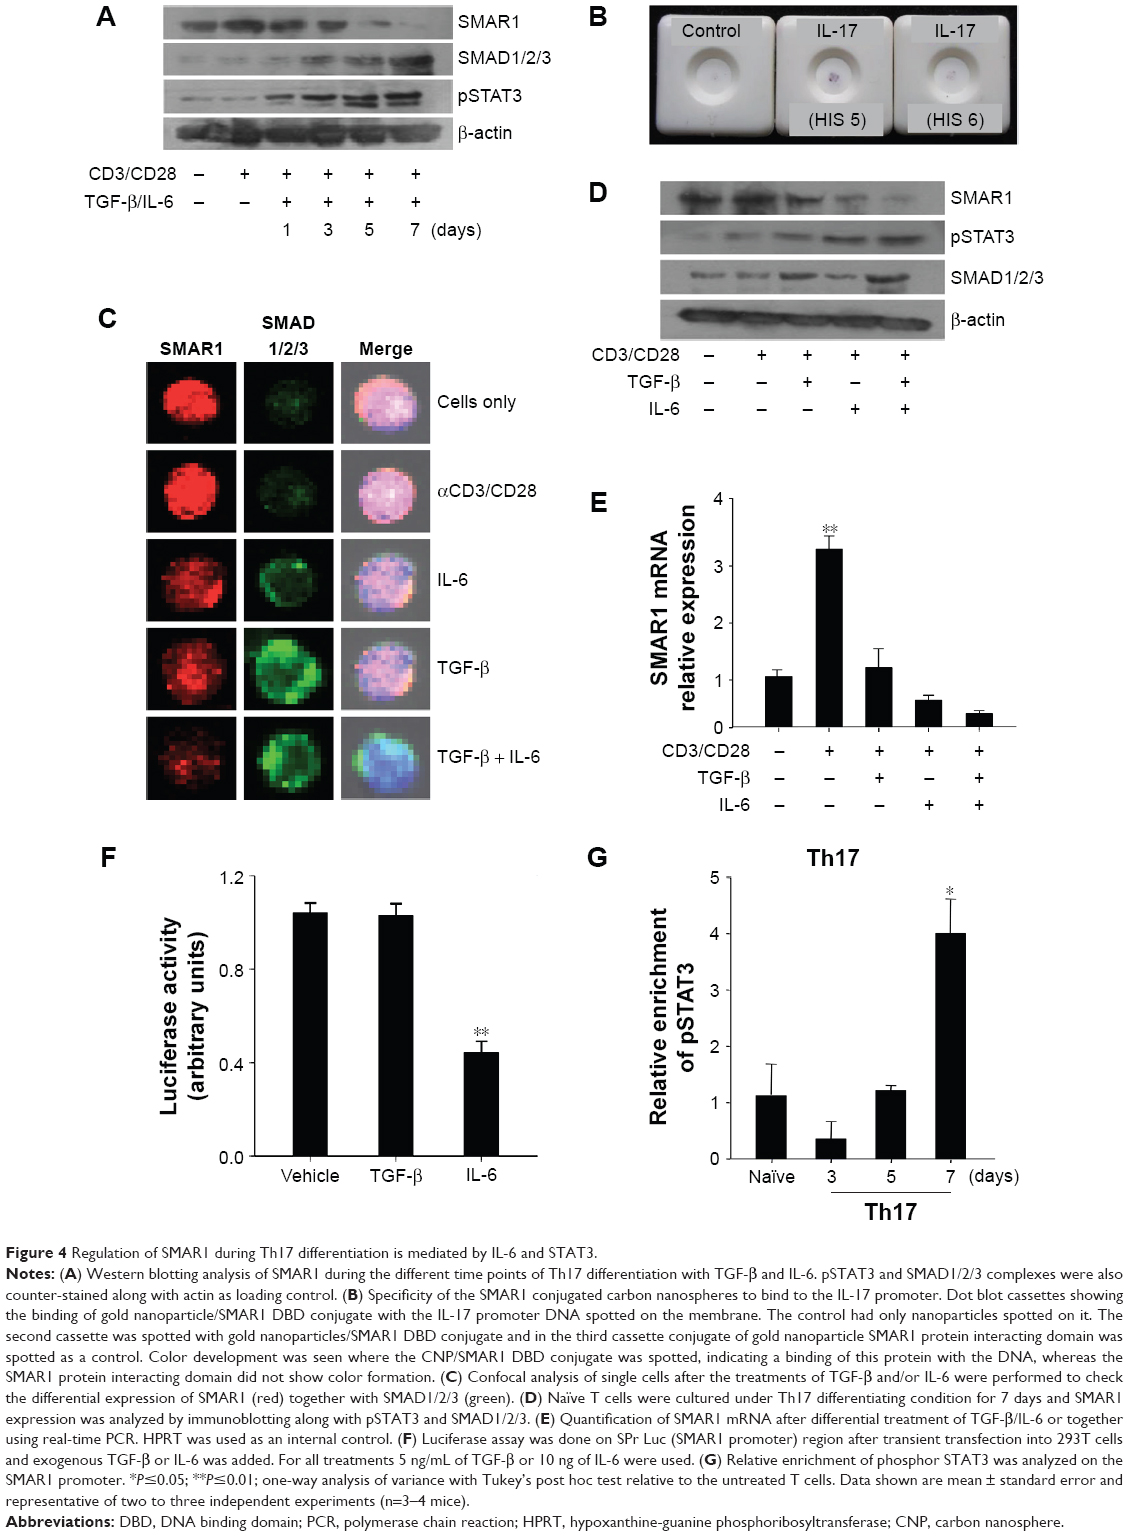 | Figure 4 Regulation of SMAR1 during Th17 differentiation is mediated by IL-6 and STAT3. |
To understand the signaling factors inhibiting SMAR1 under Th17 condition, TGF-β and IL-6 were administered separately or together in the cultures. SMAR1 expression was observed to be inversely correlated with IL-6 mediated pSTAT3, and not with SMAD signaling, at the protein (Figure 4D) as well as at the transcription levels (Figure 4E). Results from the real-time experiment showed us the quantification of SMAR1 gene expression, which is regulated at the transcription level. To further understand the IL-6 mediated down-regulation of SMAR1 gene expression, we performed luciferase assay using SMAR1 promoter luciferase construct and supplementation of TGF-β or IL-6 separately. We observed an IL-6 dependent down-regulation of SMAR1 promoter activity (Figure 4F) but not with TGF-β treatment. Since SMAR1 was downregulated after IL-6 treatment and activation of STAT3, we assumed SMAR1 gene would be negatively regulated by pSTAT3. ChIP assays were carried out for the relative enrichment of pSTAT3 on the SMAR1 promoter, during Th17 differentiation programs. As shown in Figure 4G, we noticed specific enrichment of pSTAT3 on SMAR1 promoter during the later time points in Th17 differentiated cells. These results confirm that regulation of SMAR1 is a distinctly controlled mechanism specific to Th17 differentiation pathway.
SMAR1 knockout mice susceptible to EAE
To confirm the effect of SMAR1 on Th17 differentiation and associated inflammation, we employed a classic Th17 mediated EAE model in mice. For this WT and SMAR1−/− mice were immunized with MOG in CFA subcutaneously along with Bordetella pertussis vaccine. After inducing the disease with normal 300 μg of MOG, a severe disease progression and death of SMAR−/− mice was observed compared to the WT mice (six out of eight mice) (Figure 5A). A low level of MOG (150 μg/mice) induced severe neuronal impairment in SMAR1−/− mice with a lack of coordination, severe difficulty in walking, and associated paralysis of limbs (no death was observed during this treatment). We noticed early and enhanced disease progression in SMAR1−/− mice compared to the WT mice (Figure 5B). Histology sections revealed progressive cell infiltrations in the spinal cord of SMAR1−/− mice (Figure 5C). Next, to understand the efficiency of IL-17 secretion of T cells from WT and SMAR1−/− mice, splenocytes from MOG stimulated mice 40 days post-immunization were isolated and re-stimulated with MOG. The secretion of IL-17 by the splenic T cells after re-stimulation of MOG was also high (double) in the SMAR1−/− mice compared to the WT mice (Figure 5D). The pro-inflammatory cytokine IL-17 plays a pathogenic role in EAE progression.17 To this end, we checked the IL-17 level from WT and SMAR1−/− mice. Flow cytometric data showed the expression of IL-17 was significantly high in SMAR1−/− mice compared to WT mice (Figure 5E). Thus, SMAR1 deficiency in T cells caused aberrant immune responses with physiological consequences in vivo.
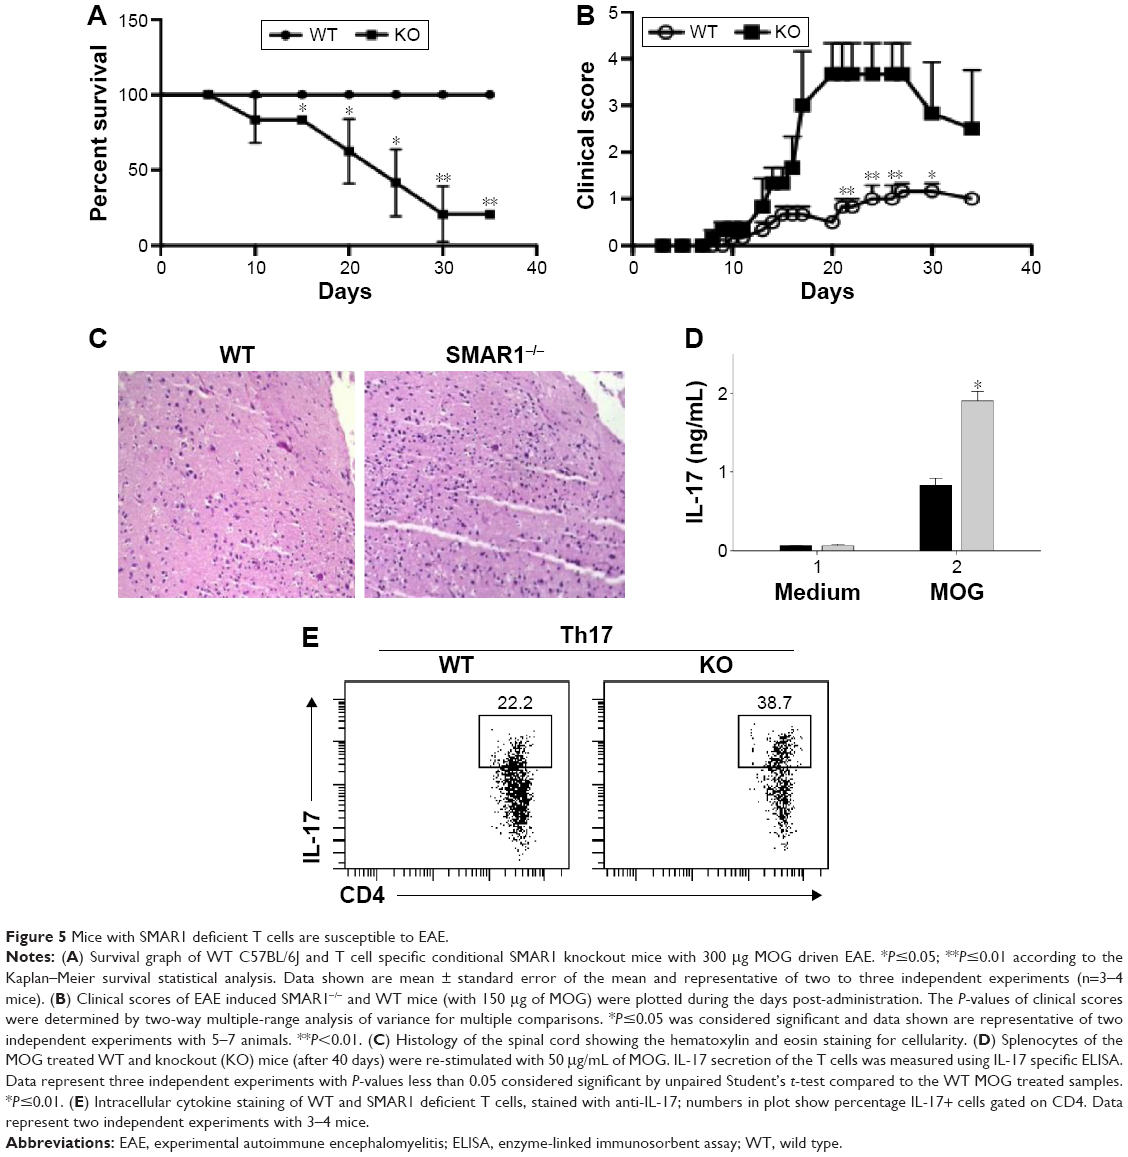 | Figure 5 Mice with SMAR1 deficient T cells are susceptible to EAE. |
Effect of CNP/SMAR1 DBD conjugate on EAE mice
EAE is a well-established model for Th17 mediated CNS autoimmune inflammation against myelin protein.8 T cells activated against MOG cross the blood–brain barrier, disrupted due to pertussis toxin. The MOG reacts against the myelin protein causing the formation of white plaque in the brain and spinal cord. Further, in this disease, more immune cell infiltration into the CNS and symptomatic paralysis of the peripheral organs in mice is seen. Initial subcutaneous administration of MOG in CFA activates the T cells against the antigen in the mice. These activated T cells react with the similar myelin protein in the CNS and induce IL-17 mediated inflammation and demyelination.9 Previous results suggest that SMAR1 acts as a negative inhibitor of Th17 mediated inflammation. Our data showed that T cell specific SMAR1−/− knockout mice have been proven to have enhanced Th17 driven experimental animal encephalomyelitis. Thus, we assumed exogenous nanoparticle mediated delivery of SMAR1 into null T cells might reverse the disease progression in these susceptible mice, and this strategy can be utilized for replenishment therapy. For this, we induced EAE in SMAR1−/− mice with MOG and followed the disease progression. An amount of 150 μg of MOG p35–55 peptide emulsified in CFA and containing 4 mg/mL of heat-killed Mycobacterium tuberculosis H37Ra was administered subcutaneously in mice. Pertussis toxin (100 ng) was injected intraperitoneally on day 0 and 2. The mice were then randomly segregated into three groups. Two groups of mice were administered carbon nanospheres (25 μg/mice) and SMAR1 conjugated carbon nanospheres (25 μg/mice and SMAR1 50 μg/mice) respectively from day 7 onwards for a week (Figure 6A). PBS was administered as placebo in a third group of control mice. As shown in the clinical score plotted against the days post-immunization (Figure 6B), symptoms of the disease started appearing from the 10th day onwards with partial tail drooping. Control mice exhibited severe disease with complete tail and hind limb paralysis. We observed similar symptoms in the CNPs group. Interestingly, when we analyzed the CNP-protein conjugate group, the disease progression was significantly low. Moreover, the disease progression was halted at partial tail drooping with no paralysis of the limbs. Each group had five mice, and the results were statistically verified using two-way multiple-range analysis of variance (ANOVA) for multiple comparisons with P<0.01 and P<0.005 considered significant. This result shows that conjugation of a nanoparticle with SMAR1 protein as low as 50 μg/mice had a significant biological effect in combating the Th17 mediated EAE disease progression.
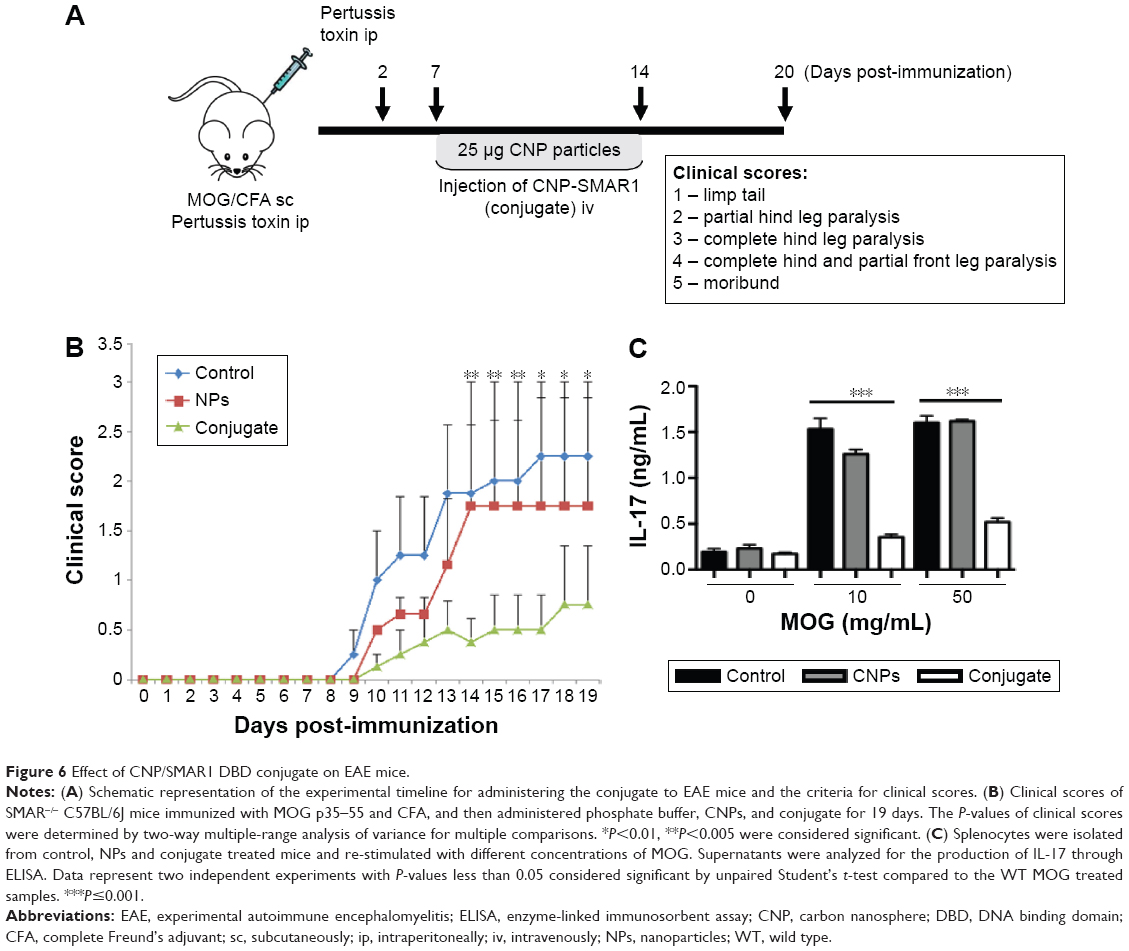 | Figure 6 Effect of CNP/SMAR1 DBD conjugate on EAE mice. |
To check whether the aberrant disease progression in CNP-SMAR1 treated mice is due to decreased ability of T cells to secrete IL-17, we analyzed the ability of T cells to react against re-stimulation of MOG peptide. T cells in our bodies respond vigorously when an exposed antigen is re-administered to mount a secondary immune response. Thus, if the T cells are reacting against the antigen, it will secrete the cytokine specific to EAE disease, which is IL-17. For this, splenocytes from control, CNPs, and CNPs-SMAR1 treated mice were isolated and cultured at a density of 2×10⁶ cells/mL in complete RPMI. MOG peptide was added at 10 μg and 50 μg/mL concentration, and the splenocytes were cultured for 48 hours. Supernatants were harvested and analyzed for IL-17 cytokine secretion (Figure 6C) which clearly demonstrated that the secretion of IL-17 in the CNPs SMAR1 conjugate treated mice were three-fold lower compared to control or CNPs alone treated mice. These results verify that the CNP-SMAR1 conjugate renders resistance to EAE disease progression by blocking the secretion of IL-17 from T cells.
Discussion
The study shows that CNPs can be used as an efficient carrier system to deliver the proteins inside the cells. These CNPs can be utilized further in the most demanding field of protein-based therapeutics. Proteins like insulin, antibodies, interleukins, etc are used in protein therapeutics. Recent research interest focuses more on direct delivery of proteins into mammalian cells and giving their functional attributes by carbon nanotubes.15 Moreover, carbon nanospheres have also been reported to cross the blood–brain barrier and regulate gene expression. Here, the CNPs were synthesized through a green chemistry method that did not require any hazardous chemicals. The CNPs were spherical and had -COOH and -OH functionalities on their surface, making it easy for conjugation with proteins. The CNPs formed were ready to use without involving further treatments to make them favorable for conjugation. Toxicity of the carbon nanospheres was checked, and they were non-toxic. As they were to be used as a carrier, internalization studies were carried out. FACS results suggested that CNPs entered the cells. Thus, these carbon nanospheres can be used as a carrier to deliver a protein. The nanospheres were also checked for their immunogenic property and were found to be non-immunogenic. They did not elicit any specific immune response, which is the primary concern when using nanoparticles for therapy.
Reports from our group suggest that SMAR1 is downregulated under Th1 and Th17 differentiation conditions.12 Delineating the path and signaling factors, we observed that IL-6 downregulated SMAR1 gene expression and not the TGF-β signaling alone. We had previously reported that SMAR1 can regulate IL-17 gene expression by directly binding to the promoter and epigenetically modifying the chromatin.12 In line with this, we show that deficiency of SMAR1 in T cells renders the mice susceptible to MOG driven EAE disease with higher IL-17 producing T cells. Thus, our conditional knockout mice model serves as an ideal scenario to investigate the reversal of the disease progression using exogenously supplemented SMAR1 protein associated with the nanoparticle-based delivery system. The non-conditional SMAR−/− or complete knockout of SMAR1 is embryonically lethal.12 We employed CNPs to deliver the SMAR1 protein inside the T cells and modulate the immune response. SMAR1 is a 60 kda protein (548 amino acid). The region of 160–350 amino acids of SMAR1 contains arginine serine rich motifs and serves as a protein interaction domain and C-terminal region whereas 350–548 amino acids region is characterized as DBD.21 Our results show that the C-terminal domain, ie, the DBD alone can serve an anti-inflammatory function. When the conjugate was administered to EAE induced conditional SMAR1−/− mice, the progression of the disease was slow as compared to the untreated SMAR1−/− EAE mice. The result was significant from the 14th–19th day of the disease. In the experiments conducted, mice injected only with CNPs were used as control. As can be noticed in Figure 6B, nanoparticle alone treated mice behaved similarly to the control untreated mice. We also analyzed the immune response when CNP-SMAR1 was injected into mice (Figure 3) which showed minimal change in the IgGs compared to non-injected mice. From these results, we can conclude that nanoparticles were not inherently toxic to mice, which was a major concern as the conjugate might be delivered to other sites than T cells. CNP mediated delivery of SMAR1 DBD could efficiently repress the physiological disease condition of EAE in mice as the levels of IL-17 correspond to the pathogenesis of EAE. The distribution of CNP-SMAR1 was not checked in mice, as previous reports suggested permeability of CNPs to different organs like the liver and spleen. The CNPs do not remain in the organs and only a trace amount was seen 9 days after injection.19 In this report, we show that intravenous delivery of SMAR1 conjugated CNPs has an anti-inflammatory effect. In our study, we assessed the C-terminal domain of SMAR1 (for the first time) to modulate EAE disease. This result is crucial when we consider using this protein in therapeutics, as a higher number of protein molecules can be loaded on a nanoparticle compared to the whole protein. By doing so, it can help us to reduce the therapeutic amount of protein used for controlling EAE. We propose that carbon nanoparticles can be used as an efficient protein carrier and that its possible applications in therapeutics should be investigated. A recent study has shown that nanoparticle mediated peptide delivery can be used to suppress autoimmune disease,22 and another report showed that an increase in the differentiation of Tregs suppressed the development of EAE.23 The use of CNP-SMAR1 DBD can be a good alternative for regulating unwanted autoimmune disease.
Conclusion
The study demonstrated the excellent therapeutic efficacy of CNP/SMAR1 protein conjugate in controlling the EAE disease in SMAR1−/− mice. Here, we have shown for the first time that a domain of the protein, (DBD of SMAR1) can be used for controlling inflammation in EAE using CNPs. These data, along with the previously published research work highlight the potential of using carbon nanospheres and SMAR DBD conjugate for the treatment of EAE and controlling inflammation.
Acknowledgments
We thank Director, NCCS, Dr Shekhar Mande and Director, ARI, Dr Kishore M Paknikar for giving us the opportunity to work on this project. We thank Dr LS Limaye, Mrs Trupti Joshi for FACS facility, and Dr Rahul Bankar and Mr ML Shaikh for assistance with animal husbandry.
Author contributions
All authors made substantial contributions to conception and design, acquisition of data, or analysis and interpretation of data; took part in drafting the article or revising it critically for important intellectual content; gave final approval of the version to be published; and agree to be accountable for all aspects of the work.
Disclosure
SVC and PB are funded by CSIR, Government of India. BM is a recipient of ICMR fellowship. The authors report no other conflicts of interest in this work.
References
World Health Organization. Atlas: Multiple Sclerosis Resources in the World 2008. Geneva: World Health Organization; 2008. Available from: http://www.who.int/mental_health/neurology/Atlas_MS_WEB.pdf. Accessed April 7, 2016. | ||
Becher B, Segal BM. T(H)17 cytokines in autoimmune neuro-inflammation. Curr Opin Immunol. 2011;23(6):707–712. | ||
Compston A, Coles A. Multiple sclerosis. Lancet. 2002;359(9313):1221–1231. | ||
Frohman EM, Racke MK, Raine CS. Multiple sclerosis – the plaque and its pathogenesis N Engl J Med. 2006;354(9):942–955. | ||
Manouchehrinia A, Constantinescu CS. Cost-effectiveness of disease-modifying therapies in multiple sclerosis. Curr Neurol Neurosci Rep. 2012;12(5):592–600. | ||
Pittock SJ, Lucchinetti CF. The pathology of MS: new insights and potential clinical applications. Neurologist. 2007;13(2):45–56. | ||
Batoulis H, Recks MS, Addicks K, Kuerten S. Experimental autoimmune encephalomyelitis – achievements and prospective advances. APMIS. 2011;119(12):819–830. | ||
Bettelli E, Korn T, Oukka M, Kuchroo VK. Induction and effector functions of TH17 cells. Nature. 2008;453(7198):1051–1057. | ||
Chen G, Shannon M. Transcription factors and th17 cell development in experimental autoimmune encephalomyelitis. Crit Rev Immunol. 2013;33(2):165–182. | ||
Chattopadhyay S, Kaul R, Charest A, Housman D, Chen J. SMAR1, a novel, alternatively spliced gene product, binds the Scaffold/Matrix-associated region at the T cell receptor β locus. Genomics. 2000;68(1):93–96. | ||
Kaul-Ghanekar R, Majumdar S, Jalota A, et al. Abnormal V(D)J recombination of T cell receptor beta locus in SMAR1 transgenic mice. J Biol Chem. 2005;280(10):9450–9459. | ||
Chemmannur SV, Badhwar AJ, Mirlekar B, et al. Nuclear matrix binding protein SMAR1 regulates T-cell differentiation and allergic airway disease. Mucosal Immunol. 2015;8(6):1201–1211. | ||
Rampalli S, Pavithra L, Bhatt A, Kundu TK, Chattopadhyay S. Tumor suppressor SMAR1 mediates cyclin D1 repression by recruitment of the SIN3/histone deacetylase 1 complex. Mol Cell Biol. 2005;25(19):8415–8429. | ||
Sinha S, Malonia SK, Mittal SP, et al. Coordinated regulation of p53 apoptotic targets BAX and PUMA by SMAR1 through an identical MAR element. EMBO J. 2010;29(4):830–842. | ||
Tang R, Kim CS, Solfiell DJ, et al. Direct delivery of functional proteins and enzymes to the cytosol using nanoparticle-stabilized nanocapsules. ACS Nano. 2013;7(8):6667–6673. | ||
Utama RH, Guo Y, Zetterlund PB, Stenzel MH. Synthesis of hollow polymeric nanoparticles for protein delivery via inverse miniemulsion periphery RAFT polymerization. Chem Commun (Camb). 2012;48(90):11103–11105. | ||
Grenha A, Seijo B, Remuñán-López C. Microencapsulated chitosan nanoparticles for lung protein delivery. Eur J Pharm Sci. 2005;25(4–5):427–437. | ||
Katas H, Raja MA, Lam KL. Development of Chitosan Nanoparticles as a Stable Drug Delivery System for Protein/siRNA. Int J Biomater. 2013;2013:146320. | ||
Selvi BR, Jagadeesan D, Suma BS, et al. Intrinsically fluorescent carbon nanospheres as a nuclear targeting vector: delivery of membrane-impermeable molecule to modulate gene expression in vivo. Nano Lett. 2008;8(10):3182–3188. | ||
Hasadsri L, Kreuter J, Hattori, Iwasaki T, George JM. Functional protein delivery into neurons using polymeric nanoparticles. J Biol Chem. 2009;284(11):6972–6981. | ||
Malonia SK, Sinha S, Lakshminarasimhan P, et al. Gene regulation by SMAR1: Role in cellular homeostasis and cancer. Biochim Biophys Acta. 2011;1815(1):1–12. | ||
Carambia A, Freund B, Schwinge D, et al. Nanoparticle-based autoantigen delivery to Treg-inducing liver sinusoidal endothelial cells enables control of autoimmunity in mice. J Hepatol. 2015;62(6):1349–1356. | ||
Yeste A, Nadeau M, Burns EJ, Weiner HL, Quintana FJ. Nanoparticle-mediated codelivery of myelin antigen and a tolerogenic small molecule suppresses experimental autoimmune encephalomyelitis. Proc Natl Acad Sci. 2012;109(28):11270–11275. |
 © 2016 The Author(s). This work is published and licensed by Dove Medical Press Limited. The full terms of this license are available at https://www.dovepress.com/terms.php and incorporate the Creative Commons Attribution - Non Commercial (unported, v3.0) License.
By accessing the work you hereby accept the Terms. Non-commercial uses of the work are permitted without any further permission from Dove Medical Press Limited, provided the work is properly attributed. For permission for commercial use of this work, please see paragraphs 4.2 and 5 of our Terms.
© 2016 The Author(s). This work is published and licensed by Dove Medical Press Limited. The full terms of this license are available at https://www.dovepress.com/terms.php and incorporate the Creative Commons Attribution - Non Commercial (unported, v3.0) License.
By accessing the work you hereby accept the Terms. Non-commercial uses of the work are permitted without any further permission from Dove Medical Press Limited, provided the work is properly attributed. For permission for commercial use of this work, please see paragraphs 4.2 and 5 of our Terms.