")
Back to Journals » Cancer Management and Research » Volume 11
Carbon ion and proton beam irradiation of a normal human TK6 lymphoblastoid cell line within a magnetic field of 1.0 tesla
Authors Yudhistiara B, Weber KJ, Huber PE, Ruehle A, Brons S, Haering P, Debus J , Hauswald H
Received 17 April 2019
Accepted for publication 11 August 2019
Published 12 September 2019 Volume 2019:11 Pages 8327—8335
DOI https://doi.org/10.2147/CMAR.S212310
Checked for plagiarism Yes
Review by Single anonymous peer review
Peer reviewer comments 3
Editor who approved publication: Professor Harikrishna Nakshatri
B Yudhistiara, 1, 2 KJ Weber, 1, 2 PE Huber, 1, 3 A Ruehle, 1, 3 S Brons, 2, 4 P Haering, 5 J Debus, 1, 2, 4, 6 H Hauswald 1, 2, 4, 6
1Department of Radiation Oncology, Heidelberg University Hospital, Heidelberg 69120, Germany; 2National Center for Radiation Research in Oncology (NCRO), Heidelberg Institute for Radiation Oncology (HIRO), Heidelberg, Germany; 3Clinical Cooperation Unit Molecular Radiation Oncology E055, German Cancer Research Center (DKFZ), Heidelberg, Germany; 4Heidelberg Ion-Beam Therapy Center (HIT), Heidelberg 69120, Germany; 5Department of Radiation Physics E040, German Cancer Research Center (DKFZ), Heidelberg, Germany; 6Clinical Cooperation Unit E050, German Cancer Research Center (DKFZ), Heidelberg, Germany
Correspondence: H Hauswald
Department of Radiation Oncology, Heidelberg University Hospital, INF 400, Heidelberg 69120, Germany
Tel +49 622 156 8201
Email [email protected] heidelberg.de
Background: Considering the increasing simultaneous application of magnetic resonance imaging (MRI) for more precise photon radiotherapy, it will be likely for particle radiotherapy to adopt MRI for future image guiding. It will then be imperative to evaluate the potential biological effects of a magnetic field (MF) on particle irradiation. This study explores such effects on the highly radiosensitive TK6 lymphoblastoid human cell line.
Methods: The following three parameters were measured after irradiation with either carbon ion or proton beams using spread out Bragg peaks and applying different doses within a perpendicular 1.0 T MF: (1) cell survival fraction (14 days postirradiation), (2) treatment-specific apoptosis, which was determined through the measurement of population in the sub-G1 phase, and (3) cell cycle progression by means of flow cytometry. These were compared to the same parameters measured without an MF.
Results: The clonogenic assay in both treatment groups showed almost identical survival curves with overlapping error bars. The calculated α values with and without an MF were 2.18 (σ=0.245) and 2.17 (σ=0.234) for carbon ions and 1.08 (σ=0.138) and 1.13 (σ=0.0679) for protons, respectively. Similarly, the treatment-specific apoptosis and cell cycle progression showed almost identical curves with overlapping error bars. A two-sample, unpooled t-test analysis was implemented for comparison of all mean values and showed p-values > 0.05.
Conclusion: No statistically significant difference in biological response of the TK6 cells was observed when they were irradiated using spreadout Bragg peaks within a perpendicular 1.0 T MF as compared to those, which received the same dose without the MF. This should serve as another supporting piece of evidence toward the implementation of MRI in particle radiotherapy, though further research is necessary.
Keywords: MRI guided radiotherapy, in-vitro experiment, normal human cells, TK6 human lymphoblastoid cells, carbon ions, proton beam therapy, particle beam therapy
Corrigendum for this paper has been published
Introduction
The use of magnetic resonance imaging (MRI) in modern radiation therapy is being established. Due to improved soft tissue contrast during image guidance, several centers around the world have adopted the useof MRI-guided photon radiation therapy. Prior publications were able to demonstrate the feasibility of such an endeavor.1–3 Yudhistiara et al have also observed that a magnetic field (MF) of 1.0 tesla (T) does not influence the biological response of radiosensitive TK6 normal human cells to photon beam radiotherapy.4 There is, however, rising importance of particle beam radiotherapy in cancer treatment.5 Its ability to deposit its full dose near the end of the particle range whilst sparing the surrounding tissues is well known and has been shown to improve clinical outcomes in various types of cancer. Considering the potential use of MRI guidance in particle beam radiotherapy in the future, it is important to assess the potential biological effects of an MF on proton beam radiotherapy, not least because there is limited data with regardto this inquiry. Inaniwa et al reported significantly reduced cell survival upon adding a longitudinal MF but interestingly not within a perpendicular MF.6,7 Furthermore, two other reports have shown a Bragg peak shift and dose perturbation upon employing an MF in proton beam radiotherapy;8,9 yet the biological effects of an MF have not been thoroughly evaluated and further research on possible interactions is warranted.
Methods
Cell culture
The TK6 cell line (human lymphoblastoid cell from spleen) with wild type p53 function was used in our experiments due to its known high radiosensitivity. The cells were originally provided by the Tumorbank of the German Cancer Research Center (DKFZ) in Heidelberg, Germany. DNA cell line authentication was performed by Eurofins Medigenomix Forensik GmbH in Ebersberg, Germany. The cells were cultured in suspension at 37°C in a humidified atmosphere with 6% CO2. RPMI 1640 was used as the cell medium that also contained 10% heat-inactivated horse serum (Biochrom GmbH, Berlin, Germany) and 1% penicillin. The cell density was maintained at 0.1 to 1.0×10⁶/mL.
Irradiation and magnetic field
Two types of ion beams are used in this study, namely carbon ions and protons. The beams were generated using a synchrotron at the Heidelberg Ion-Beam Therapy Center (HIT) in Heidelberg, Germany. Table 1 summarizes some important parameters of the facility. For the purposes of our experiments, the average energy used was 1.85 GeV and 80.9 MeV and the average linear energy transfer (LET) used was 66 keV/µm (50–150 keV/µm) and 3.7 keV/µm (2.5–10 keV/µm) for carbon ions and protons, respectively.
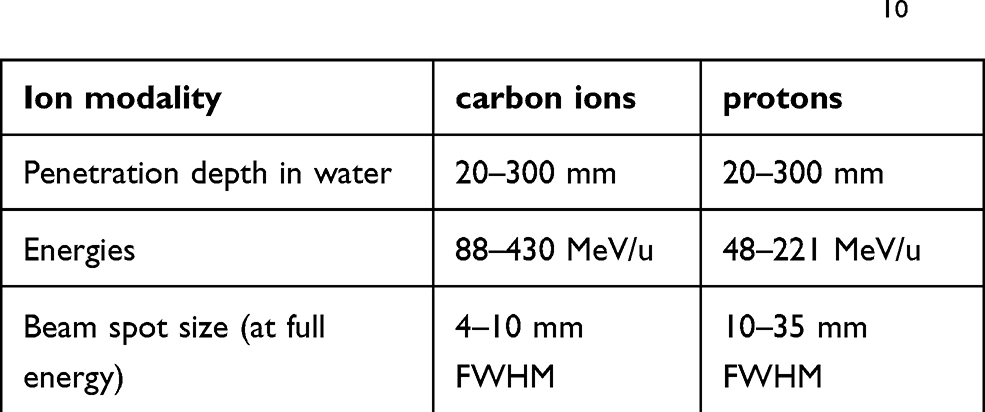 |
Table 1 A summary of the most important parameters of the synchrotron used at HIT. Data from Brünning and Myers.10 |
The experimental setup is similar to our previous work4 two identical coils can generate an MF of up to 1.5 T upon current flow transverse (perpendicular) to the radiation beam axis (see Figure 1). To simulate the MF used in a clinical setting, we decided to maintain an MF strength of 1.0 T where applicable. A custom-made vessel made of VeroClear (refer to Figure 2), which contained the test tube, was placed between the two coils. The test tube of 17 mm in diameter and 120 mm in length was manufactured by Becton Dickinson and Company (BD, Franklin Lakes, NJ, USA) under the product name “Falcon™ 15 mL Conical Centrifuge Tube”. The cells within the test tube were ensured a constant temperature using a water bath, which was constantly refilled with water at room temperature, thereby preventing overheating. The facility’s laser guide helped position the cells in the isocenter of the particle beam. The irradiation fields were generated using the raster scan technique with the following dimensions: 10 cm height, 3.3 cm width, and 3.3 cm depth. The target volume was located at 50 mm water equivalent thickness. Lastly, the dose was applied homogeneously using a spread out Bragg peak (SOBP).
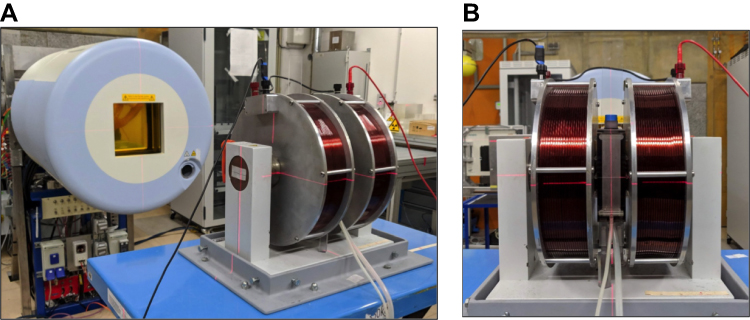 |
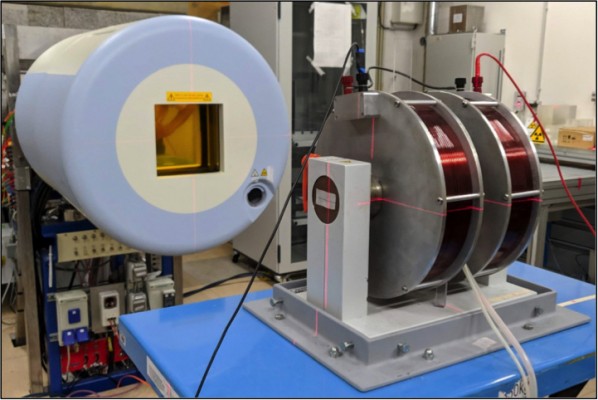
Figure 1 An overview of our experimental setup: (A) shows the positioning of the magnetic coils relative to the beam and (B) shows a frontal view of the setup, facing the particle beam nozzle. Note that the direction of the particle beam is perpendicular to the magnetic field. |
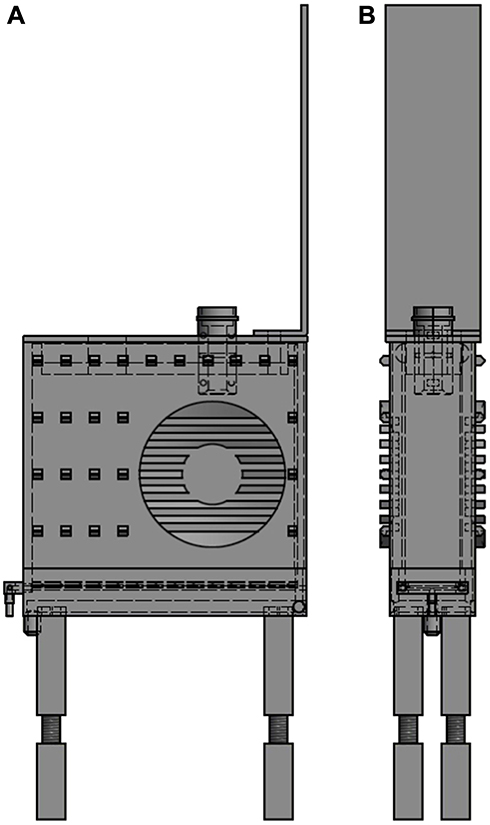 |
Figure 2 The blueprint of our custom-made container, which houses the test tube containing the cells during irradiation. (A) shows the lateral view while (B) shows the frontal view as also shown in Figure 1 (B). Permission to use this figure was granted from © Armin Runz, Research Group Medical Engineering E0405, German Cancer Research Center, Heidelberg, Germany. |
Clonogenic assay
Each test tube was filled with 1 mL of medium containing 3.0×10⁵ cells. Before and after irradiation, the test tubes were chilled on ice to minimize any metabolic process. The cells were then plated in a 96-well plate after irradiation. Depending on the type of ion beam and the dose used, each well had a different number of cells. Table 2 summarizes the target number of cells per well. We used a dose of 0–4 Gy for the proton beam and 0–2 Gy for the carbon ion beam to account for its higher relative biological effectiveness (RBE).
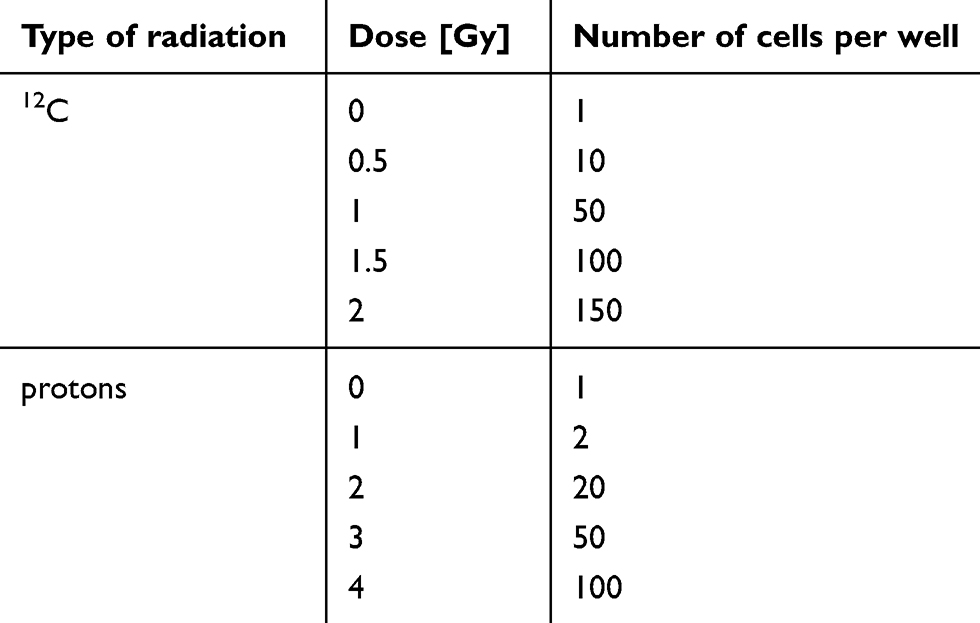 |
Table 2 Number of cells placed in each of the 96 wells before irradiation based on the type of particle used |
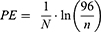
After 14 days, the number of wells, which had grown visible colonies (also indicated by the change of medium color from red to yellow) was counted. Afterward, the plating efficiency could be calculated by applying the following formula.11
N= number of cells plated per well, n= number of wells without cell growth. Following previous work,12 pilot tests were carried out to determine the value of N for each dose, with the goal of n lying between 40 and 50 (Table 2).
The survival fraction at a certain dose can then be calculated as following.11
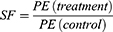
Where PE(control) is the plating efficiency obtained at 0 Gy (with and without an MF) and PE(treatment) is the one obtained after the cells are irradiated.
The mean value for SF at each dose and its respective standard deviation was calculated from three independent experiments. The linear quadratic model (LQ-model) was afterward used to perform a regression analysis, which defines the relationship between SF and dose (D).11

α and β are coefficients which can be determined using a regression analysis. A linear fit was chosen for carbon ions (with the importance lying in the value of α as an indicator for radiosensitivity as shown in a previous publication13). We also performed a two-sample, unpooled t-test (Shapiro–Wilk test for normality p>0.05) to compare the two mean values between the control group (without an MF) and treatment group (with an MF) for each ion beam type. Statistical significance was defined as p-value <0.05.
Flow cytometry
Flow cytometry was used to determine the treatment-specific apoptosis (TSA) rate as well as the cell cycle progression. Based on the value of α obtained from the clonogenic assay, 2 Gy and 4 Gy were set as appropriate doses for carbon ions and protons respectively. Irradiated samples were cultured for 0, 4, 8, 12, 24, and 48 hours. The cells were then fixated using 1 mL of 80% ethanol and stored at 10°C until they were ready for analysis. The samples were then rinsed with 2 mL of PBSsolution twice. 890 µL of PBS, 100 µL of RNAse and 10 µL of propidium iodide were added for staining. The percentage of cells in each cell cycle phase was then measured using flow cytometry. To calculate the TSA, the following formula was used.11

where fx is the sub-G1-phase fraction after irradiation and f0 is the respective value of the unirradiated control sample (meaning not irradiated) within the same experiment.
Three independent experiments were performed and the mean TSA was calculated along with its standard deviation. A two-sample, unpooled t-test (Shapiro–Wilk test for normality p>0.05) was also performed to compare the mean TSA between the cells irradiated with an MF and those irradiated without an MF. Statistical significance was defined as p<0.05.
Results
Clonogenic assay
Table 3 shows the mean SF calculated from three independent experiments using the above mentioned formulae after the cells were irradiated with different doses of carbon ions and protons, in the presence or absence of an MF. Note the corresponding t-test and p-values.
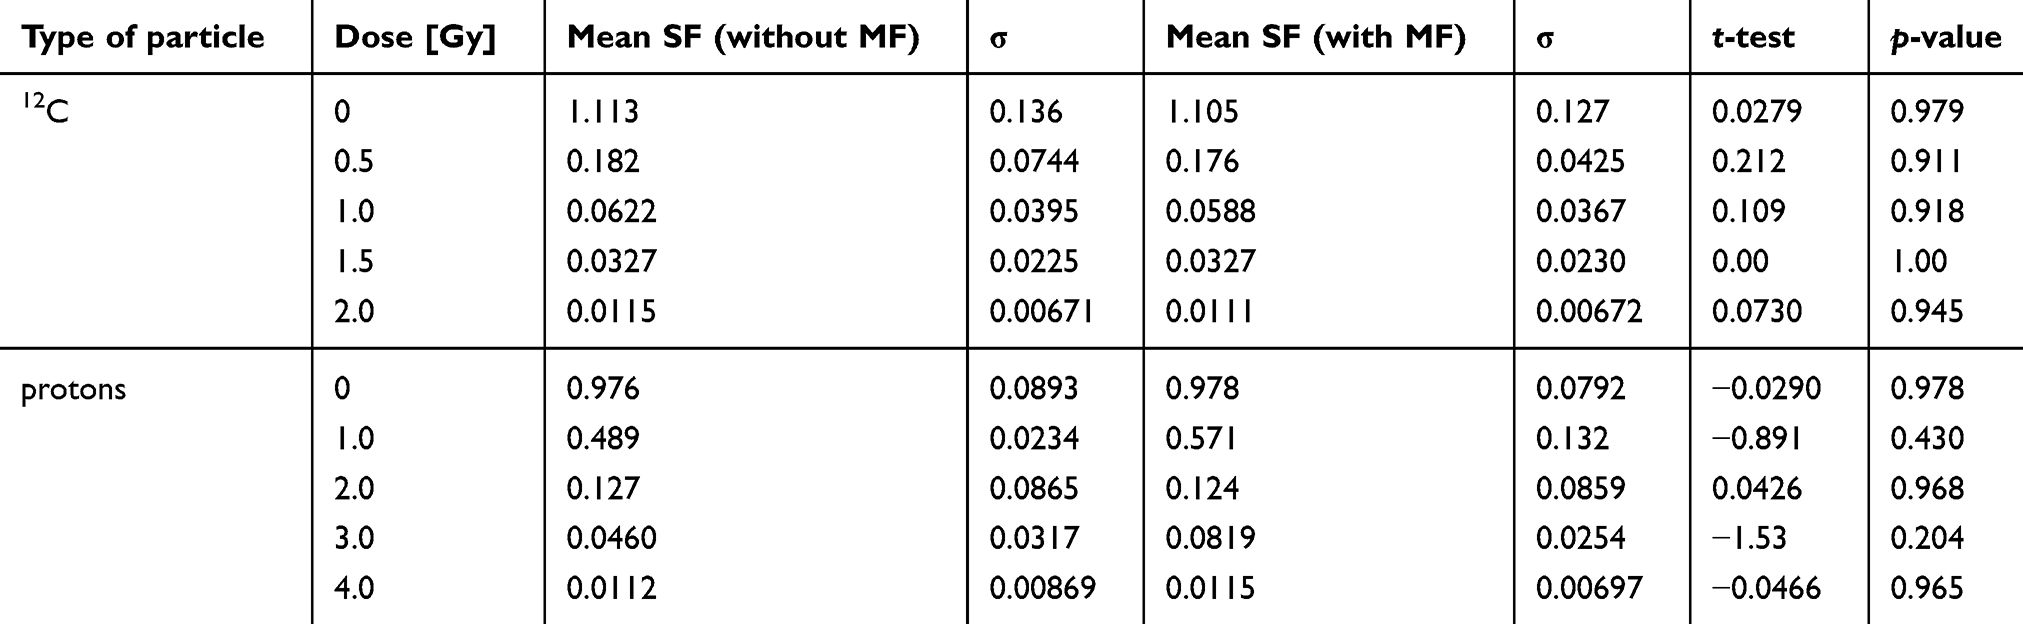 |
Table 3 Mean survival fraction derived from three independent experiments with and without a magnetic field with the respective t-test and p-values. σ denotes the standard deviation |
The survival curves for each type of particle beam, which were generated using a regression analysis based on the LQ model, are shown in Figure 3. Note the overlapping error bars at each measurement point as well as the identical trend of the curves, independent of the presence of an MF. The regression analysis yielded an α value with and without an MF of 2.18 (σ=0.245) and 2.17 (σ=0.234) for carbon ions and 1.08 (σ=0.138) and 1.13 (σ=0.0679) for protons, respectively.
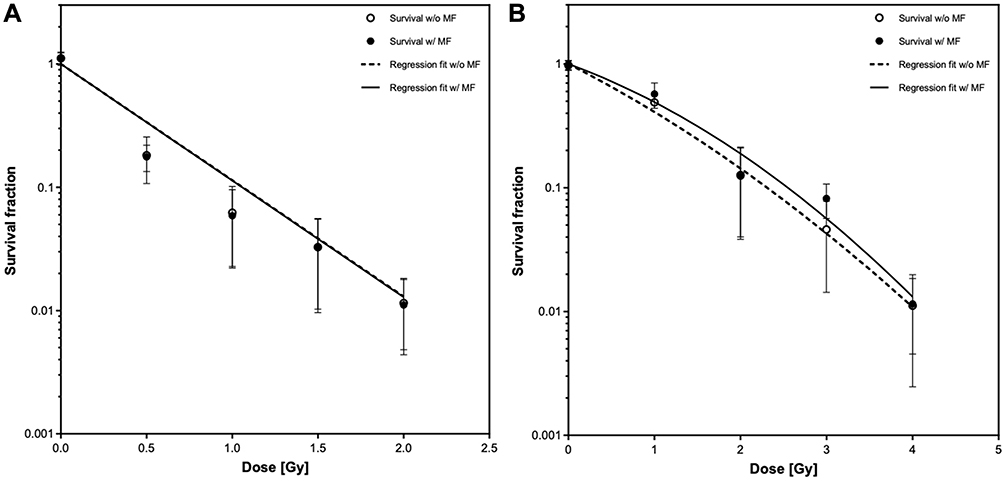 |
Figure 3 Mean survival fraction with standard deviation plotted against dose in Gy after irradiation with carbon ions (A) or protons (B) both in the presence and absence of a magnetic field. The respective survival curves were drawn following a regression analysis. |
Treatment-specific apoptosis
Table 4 shows the calculated mean TSA for each time point with its corresponding t-test and p-values.
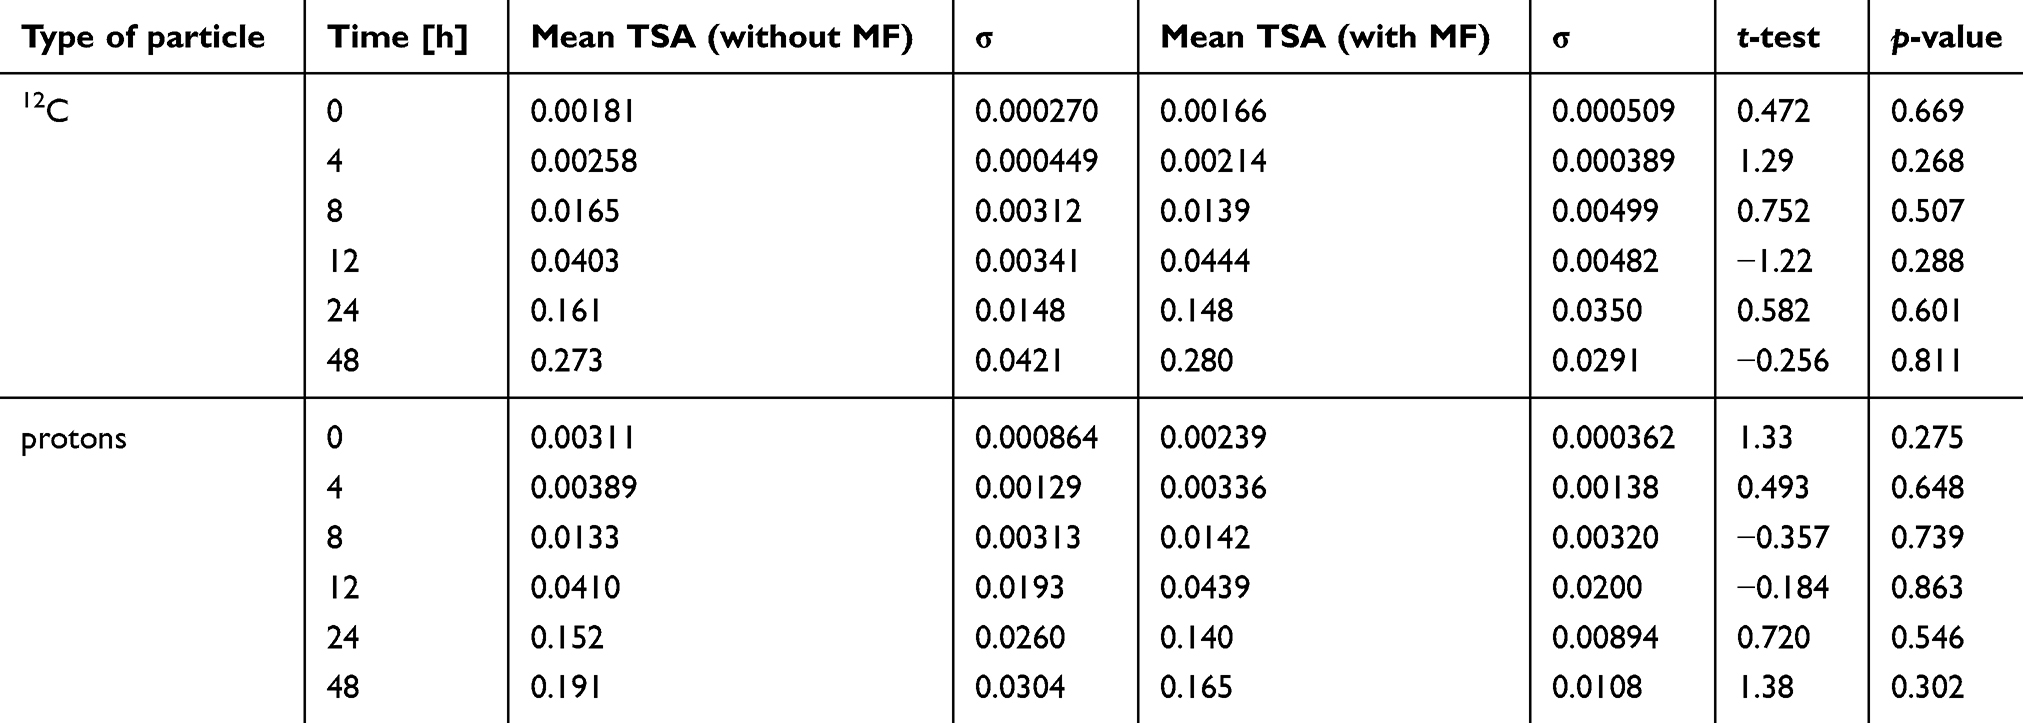 |
Table 4 Mean treatment-specific apoptosis derived from three independent experiments with and without a magnetic field with the respective t-test and p-values. σ denotes the standard deviation |
Figure 4 shows the mean TSA after carbon ion or proton beam irradiation with and without an MF, plotted against the incubation time post-irradiation. The mean TSA increases as the incubation period increases. Cells with accumulated irreparable DNA damage will ultimately undergo apoptosis which in this case is represented by the increase in the percentage of cells in sub-G1 phase (refer to Figure 6 for further information) which in turn is reflected in a higher mean TSA.
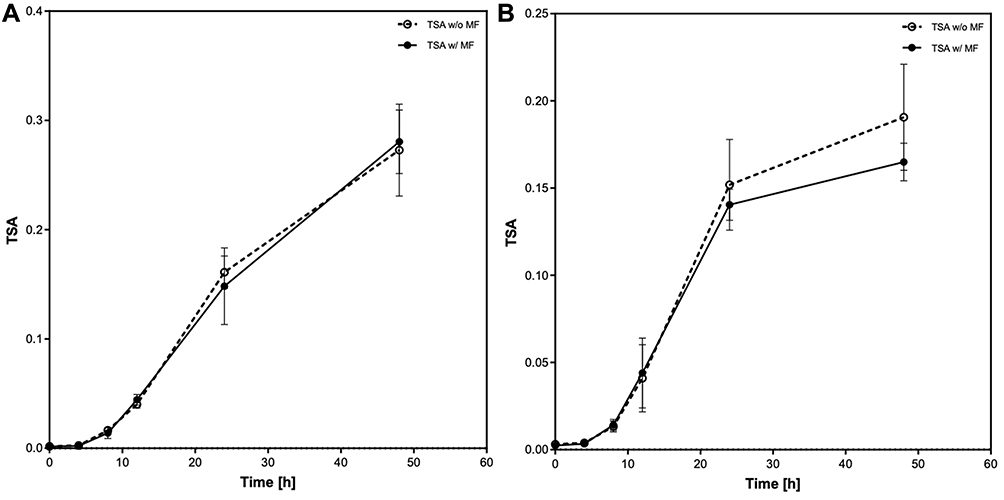 |
Figure 4 Mean treatment-specific apoptosis after the cells were treated with carbon ions (A) or protons (B), with and without a magnetic field. |
Cell cycle analysis
Figure 5 shows the mean measured percentage number of cells in each cell cycle phase plotted against the incubation time after carbon ion or proton beam irradiation with or without an MF. The unirradiated control group is also shown. There seems to be a notable G2 arrest after the irradiation for both types of ions, as seen in the increase of the percentage of cells in the G2 phase which peaked at 24 hours postirradiation (Figure 5C). However, at the 48-hour mark the cell population in G2 decreases (Figure 5C) while the one in G1 increases (Figure 5A). An increase of about 5% in the cells in the S phase (Figure 5B) is also observed, though it is minor compared to those in G1 and G2/M phases. As expected, the control group shows minor changes in the cell population, which shows regular mitosis of the cells in the absence of DNA damage through irradiation. As an example of the histogram plots obtained in our cell cycle analysis, Figure 6 shows representatively a series of histogram plots at 48 hours postirradiation.
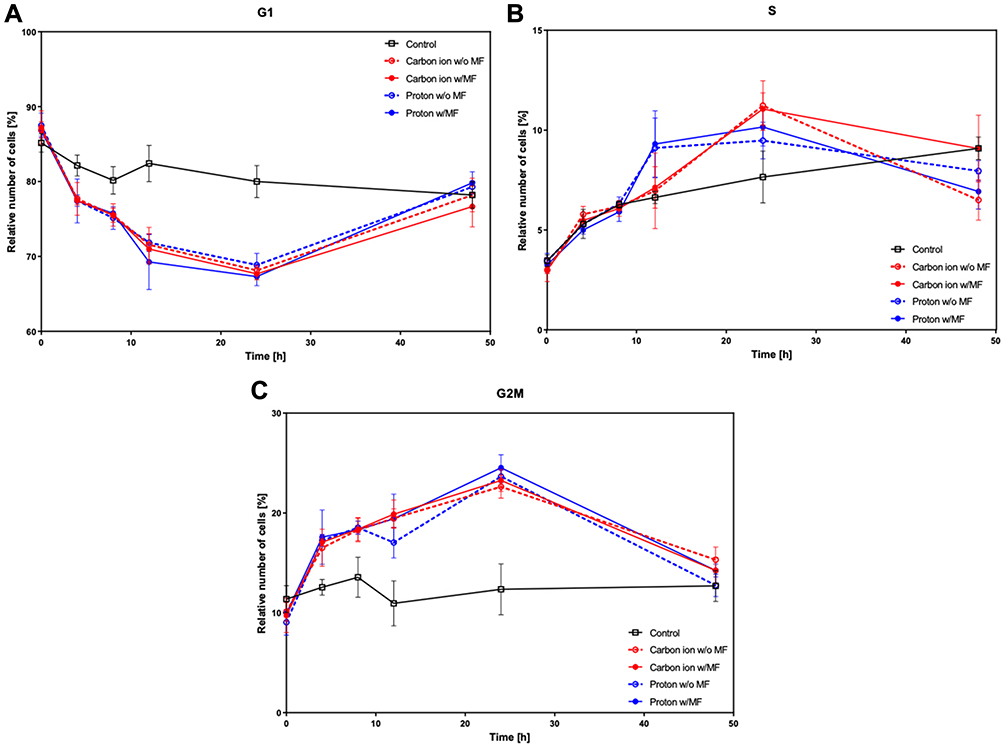 |
Figure 5 Cell cycle progression after carbon ion or proton beam irradiation, with and without a magnetic field. The mean percentage of cells in each phase of the cell cycle is displayed: (A) G1-phase (B) S-phase (C) G2/M-phase; along with their respective standard deviations. |
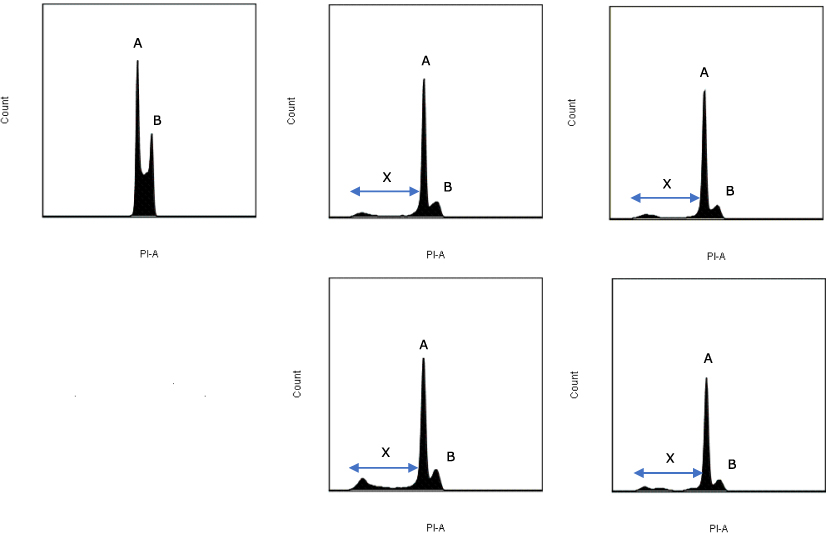 |
Figure 6 The histogram plots obtained from our flow cytometry analysis at 48 hours after irradiation. The x-axis (PI-A) indicates the amount of propidium iodide detected which reflects the DNA amount in each cell. Top row from left to right: control group, carbon ions without a magnetic field, carbon ions with a magnetic field. Bottom row from left to right: protons without a magnetic field, protons with a magnetic field. Peak A is the G1 peak, whereas the peak B is the G2/M peak. The area between peaks A and B represents the cells in the S phase. Range X signifies the cells in sub-G1 phase. |
Discussion
Advances in the clinical implementation of MRI-guided photon radiotherapy are ongoing and efforts are being made in developing MRI-guided particle beam centers. However, data on the biological effects of carbon ion or proton beam radiotherapy within an MF is scarce. In this developing new field of particle beam therapy, it is essential to analyze potential interactions between particle beams and an MF on normal tissue. Therefore, the effects of carbon ion and proton beam radiotherapy on TK6 human lymphoblastoid cells, which are radiosensitive and representing normal tissue, were analyzed.
Three parameters were used in this project to study the effect of a 1.0 T MF on the irradiation of TK6 human lymphoblastoid cells: (1) the survival fraction in a clonogenic assay, (2) the TSA rate, and (3) the cell cycle progression. All three parameters measured in the presence of an MF do not seem to suggest a statistically significant difference to those measured without an MF.
The use of survival curves is ubiquitous in the field of radiation biology. Our experiment yielded identical survival curves in both experimental groups (carbon ions and protons) with overlapping error bars at every measurement point. This suggests that no statistically significant difference exists between the groups treated with or without an MF. To further corroborate these findings statistically, a two-sample, unpooled t-test was performed for every measurement point. The p-value for every point is larger than 0.05 at 95% confidence interval, which suggests that there is no statistically significant difference in the mean SF between the groups treated with or without an MF.
Nicoletti et al have demonstrated the reliability of flow cytometry in measuring TSA.14 Cells, that were irradiated either with carbon ions or protons within an MF appeared to show the same apoptosis rate, which further confirms our hypothesis. The TSA curves plotted using our findings show an identical trend with overlapping error bars at every measurement point. Furthermore, the p-value derived from the two-sample, unpooled t-test is larger than 0.05 at 95% confidence interval for every time point. Conclusively, there is no statistically significant difference in TSA between both groups.
The cell cycle analysis shows an identical trend for cells irradiated with and without an MF in all phases with overlapping error bars at every measurement point. From this observation it can be concluded that the presence of a 1.0 T MF does not affect TK6 cell cycle progression up to 48 hours after irradiation with either carbon ion or proton beams. The G2 arrest observed in both types of particle beam irradiations is expected.15 It is also interesting to note, however, the marked increase in the number of cells in G1 along with the decrease in G2. This implies that some of the cells re-entered the cell cycle. This in turn suggests that some of the DNA damage might be reparable, a phenomenon also observed in other cell lines.15
Currently, data on the biological effects of an MF of significant clinical strengths 1.0–3.0 T are not readily available. A recently published study showed an enhanced biological effectiveness (measured in decreasing increments of D10, the dose needed to reach a SF of 10%) when a longitudinal MF of up to 0.6 T was utilized.6 The same authors reported a significant decrease in D10 in a longitudinal MF of 0.1 T vs 0 T, while no additional decrease in D10 was seen in a stronger MF.6 Our experimental setup differs in that we used an MF that is transverse (perpendicular) to the radiation beam axis. It is important to note that using a transverse MF will exert a Lorentz force, which in turn deflects the particles to a certain degree.
Interestingly however, Inaniwa et al recently published another article, which seemed to support our findings7 This time they employed a perpendicular (transverse) MF in their studies and observed no statistically significant difference in D10 after the cells were irradiated within an MF. Taking the difference in biological effects observed in our study as well as the work of Inaniwa et al in comparison to the publications by Suzuki et al or the earlier work of Inaniwa et al into consideration, it can be concluded that the extent to which the direction of the MF significantly affects the biological response of normal human cells remains not fully explained and further research is warranted.
Apoint of contention is the proven dose perturbation effects of an MF on carbon ion and proton beams. Dosimetric studies have shown that there is dose distribution disruption at the air-tissue interface when an MF of 1.5 T is applied in photon beams, although its significance in carbon ion and proton beams is yet to be shown.8 On the contrary, another dosimetric study observed minimal changes in photon energy deposition even for an extremely strong MF of up to 70 T.16 Other studies demonstrated that a Bragg-peak shift is observable in both types of particle beams especially at higher energies, with a larger shift being observed in proton than carbon ion beams.9,17 While the authors attributed this to the well-known range straggling in particle beams, Motoabedd et al argued that modifications in treatment planning as well as the utilization of the gantry angle should be able to compensate for the dose perturbation effects of an MF.18
In summary, this study has shown that there is no statistically significant biological effect of a perpendicular 1.0 T MF on the irradiation of TK6 human lymphoblastoid cell line using carbon ion or proton beams with SOBP. In light of the aforementioned dose perturbation effects, more research on the applicability of an MF in carbon ion or proton beam radiation therapy is certainly warranted.
Abbreviations
DKFZ, German Cancer Research Center; FWHM, full width at half maximum; HIT, Heidelberg Ion-Beam Therapy Center; LET, linear energy transfer; LQ, linear quadratic; MF, magnetic field; MRI, magnetic resonance imaging; RBE, relative biological effectiveness; T, tesla; TSA, treatment-specific apoptosis; SF, survival fraction; SOBP, spread out Bragg peak.
Data sharing statement
The datasets used and/or analyzed during the current study are available from the corresponding author on reasonable request.
Acknowledgment
This project was not financed by third parties.
Author contributions
HH, KJW, PH and JD developed and planned the study. BY, PH, SB, AR, PH and KJW performed the irradiation and were responsible for management of the cells. BY, PH, SB, KJW, PEH and HH participated in writing the manuscript and revising it. HH, KJW, JD, BY and PEH performed data analysis. KJW, PEH and HH reviewed all data and statistical analyses. All authors contributed to data analysis, drafting or revising the article, gave final approval of the version to be published, and agree to be accountable for all aspects of the work.
Disclosure
Prof. Dr. J Debus reports grants from CRI The Clinical Research Institute GmbH, View Ray Inc., Accuray International, Accuray Incorporated, RaySearch Laboratories AB, Vision RT limited, Merck Serono GmbH, Astellas Pharma GmbH, Astra Zeneca GmbH, Siemens Healthcare GmbH, Solution Akademie GmbH, Eromed PLC Surrey Research Park, Quintiles GmbH, Pharmaceutical Research Associates Gmbh, Boehringer Ingelheim Pharma GmbH CoKG, PTW-Friburg Dr. Pychlau GmbH and from Nanobiotix A.A., outside the submitted work. The authors report no other conflicts of interest in this work.
References
1. Wen N, Kim J, Doemer A, et al. Evaluation of a magnetic resonance guided linear accelerator for stereotactic radiosurgery treatment. Radiother Oncol. 2018;127(3):460–466. doi:10.1016/j.radonc.2018.04.034
2. Das IJ, McGee KP, Tyagi N, Wang H. Role and future of MRI in radiation oncology. Br J Radiol. 2019;92(1094):20180505. doi:10.1259/bjr.20180505
3. Bainbridge HE, Menten MJ, Fast MF, Nill S, Oelfke U, McDonald F. Treating locally advanced lung cancer with a 1.5T MR-Linac – Effects of the magnetic field and irradiation geometry on conventionally fractionated and isotoxic dose-escalated radiotherapy. Radiother Oncol. 2017;125(2):280–285. doi:10.1016/j.radonc.2017.09.009
4. Yudhistiara B, Zwicker F, Weber KJ, et al. The influence of a magnetic field on photon beam radiotherapy in a normal human TK6 lymphoblastoid cell line. Radiat Oncol. 2019;14(1):11. doi:10.1186/s13014-019-1212-5
5. Jermann M. Particle therapy statistics in 2013. Int J Part Ther. 2014;1(1):40–43. doi:10.14338/IJPT.14-editorial-2.1
6. Inaniwa T, Suzuki M, Sato S. et al. Enhancement of biological effectiveness of carbon-ion beams by applying a longitudinal magnetic field. Int J Radiat Biol;2019. 1–10. doi:10.1080/09553002.2019.1625461
7. Inaniwa T, Suzuki M, Sato S. et al. Influence of a perpendicular magnetic field on biological effectiveness of carbon-ion beams. Int J Radiat Biol;2019. 1–5. doi:10.1080/09553002.2019.1625461
8. Shao W, Tang X, Bai Y, et al. Investigation of the dose perturbation effect for therapeutic beams with the presence of a 1.5 T transverse magnetic field in magnetic resonance imaging-guided radiotherapy. J Cancer Res Ther. 2018;14(1):184–195. doi:10.4103/jcrt.JCRT_1349_16
9. Schellhammer SM, Gantz S, Lühr A, Oborn BM, Bussmann M, Hoffmann AL. Technical note: experimental verification of magnetic field-induced beam deflection and Bragg peak displacement for MR-integrated proton therapy. Med Phys. 2018;45(7):3429–3434. doi:10.1002/mp.12961
10. Brünning O, Myers S. Challenges and Goals for Accelerators in the XXI Century. Singapore: World Scientific Publishing Co. Pte. Ltd; 2016.
11. Schäfer J. Unterdrückung der Apoptose und klonogenes Überleben humaner Lymphoblasten mit unterschiedlichem p53-Status nach Bestrahlung [medical dissertation]. Heidelberg: Heidelberg University; 2003.
12. Schäfer J, Bachtler J, Engling A, B Little J, Weber K, Wenz F. Suppression of apoptosis and clonogenic survival in irradiated human lymphoblasts with different TP53 status. Radiat Res. 2003;158:699–706. doi:10.1667/0033-7587(2002)158[0699:SOAACS]2.0.CO;2
13. Scholz M, Kellerer AM, Kraft-Weyrather W, Kraft G. Computation of cell survival in heavy ion beams for therapy. Radiat Environ Biophys. 1997;36(1):59–66.
14. Nicoletti I, Migliorati G, Pagliacci MC, Grignani F, Riccardi C. A rapid and simple method for measuring thymocyte apoptosis by propidium iodide staining and flow cytometry. J Immunol Methods. 1991;139(2):271–279. doi:10.1016/0022-1759(91)90198-o
15. Joiner M, van der Kogel A. Basic Clinical Radiobiology. Great Britain: Hodder Arnold; 2009.
16. Kirkby C, Stanescu T, Fallone BG. Magnetic field effects on the energy deposition spectra of MV photon radiation. Phys Med Biol. 2008;54(2):243–257. doi:10.1088/0031-9155/54/2/005
17. Fuchs H, Moser P, Gröschl M, Georg D. Magnetic field effects on particle beams and their implications for dose calculation in MR-guided particle therapy. Med Phys. 2017;44(3):1149–1156. doi:10.1002/mp.12105
18. Moteabbed M, Schuemann J, Paganetti H. Dosimetric feasibility of real-time MRI-guided proton therapy. Med Phys. 2014;41(11):111713. doi:10.1118/1.4897570
 © 2019 The Author(s). This work is published and licensed by Dove Medical Press Limited. The full terms of this license are available at https://www.dovepress.com/terms.php and incorporate the Creative Commons Attribution - Non Commercial (unported, v3.0) License.
By accessing the work you hereby accept the Terms. Non-commercial uses of the work are permitted without any further permission from Dove Medical Press Limited, provided the work is properly attributed. For permission for commercial use of this work, please see paragraphs 4.2 and 5 of our Terms.
© 2019 The Author(s). This work is published and licensed by Dove Medical Press Limited. The full terms of this license are available at https://www.dovepress.com/terms.php and incorporate the Creative Commons Attribution - Non Commercial (unported, v3.0) License.
By accessing the work you hereby accept the Terms. Non-commercial uses of the work are permitted without any further permission from Dove Medical Press Limited, provided the work is properly attributed. For permission for commercial use of this work, please see paragraphs 4.2 and 5 of our Terms.