")
Back to Journals » International Journal of Nanomedicine » Volume 13
Cantharidin-encapsulated thermal-sensitive liposomes coated with gold nanoparticles for enhanced photothermal therapy on A431 cells
Authors Wang SJ, Xin J, Zhang LW, Zhou YC, Yao CP , Wang B, Wang J, Zhang ZX
Received 7 November 2017
Accepted for publication 16 February 2018
Published 10 April 2018 Volume 2018:13 Pages 2143—2160
DOI https://doi.org/10.2147/IJN.S156240
Checked for plagiarism Yes
Review by Single anonymous peer review
Peer reviewer comments 3
Editor who approved publication: Professor Lei Yang
Sijia Wang, Jing Xin, Luwei Zhang, Yicheng Zhou, Cuiping Yao, Bing Wang, Jing Wang, Zhenxi Zhang
Key Laboratory of Biomedical Information Engineering of Ministry of Education, School of Life Science and Technology, Institute of Biomedical Analytical Technology and Instrumentation, Xi’an Jiaotong University, Xi’an, Shaanxi, People’s Republic of China
Purpose: Plasmonic nanostructure-mediated photothermal therapy (PTT) is a promising alternative therapy for the treatment of skin cancer and other diseases. However, the insufficient efficiency of PTT at irradiation levels tolerable to tissues and the limited biodegradability of nanomaterials are still crucial challenges. In this study, a novel nanosystem for PTT based on liposome–nanoparticle assemblies (LNAs) was established.
Materials and methods: Thermal-sensitive liposomes (TSLs) encapsulating cantharidin (CTD) were coated with gold nanoparticles (GNPs) and used in near-infrared (NIR) illumination-triggered PTT and thermally induced disruption on A431 cells.
Results: The coated GNPs disintegrated into small particles of 5–6 nm after disruption of TSLs, allowing their clearance by the liver and kidneys. CTD encapsulated in the TSLs was released into cytoplasm after PTT. The released CTD increased the apoptosis of PTT-treated tumor cells by blocking the heat shock response (HSR) and inhibiting the expression of HSP70 and BAG3 inhibiting the expression of HSP70 and BAG3 with the synergistic enhancement of CTD, the new nanosystem CTD-encapsulated TSLs coated with GNPs (CTD-TSL@GNPs) had an efficient PTT effect using clinically acceptable irradiation power (200 mW/cm2) on A431 cells.
Conclusion: The developed CTD-TSL@GNPs may be a promising PTT agent for clinical skin cancer therapy.
Keywords: gold nanoparticles, liposome, cantharidin, photothermal therapy, heat shock response
Introduction
Plasmonic nanostructure-mediated photothermal therapy (PTT) activated by near-infrared (NIR) illumination is a promising alternative therapy for cancer treatment. It works through a physical mechanism transferring light energy into heat and hyperthermically inactivating the cancer cells, in which nanostructures accumulate through enhanced permeability and retention (EPR) effects.1,2 In addition, the high spatiotemporal precision of NIR light limits the toxicity and side effects of PTT, which could allow its use in microtumors or the regions where surgery is difficult.3 PTT can also be combined with other therapies by loading drugs on the nanostructures, and these plasmonic nanostructures can serve as contrast agents for optical or molecular imaging techniques such as computed tomography, magnetic resonance imaging, and positron emission tomography.4 Among the nanostructures for PTT, gold nanoparticles (GNPs) have received considerable attention because of their high plasma resonance absorption and photothermal conversion efficiency.5,6 Many studies have reported outstanding inactivation efficiency of cancer cells and engrafted tumors with gold nanorods7 or nanoshells,8 and recently, gold nanoshell-mediated PTT was evaluated in clinical trials for the treatment of brain and metastatic lung tumors.6
However, the potential and application of gold nanostructure-mediated PTT remains hampered by a few challenges. One is the unclear long-term degradation mechanism of the gold nanostructures in the body and their potential in vivo toxicity. Ideally, nanostructures should be cleared completely from the body within a certain period. However, most gold nanostructures are >8 nm; hence, their clearance by liver and kidneys is difficult.9,10 On the other hand, nanostructures <8 nm can be only minimally surface modified to enhance circulation time or tumor targeting and too easy to be cleared by the mononuclear phagocyte system (MPS; formerly referred to as the reticuloendothelial system) before accumulating in tumor tissues.11 This paradox is a conundrum in the design of nanostructures for PTT. Organic or soft nanomaterials with excellent biodegradability, such as liposomes, micelles, and polymers, have been applied for the delivery of photothermal agents for many years, to improve their circulation stability and reduce their potential toxicity.12 Recently, it was reported that some NIR-absorbing organic nanomaterials with high photothermal conversion efficiency, including conjugated or conductive polymers such as polyaniline, polypyrrole, and poly (3, 4-ethylenedioxythiophene):poly (4-styrenesulfonate) could serve as photothermal agents themselves.13 Among potential nanomaterials for PTT, hybrid organic–inorganic nanocomposites (OINCs) have attracted particular attention and may be the key to solving the paradox, as they combine the biodegradability and long circulation time of organic nanomaterials with the high photostability and photothermal conversion efficiency of inorganic nanostructures.14 Liposome–nanoparticle assemblies (LNAs) are commonly used OINCs and consist of liposomes with encapsulated nanoparticles in the aqueous core, embedded in the lipid bilayer, or decorated on the surface.15 Liposomes are structurally suitable to evaluate the biocompatibility of inorganic nanoparticles, since they have been clinically approved as a drug delivery system over a decade.16
Another challenge is insufficient heating for complete killing of tumor cells and tissues, and thus often a high-power illumination was used in PTT studies to confirm the effect of treatment. Irradiation power densities of 1–10 W/cm2 are typically used in in vitro PTT studies but are not applicable for tumor clinical treatments as they exceed tissue tolerance.17,18 The American National Standards Institute (ANSI) has set standard tolerance threshold values for clinically safe use on skin. The laser power threshold is 330–350 mW/cm2 with an exposure time of 10–1,000 s.19 Hence, it is important to introduce novel strategies to optimize PTT efficiency with low power irradiation. The heat shock response (HSR) is a universal mechanism that protects eukaryotic cells from hyperthermia.20 The HSR has been proven to be much more active in tumor cells than in normal cells and is the main resistance against thermal therapy because of its protein protective and anti-apoptotic efficiency.20,21 Recent molecular biology studies indicate that the HSR can suppress apoptosis and protein inactivation in cancer cells during or after PTT, which limits its therapeutic efficiency,18,22,23 especially with low power irradiation.18 Consequently, blocking or attenuating the HSR effects of cancer cells could improve the therapeutic efficiency of PTT. HSP70 and BAG3 play important roles in the HSR.24,25 Recently, RNA interference was applied to suppress the expression of HSPs such as HSP70 and BAG3, and the therapeutic efficiency of gold nanorod-mediated PTT was improved by attaching small interfering RNA (siRNA) to the nanorod surface.26 Downregulation of HSP70 and BAG3 decreased the concentration of the HSP70/BAG3 chaperone complex, reducing the complex formation of anti-apoptotic-associated proteins such as BCL-2, BCL-xL, and MCL-1 with chaperones, enhancing apoptotic cell death27 and synergistically improving the efficiency of PTT. Cantharidin (CTD, Figure S1A), a terpenoid isolated from blister beetles that is used in traditional Chinese medicine,28 can effectively inhibit various tumor cell lines including liver,29 lung,30 pancreas,31 and colon.32 However, its cytotoxicity limits its further clinical application, and usually toxicity-attenuated derivatives such as norcantharidin or liposome-encapsulated CTD are used.33 CTD can inhibit the expression of HSP70 and BAG3 by blocking heat shock transcription factor 1 binding to the promoters of these genes.34 Thus, it was suspected that CTD could improve the effect of PTT through its antagonism of the HSR.
In this study, a novel nanostructure was designed to solve these problems and develop a potentially clinically acceptable PTT agent combining good biodegradability with high PTT efficiency. CTD-encapsulated TSLs coated with GNPs (CTD-TSL@GNPs) were based on LNAs and consist of a CTD-encapsulated TSL (CTD-TSL) core with small GNPs decorating on the surface. The structure of the CTD-TSL@GNPs is shown in Figure 1. Polyethylene glycol (PEG)-modified TSLs encapsulating CTD and Fluorescein isothiocyanate (FITC) were prepared as a template, and small GNPs were directly synthesized on the outer surface of TSLs by using ascorbic acid (AA) as a reducing agent for chloroauric acid (HAuCl4). Because of these surface GNPs, CTD-TSL@GNPs displayed NIR plasma absorption and high photothermal conversion capability. After being taken up by tumor cells and upon irradiation with a NIR laser, the temperature of surface GNPs rises, the phase of the lipid scaffold transforms, and the CTD-TSL@GNPs structure is disrupted, allowing CTD encapsulated in the lipid layer and FITC in the hydrophilic core to be released into the cytoplasm (Figure 1). Released FITC was captured by fluorescence microscopy and used to monitor the release process, and CTD was found to improve the PTT efficiency by suppressing the expression of HSP70 and BAG3 and attenuating their anti-apoptotic effects in tumor cells. With the synergistic enhancement of CTD, the CTD-TSL@GNPs achieved high PTT elimination efficiency on A431 cells with a relatively low power laser.
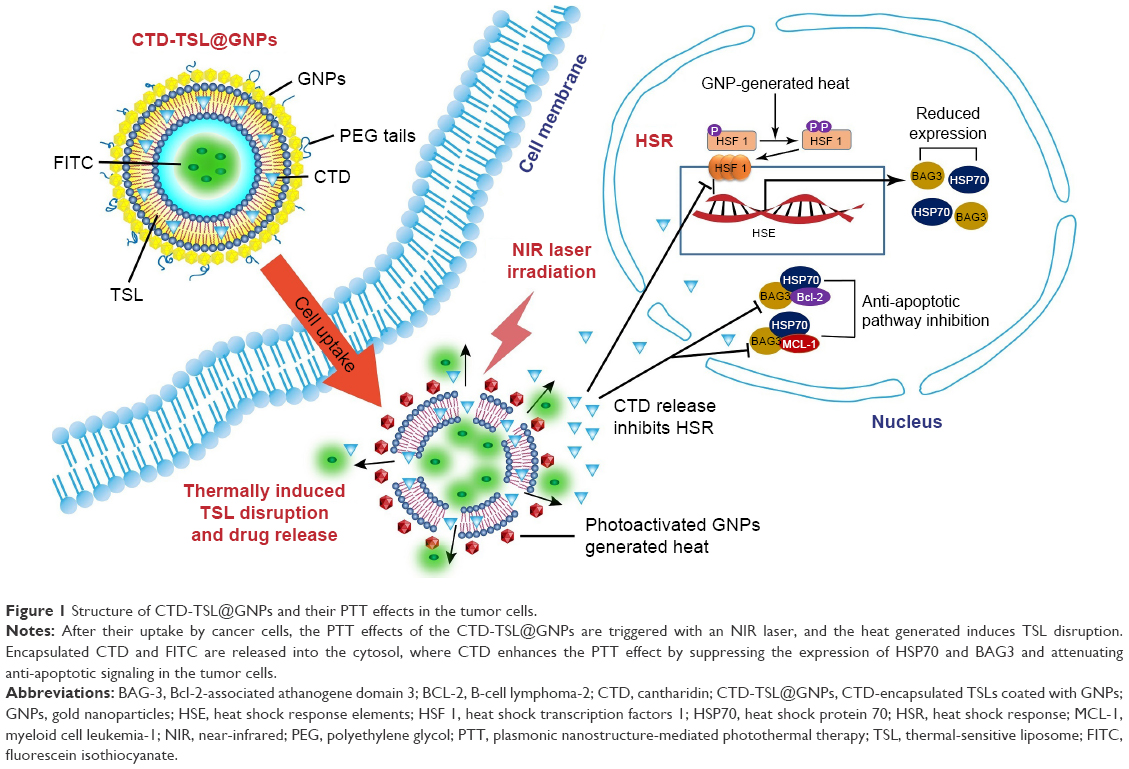 | Figure 1 Structure of CTD-TSL@GNPs and their PTT effects in the tumor cells. |
Materials and methods
Preparation and characterization of CTD-TSL@GNPs
CTD-TSL was prepared by the film hydration strategy modified from a previous study,35 and the composition of TSL referred to the study of Needham et al.36 Briefly, 20 mg of lipid film was prepared by dissolving lipids 1,2-dihexadecanoyl-rac-glycero-3-phosphocholine (DPPC), L-α-phosphatidylcholine, hydrogenated (HSPC), 1,2-dioleoyl-3-trimethylammonium-propane (DOTAP), cholesterol, and 1,2-distearoyl-sn-glycero-3-phosphoethanolamine-N-(polyethylene glycol)-2000 (DSPE-PEG2000) (Avanti Polar Lipids, Alabaster, AL, USA; Figure S1B) in chloroform, in a ratio of 10:3:1:4:2. Then, 100 μL different concentrations of CTD in acetone was added into the lipid solution. Chloroform and acetone were evaporated from the vial under a stream of nitrogen, and the residual was removed by placing the vial in a desiccator under vacuum for 10 h. One milliliter of 50 mM calcein in PBS (for drug release experiments), 1 mM FITC in PBS (for cellular uptake and intracellular drug release experiments), or PBS only (for control) was added into the vial at 48°C, a temperature greater than the highest fluid–solid transition temperature (42°C) of the lipids in the mixture. The solution was incubated for 30 min at 48°C, gently mixed, and then transferred to ice. After 12 min, the solution was incubated again for 12 min in the 48°C water bath, and these steps were repeated six times. The resulting dispersion of multilamellar vesicles was extruded through a 50 nm polycarbonate membrane by using a mini-extruder system (Avanti Polar Lipids) to form unilamellar vesicles. A NAP-5 Sephadex column (GE Healthcare Bio-Sciences Corp., Piscataway, NJ, USA) was used to remove unencapsulated CTD, FITC, or calcein.
CTD-TSL@GNPs were prepared by the strategy modified from the study of Troutman et al.37 Generally, 1 mL of 10 mM AA with different amounts of 50 mM HAuCl4 was added to 100 μL of liposome solution (containing 4 mg/mL lipids); the solutions were slightly mixed, which produced a rapid color change from the translucent milky white of liposomes to purple red, blue, or green depending on the amount of the added HAuCl4. The absorption spectrum of CTD-TSL@GNPs was detected by ultraviolet–visible absorption spectrometry (UV-VIS, V-550; JASCO, Tokyo, Japan). The resulting CTD-TSL and CTD-TSL@GNPs were analyzed by dynamic light scattering (DLS, Mastersizer 3000; Malvern Instruments, Malvern, UK), transmission electron microscopy (TEM, JEM-2010F, JEOL, Tokyo, Japan) and X-ray diffraction (XRD, 6100; Shimadzu Corporation, Kyoto, Japan). The amount of gold, CTD, and FITC in CTD-TSL@GNPs was measured using an inductively coupled plasma optical emission spectrometer (ICP-OES, 5100; Agilent Technologies, Santa Clara, CA, USA), liquid chromatography-mass spectrometry (LC-MS, 6460; Agilent Technologies), and fluorescence spectrum (F4500; Hitachi Ltd., Tokyo, Japan), respectively, after lysing the CTD-TSL@GNPs with 0.25% Triton® X-100 (Sigma-Aldrich, Shanghai, China) for 10 min. CTD-TSL and CTD-TSL@GNPs were stored at 4°C and used within the first 2 weeks after preparation.
Photothermally induced drug release of CTD-TSL@GNPs
CTD-TSL@GNPs were prepared as per the abovementioned protocol with its absorption peak at 808 nm. The photothermal effect of CTD-TSL@GNPs was induced by an 808 nm semiconductor continuous laser (10 W; Changchun Laser Optoelectronics Technology, Changchun, China), and the generated heat was detected by an infrared thermographic camera (Lynx GigE; Xenics Infrad Solutions, Leuven, USA). One milliliter CTD-TSL@GNPs (containing 50 μg/mL gold) and control solutions (CTD-TSL and PBS) were added in a 24-well plate (triplets for each sample), and the 24-well plate was put on a heating platform at 37°C. The samples were irradiated by an 808 nm laser at different power densities (200 mW/cm2, 500 mW/cm2, or 1 W/cm2, 20 min), and the temperature changes were recorded at 0 min, 2 min, 5 min, 10 min, 15 min, and 20 min by the camera.
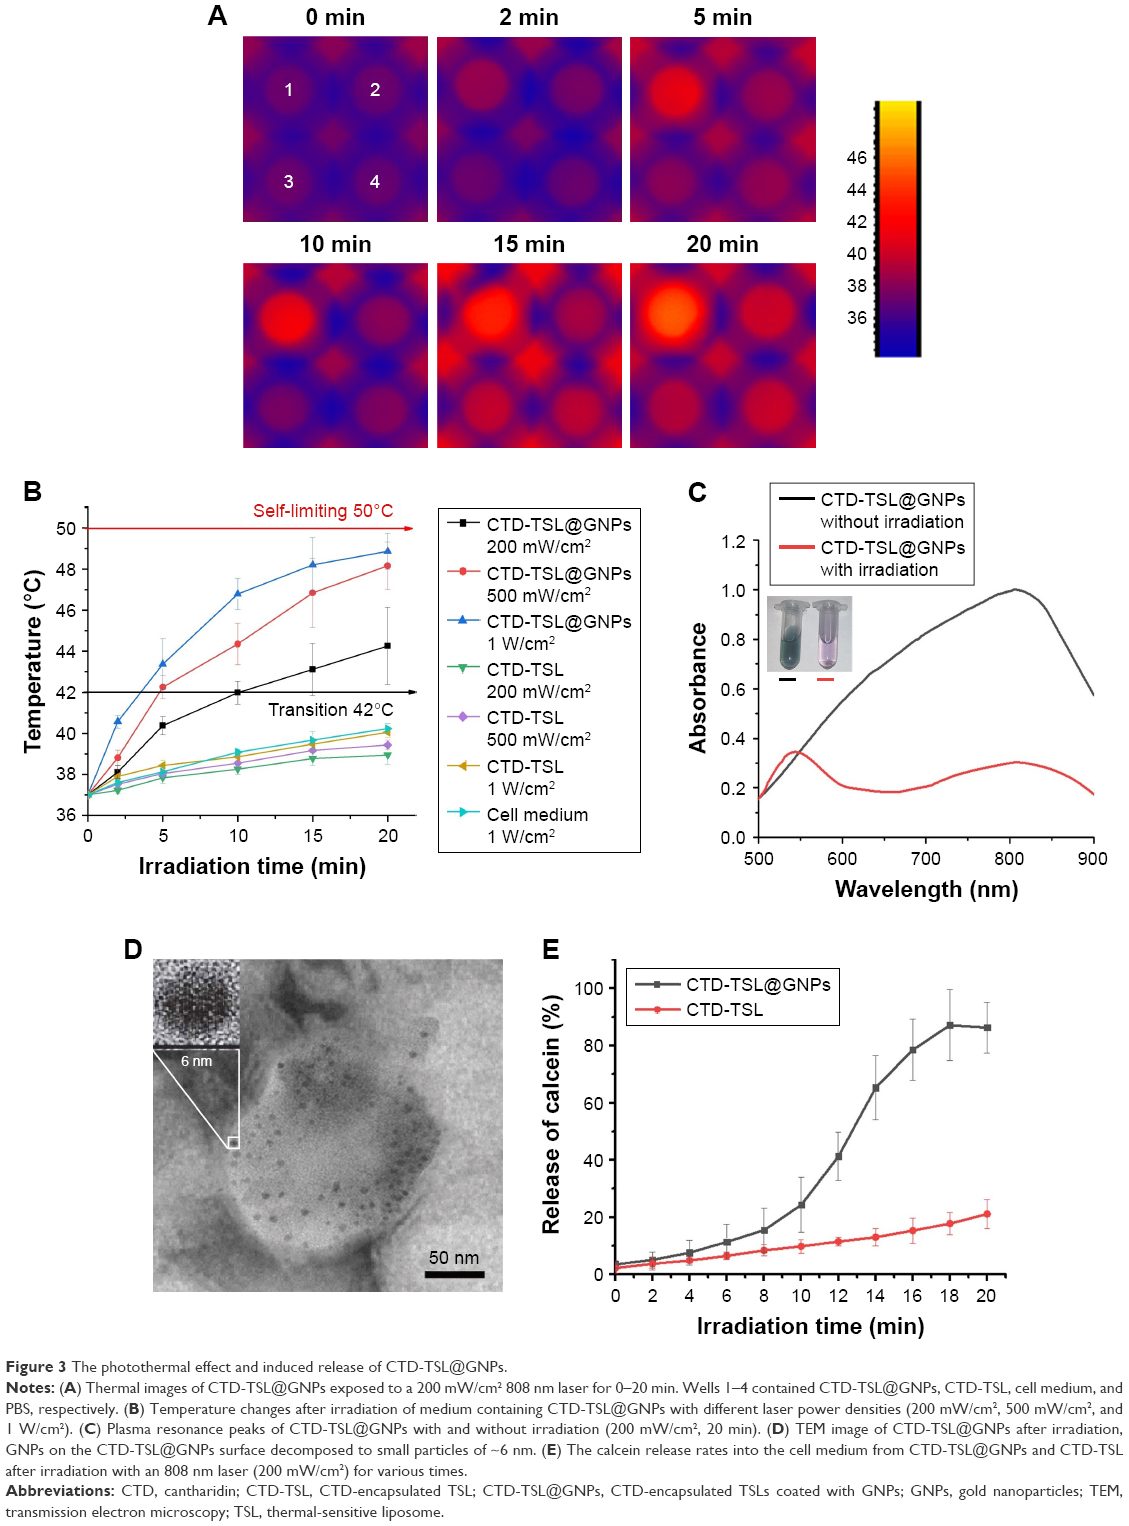
To study the release rate of CTD-TSL@GNPs triggered by the NIR laser, the calcein release experiments were performed by adapting the procedure described by Paasonen et al.38 Briefly, CTD-TSL@GNPs and non-GNP-coated CTD-TSL encapsulating 50 mM calcein were incubated in PBS, treated by 4% Triton X-100, or irradiated by an 808 nm continuous laser (200 mW/cm2) for different times (0–20 min, every 2 min interval), and then the fluorescence intensities (490 nm excitation and 520 nm emission) of the samples were measured using a fluorescent microplate reader (Infinite M200 Pro.; Tecan, Männedorf, Switzerland). Calcein fluorescence is autoquenched inside the liposomes because of the high concentration, but the fluorescence quenching is relieved after its releasing from liposomes. Therefore, the time-depending release rate of CTD-TSL@GNPs and CTD-TSL triggered by an 808 nm laser was calculated as:
|
where FR is the fluorescence of the released calcein from CTD-TSL@GNPs or CTD-TSL triggered by the NIR laser, Fb is the background fluorescence, Ft is the fluorescence of calcein released from CTD-TSL@GNPs or CTD-TSL treated with Triton X-100, and Fbt is the background fluorescence after addition of Triton X-100.
The stability of the CTD-TSL@GNPs in the cell medium and long-term preservation was also studied, and CTD-TSL@GNPs containing calcein were incubated in the cell medium with 10% fetal bovine serum (FBS) and shaken for 12 h or kept in PBS at 4°C for 2 weeks. The leakage of calcein in samples was checked by fluorescence spectroscopy.
Cell lines
Cell experiments were performed on A431 (human cervical cancer cell) cells and fibroblasts (human dermal fibroblasts). Both the cell lines were obtained from American Type Culture Collection (ATCC, Manassas, VA, USA) and were maintained in Dulbecco’s Modified Eagle’s Medium (DMEM) containing 10% FBS (Thermo Fisher Scientific, Waltham, MA, USA) at 37°C in a humidified atmosphere containing 5% CO2.
Cellular uptake and dark toxicity of CTD-TSL@GNPs
To study the cellular uptake of CTD-TSL@GNPs by A431 cells and fibroblasts, the amount of internalized lipids and gold were determined, respectively. Internalized lipids were estimated by measuring the FITC fluorescence encapsulated in the CTD-TSL@GNPs, since the concentration ratio between lipids and FITC was fixed in CTD-TSL@GNPs (Table S1). Briefly, 1 mL of 1×10⁵ cells/mL was plated in the wells of the 24-well plate, after 4 h, 6 h, or 8 h incubation with 200 μL CTD-TSL@GNPs (containing 1 mg/mL lipids and 540 μg/mL gold), and the cells were washed once with serum-free medium and twice with PBS. Cells were subsequently incubated with 100 mL of Radio Immunoprecipitation Assay lysis buffer for 10 min at 20°C. The lysates were homogenized by pipetting up and down five times. The FITC fluorescence signal was measured in the microplate reader, and the internalized amount of gold was measured by ICP-OES in three independent experiments. In order to compare the cellular uptake efficiency of A431 and fibroblast cells, the results were normalized by the total protein of cells. The total protein of each sample was measured by the protein assay (Pierce 660 nm Protein Assay; Thermo Fisher Scientific). The error bars represent standard deviation.
The dark toxicity of CTD-TSL@GNPs on A431 cells was estimated by in vitro cytotoxicity experiments. Briefly, 200 μL A431 cells was seeded at a density of 8,000 per well in the 96-well plate and incubated overnight to attach. Cells were then treated with 40 μL TSL, TSL@GNPs, or CTD-TSL@GNPs (containing 1 mg/mL lipids), encapsulating different concentrations of CTD for 24 h. Then, the cells were washed twice with PBS, 20 μL per well Cell Counting Kit-8 (CCK-8; Dojindo, Tokyo, Japan) was added, and the plates were incubated for an additional 1 h. The absorbance value of each well was read on a microplate reader at the wavelength of 450 nm. The data were expressed as percentage of cell viability compared with control (untreated cells incubating at dark) and were reported as mean values and standard deviation of sextic measurements.
Photothermally triggered drug release of CTD-TSL@GNPs in A431 cells
To estimate the intracellular releasing of encapsulating drugs in CTD-TSL@GNPs, in vitro release experiment and fluorescence microscopy were performed. A431 cells were incubated with 400 μL CTD-TSL@GNPs (containing 1 mg/mL lipids and 27.8 μM FITC), after being seeded in an imaging dish at a concentration of 5×10⁴/mL for 12 h. After additional 6 h incubation, the cells were washed twice with PBS, and the pictures were taken under the fluorescence microscope (ECLIPSE Ti; Nikon Corporation, Tokyo, Japan) with differential interference contrast and FITC channels. The required light exposure for the photothermal effect of CTD-TSL@GNPs was performed with an 808 nm continuous laser (200 mW/cm2) for 20 min. After irradiation, the treated cells were checked by the fluorescence microscope.
Cytotoxic assay of CTD-TSL@GNPs on A431 cells
The elimination effects of A431 cells by CTD-TSL@GNP-mediated PTT were evaluated by in vitro cytotoxicity experiments. Briefly, 200 μL A431 cells was seeded at a density of 8,000 per well in the 96-well plate and incubated overnight to attach. Cells were then treated with 40 μL of TSL, TSL@GNPs, or CTD-TSL@GNPs (containing 1 mg/mL lipids), encapsulating different concentrations of CTD for another 6 h. Then, the wells were divided into two groups, one group was irradiated by an 808 nm continuous laser at different power densities (200 mW/cm2, 500 mW/cm2, or 1 W/cm2, 20 min), and the other group was incubated at dark as controls. After 24 h incubation, the cells were washed twice with PBS, 20 μL per well CCK-8 (Dojindo) was added, and then the plates were incubated for an additional 1 h. The absorbance values of each well were read on a microplate reader at the wavelength of 450 nm. The data were expressed as percentage of cell viability compared with control (untreated cells incubating at dark) and were reported as mean values and standard deviation of sextic measurements.
Apoptosis analysis of CTD-TSL@GNP-treated cells by flow cytometry
To understand the mechanism of the synergistic PTT effect of CTD-TSL@GNPs on A431 cells, the necrosis and apoptotic rates of the treated A431 cells were analyzed by flow cytometry using an Annexin V-FITC/propidium iodide (PI) apoptosis kit (V13241; Thermo Fisher Scientific). Briefly, A431 cells (1×10⁶) were seeded on six-well plates overnight, and then treated with TSL@GNPs or CTD-TSL@GNPs (containing 2.1 μM CTD) for 6 h and exposed to an 808 nm laser (200 mW/cm2, 20 min). After another 12 h incubation, the cells were then harvested using centrifugation (500×g) for 5 min and washed twice with cold PBS. The cells were stained by the Annexin V-FITC/PI apoptosis kit according to the instructions, and the cells were analyzed using a FACScan flow cytometer (BD Biosciences, San Jose, CA, USA). At least three independent experiments were performed.
HSP inhibition effect of CTD-TSL@GNPs analyzed by quantitative polymerase chain reaction (qPCR)
To confirm the occurrence of HSR in CTD-TSL@GNP-triggered PTT and being inhibited by CTD, real-time qPCR was performed to determine the expression of HSP70 and BAG3 after treated with CTD-TSL@GNPs (containing 1 mg/mL lipids), encapsulating different concentrations of CTD for 6 h and irradiated by an 808 nm laser (200 mW/cm2, 20 min). Then, the irradiated cells were incubated for another 1 h and collected for qPCR. The harvested cells of each treated sample were washed with cold PBS twice and lysed with the TransZol Reagent (Thermo Fisher Scientific), and then chloroform was added and centrifuged to collect the RNA. The RNA extracted from each sample was reverse transcribed to cDNA by the Revert Aid First Strand cDNA Synthesis Kit (Thermo Fisher Scientific). Then, the amount of mRNA was estimated by iTaq™ Universal SYBR® Green (Bio-Rad Laboratories Inc., Hercules, CA, USA) and an ABI 7700 real-time qPCR system (Thermo Fisher Scientific) using cDNA as the template. The primer nucleotide sequences for qPCR referred to the study of Kim et al34 and listed as follows: HSP70 forward primer, 5′-ACCAAGCAGACGCAGATCTTC-3′, HSP70 reverse primer, 5′-CGCCCTCGTACACCTGGAT-3′, BAG3 forward primer, 5′-ATGCAGCGATTCCGAACTGAG-3′, BAG3 reverse primer, 5′-AGGATGAGCAGTCAGAGGCAG-3′, GAPDH forward primer, 5′-GGGAGCCAAAAGGGTCATCATCTC-3′, GAPDH reverse primer, 5′-CCATGCCAGTGAGCTTCCCGTTC-3′.
The relative quantities of HSP70 and BAG3 mRNA were normalized against glyceraldehyde 3-phosphate dehydrogenase (GAPDH) mRNA, which was used as the endogenous control. Then, the expression of HSP70 and BAG3 in each sample could be estimated by their amount of mRNA.
Statistical analyses
All statistical analyses were performed using SPSS 12.0 (SPSS Inc., Chicago, IL, USA). Error bars represent standard error of mean (SEM). p-values were calculated using paired Student’s t-test. p-values of <0.01 were considered significant, and p-values of <0.001 were considered highly significant.
Results
Characterization of CTD-TSL@GNPs
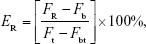
TEM and DLS were used to measure the morphology and size distribution of the CTD-TSL and TSL@GNPs. Non-gold-coated CTD-TSL had a bilayered structure similar to cell membranes, with a diameter of ~60 nm by TEM imaging (Figure 2A), and a narrow size distribution with a median diameter of 67 nm by DLS (Figure 2B). The CTD-TSL was then mixed with different amounts of 50 mM HAuCl4, forming GNPs that were directly reduced on the TSL surface by 1 mL of 10 mM AA, causing a rapid color change from the translucent milky white of CTD-TSL to violet-red, blue, or green depending on the amount. Prepared CTD-TSL@GNPs and their absorption spectra are shown in Figure S2, and the characterization results are listed in Table S2. CTD-TSL@GNPs had a relatively broad peak, and the absorption maxima of CTD-TSL@GNPs exhibit red shift from 530 nm to 810 nm with the increased HAuCl4. This phenomenon was due to the plasma resonance shift upon GNPs formation on the TSL surface. The increase in hydrodynamic size and decrease in zeta potential listed in Table S2 indirectly proved the formation of gold on the TSL surface with the increase in HAuCl4.
 | Figure 2 Characterization of CTD-TSL and CTD-TSL@GNPs. |
To achieve the NIR-triggered PTT effect with deep tissue penetration, in this study, the CTD-TSL@GNPs (No 8 in Table S2) with NIR absorption at 804 nm were chosen, and it was verified by TEM and DLS. The selected CTD-TSL@GNPs had spherical structure with diameters of 70–100 nm and a surface with high electron absorption, indicating the presence of GNPs (Figure 2C). The selected CTD-TSL@GNPs had a median diameter of 96 nm according to the DLS results (Figure 2B). The broader size distribution of CTD-TSL@GNPs compared with CTD-TSL is due to the relatively heterogeneous deposition of gold on each liposome. XRD analysis of CTD-TSL@GNPs (Figure 2D) displayed four additional diffraction peaks at 2θ = 38.16°, 43.44°, 65.32°, and 78.28°. These peaks matched the footprint peaks of the face-centered cubic structure of Au crystals and confirmed the existence of GNPs on the CTD-TSL@GNPs surface. The concentration ratios of lipids, gold, and encapsulating FITC in CTD-TSL@GNPs samples are listed in Table S1. CTD-TSL@GNPs containing 1 mg/mL lipids encapsulated ~540 μg/mL gold and 27.8 μM FITC. The different concentrations of encapsulated CTD in CTD-TSL@GNPs for subsequent cell experiments are listed in Table S3. Four CTD-TSL@GNPs samples added 100 μL 0.2 mM, 0.5 mM, 1 mM and 2mM CTD during synthesis encapsulated ~5.2 μM, 10.2 μM, 18.6 μM, or 31.7 μM, respectively.
The stability of CTD-TSL@GNPs was examined by the calcein release experiment. When CTD-TSL@GNPs were incubated in the cell medium with 10% FBS and shaken for 12 h, ~10% of the calcein had leaked out of CTD-TSL@GNPs (Figure S3). After 2 weeks of refrigerated storage, ~9% of the calcein had leaked. Therefore, CTD-TSL@GNPs retained their stability for at least 12 h in the cell culture medium containing FBS and 2 weeks in the fridge. All the prepared CTD-TSL@GNPs were used within 2 weeks.
Photothermal effects and induced release of CTD-TSL@GNPs
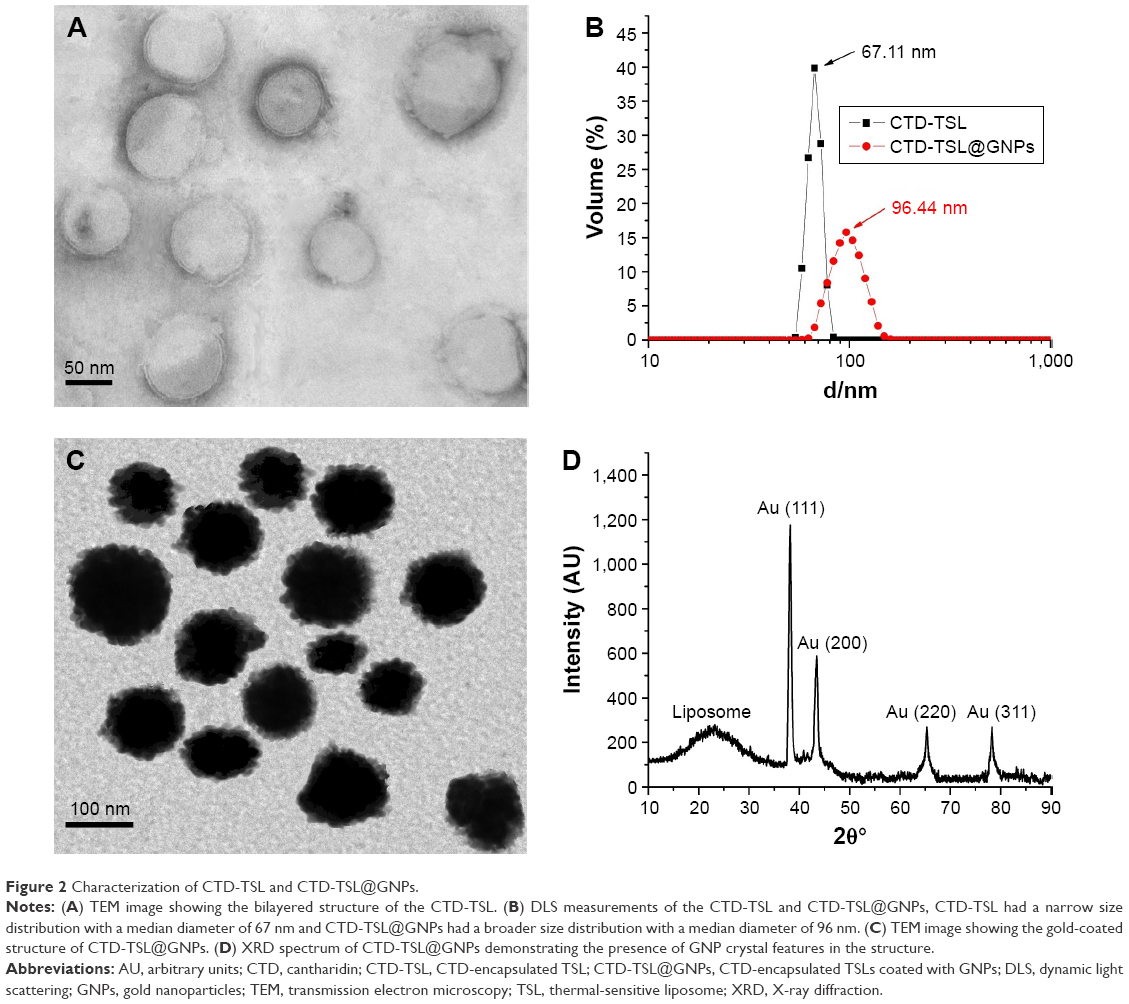
To understand the photothermal conversion capacity of CTD-TSL@GNPs, they were exposed to an 808 nm laser, and an infrared thermal camera was used to measure temperature changes during irradiation. The temperature of the solution containing CTD-TSL@GNPs (0.2 mg/mL lipids and 108 μg/mL gold) increased from 37°C to 44°C in 20 min and reached the transition temperature of CTD-TSL (42°C) in 10–15 min, while the temperature of the control solutions (CTD-TSL, cell medium, or PBS) only increased to 38°C, in varying amounts of time (Figure 3A). Figure 3B shows the temperature changes in the samples irradiated with different laser power densities. After irradiation with higher power densities (500 mW/cm2 or 1 W/cm2), the temperature of CTD-TSL@GNPs solution increased to higher levels more quickly, but plateaued at 50°C, suggesting a self-limiting mechanism of CTD-TSL@GNPs. The plasma resonance peak of CTD-TSL@GNPs shifted from 808 nm to 534 nm, which is the plasma resonance peak of gold seeds (Figure 3C). This shift led to the change in solution color and prevents NIR-triggered PTT, limiting the temperature increase. Although this self-limiting mechanism restricts PTT efficiency, it could also attenuate the thermal diffusion range and avoid side effects on peripheral normal tissues. The photothermal effect of GNPs on the TSL surface induced the disintegration of the inside liposome structure and GNPs on the surface decomposed to small particles of ~6 nm (Figure 3D).
 | Figure 3 The photothermal effect and induced release of CTD-TSL@GNPs. |
During the photothermal-induced disruption of CTD-TSL@GNPs, CTD was released from the TSLs. To examine the release process and calculate the release rate, calcein release experiments were performed to mimic CTD leakage during laser irradiation (Figure 3E). For CTD-TSL@GNPs, the calcein release process could be divided into two stages: with an irradiation time of <8 min and a temperature lower than the transition temperature of TSL (42°C), calcein release was slow, whereas with an irradiation time of >8 min and a temperature near or higher than 42°C, rapid calcein release was observed. The efficiency sharply increased from 15.5% after 8 min irradiation to the maximal release efficiency, 87.2%, after 18 min irradiation. Without the GNP coating, the temperature of CTD-TSL did not reach 42°C upon NIR irradiation and displayed sluggish calcein release in the cell medium. Therefore, drug release was triggered by the photothermal effect of the GNPs on the surface of CTD-TSL@GNPs. The drug release rate increased with increased irradiation dose, and 20 min of 200 mW/cm2 NIR laser irradiation induced maximal drug release from the CTD-TSL@GNPs in the cell medium.
Cellular uptake and dark toxicity of CTD-TSL@GNPs
The cellular uptake efficiency of CTD-TSL@GNPs was estimated by the amount of internalized lipids and gold in A431 cells and fibroblasts after different incubation times (Figure 4A). For A431 cells, maximal amounts of internalized lipids and gold were observed after 6 h of incubation. For fibroblasts, the amounts of internalized lipids and gold increased with the incubation time and were much lower than A431 cells. This may be because cancer cells have a faster metabolic rate than normal cells, and A431 cells uptake more CTD-TSL@GNPs and reach saturation more quickly than fibroblasts. Therefore, the best time point for PTT irradiation was after 6 h of incubation, when the highest amount of CTD-TSL@GNPs had accumulated in A431 cells, with lower amounts in fibroblasts, enhancing the photothermal effects on tumor cells and reducing the damage to normal cells.
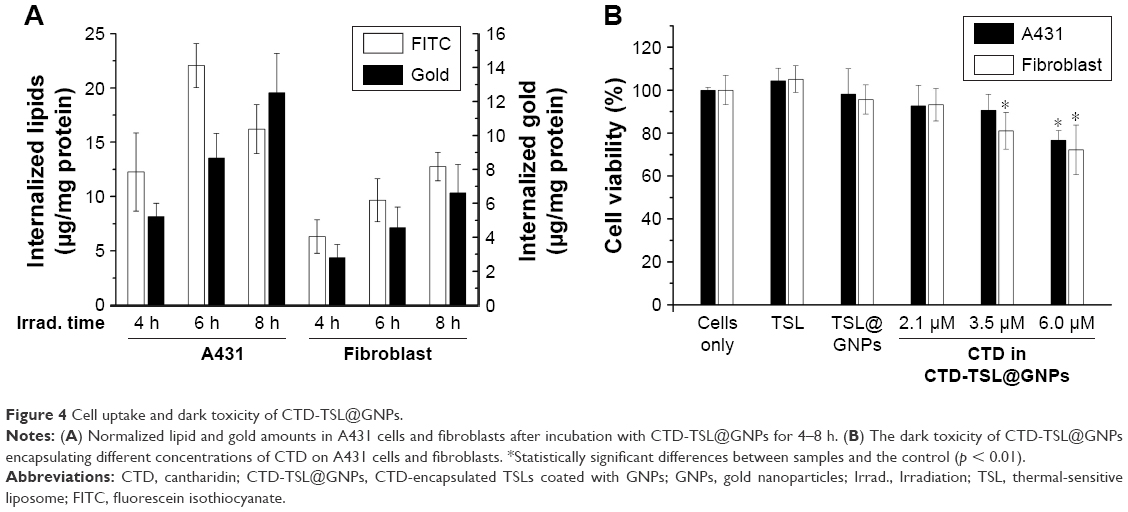 | Figure 4 Cell uptake and dark toxicity of CTD-TSL@GNPs. |
Figure 4B shows the dark toxicity of CTD-TSL@GNPs containing different concentrations of CTD (2.1 μM, 3.5 μM, and 6.0 μM) and control solutions (cells only, TSL, and TSL@GNPs) to A431 cells and fibroblasts. TSL and TSL@GNPs without CTD showed no significant dark cytotoxicity to either A431 cells or fibroblasts, but the viabilities of cells incubated with CTD-TSL@GNPs decreased with increased encapsulated CTD concentration, due to the ~10% CTD leakage from the CTD-TSL@GNPs (Figure S3A). Neither A431 cells nor fibroblasts showed detectable cytotoxicity to CTD-TSL@GNPs containing 2.1 μM CTD. However, at 3.5 μM and 6.0 μM, the cytotoxicity was significant compared with the control, and fibroblasts were more sensitive to the increase than A431 cells. The viability of A431 cells incubated with CTD-TSL@GNPs containing 3.5 μM CTD slightly decreased compared to the control (cells only), but the difference was not significant (p=0.0187), while fibroblast viability decreased significantly (p=0.0054). With CTD-TSL@GNPs containing 6.0 μM CTD, both A431 cells (p=0.0021) and fibroblasts (p=0.0013) showed clear dark toxicity. Since low dark cytotoxicity is a necessary requirement for PTT agents, 2.1 μM was chosen as the encapsulated CTD concentration for subsequent experiments.
Photothermally induced drug release from CTD-TSL@GNPs in A431 cells
Cellular FITC release experiments were performed in A431 cells to mimic the intracellular release of CTD encapsulated in CTD-TSL@GNPs during PTT irradiation. Figure 5 shows the intracellular distribution of FITC fluorescence in A431 cells treated with CTD-TSL@GNPs (containing 1 μM FITC) for 6 h. Before NIR-triggered release, the FITC signal exhibited a predominantly punctate and perinuclear distribution in the cytosol, indicating that most of the FITCs were still encapsulated in CTD-TSL@GNPs after cellular uptake. However, after NIR irradiation for 20 min, the FITC signal spreads throughout the cytosol, and some of the FITCs even leaked out of the cells, presumably because of membrane damage during PTT. This suggested that the release of encapsulated cargo (FITC) from CTD-TSL@GNPs could be triggered by NIR in A431 cells. Since CTD and FITC are small molecules of similar molecular weight, it was speculated that CTD encapsulated in CTD-TSL@GNPs could also be released by this process.
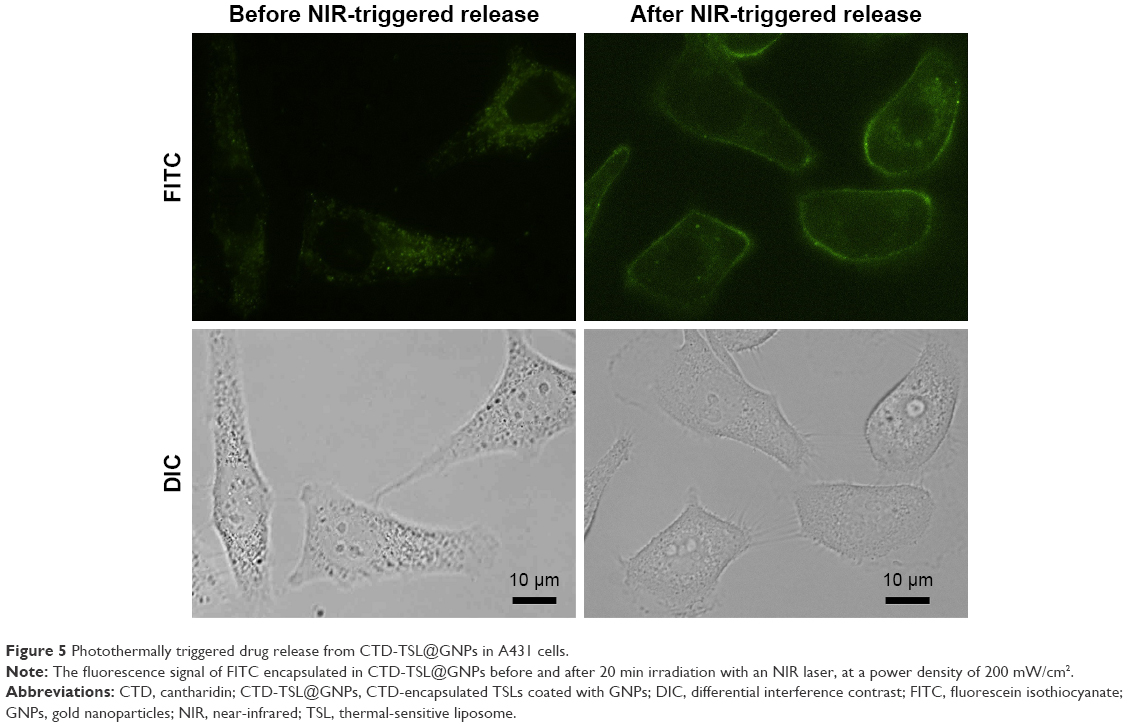 | Figure 5 Photothermally triggered drug release from CTD-TSL@GNPs in A431 cells. |
Photothermal effects of CTD-TSL@GNPs on A431 cells
To assess the photothermal effects of CTD-TSL@GNPs on A431 cells, in vitro cytotoxicity and apoptosis assays were performed in CTD-TSL@GNP-treated A431 cells after NIR irradiation. The viability of non-durg-treated cells after irradiation with an 808 nm laser was slightly decreased with the increased power density and showed significant losses (10%–15%) compared with non-irradiated cells, when the irradiation power density increased to 500 mW/cm2 (90.16%, p=0.0083) and 1 W/cm2 (86.37%, p=0.0021) (Figure 6A). The cells treated with TSL were somewhat more tolerant to increased light power than non-treated cells, possibly because TSL could assume some light damage and protect cells from the strong light, but they still displayed an ~10% loss of viability when the irradiation power density increased to 1 W/cm2 (89.27%, p=0.0076). The cells treated with TSL@GNPs exhibited obvious losses after NIR irradiation because of the photothermal effect generated by GNPs. The viability of TSL@GNP-treated cells decreased to 40.13%, 18.59%, and 13.31%, respectively, after 200 mW/cm2, 500 mW/cm2, and 1 W/cm2 irradiation. Highly significant differences (p=0.00036) were found between TSL@GNP-treated samples after low (200 mW/cm2) and high (500 mW/cm2) power irradiation; this difference was even more significant when compared with the samples irradiated by the 1 W/cm2 laser (p=0.00014). However, when TSL@GNPs encapsulated 1.1 μM CTD, the statistical difference between the treated samples after 200 mW/cm2 and 500 mW/cm2 irradiation was decreased (p=0.038), and the viabilities of these samples decreased to 23.65% and 14.89%, respectively. The viabilities of low power (200 mW/cm2) irradiated, CTD-TSL@GNP-treated samples were significantly different (p=0.0027) from the viability of non-CTD-encapsulated, TSL@GNP-treated samples. When the concentration of encapsulated CTD increased to 2.1 μM, there was no statistical difference between the viabilities of low (200 mW/cm2) and high (500 mW/cm2) power-irradiated samples, and the viabilities of low power-irradiated, CTD-TSL@GNP-treated samples were highly significantly different (p=0.00035) from the viabilities of non-CTD-encapsulated TSL@GNP-treated samples. When the concentration of encapsulated CTD increased to 3.5 μM, better PTT performance under low power irradiation was observed, although the treatment caused significant dark toxicity. Therefore, with the help of CTD, CTD-TSL@GNPs achieved almost the same PTT effect as high power laser irradiation (500 mW/cm2 or 1 W/cm2) at a skin tolerant power density (200 mW/cm2). The optimal concentration of encapsulated CTD in the experiments was 2.1 μM.
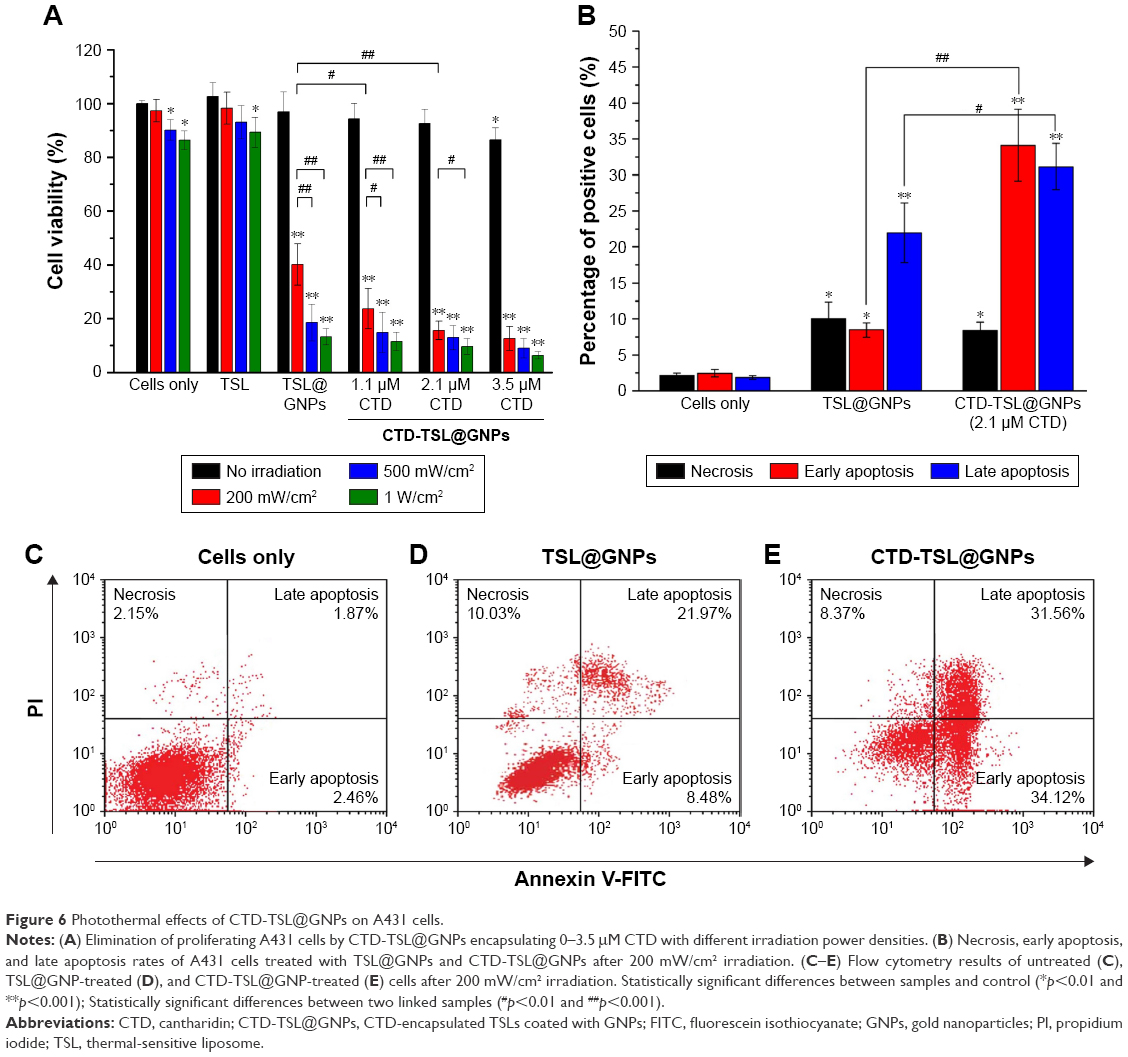 | Figure 6 Photothermal effects of CTD-TSL@GNPs on A431 cells. |
To understand the role of CTD in CTD-TSL@GNP-mediated PTT in A431 cells, the necrosis, early and late apoptosis rates of untreated, TSL@GNP-treated, and CTD-TSL@GNP (2.1 μM CTD)-treated cells after 200 mW/cm2 irradiation were measured by flow cytometry (Figure 6C–E). Only 30.45% of cells treated with TSL@GNPs was apoptotic and 10.03% was necrotic, and most of the apoptotic cells were in late apoptosis (21.97%; Figure 6D). Conversely, 65.68% of cells treated with CTD-TSL@GNPs was necrotic or apoptotic after the irradiation. The late apoptosis rate increased from 21.97% to 31.56% and the early apoptosis rate increased from 8.48% to 34.12% when 2.1 μM CTD was encapsulated in the TSL@GNPs. These data were compiled in a histogram (Figure 6B) and were compared with Student’s t-test. Significant differences in the apoptosis rates of TSL@GNP- and CTD-TSL@GNP-treated cells were observed, especially the early apoptosis rates (p=0.00038), which may explain the improved photothermal effect of CTD-TSL@GNPs with low power irradiation in Figure 6A and suggest that CTD effectively increases apoptosis after TSL@GNP-induced PTT.
To examine the effects of CTD on the HSR, the mRNA expression levels of HSP70 and BAG3 in cells treated with CTD-TSL@GNPs containing different amounts of CTD and different irradiation densities were determined by qPCR. PTT irradiation induced a 15-fold increase in HSP70 mRNA and a ninefold increase in BAG3 mRNA, and CTD blocked HSR-induced HSP70 and BAG3 mRNA expression in a concentration-dependent manner, with ~100% inhibition at 3.5 μM (Figure 7). At 2.1 μM, the concentration used in cytotoxicity and apoptosis experiments, HSP70 and BAG3 mRNA expression were inhibited by ~90% resulting in highly efficient PTT with low power irradiation. Therefore, the results revealed that CTD could suppress low power PTT-induced HSR in the treated tumor cells by downregulation of the expression of HSR proteins such as HSP70 and BAG3.
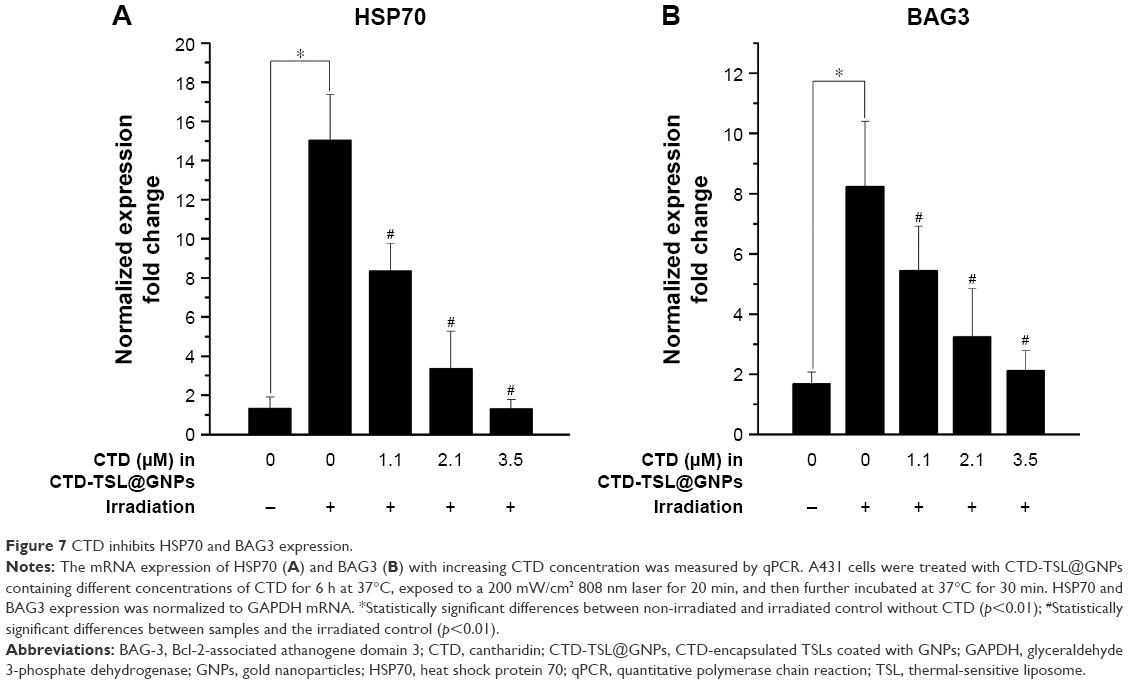 | Figure 7 CTD inhibits HSP70 and BAG3 expression. |
Discussion
Nanomaterials hold great promise for cancer treatment because of their unique advantages and have been widely studied as drug carriers in recent decades. However, these efforts have been mostly confined to academic or pre-clinical studies. Therefore, it is highly urgent to transfer these nanomaterials from “bench to bedside”, especially for PTT. Most nanomaterials applied in PTT are inorganic and usually activated by very high power lasers, which limit their clinical use.
In this study, a novel nanostructure for PTT was provided, which has both good biodegradability and high PTT efficiency using clinically acceptable laser power. PEG liposomes were used as a spherical template, and small GNPs were directly synthesized on the outer surface of the liposomes to form a shell–core LNA structure. The liposomal core was thermal sensitive and based on the skeleton formed by dialkyl phosphatidylcholine lipids (a mixture of DPPC and HPPC) to reach a phase transition temperature of 42°C. The liposomal core was surface modified to have a positive charge (Table S2) by introducing a cationic lipid DOTAP. Thus, gold anions could be adsorbed to the cationic surface of the liposomal core and formed gold anion–lipid complexes through electrostatic interactions when mixed with HAuCl4 solution. Gold anions could be directly reduced to zero-valent metals by AA, forming small GNPs on the liposome surface,39 which explains the decrease in zeta potential of the formed CTD-TSL@GNPs with increased HAuCl4 in the reaction (Table S2). PEG tails were also modified onto the liposomal surface by DSPE-PEG2000 to evade blood clearance of MPS. Because the tails were neutral in the reaction solution (PBS, pH=7.4) and therefore did not attract gold anions over them, they remained exposed to the external environment and retained their function after the GNP formation. The gold anion–lipid complexes also enabled the gold to assemble into small GNPs rather than a continuous gold nanoshell after the reaction, as indicated by the color change and shift of absorption peak in Figure 3C and the TEM image in Figure 3D after NIR laser-induced decomposition. These small GNPs were 5–6 nm in size (Figure 3D), allowing for filtration through the glomerular basement membrane. Therefore, the CTD-TSL@GNPs are biodegradable and should allow renal clearance in vivo.
NIR laser-induced decomposition of CTD-TSL@GNPs was due to the photothermal effects of the surface-coated GNPs, which have a plasma absorption similar to gold nanoshells according to theoretical calculations in the study of Romanowski et al.37 Their absorption peak was tunable by varying the amount of gold on the liposomal surface (Figure S2). In this study, the absorption peak of the CTD-TSL@GNPs was adjusted to 804 nm to match the NIR irradiation window (800–900 nm) of biological tissues. CTD-TSL@GNPs exhibited high photothermal conversion capacity upon high power irradiation (500 mW/cm2 or 1 W/cm2) and the temperature increased to 48°C–49°C in 20 min (Figure 3A and B). This temperature causes necrosis in tumor cells and usually exhibits good PTT efficiency. However, these levels of irradiation are beyond the clinical tolerance threshold.19 Therefore, this study focused on the PTT effects of CTD-TSL@GNPs upon irradiation with a clinically acceptable power density, such as 200 mW/cm2. The temperature of cell medium containing CTD-TSL@GNPs only rose to 44°C with 200 mW/cm2 irradiation. According to the study of Chu and Dupuy, temperatures of 41°C–45°C are sublethal to cancer cells, and the damage they cause is reversible.40 In this temperature range, most of the treated cells displayed apoptosis instead of necrosis, as shown by flow cytometry (Figure 6D). The HSP plays an important role in limiting the effects of thermal therapy under these conditions, by stimulating and promoting anti-apoptotic signaling,20 and therefore, the effects of PTT with low power irradiation are usually unsatisfactory.
In this study, the traditional Chinese medicine CTD was introduced in the nanostructures to antagonize the HSR and promote apoptosis and improve the effects of PPT with low power irradiation. CTD was encapsulated in the lipid layer of CTD-TSL@GNPs and released into the cytoplasm during PTT (Figure 5). PTT-induced CTD release was due to the thermal sensitivity of the lipid scaffold and the photothermal effect generated by the surface-coated GNPs. The results (Figure 6A) showed that with the help of CTD, CTD-TSL@GNPs could reach the same high PTT efficiency on A431 cells with 200 mW/cm2 laser irradiation as those irradiated with 500 mW/cm2 or even 1 W/cm2. With increased encapsulated CTD, the PTT of CTD-TSL@GNPs on A431 cells was increasingly effective. However, the dark cytotoxicity of CTD limited its concentration in CTD-TSL@GNPs. Although its dark toxicity was greatly reduced when CTD is encapsulated in liposomes, some CTD leakage remained (Figure S3A). The results showed that 2.1 μM may be the optimal concentration of encapsulated CTD in CTD-TSL@GNPs, as this concentration did not cause dark toxicity to normal or tumor cells (Figure 4B) and simultaneously maximized the low power PTT efficiency of the CTD-TSL@GNPs.
The mechanism underlying the effect of CTD on PTT was preliminarily examined in this study by flow cytometry and qPCR. Cytometry results showed a substantial increase in the apoptosis rate after treatment with CTD-TSL@GNPs containing 2.1 μM CTD, indicating that CTD could effectively increase apoptosis in cells treated with low power PTT. Low power PTT usually induces apoptosis of tumor cells instead of necrosis because of the insufficient temperature rise, but this apoptosis is easily countered by the HSR. Therefore, it was speculated that the effect of CTD was due to its antagonism of the HSR. HSP70 and BAG3 are two of the key proteins participating in the HSR and are also involved in apoptosis.27 The downregulation of HSP70 can inhibit cell proliferation and induce apoptosis. BAG3 is not only a HSR-related protein but also a Bcl-2-interacting protein, which enhances cancer cell survival by stabilizing Bcl-2 family proteins such as Bcl-2, Bcl-xL, and MCL-1, which play important roles in anti-apoptotic signaling.24 In this study, the mRNA expression of HSP70 and BAG3 in cells treated with CTD-TSL@GNPs incorporating different amounts of CTD were compared. A notable HSR was observed after PTT with non-CTD-encapsulated TSL@GNPs, with 15-fold and ninefold increases in HSP70 and BAG3, respectively (Figure 7). With increased CTD, significant decreases in HSP70 and BAG3 mRNA were observed, indicating that CTD could downregulate HSP70 and BAG3 expression, suppressing the HSR and increasing apoptosis after the treatment of tumor cells with CTD-TSL@GNP-mediated low power PTT. Hence, CTD incorporated in CTD-TSL@GNPs effectively enhanced the low power PTT.
CTD-TSL@GNPs showed a great potential for clinical PTT use due to its good biodegradability and high PTT efficiency with low power irradiation. However, this study is a preliminary work that establishes the nanosystem and briefly examines the synergistic enhancement effects of CTD; further in vivo experiments and more detailed molecular biology work should be performed to test the biodegradability of the CTD-TSL@GNPs and more clearly elucidate the role of CTD in PTT. Beyond this, although CTD-TSL@GNPs could relatively accumulate in the tumor by EPR, they were not able to actively attack tumor cells due to the absence of targeting ligands. Tumor-targeting antibodies and peptides will be modified on the surface of CTD-TSL@GNPs by PEG linkers to improve their active tumor targeting in the future work, with the eventual goal of applying CTD-TSL@GNPs as a promising PTT agent for skin cancer therapy.
Conclusion
A novel nanosystem for skin cancer PTT on an LNA scaffold was synthesized. The results showed that small GNPs were in situ synthesized on the surface of TSL to achieve NIR-triggered PTT and controllable drug release. The coated GNPs disintegrated into small particles after the NIR irradiation, resulting in high biodegradability of the nanostructure. In addition, a traditional Chinese medicine, CTD, was introduced into the nanosystem and encapsulated in the lipid layers of the TSLs. CTD was released after NIR-triggered PTT, inhibiting the expression of HSPs such as HSP70 and Bcl-2-interacting protein such as BAG3. Eventually, the CTD-TSL@GNPs achieved a highly efficient PTT effect with a clinical acceptable irradiation power on A431 cells by suppressing the PTT-induced HSR and attenuating the anti-apoptotic signaling.
Acknowledgments
This work was supported by the National Natural Science Foundation of China under Grant Nos 61705177, 61335012, 61727823, 61575156, 61775178, and 61505159 and the China Postdoctoral Science Foundation under Grant No 2017M613107 and 2015M572570.
Disclosure
The authors report no conflicts of interest in this work.
References
Jain PK, Huang X, El-Sayed IH, El-Sayed MA. Review of some interesting surface plasmon resonance-enhanced properties of noble metal nanoparticles and their applications to biosystems. Plasmonics. 2007;2(3):107–118. | ||
Huang X, Jain PK, El-Sayed IH, El-Sayed MA. Plasmonic photothermal therapy (PPTT) using gold nanoparticles. Lasers Med Sci. 2008;23(3):217. | ||
Okuno T, Kato S, Hatakeyama Y, et al. Photothermal therapy of tumors in lymph nodes using gold nanorods and near-infrared laser light. J Control Release. 2013;172(3):879. | ||
Zhang P, Hu C, Wei R, Jia M, Qi Y, Li Y. Recent progress in light-triggered nanotheranostics for cancer treatment. Theranostics. 2016;6(7):948–968. | ||
Hwang S, Nam J, Jung S, Song J, Doh H, Kim S. Gold nanoparticle-mediated photothermal therapy: current status and future perspective. Nanomedicine. 2014;9(13):2003–2022. | ||
Riley RS, Day ES. Gold nanoparticle-mediated photothermal therapy: applications and opportunities for multimodal cancer treatment. Wiley Interdiscip Rev Nanomed Nanobiotechnol. 2017;9(4). | ||
Ali MR, Rahman MA, Wu Y, et al. Efficacy, long-term toxicity, and mechanistic studies of gold nanorods photothermal therapy of cancer in xenograft mice. Proc Natl Acad Sci U S A. 2017;114(15):E3110. | ||
Trinidad AJ, Hong SJ, Peng Q, Madsen SJ, Hirschberg H. Combined concurrent photodynamic and gold nanoshell loaded macrophage-mediated photothermal therapies: an in vitro study on squamous cell head and neck carcinoma. Lasers Surg Med. 2014;46(4):310–318. | ||
Zhang XD, Wu D, Shen X, Liu PX, Fan FY, Fan SJ. In vivo renal clearance, biodistribution, toxicity of gold nanoclusters. Biomaterials. 2012;33(18):4628. | ||
Choi HS, Liu W, Misra P, et al. Renal clearance of quantum dots. Nat Biotechnol. 2007;25(10):1165–1170. | ||
Pombo GK, Zarschler K, Barbaro L, et al. Zwitterionic-coated “stealth” nanoparticles for biomedical applications: recent advances in countering biomolecular corona formation and uptake by the mononuclear phagocyte system. Small. 2014;10(13):2516. | ||
Jahangirian H, Lemraski EG, Webster TJ, Rafiee-Moghaddam R, Abdollahi Y. A review of drug delivery systems based on nanotechnology and green chemistry: green nanomedicine. Int J Nanomedicine. 2017;12:2957. | ||
Xu L, Cheng L, Wang C, Peng R, Liu Z. Conjugated polymers for photothermal therapy of cancer. Polym Chem. 2014;5(5):1573–1580. | ||
Kango S, Kalia S, Celli A, Njuguna J, Habibi Y, Kumar R. Surface modification of inorganic nanoparticles for development of organic–inorganic nanocomposites – a review. Prog Polym Sci. 2013;38(8):1232–1261. | ||
Preiss MR, Gupta A, Bothun GD. Liposome-nanoparticle assemblies. Bionanotechnology: Biological Self-Assembly and Its Applications. 2013:273–309. | ||
Preiss MR, Bothun GD. Stimuli-responsive liposome-nanoparticle assemblies. Expert Opin Drug Deliv. 2011;8(8):1025. | ||
Yuan H, Fales AM, Vodinh T. TAT peptide-functionalized gold nanostars: enhanced intracellular delivery and efficient NIR photothermal therapy using ultralow irradiance. J Am Chem Soc. 2012;134(28):11358–11361. | ||
Vankayala R, Lin CC, Kalluru P, Chiang CS, Hwang KC. Gold nanoshells-mediated bimodal photodynamic and photothermal cancer treatment using ultra-low doses of near infra-red light. Biomaterials. 2014;35(21):5527. | ||
Thomas RJ, Rockwell BA, Marshall WJ, et al. A procedure for multiple-pulse maximum permissible exposure determination under the Z136. 1-2000 American National Standard for Safe Use of Lasers. J Laser Appl. 2001;13(4):134–140. | ||
Sanghera SS, Skitzki JJ. Targeting the heat shock response in cancer. Surg Oncol Clin N Am. 2013;22(4):665–684. | ||
Corry PM, Armour EP. The heat shock response: role in radiation biology and cancer therapy. Int J Hyperthermia. 2005;21(8):769–778. | ||
Vankayala R, Huang YK, Kalluru P, Chiang CS, Hwang KC. First demonstration of gold nanorods-mediated photodynamic therapeutic destruction of tumors via near infra-red light activation. Small. 2013;10(8):1612–1622. | ||
Huang HC, Yang Y, Nanda A, Koria P, Rege K. Synergistic administration of photothermal therapy and chemotherapy to cancer cells using polypeptide-based degradable plasmonic matrices. Nanomedicine. 2011;6(3):459–473. | ||
Rosati A, Graziano V, Laurenzi VD, Pascale M, Turco MC. BAG3: a multifaceted protein that regulates major cell pathways. Cell Death Dis. 2011;2(4):e141. | ||
Mayer MP, Bukau B. Hsp70 chaperones: cellular functions and molecular mechanism. Cell Mol Life Sci. 2005;62(6):670–684. | ||
Wang BK, Yu XF, Wang JH, et al. Gold-nanorods-siRNA nanoplex for improved photothermal therapy by gene silencing. Biomaterials. 2016;78:27–39. | ||
Colvin TA, Gabai VL, Gong J, et al. Hsp70-Bag3 interactions regulate cancer-related signaling networks. Cancer Res. 2014;74(17):4731. | ||
Moed L, Shwayder TA, Chang MW. Cantharidin revisited: a blistering defense of an ancient medicine. Arch Dermatol. 2001;137(10):1357. | ||
Zheng LH, Bao YL, Wu Y, Yu CL, Meng X, Li YX. Cantharidin reverses multidrug resistance of human hepatoma HepG2/ADM cells via down-regulation of P-glycoprotein expression. Cancer Lett. 2008;272(1):102–109. | ||
Hsia TC, Lin JH, Hsu SC, et al. Cantharidin induces DNA damage and inhibits DNA repair-associated protein levels in NCI-H460 human lung cancer cells. Environ Toxicol. 2015;30(10):1135. | ||
Li W, Xie L, Chen Z, et al. Cantharidin, a potent and selective PP2A inhibitor, induces an oxidative stress-independent growth inhibition of pancreatic cancer cells through G2/M cell-cycle arrest and apoptosis. Cancer Sci. 2010;101(5):1226. | ||
Huang WW, Ko SW, Tsai HY, et al. Cantharidin induces G2/M phase arrest and apoptosis in human colorectal cancer colo 205 cells through inhibition of CDK1 activity and caspase-dependent signaling pathways. Int J Oncol. 2011;38(4):1067. | ||
Chang CC, Liu DZ, Lin SY, et al. Liposome encapsulation reduces cantharidin toxicity. Food Chem Toxicol. 2008;46(9):3116. | ||
Kim JA, Kim Y, Kwon BM, Dong CH. The natural compound cantharidin induces cancer cell death through inhibition of heat shock protein 70 (HSP70) and Bcl-2-associated athanogene domain 3 (BAG3) expression by blocking heat shock factor 1 (HSF1) binding to promoters. J Biol Chem. 2013;288(40):28713. | ||
Wang SJ, Hüttmann G, Zhang ZX, et al. Light-controlled delivery of monoclonal antibodies for targeted photoinactivation of ki-67. Molecular Pharmaceutics. 2015;12(9):3272–3281. | ||
Needham D, Anyarambhatla G, Kong G, Dewhirst MW. A new temperature-sensitive liposome for use with mild hyperthermia: characterization and testing in a human tumor xenograft model. Cancer Res. 2000;60(5):1197. | ||
Troutman TS, Barton JK, Romanowski M. Biodegradable plasmon resonant nanoshells. Adv Mater Deerfield. 2008;20(13):2604–2608. | ||
Paasonen L, Laaksonen T, Johans C, Yliperttula M, Kontturi K, Urtti A. Gold nanoparticles enable selective light-induced contents release from liposomes. J Control Release. 2007;122(1):86–93. | ||
Ferrar WT, O’Brien DF, Warshawsky A, Voycheck CL. Metalization of lipid vesicles via electroless plating. J Am Chem Soc. 1988;1(1):288–289. | ||
Chu KF, Dupuy DE. Thermal ablation of tumours: biological mechanisms and advances in therapy. Nat Rev Cancer. 2014;14(3):199–208. |
Supplementary materials
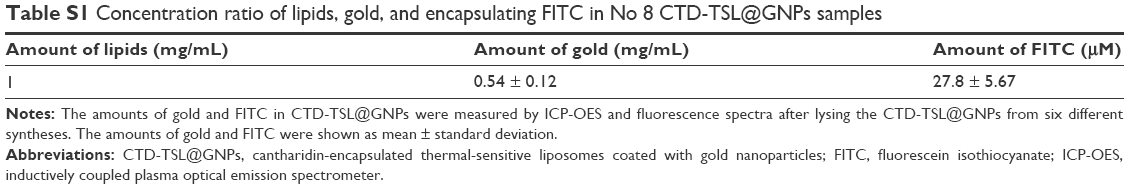 | Table S1 Concentration ratio of lipids, gold, and encapsulating FITC in No 8 CTD-TSL@GNPs samples |
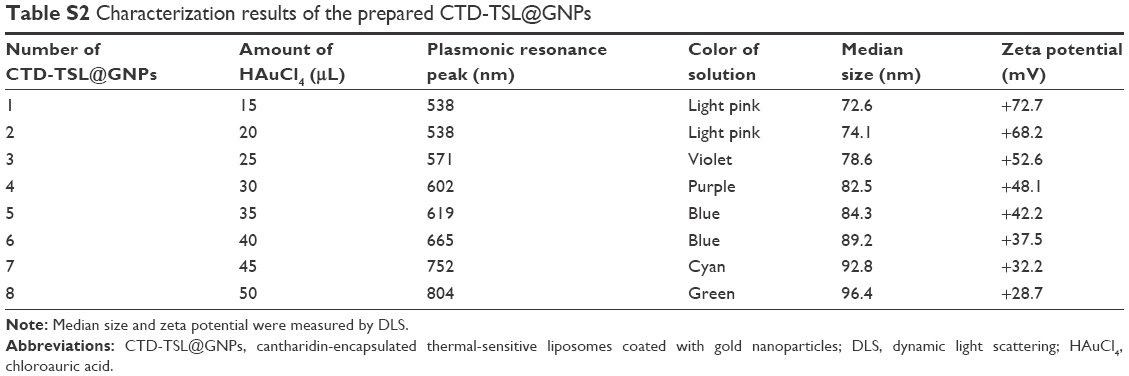 | Table S2 Characterization results of the prepared CTD-TSL@GNPs |
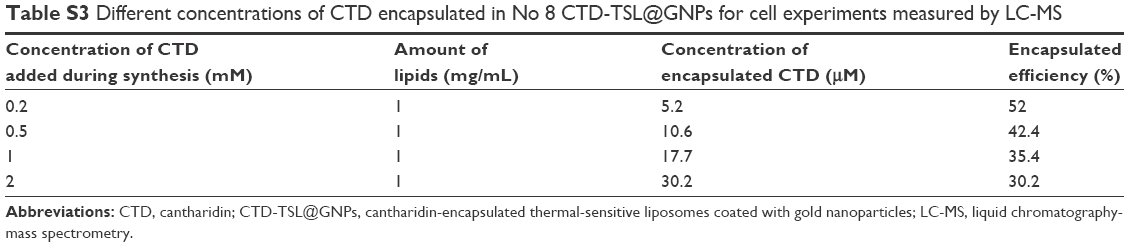 | Table S3 Different concentrations of CTD encapsulated in No 8 CTD-TSL@GNPs for cell experiments measured by LC-MS |
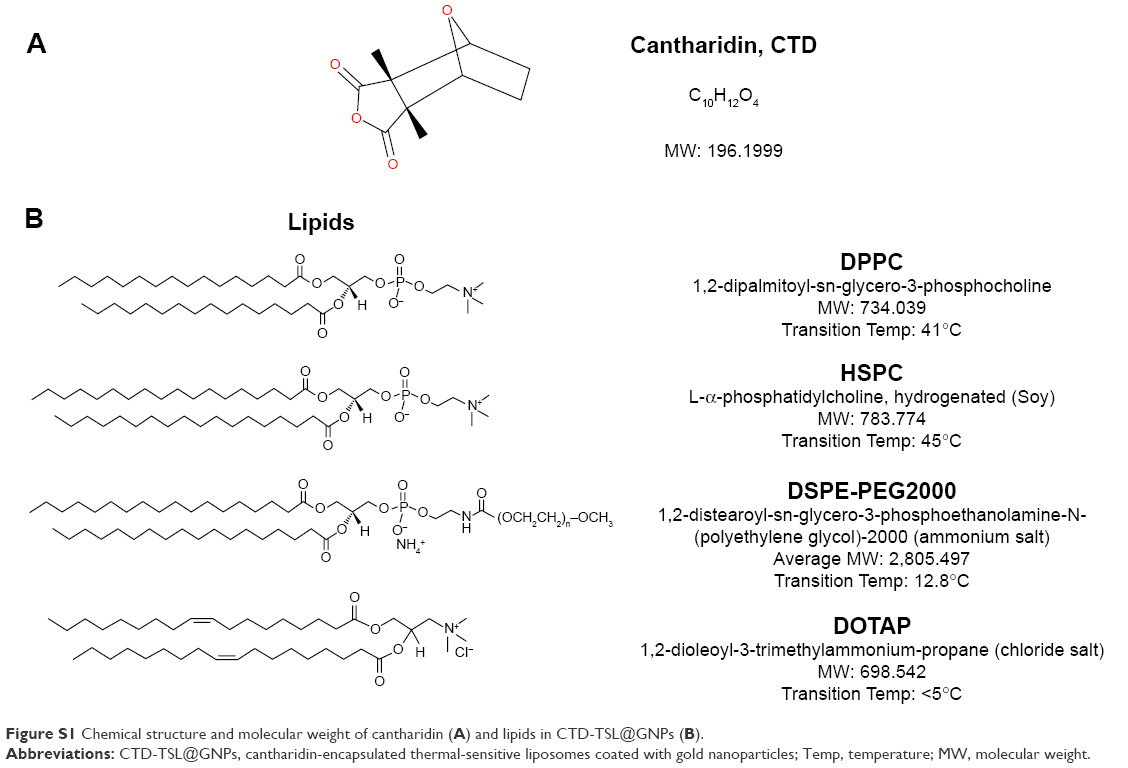 | Figure S1 Chemical structure and molecular weight of cantharidin (A) and lipids in CTD-TSL@GNPs (B). |
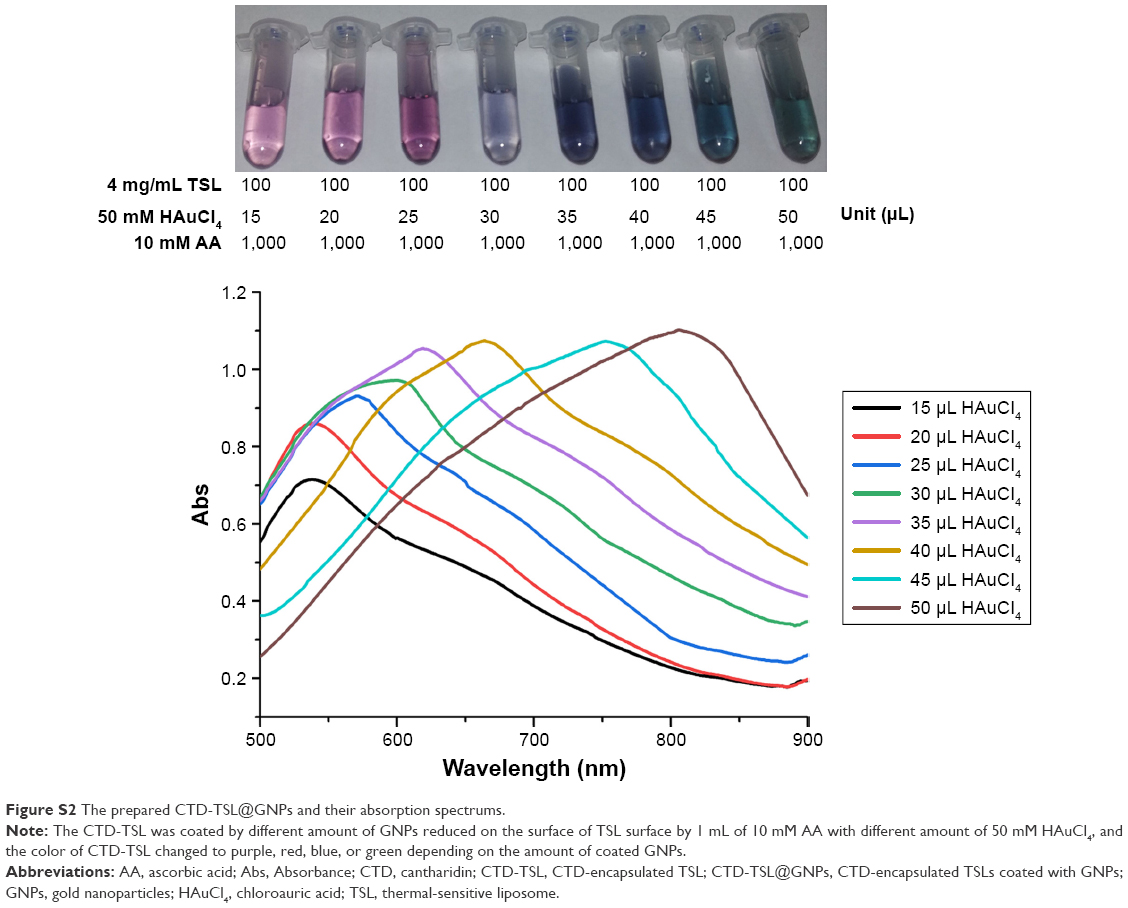 | Figure S2 The prepared CTD-TSL@GNPs and their absorption spectrums. |
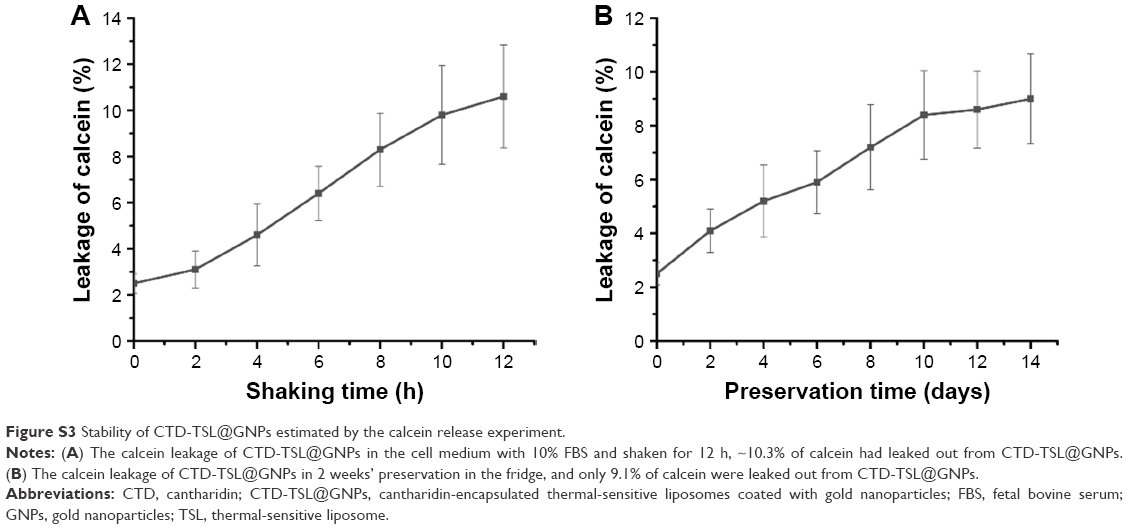 | Figure S3 Stability of CTD-TSL@GNPs estimated by the calcein release experiment. |
 © 2018 The Author(s). This work is published and licensed by Dove Medical Press Limited. The full terms of this license are available at https://www.dovepress.com/terms.php and incorporate the Creative Commons Attribution - Non Commercial (unported, v3.0) License.
By accessing the work you hereby accept the Terms. Non-commercial uses of the work are permitted without any further permission from Dove Medical Press Limited, provided the work is properly attributed. For permission for commercial use of this work, please see paragraphs 4.2 and 5 of our Terms.
© 2018 The Author(s). This work is published and licensed by Dove Medical Press Limited. The full terms of this license are available at https://www.dovepress.com/terms.php and incorporate the Creative Commons Attribution - Non Commercial (unported, v3.0) License.
By accessing the work you hereby accept the Terms. Non-commercial uses of the work are permitted without any further permission from Dove Medical Press Limited, provided the work is properly attributed. For permission for commercial use of this work, please see paragraphs 4.2 and 5 of our Terms.