")
Back to Journals » OncoTargets and Therapy » Volume 13
Cancer-Derived Transforming Growth Factor-β Modulates Tumor-Associated Macrophages in Ampullary Cancer
Authors Cheng LC , Chao YJ , Wang CY , Phan NN, Chen YL, Wang TW, Hsu HP , Lin YJ , Shan YS, Lai MD
Received 11 February 2020
Accepted for publication 14 July 2020
Published 3 August 2020 Volume 2020:13 Pages 7503—7516
DOI https://doi.org/10.2147/OTT.S246714
Checked for plagiarism Yes
Review by Single anonymous peer review
Peer reviewer comments 2
Editor who approved publication: Prof. Dr. Nicola Silvestris
Li-Chin Cheng,1 Ying-Jui Chao,2,3 Chih-Yang Wang,4– 7 Nam Nhut Phan,8 Yi-Ling Chen,9 Tzu-Wen Wang,2 Hui-Ping Hsu,2,10 Yih-Jyh Lin,2 Yan-Shen Shan,2,3 Ming-Derg Lai4,5
1Division of Colorectal Surgery, Department of Surgery, Chi-Mei Medical Center, Tainan 71004, Taiwan; 2Department of Surgery, National Cheng Kung University Hospital, College of Medicine, National Cheng Kung University, Tainan 70403, Taiwan; 3Institute of Clinical Medicine, College of Medicine, National Cheng Kung University, Tainan 70101, Taiwan; 4Department of Biochemistry and Molecular Biology, College of Medicine, National Cheng Kung University, Tainan 70101, Taiwan; 5Institute of Basic Medical Sciences, College of Medicine, National Cheng Kung University, Tainan 70101, Taiwan; 6Program for Cancer Molecular Biology and Drug Discovery, College of Medical Science and Technology, Taipei Medical University, Taipei 11031, Taiwan; 7Graduate Institute of Cancer Biology and Drug Discovery, College of Medical Science and Technology, Taipei Medical University, Taipei 11031, Taiwan; 8NTT Institute of Hi-Technology, Nguyen Tat Thanh University, Ho Chi Minh City, Vietnam; 9Senior Citizen Service Management, Chia-Nan University of Pharmacy and Science, Tainan 71710, Taiwan; 10Department of Biostatistics, Vanderbilt University Medical Center, Nashville, TN 37232, USA
Correspondence: Hui-Ping Hsu; Yan-Shen Shan Tel +886-6-2353535 Ext #5272
; +886-6-2353535 Ext #5272
Fax +886-6-2766676
; +886-6-2766676
Email [email protected]; [email protected]
Purpose: Tumor-associated macrophages (TAMs) originate from monocytes and differentiate into mature macrophages. The interaction between cancer cells and TAMs promotes tumor growth and suppresses immunosurveillance. However, this phenomenon has seldom been observed in ampullary cancer.
Patients and Methods: TAMs in ampullary cancer were investigated using immunohistochemical (IHC) staining of cancer tissues. Bioinformatic analysis of data from the Gene Expression Omnibus (GEO) database revealed transforming growth factor-beta (TGF-β) signaling in ampullary cancer. The complementary DNA microarray of cancer was compared with adjacent normal duodenum and enzyme-linked immunosorbent assay of serum was used to verify TGF-β signaling in patients. The THP-1 cell line was activated in vitro to imitate M2 TAMs. ClueGo and CluePedia software were operated to simulate TGF-β-related networks in ampullary cancer.
Results: The IHC study revealed that the majority of TAMs inside ampullary cancer were cluster of differentiation (CD)163+ cells and that the expression of mature CD68+ macrophages was correlated with advanced cancer stage. Bioinformatics analysis revealed that TGF-β and its downstream signaling were significantly upregulated. To verify our bioinformatics-derived predictions, we performed several experiments and demonstrated that increased TGF-β expression was detected in the cDNA microarray. Higher serum levels of TGF-β were correlated with fewer CD68+ and more inducible nitric oxide synthase macrophages in ampullary cancer. Treatment with TGF-β induced modulation of THP-1-derived macrophages.
Conclusion: The present study demonstrates that TGF-β modulates macrophage activity in ampullary cancer. Targeting TGF-β could be an approach to activating immunosurveillance.
Keywords: ampullary cancer, tumor-associated macrophages, transforming growth factor-beta, bioinformatics
Plain Language Summary
The present study investigates the interaction between ampullary cancer cells and macrophages. Transforming growth factor-beta from cancer cells induces monocytes to become mature macrophages.
Introduction
The activation of oncogenes and the inhibition of tumor suppressors are critical mechanisms in cancer progression. Furthermore, the tumor immune microenvironment plays a vital role.1 Several types of immune cells can infiltrate a cancer mass, with macrophages being the predominant type. Crosstalk between cancer cells and tumor-associated macrophages (TAMs) is reciprocal and mutually beneficial. Cancer cells secrete chemokines that attract monocytes to migrate into the tumor mass, and cancer-derived chemokines promote the proliferation, maturation, and differentiation of monocytes into TAMs. Inside a cancer mass, TAMs produce angiogenetic factors that promote angiogenesis and secrete cytokines that suppress immunosurveillance.2 Monocytes from circulating peripheral blood differentiate into two types of mature macrophages: M1 and M2.3 M1 and M2 macrophages secrete different cytokines, express distinct surface receptors, and exhibit opposing activities.4 Microbial stimuli activate T helper 1 cells (Th1) and elicit the differentiation of monocytes into M1 macrophages. Cancerous tumors secrete macrophage colony-stimulating factor (M-CSF, gene CSF1), which induces the migration of monocytes from the bone marrow into the tumor mass. Cancer-derived cytokines, such as interleukin (IL)-10 (gene IL10), induce the differentiation of monocytes into M2 macrophages.5 Other cancer-derived cytokines should be considered in the search for candidates to serve as targets for cancer therapy. High-throughput technology for detecting global changes in gene expression is a crucial experimental paradigm with which to study functional genomics and systemic biology. The expression of thousands of genes can be measured in a single experiment using this technique. Multiple-RNA-sequencing and microarray data sets are available in the Gene Expression Omnibus (GEO) of the National Center for Biotechnology Information (NCBI).6 We collected gene expression data from the periampullary data set GSE39409 and conducted MetaCore analysis, which identified transforming growth factor-beta (TGF-β, gene TGFB1) as the signaling pathway in ampullary cancer. TGF-β is a cytokine secreted by cancer cells. A low dose of TGF-β in a tumor microenvironment suppresses cancer growth in the early phase of carcinogenesis; however, as cancer progresses, a high level of TGF-β regulates chemotaxis and promotes macrophage differentiation,7,8 cancer invasion, and metastasis.9 The synergistic effect of TGF-β and IL-10 activates M2 macrophages.10 However, the role of TGF-β in ampullary cancer is unclear.
Ampullary cancer, the second most common periampullary cancer, has a 5-year cancer-specific survival rate of approximately 50%.11,12 Radical resection is the standard treatment for ampullary cancer; however, adjuvant chemotherapy is ineffective.13 Therefore, alternative treatment modalities should be developed. Studies have reported TGF-α expression,14,15 downstream genetic mutation of TGFB1 and SMAD4,16 and TGF-β signaling dysregulation in ampullary cancer.17 Our previous study indicated that the expression of osteopontin (OPN, gene SPP1) in infiltrating TAMs was a predictor of worse survival in patients with a large ampullary cancer. The expression of multiple types of cytokines, such as TGF-β, macrophage migration inhibitory factor (MIF), and OPN, was detected in ampullary cells.18 Therefore, we hypothesized that TGF-β expression in ampullary cancer promotes the maturation of monocytes into TAMs. Bioinformatical analyses, clinical studies, and in vitro systems were employed to investigate this hypothesis.
Materials and Methods
Patient Collection and Follow-Up
From January 2002 to December 2010, 50 patients with ampullary cancer who received radical resection at National Cheng Kung University Hospital (NCKUH) were enrolled. Clinicopathological information and pathological reports were obtained from a retrospective chart review. The pathological stages were classified according to the tumor, node, and metastasis staging system (seventh edition) of the American Joint Committee on Cancer.19 Patients were followed up every 3 months. Annual abdominal sonography, blood sampling, and optional abdominal computed tomography examinations were performed. The study was approved by the Institutional Review Board of NCKUH (IRB no: A-ER-101-220) and complied with the Declaration of Helsinki. Written informed consent was collected for all enrolled patients. Formalin-fixed paraffin-embedded (FFPE) tumor sections and fresh serum were obtained from the Human Biobank of the Clinical Medicine Research Center in NCKUH.
Immunohistochemistry Staining
The FFPE sections were deparaffinized in xylene and rehydrated in graded alcohol. For heat-induced epitope retrieval, the sections were immersed in a target retrieval solution (Dako, Carpinteria, CA, USA) and heated under pressure for 10 min. For immunohistochemistry (IHC) staining, the sections were incubated overnight with a primary monoclonal antibody at 4 °C (cluster of differentiation [CD]68, DAKO; CD163, Novocastra, Benton Lane, UK; inducible nitric oxide synthase [iNOS], R&D Systems, Minneapolis, MN, USA). The sections were incubated the following day with goat antimouse immunoglobulins conjugated with a peroxidase-labeled polymer (EnVision system, Dako). The final color was stained with 3-amino-9-ethyl carbazole (Zymed, San Francisco, CA, USA). The sections were counterstained using Mayer’s hematoxylin and then mounted. Sections were prepared as negative controls without primary or secondary antibodies. TAMs with cytoplasmic staining of the targeted marker were counted. The numbers of positively stained macrophages in three different high-power fields (HPFs, 400× magnification) were counted manually and summed. CD68+ and CD163+ macrophages were grouped by 200 cells in the three HPFs. The iNOS+ macrophages were categorized according to whether they had no positive-staining cell or at least one positive cell in the three HPFs. Each lesion was observed and scored by the same researcher.
Bioinformatics Analysis
Gene expression data regarding periampullary cancer were collected from the GEO database (http://www.ncbi.nlm.nih.gov/geo/). Raw data from the GSE39409 dataset were corrected and normalized according to the robust multichip average (RMA). The RMA signal was computed for gene-level probe set summaries using the Affymetrix Expression Console (version 1.3) (Affymetrix, Santa Clara, CA, USA) and R (version 3.2.0) (www.r-project.org). MetaCore (GeneGo, Inc., St. Joseph, MI, USA) was used to explore key signaling pathways regulated in ampullary cancer, and molecular functions and the mapping pathway of gene ontology (GO) were analyzed. MetaCore was also used to develop biological networks from input gene sets and list biological processes associated with each network. The top 10% of upregulated genes of ampullary cancer were uploaded into MetaCore and compared with the genes of other periampullary cancers. Genes with a massive fold change and a P value of less than 0.05 in a two-tailed t-test were considered significant. The top 10% of significantly high-expression genes were uploaded to ClueGo (version 2.3.3) and CluePedia (version 1.3.3) for ontology analysis.20,21 Both ClueGo and CluePedia were operated using Cytoscape software version 3.5.1. The default settings were retained for GO terms and pathways. The organic layout was selected to optimize visualization. The nodes were drawn according to the enrichment of genes in GO terms and pathways. The colors of the nodes were randomly selected from the default settings. GO terms and their associated genes were the same color. The correlations between genes were calculated according to the default settings using Pearson correlations, Spearman’s rank tests, distance correlations, and maximal information coefficients. Related genes and pathways were joined with lines.
Enzyme-Linked Immunosorbent Assay
A commercially available kit (R&D Systems) was used to conduct an enzyme-linked immunosorbent assay (ELISA) in accordance with the manufacturer’s instructions. Standard recombinant human TGF-β or serum samples were added to the assay plate with an attached capture anti–TGF-β antibody. After incubation with a detected primary anti–TGF-β antibody and a secondary antibody with a peroxidase-labeling conjugate, a peroxidase substrate was added. The color reaction was stopped through the addition of a stop solution. Absorbance was measured at 450 nm.
Cell Lines, Chemicals, and Conditioned Medium
The human ampullary cancer cell line TGBC-18-TKB was purchased from the RIKEN Bioresource Center (Tsukuba, Ibaraki, Japan). The normal epithelial cell line of the small intestine FHs 74 Int was obtained from the American Type Culture Collection (Manassas, VA, USA). Cell line importation complied with applicable national laws and regulations and was approved by the Centers for Disease Control, ROC. The monocytic cell line THP-1 was obtained from the Bioresource Collection and Research Center (Hsinchu, Taiwan). The study was approved by the Institutional Review Board of NCKUH (IRB no: A-ER-101-220). Fresh cancer samples were collected from patients with ampullary cancer after they have signed the informed consent. Patient data was deidentified. Cancer tissues were finely minced and placed into a 24-well cell culture. The cells were subcultured repeatedly for more than three passages, which progressively killed stroma cells. All experiments were performed within 3–10 passages. All cancer cells were cultured in Dulbecco’s modified Eagle’s medium with 10% heat-inactivated fetal bovine serum (FBS). The THP-1 monocytes were maintained in a RPMI-1640 medium with 10% FBS. FHs 74 Int cells were cultured in Hybri-Care medium with 10% FBS and 30 ng/mL epidermal growth factor. All the cells were maintained at 37 °C in a 5% CO2 and humidified atmosphere.
To collect the conditioned medium (CM), 2 × 10⁶ cells were seeded in a 10-cm dish with a regular medium and incubated overnight. The medium was then replaced with a serum-free medium and incubated for two additional days. The conditioned medium was then collected and passed through a 0.22-μm filter to remove cellular debris.
Reverse Transcription–Polymerase Chain Reaction
Total RNA was extracted from the cultured cells using an RNeasy Mini kit (Qiagen, Hilden, Germany) in accordance with the manufacturer’s instructions. Single-stranded complementary DNA (cDNA) was synthesized from 2 μg of total RNA by using M-MuLV reverse transcriptase (Roche, Basel, Switzerland) and oligo-dT random primers. The cDNA was amplified using primers for specific genes (Supplementary Table 1). A PCR was performed under the following conditions: denaturing for 30 s at 95 °C, annealing for 30 s at adequate temperatures (52–60 °C), and extending for 30–60 s at 72 °C, for 25–45 cycles in a commercial PCR system. PCR products were visualized after electrophoresis on a 1.9% agarose gel and then stained with Safe DNA gel stain (Invitrogen, Carlsbad, CA, USA). We quantified the bands on the gels using densitometric analysis and normalized according to the β-actin band. The results were compared with those from the control group.
Induction of M2 Macrophage and Analysis Using Flow Cytometry
A total of 2 × 10⁶ THP-1 cells were seeded in a 10-cm dish and activated by adding phorbol 12-myristate 13-acetate (PMA, Sigma-Aldrich, St. Louis, MO, USA) at a concentration of 200 nM for 72 h. The differentiation of PMA-treated cells was enhanced after the initial 3-day stimulation then removing the PMA-containing medium .22 The PMA-differentiated THP-1 cells were collected and plated in a six-well plate at a concentration of 4 x 10⁵ cells per well; 2 mL of medium was added to each well. The cells were subsequently cultured under the indicated conditions for 3 days. Activated THP-1 cells were then collected for flow cytometry and reverse transcription–polymerase chain reaction (RT-PCR).
To analyze macrophages, 5 x 10⁵ cells were collected and incubated with commercially available anti-CD163 antibodies (BD Biosciences) at 4 °C overnight. After incubation, 1 mL of staining buffer was added, and the cells were analyzed using flow cytometry (BD Biosciences). Data analysis was performed using WinMDI 2.9.
Statistical Analysis
All statistical analyses were performed using SPSS version 17.0 (SPSS Institute, Chicago, IL, USA). Univariate analysis between categorical variables was performed using the chi-square test or Fisher’s exact test. Continuous variables were compared using the nonparametric Wilcoxon rank-sum test. A P value of < 0.05 indicated statistical significance.
Results
Increased Number of M2 TAMs in Ampullary Cancer
TAMs differ from immature monocytes, and TAM subtypes have various functions. We used IHC staining to identify three types of macrophages in ampullary cancer specimens (Figure 1). CD68+ cells were represented as mature macrophages, including M1 and M2 (Figure 1A). CD163 was expressed by mature M2 macrophages (Figure 1B), and iNOS was an important intracellular component of M1-differentiated macrophages with cytotoxic ability (Figure 1C). All cancer samples were infiltrated with CD68+ and CD163+ cells. Most TAMs in the stroma of ampullary cancer were CD68+ or CD163+ cells (Figure 1D). Patients with ampullary cancer at an advanced tumor or cancer stage exhibited a higher number of infiltrating CD68+ or CD163+ cells (Tables 1 and 2). A small number of iNOS+ cells were detected in 20 of the 30 cancer samples. The expression of iNOS+ cells was not correlated with tumor or cancer stage (Table 3).
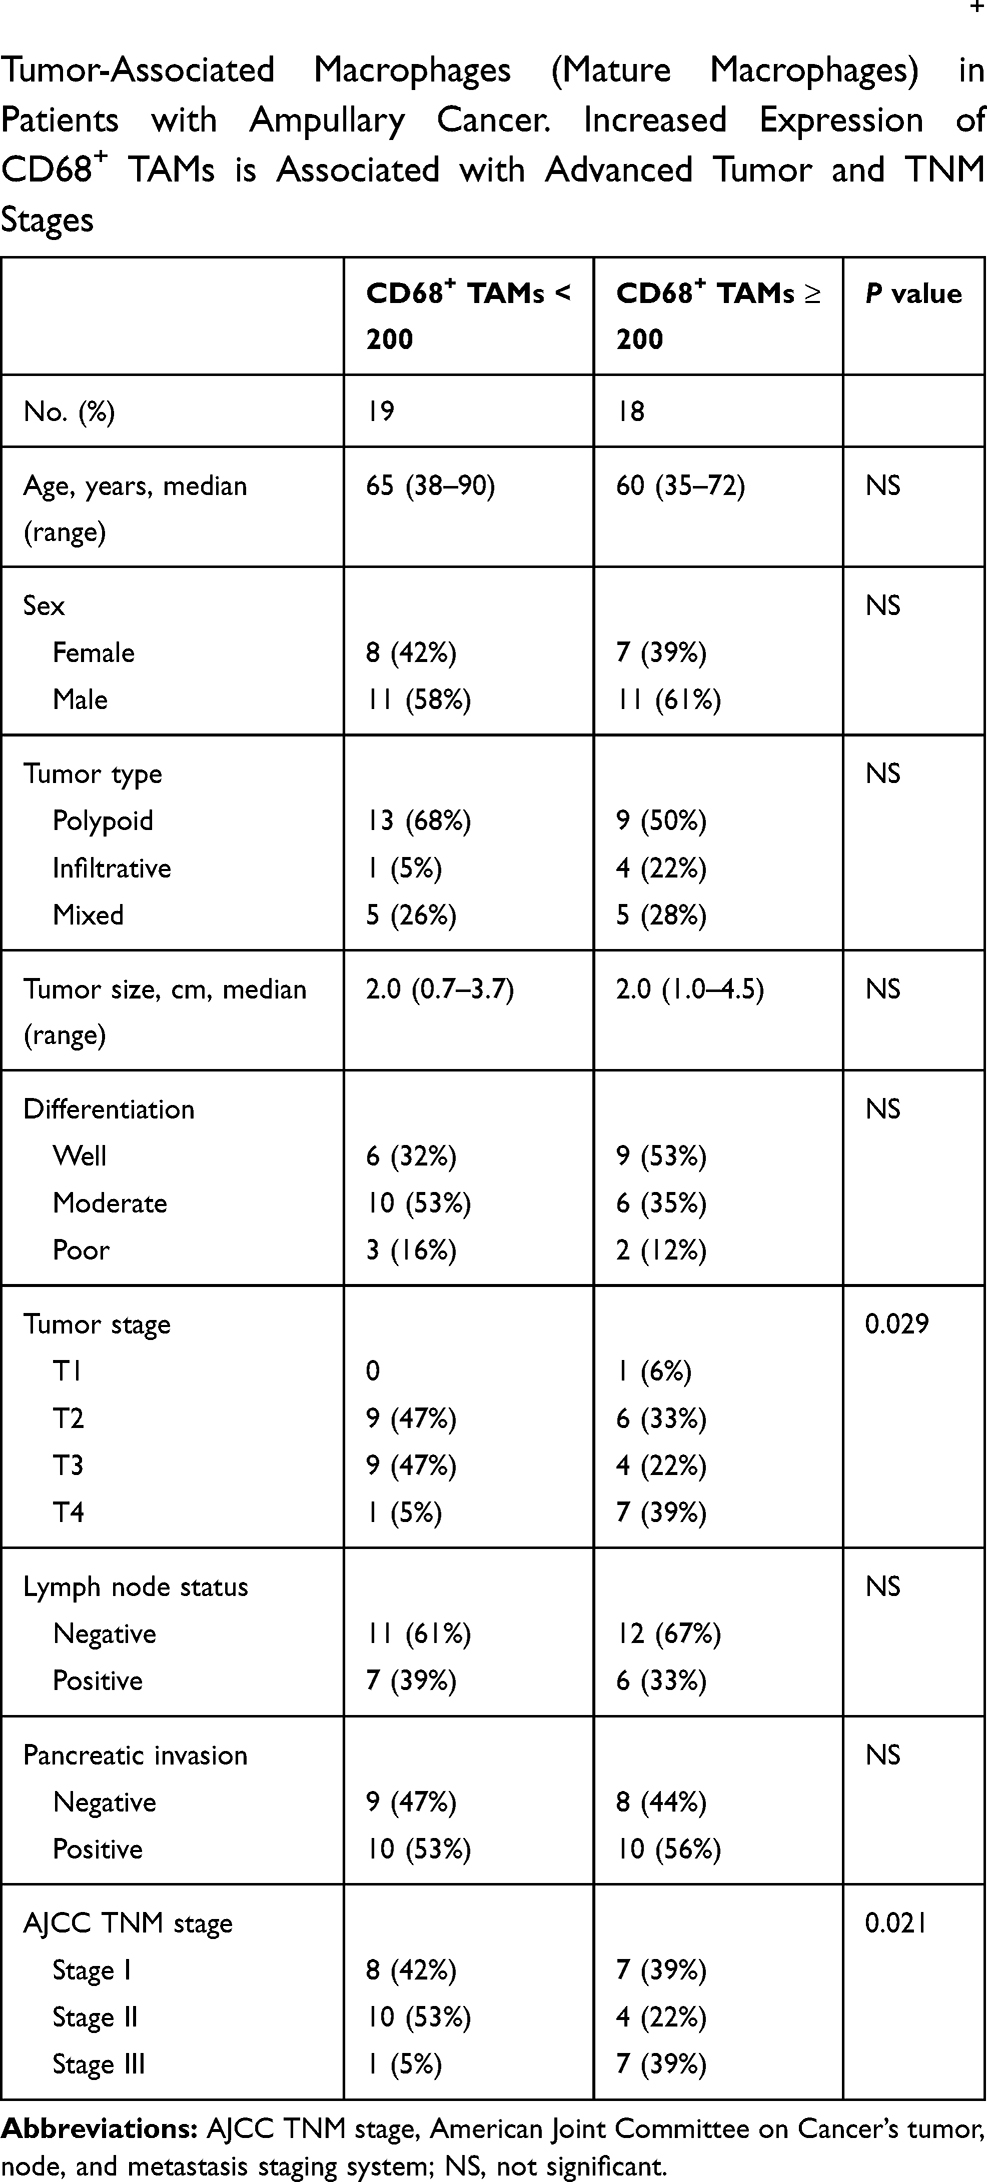 |
Table 1 Correlation of Histopathological Factors and CD68+ Tumor-Associated Macrophages (Mature Macrophages) in Patients with Ampullary Cancer. Increased Expression of CD68+ TAMs is Associated with Advanced Tumor and TNM Stages |
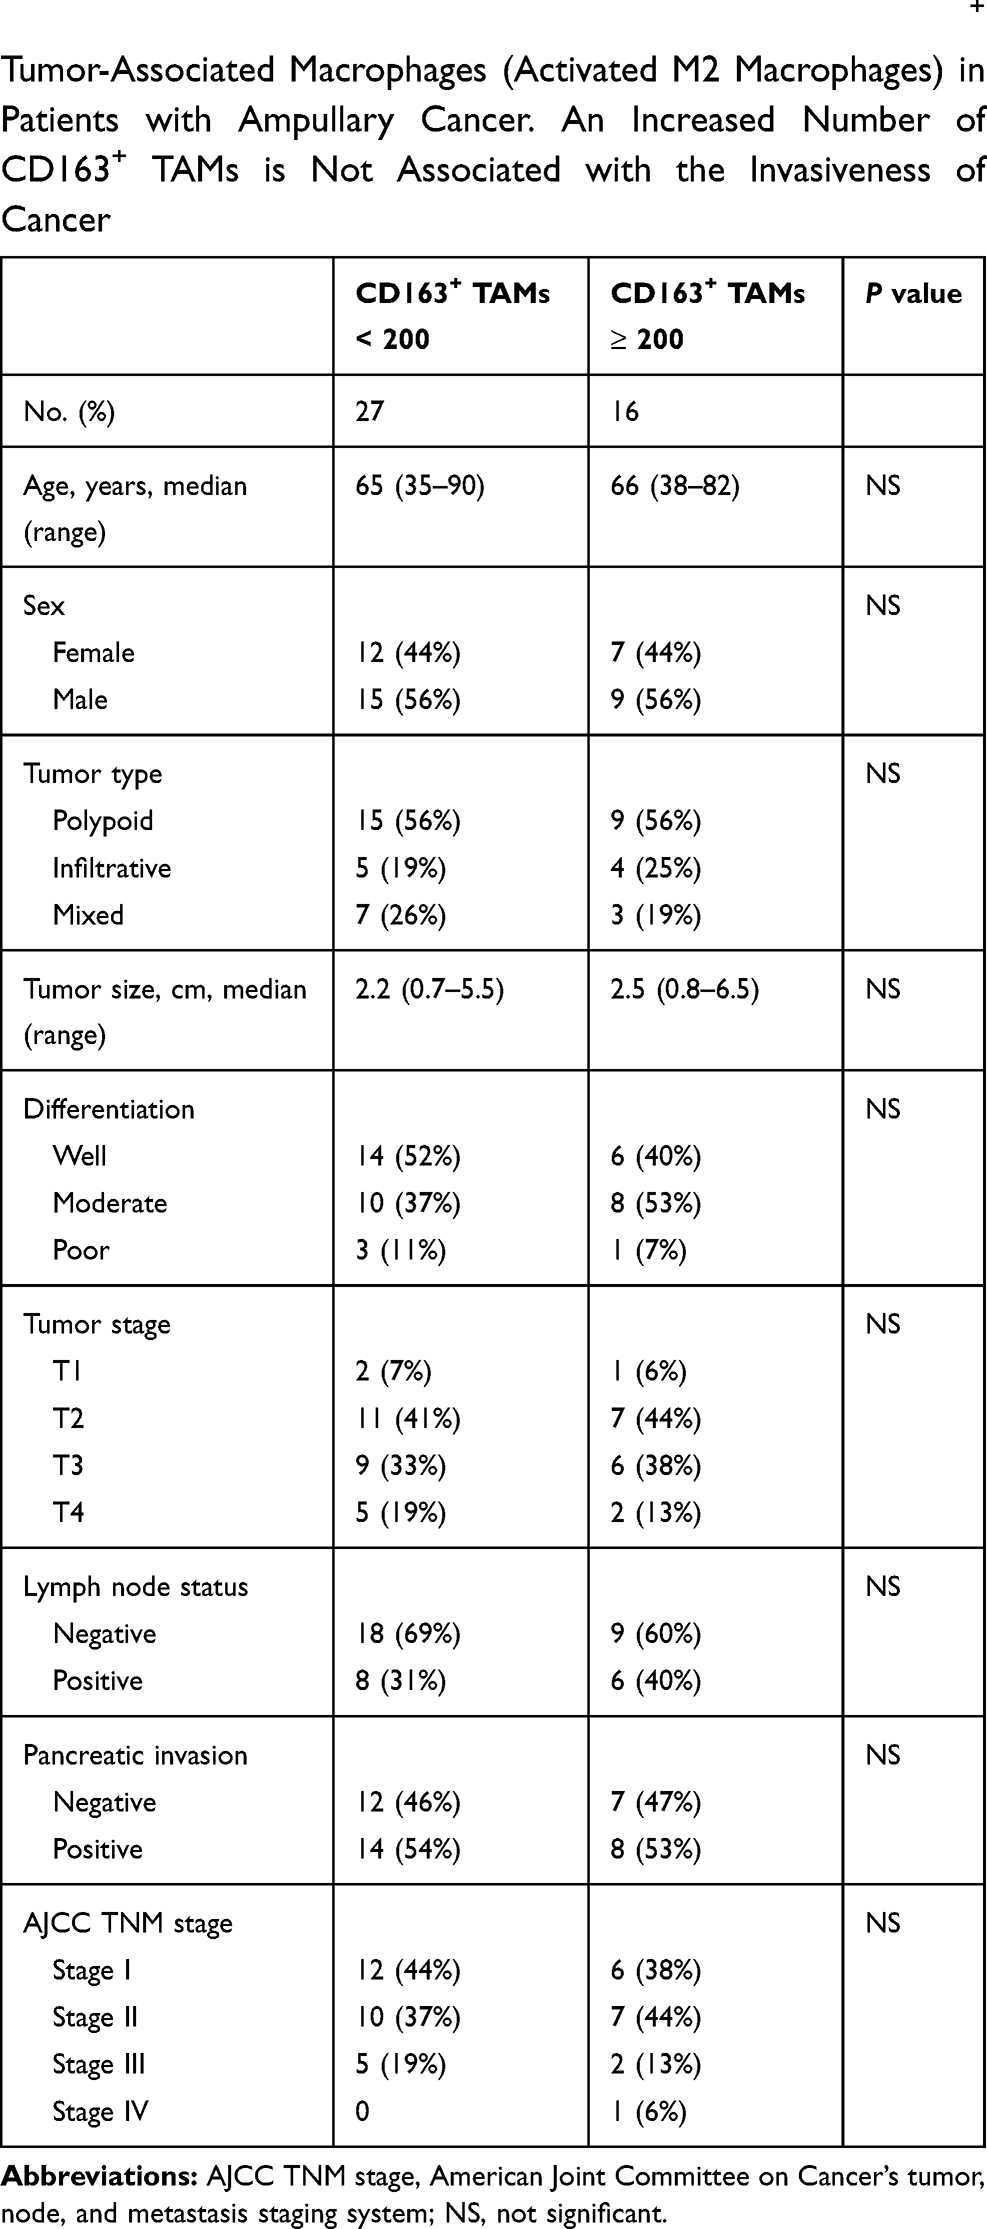 |
Table 2 Correlation of Histopathological Factors and CD163+ Tumor-Associated Macrophages (Activated M2 Macrophages) in Patients with Ampullary Cancer. An Increased Number of CD163+ TAMs is Not Associated with the Invasiveness of Cancer |
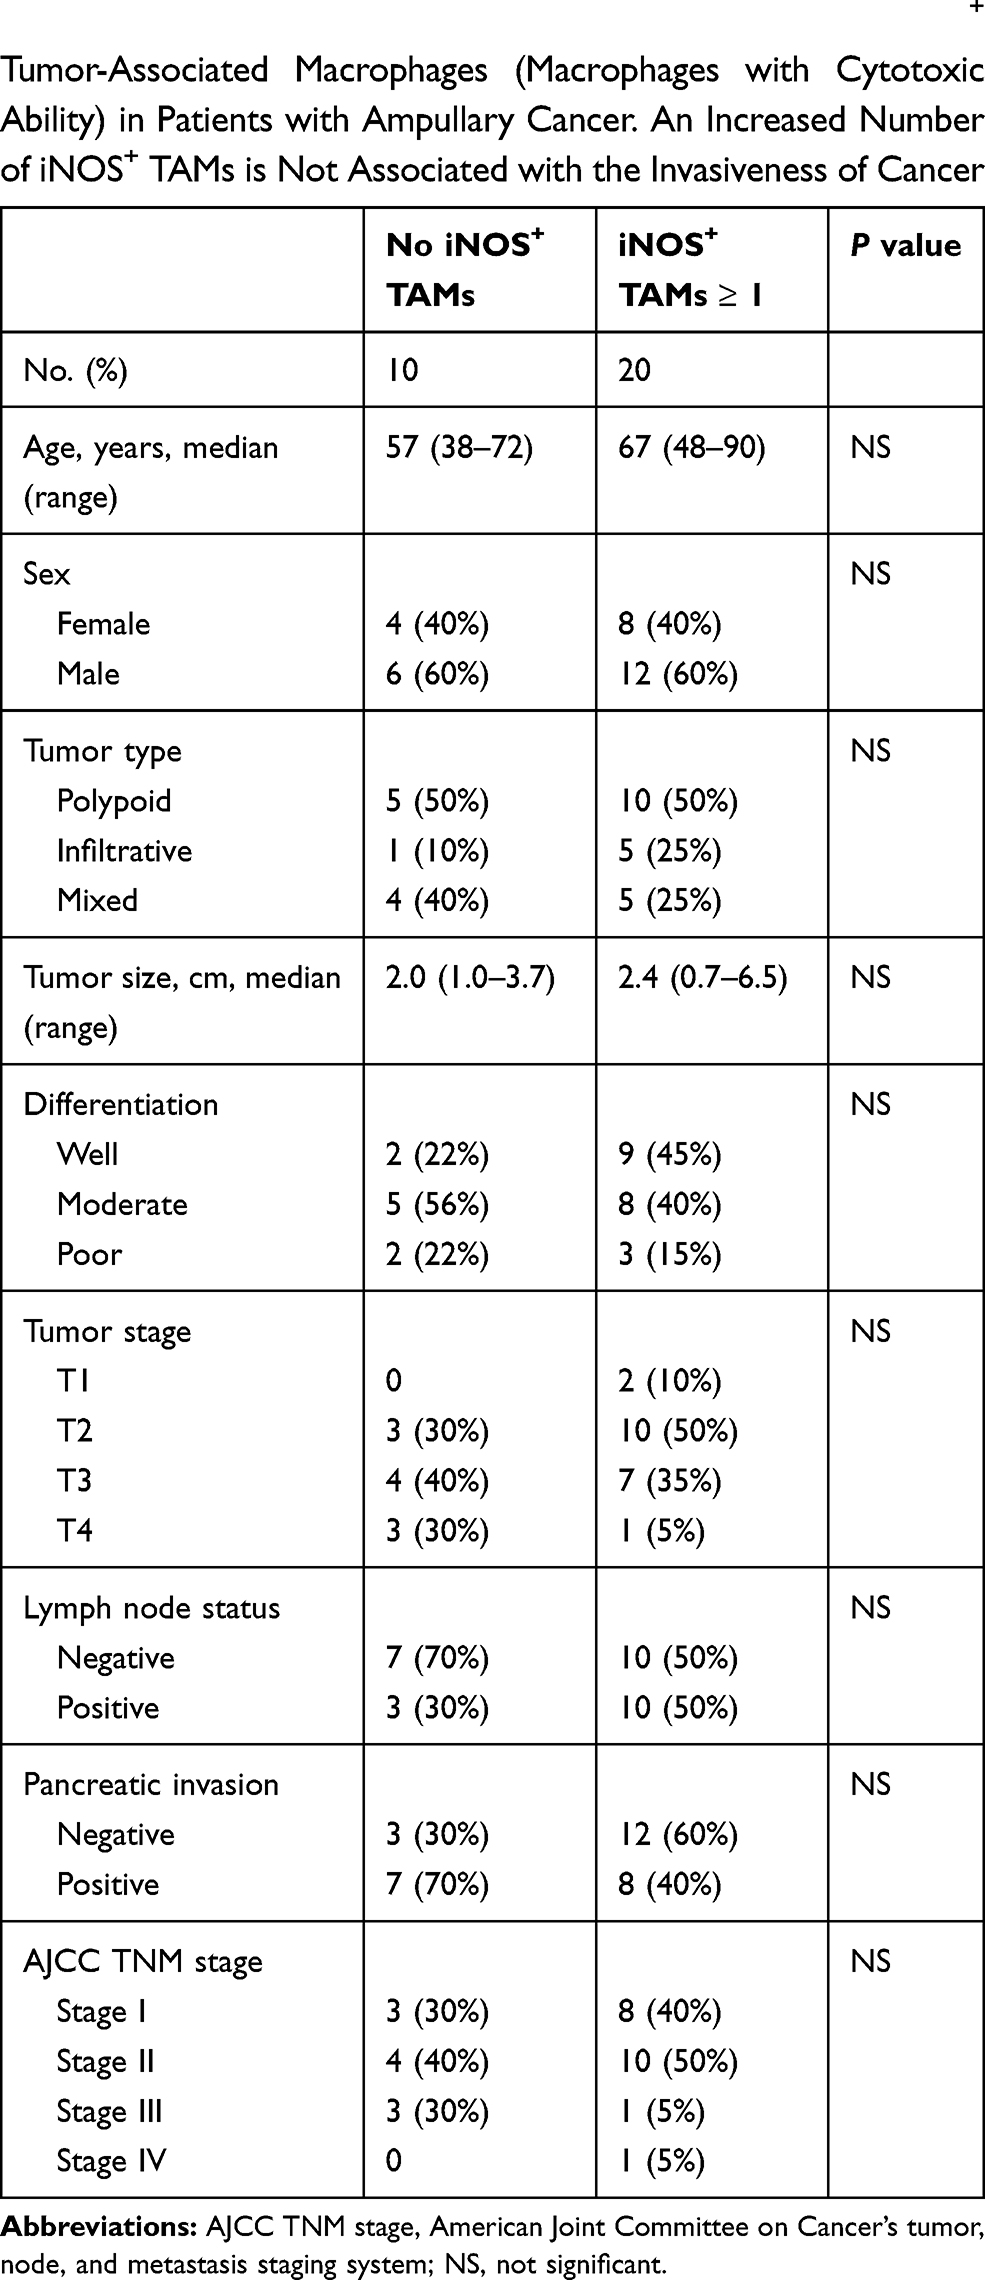 |
Table 3 Correlation of Histopathological Factors and iNOS+ Tumor-Associated Macrophages (Macrophages with Cytotoxic Ability) in Patients with Ampullary Cancer. An Increased Number of iNOS+ TAMs is Not Associated with the Invasiveness of Cancer |
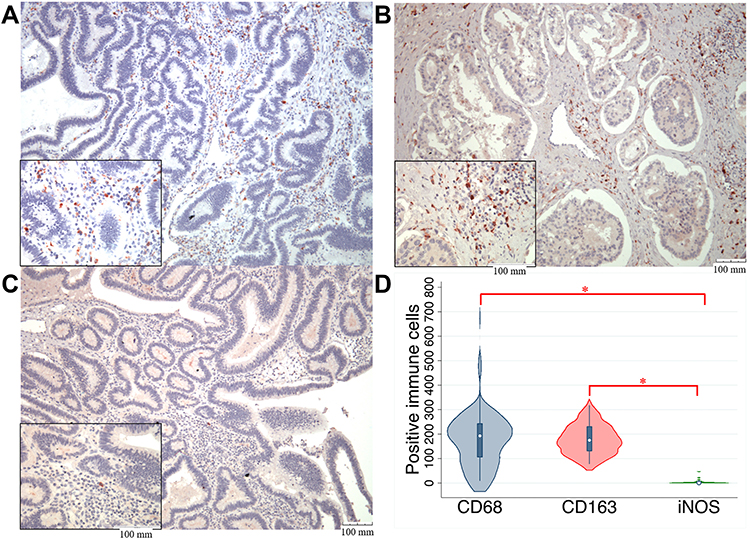 |
Figure 1 IHC results regarding the expression of macrophage markers in ampullary cancer specimens.Notes: (A) Expression of CD68+ macrophages (mature macrophages). (B) Expression of CD163+ macrophages (activated M2 macrophages). (C) Expression of M1 macrophages with cytotoxicity (iNOS expression). The magnification of the main photos of (A–C) is ×100, and that of the small photos over the lower-left quadrate is ×400. The scale bar is displayed over the lower-right corner. (D) The quantitative results of (A–C) are presented as the numbers of macrophages with different markers in ampullary cancer. Three photos with ×400 magnification are taken in each tumor sample, and the total number of macrophages in these three photos are counted manually. Most mature macrophages express CD163. *P < 0.05Abbreviations: CD163, cluster of differentiation 163; CD68, cluster of differentiation 68; IHC, immunohistochemistry; iNOS, inducible nitric oxide synthase. |
Identifying TGF-β Receptor Pathways in Ampullary Cancer
We used MetaCore GeneGo to identify pathways relevant to macrophages and ampullary cancer by investigating the GSE39409 dataset of patients with periampullary cancer.23 Differentially expressed genes associated with ampullary cancer were assessed. Gene list details are presented in Supplementary Table 2. The top 10% of genes in terms of level of expression in patients with ampullary cancer were uploaded to MetaCore. Pathway maps associated with immune response are displayed in Figure 2. The TGF-β receptor pathways (P = 4.518 × 10⁻¹⁰, false discovery rate [FDR] = 1.512 × 10⁻⁸) and the TGF-β-dependent pathway, which are involved in the induction of epithelial–mesenchymal transition through RhoA, PI3K, and ILK (P = 6.853 × 10⁻¹⁰ and FDR = 2.193 × 10⁻⁸), were significantly upregulated in patients with ampullary cancer. We further investigated the expression of TGF-β in the published high-throughput dataset (GSE39409). We analyzed data of 14 ampullary cancers using a heatmap with the GENE-E package in an R environment, as we previously described.24 The findings demonstrated that transforming growth factor-beta–induced (TGFBI) gene ranked 815 of 44,990 genes in the 14 ampullary tumors, which is the highest 1.81% of genes in ampullary tumors (Figure 3). TGFBI gene is downstream of TGF-β signaling and is upregulated in several kinds of human cancer.
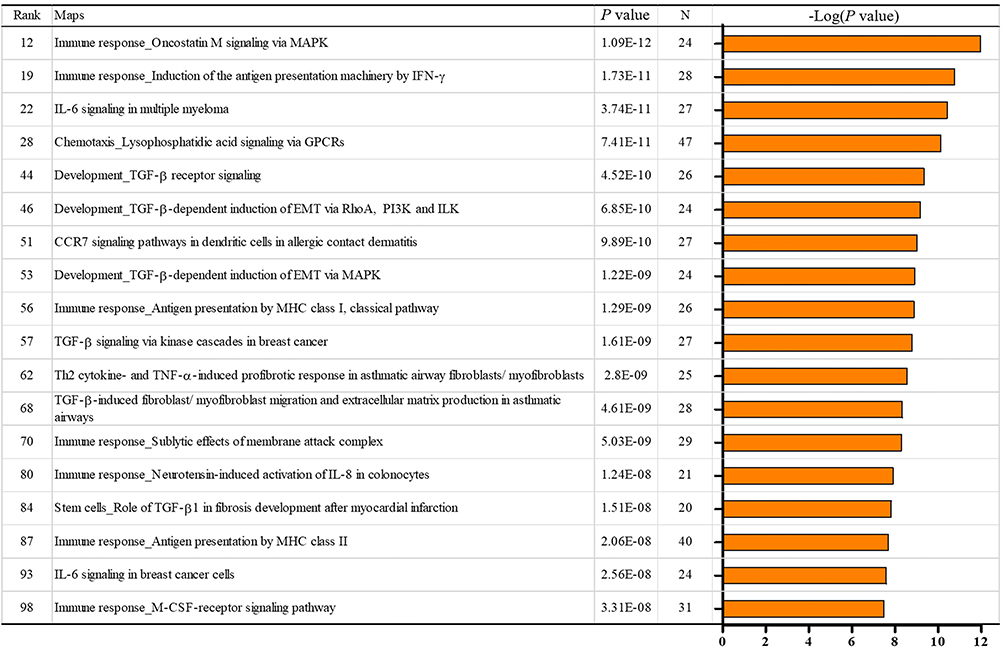 |
Figure 2 MetaCore map analysis of ampullary cancer in the NCBI GEO GSE39409 data set.Notes: Immune-related pathways in the top 100 interacting maps are selected. TGF-β is related to 6 of 18 pathways, including pathways with rank 44, 46, 53, 57, 68, and 84.Abbreviations: CCR7, CC-chemokine receptor 7; EMT, epithelial-mesenchymal transition; GPCR, G protein-coupled receptor; IFN-γ, interferon-gamma; IL-6, interleukin-6; IL-8, interleukin-8; ILK, integrin-linked kinase; MAPK, mitogen-activated protein kinase; M-CSF, macrophage colony-stimulating factor; MHC, major histocompatibility complex; PI3K, phosphatidylinositide 3-kinase; TGF-β, transformin g growth factor beta; Th2, T helper 2; TNF-α, tumor necrosis factor-alpha. |
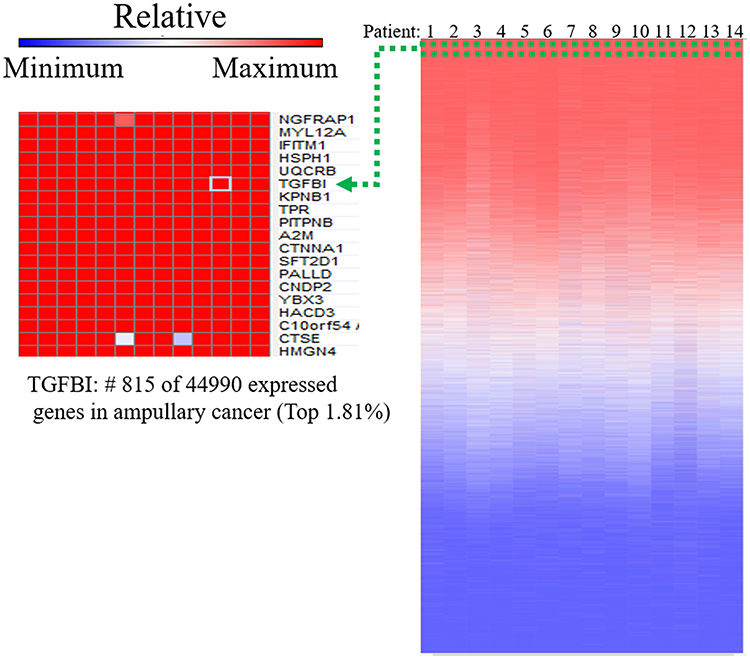 |
Figure 3 Upregulated genes of ampullary cancer in the NCBI GEO GSE39409 data set.Notes: Analysis of published microarray data is performed using the Affymetrix U133 Plus 2.0 genome array. The heatmap illustrates gene rankings is ordered from highest to lowest raw expression values across different patient samples. The TGFBI gene is in the top 1.81% among the 44,990 expressed genes.Abbreviations: A2M, alpha-2-macroglobulin; C10orf54, chromosome 10 open reading frame 54; CNDP2, carnosine dipeptidase 2; CTNNA1, catenin alpha 1; CTSE, cathepsin E; HACD3, 3-hydroxyacyl-CoA dehydratase 3; HMGN4, high mobility group nucleosomal binding domain 4; HSPH1, heat shock protein family H member 1; IFITM1, interferon induced transmembrane protein 1; KPNB1, karyopherin subunit beta 1; MYL12A, myosin light chain 12A; NGFRAP1, nerve growth factor receptor-associated protein 1; PALLD, palladin; PITPNB, phosphatidylinositol transfer protein beta; SFT2D1, SFT2 domain containing 1; TGFBI, transforming growth factor beta induced; TPR, translocated promoter region, nuclear basket protein; UQCRB, ubiquinol-cytochrome C reductase binding protein; YBX3, Y-box binding protein 3. |
Induction of M2 Macrophage Function by the Cancer-Derived Conditioned Medium
To mimic the paracrine effect from cancer cells on TAMs, we collected conditioned medium during the culturing of cancer cells. THP-1 cells were activated by PMA and treated with the conditioned medium for 3 days. Differentiated M2 macrophages were identified on the basis of cytokine or receptor expression, including expression of TGF-β, C-C motif ligand (CCL)18, CD163, OPN, CCL22, and IL-10.4 Gene expression was detected using RT-PCR (Figure 4A). The FHs 74 Int cells were derived from normal epithelial cells of the small intestine. The stimulation effect of the conditioned medium obtained from the FHs 74 Int cell culture was weak. The primary culture cells from ampullary neoplasm at different stages (adenoma, stage IA, stage IB, and stage IIB) induced the expression of M2 macrophage–associated genes. The ampullary cancer cell line, TGBC-18 TKB, also induced the expression of M2 macrophage–associated genes. The expressions of CCL18, CCL22, and IL-10 increased slightly after stimulation with the conditioned media from different types of ampullary cancer. Increased expression of CD163 and OPN in THP1 cells were stimulated by the conditioned medium from cancer cells but not from the FHs 74 Int cells. The expression of TGF-β in THP-1-derived macrophages did not exhibit obvious changes (Figure 4B).
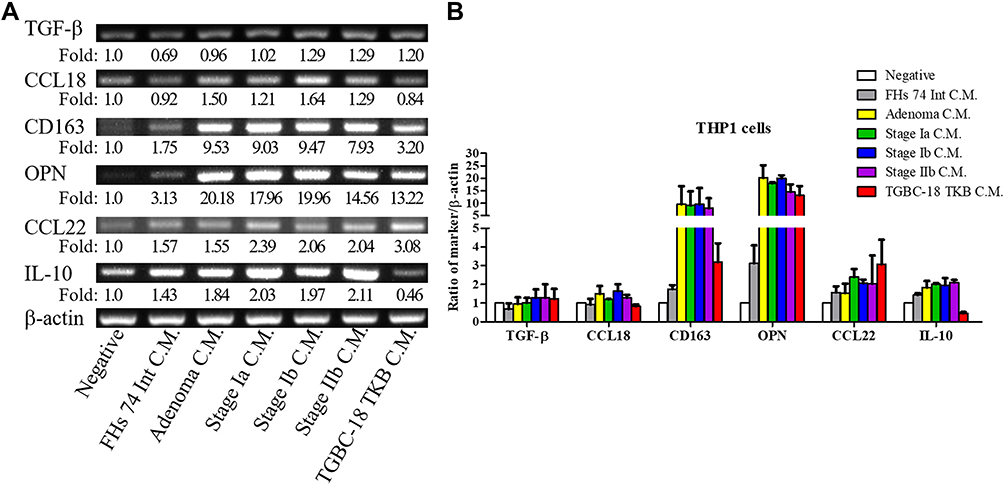 |
Figure 4 Expression of macrophage-associated cytokines in THP-1 cells.Notes: (A) THP-1 cells are activated using PMA for 3 days and then treated with conditioned medium from different cells for 3 days. The mRNA is purified, and the expression of macrophage-associated cytokines (OPN, IL-10, CCL18, CD163, and CCL22) is assessed using RT-PCR (n = 2). The negative control of THP-1 is treated with RPMI-1640 medium and 1% FBS. (B) Semiquantitative analysis of cDNA is performed, and β-actin is served as the loading control. The feature of M2 macrophages in THP-1 cells is increased after stimulation with conditioned medium from ampullary cancer cells. The experiments are repeated twice because of the scarcity of conditioned medium from primary culture cells. FHs 74 Int, a cell line from normal epithelial cells of the small intestine. AC01, primary culture cells from ampullary adenoma. AC02, primary culture cells from stage Ia ampullary cancer. AC03, primary culture cells from stage Ib ampullary cancer. AC04, primary culture cells from stage IIb ampullary cancer. TGBC-18-TKB, cell line from ampullary cancer.Abbreviations: CCL18, C-C motif ligand 18; CCL22, C-C motif ligand 22; CD163, cluster of differentiation 163; C.M, conditioned medium; FBS, fetal bovine serum; IL-10, interleukin-10; OPN, osteopontin; PMA, phorbol 12-myristate 13-acetate; RPMI, Roswell Park Memorial Institute; RT-PCR, reverse transcription-polymerase chain reaction. |
Expression of Macrophage-Associated Cytokines in Ampullary Cancer
Monocytes from bone marrow are stimulated by cancer-derived cytokines. M-CSF is a powerful chemokine for recruiting monocytes.5 IL-10 induces differentiation of M2 macrophages, which initiates immunoregulation.4 TGF-β enhances the immunosuppressive ability of IL-10 in tumor-bearing mice.25 We examined the expression of these cytokines in ampullary cancer specimens. A cDNA microarray was used to compare ampullary cancer specimens and normal duodenum tissues from five patients (Figure 5A). The expression of IL10 and CSF1 genes was inconsistent among the patients. The cDNA of the TGFB1 gene increased in all five patients, with a median log2 cancer/normal ratio of 0.319 (Supplementary Table 3). We then used ELISA to detect the serum level of TGF-β. We enrolled 3 patients with benign ampullary hyperplasia, 46 patients with ampullary cancer, and 15 healthy volunteers. The median concentration of serum TGF-β in patients with benign tumors was 14 ng/mL, with a range of 1–22 ng/mL. The median concentration of TGF-β in patients with ampullary cancer was 20 ng/mL, with a range of 1–56 ng/mL. The median concentration of TGF-β in the healthy controls was 19 ng/mL, with a range of 2–44 ng/mL. The differences between the groups of patients were not significant, possibly because of the imbalanced number of patients (Supplementary Figure 1A). The serum level of TGF-β was not correlated with the cancer stage, tumor stage, lymph node metastasis, or histological differentiation in ampullary patients (Supplementary Figures 1B–E). However, serum levels of TGF-β were correlated with the expressions of CD68+, CD163+, and iNOS+ TAMs in IHC stained cancer specimens. Patients with lower CD68+ TAM or higher iNOS+ TAM expression in ampullary cancer had a higher serum level of TGF-β (Figure 5B and D). The expression of CD163+ TAMs was not associated with the serum level of TGF-β (Figure 5C).
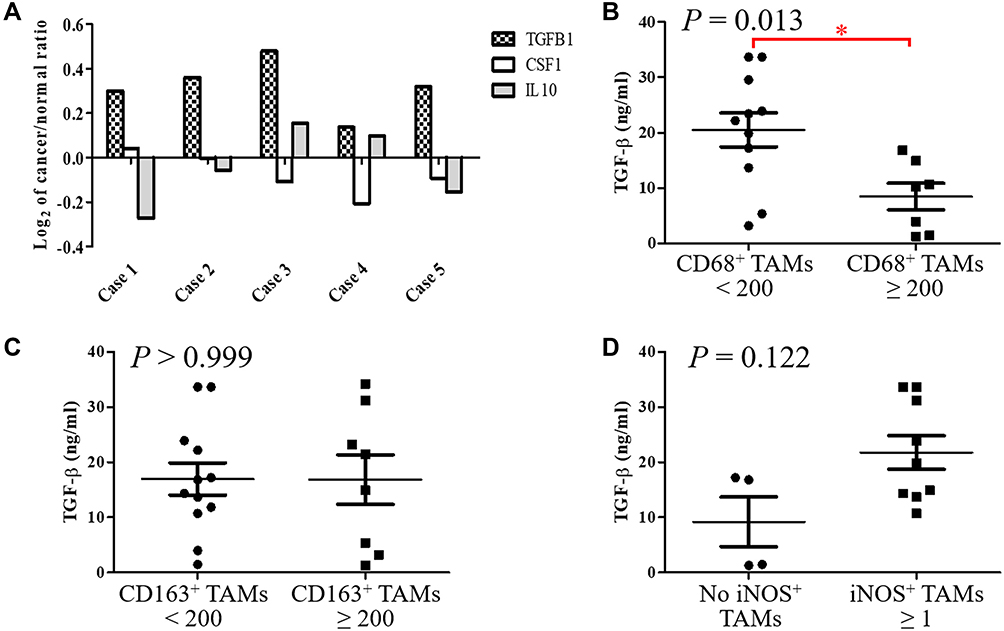 |
Figure 5 Detection of TGF-β in specimens of ampullary cancer.Notes: (A) The cDNA microarray analysis of five patients with ampullary cancer. The log2 ratio of gene expression comparing ampullary cancer and normal duodenum cells is displayed on the Y-axis. TGFB1, CSF1, and IL10 genes are selected and represent the proteins TGF-β, M-CSF, and IL-10, respectively. (B) Serum concentration of TGF-β is detected using ELISA and compared between patients with CD68+ TAMs < 200 or ≥ 200 through IHC staining (P = 0.013). *P < 0.05 (C) Comparison of the serum TGF-β concentration between patients with <200 or ≥200 CD163+ TAMs through IHC staining (P > 0.999). (D) Comparison of serum TGF-β concentration between patients without positive iNOS TAM staining or with ≥1 iNOS TAMs through IHC staining (P = 0.122).Abbreviations: CD68, cluster of differentiation 68; CD163, cluster of differentiation 163; cDNA, complementary deoxyribonucleic acid; CSF1, colony stimulating factor 1; ELISA, enzyme-linked immunosorbent assay; IHC, immunohistochemical; IL10, interleukin-10; iNOS, Inducible nitric oxide synthase; M-CSF, macrophage colony-stimulating factor; TGFB1, transforming growth factor beta 1; TGF-β, transforming growth factor beta. |
Modulation of Macrophages by Networks Associated with TGF-β and TGF-β
To confirm the effect of TGF-β on macrophages, we used flow cytometry to detect alterations in surface receptors after stimulation with different types of cytokines. Mature M1 and M2 macrophages have different surface receptors; for example, M2 macrophages express CD163.4 The THP-1 monocytic cell line was used to determine the appropriate concentration of TGF-β in vitro (Figure 6A). The proportion of CD163+ cells was higher after stimulation with 2.5 ng/mL TGF-β (Figure 6A). A study reported MIF overexpression in ampullary cancer; therefore, MIF expression was used as a control.18 The proportion of CD163+ THP1 cells increased after treatment with TGF-β (Figure 6B). The expression of OPN was also increased in activated THP1 cells in RT-PCR (Figure 6C). M1 macrophage–associated cytokines (tumor necrosis factor [TNF]-α and IL-1β) were difficult to detect (Figure 6D). Moreover, the downstream signaling in macrophages after stimulation by TGF-β1 was simulated using ClueGo and CluePedia databases, as illustrated in Figure 7. The combination of the ClueGo, CluePedia, and GO pathways revealed that immune-related pathways were significantly correlated in ampullary cancer. TGFB1 gene was located in the center of the net and was closely correlated with IL10, IL1B, SPP1, CCL22, TNF, MIF, and CCL18 genes in the inner ring. The interactions among all these genes induced changes in other genes in the middle ring. The complex networks resulted in different phenotypes in the outer ring. The inferential network predicted the response of TAMs to stimulation by cancer-derived TGF-β.
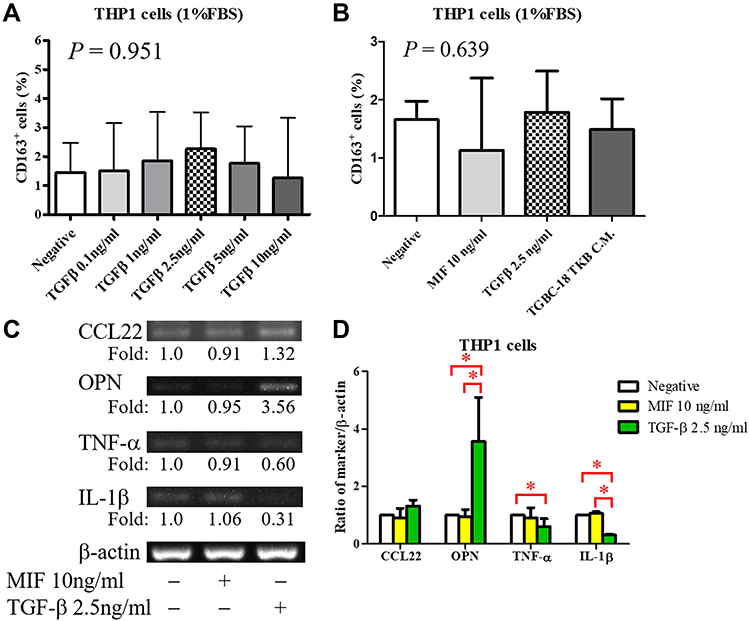 |
Figure 6 Induction of M2 macrophages by TGF-β.Notes: (A) Expression of CD163 in PMA-stimulated THP-1 cells after stimulation with different concentrations of TGF-β (n = 3, except n = 2 in the TGF-β 0.1 ng/mL group). The optimal concentration selected is TGF-β 2.5 ng/mL (P = 0.951). (B) Expression of CD163 in PMA-stimulated THP-1 cells is detected through flow cytometry after stimulation with 10 ng/mL MIF, 2.5 ng/mL TGF-β, or conditioned medium from TGBC-18 TKB cell lines (n ≥ 3). The proportion of CD163+ cells is slightly increased after stimulation with TGF-β (P = 0.639 in all groups). (C) The expression of macrophage-associated cytokines in macrophages is detected using RT-PCR (n = 3). (D) Semiquantitative analysis of cDNA is performed, and β-actin is served as a loading control. Expression of OPN is increased after stimulation with TGF-β. The expression of M1-associated cytokines (TNF-α and IL-1β) is decreased. *P < 0.05Abbreviations: CCL22, C-C motif ligand 22; CD163, cluster of differentiation 163; IL-1β, interleukin-1β; MIF, macrophage migration inhibitory factor; OPN, osteopontin; PMA, phorbol 12-myristate 13-acetate; RT-PCR, reverse transcription-polymerase chain reaction; TGF-β, transforming growth factor-β; TNF-α, tumor-necrosis factor-α. |
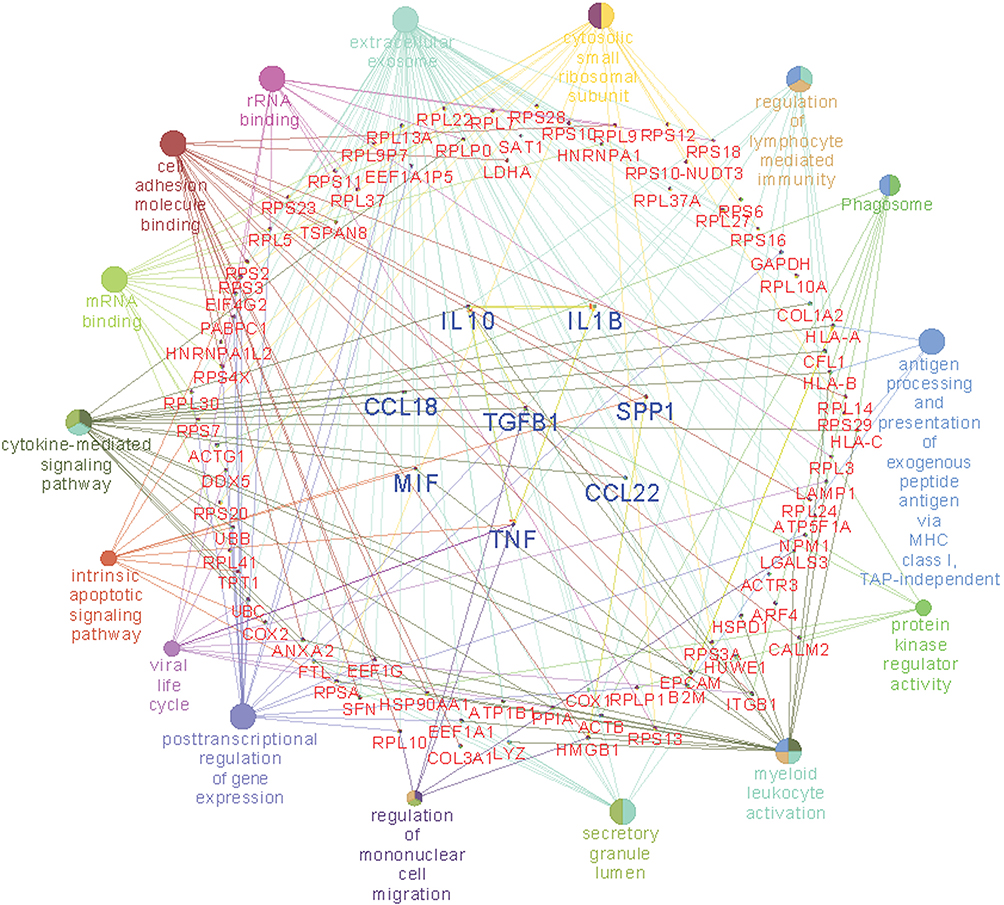 |
Figure 7 Network of TGFB1, other cytokine genes, and associated functionally phenotypes in macrophages.Notes: Gene GO terms and MetaCore pathways are analyzed to create an organized network. The center of the circle is the TGFB1 gene. The first ring includes the IL10, IL1B, SPP1, CCL22, TNF, MIF, and CCL18 genes. Interaction between the TGFB1 gene and the first-ring-genes generates genes in the middle circle (red-colored words). The correlated phenotypes are presented in the outer circle. The size of nodes reflects the enrichment of genes for each GO term. The connecting lines represent the correlation between gene-gene and gene-pathway.Abbreviations: CCL18, C-C motif ligand 18; CCL22, C-C motif ligand 22; IL1B, interleukin 1 beta; IL10, interleukin 10; MIF, macrophage migration inhibitory factor; TGFB1, transforming growth factor beta 1; SPP1, secreted phosphoprotein 1; TNF, tumor necrosis factor. |
Discussion
The interactions of cancer cells and TAMs are crucial in cancer development. Cytokine secretion from cancer cells is critical in the regulation of TAMs. The present study demonstrated that TAMs inside the tumor mass of ampullary cancer consist of CD68+ mature and CD163+ M2 macrophages. We identified TGF-β upregulation by analyzing a published high-throughput dataset (GSE39409) and cDNA microarrays of cancerous cells and adjacent normal duodenum from five patients with ampullary cancer. The serum level of TGF-β in ampullary patients was correlated with low number of CD68+ TAMs in cancer specimens. Conditioned media from ampullary cancer cells and treatment with TGF-β induced the expression of CD163 and OPN in activated macrophages. TGF-β had a regional paracrine effect on TAMs in ampullary cancer. Phenotypical alteration of macrophages after stimulation with TGF-β was predicted by ClueGo and CluePedia software. The present study offers a comprehensive explanation regarding the effects of TGF-β on TAMs in ampullary cancer.
Cancer-secreted cytokines induce the migration of monocytes from peripheral blood into the tumor mass.3 These monocytes are stimulated by different cytokines and differentiated into M1 or M2 TAMs.5 Different types of mononuclear cells express distinct surface markers and intracellular proteins. CD14 is expressed in every monocyte or macrophage linkage. CD68 is a surface marker of activated macrophages, including M1 and M2.26 CD163 and CD206 are surface markers of M2 macrophages, and CD80 and CD86 are markers of M1 macrophages.27 The expression of intracellular CCL22 and CCL18 increased after differentiation into M2. M1 macrophages produce iNOS, which exerts anti-inflammatory effects. These surface markers and secreted cytokines are not continuously expressed by the same linkage of macrophages. For example, CD163 and CD206 are mutually exclusively induced, and CCL18 is produced by a subgroup of M2 macrophages.28 All types of surface markers and intracellular proteins should be considered during investigation of TAMs. In the present study, IHC staining was performed first. CD68, CD163, and iNOS were used to identify all of the activated macrophages (both M1 and M2), M2 macrophages, and M1 macrophages, respectively (Tables 1–3). The most-prominent macrophage was the CD163+ M2 linkage inside ampullary cancer tumors (Figure 1). Furthermore, we used flow cytometry to detect CD163+ in M2-differentiated cells (Figure 6). The expression of CD163 and OPN increased in macrophages after stimulation with conditioned medium or recombinant human TGF-β (Figures 4 and 6). The macrophages were activated after coculture with conditioned medium from ampullary cancer cells. However, the regulation of TAMs is complex, and other linkages in M2 TAMs may have been omitted in this study.
RNA-sequencing and cDNA microarrays are high-throughput analysis techniques for evaluating gene expression in cancer research. Limited funding and the rarity of ampullary cancer restrict the number of experiments that can be performed at a single center. The NCBI GEO database compiled from multiple institutes provides samples for analysis.29 MetaCore uses a proprietary, manually curated database, which includes data regarding protein–protein, protein–DNA, and protein–compound interactions. This database also contains data regarding metabolic and signaling pathways. Networks and maps from MetaCore improve the incorporation and conjunction of multiple genes.30 Immune system–related maps of the first 100 signals were presented in Figure 2 and the details were displayed in the Supplementary materials. Six TGF-β-associated pathways were identified (Figure 2). The downstream of TGF-β, namely of TGFBI, was analyzed using a heatmap (Figure 3). The upregulation of TGFBI is reported in patients with pancreatic, biliary, and gastrointestinal cancer.31 Ampullary cancer is a gastrointestinal cancer. These bioinformatics tools facilitate investigation of the function of TGF-β signaling in ampullary cancer.
The activation of macrophages is a complicated process. M1 macrophages are typically activated by interferon-γ, lipopolysaccharides, or TNF. M2 macrophages are typically activated by IL-10.4 However, the activation of M2 macrophages can also be induced by IL-4 or IL-13 in allergic diseases.5 TGF-β is a cancer-secreted cytokine that has multiple functions. During the early stages of tumorigenesis, TGF-β suppresses the proliferation of tumor cells; however, a high concentration of TGF-β in the later stages of cancer enhances the invasion of cancer cells, angiogenesis, and local tumor immunosuppression.6,7,32 Moreover, TGF-β directs monocytes into the tumor mass and drives them into M2 macrophages.33,34 TGF-β induces MIF overexpression in CT26 colon cancer cell lines.35 TGF-β and MIF genes are upregulated simultaneously during breast cancer tumorigenesis.36 In our previous study, TGF-β and MIF expression was detected in ampullary cancer cells.18 The local effect of TGF-β inside the tumor mass may be essential. We examined the effect of TGF-β on monocyte differentiation. Treatment with recombinant human TGF-β augmented the expression of OPN (Figure 6). Furthermore, conditioned medium from ampullary cancer cells enhanced the expression of CD163 and OPN (Figure 4). However, the serum level of TGF-β was not correlated with the number of CD163+ TAMs in cancer specimens. Higher serum levels of TGF-β were associated with fewer CD68+ TAMs and more iNOS+ TAMs in ampullary cancer specimens (Figure 5). TGF-β may contribute to the production of other types of TAMs and interact with other cytokines in ampullary cancer. Figure 7 provided an integrated network to reconstruct the hierarchical tree from TGF-β and other cytokines. TGF-β serves as a critical regulator of macrophages in ampullary cancer.
Several models have been used to mimic the tumor microenvironment and simulate the interaction between cancer cells and macrophages. CD14+ cells from cancer patients are preferred for this interaction; however, patients with ampullary cancer develop malnutrition and anemia because of obstructive jaundice and tumor bleeding. Drawing a large amount of blood is thus unethical. CD14+ cells from healthy volunteers can be stimulated to differentiate into M2 macrophages using methods described in the literature.33 Nevertheless, mononuclear cells from different individuals have diverse cell counts and unequal proportions of CD14+ monocytes. The large variation in isolation rates results in an unstable source of CD14+ monocytes and difficulty in completing experiments. Alternatively, mononuclear cell lines of THP-1 could be used to generate M2 macrophages.22 However, an in vitro culture system only partially imitates the tumor microenvironment. Other immune cells should be considered in the interaction between cancer cells and immune cells.
In conclusion, the present study demonstrated that the majority of the TAMs in ampullary cancer specimens expressed CD68 and CD163. The expression of mature CD68+ TAMs was correlated with an advanced cancer stage. Conditioned medium from ampullary cancer promoted the differentiation of monocytes into mature macrophages. Upregulation of TGF-β downstream was identified in the GSE39409 dataset and in the cDNA microarrays from five patients with ampullary cancer. Treatment with TGF-β stimulated the expression of CD163 and OPN. Integrated networks centered on TGF-β demonstrated the potentially phenotypical alteration of TAMs. These results provide initial insights into the interaction between ampullary cancer cells and macrophages. Further studies are needed to further understand the dysregulation of immunosurveillance in ampullary cancer.
Abbreviations
AJCC TNM, American Joint Committee on Cancer’s tumor, node, and metastasis staging system; ATCC, American Type Culture Collection; CCL18, C-C motif ligand 18; CCL22, C-C motif ligand 22; CD14, cluster of differentiation 14; CD163, cluster of differentiation 163; CD206, cluster of differentiation 206; CD68, cluster of differentiation 68; DMEM, Dulbecco’s modified Eagle’s medium; EGF, epidermal growth factor; ELISA, enzyme-linked immunosorbent assay; FBS, fetal bovine serum; FDR, false discovery rate; FFPE, formalin-fixed paraffin-embedded; GO, gene ontology; HPF, high-power field; IHC, immunohistochemistry; iNOS, inducible nitric oxide synthase; IL-1β, interleukin-1β; IL-10, interleukin-10; IL-13, interleukin-13; IL-4, interleukin-4; M-CSF, macrophage colony-stimulating factor; MIF, macrophage migration inhibitory factor; OPN, osteopontin; PMA, phorbol 12-myristate 13-acetate; RMA, robust multichip average; RT-PCR, reverse transcription-polymerase chain reaction; TAM, tumor-associated macrophage; TGF-β, transforming growth factor-β; TNF-α, tumor-necrosis factor-α; Th1 cells, T helper 1 cells; Th2 cells, T helper 2 cells.
Data Sharing Statement
The data sets used and analyzed in this study are available from the corresponding authors upon reasonable request.
Acknowledgments
The authors are thankful to all patients who participated in the study. The authors are grateful for support from Human Biobank, Research Center of Clinical Medicine, National Cheng Kung University Hospital. We were blessed with support from the late superintendent, Professor Pin-wen Lin. Furthermore, we thank Professor Yee-Shin Lin, Professor Michael J. Overman, and Miss Ya-Li Hsiao for their kindly support.
Author Contributions
All authors made substantial contributions to conception and design, acquisition of data, or analysis and interpretation of data; took part in drafting the article or revising it critically for important intellectual content; gave final approval of the version to be published; and agree to be accountable for all aspects of the work.
Disclosure
The authors have no conflicts of interest to declare.
References
1. Kielbassa K, Vegna S, Ramirez C, Akkari L. Understanding the origin and diversity of macrophages to tailor their targeting in solid cancers. Front Immunol. 2019;10:2215. doi:10.3389/fimmu.2019.02215
2. Wang J, Li D, Cang H, Guo B. Crosstalk between cancer and immune cells: role of tumor-associated macrophages in the tumor microenvironment. Cancer Med. 2019;8(10):4709–4721. doi:10.1002/cam4.2327
3. Laviron M, Boissonnas A. Ontogeny of tumor-associated macrophages. Front Immunol. 2019;10:1799. doi:10.3389/fimmu.2019.01799
4. Mantovani A, Sica A, Sozzani S, Allavena P, Vecchi A, Locati M. The chemokine system in diverse forms of macrophage activation and polarization. Trends Immunol. 2004;25(12):677–686. doi:10.1016/j.it.2004.09.015
5. Gordon S. Alternative activation of macrophages. Nat Rev Immunol. 2003;3(1):23–35. doi:10.1038/nri978
6. Edgar R. Gene expression omnibus: NCBI gene expression and hybridization array data repository. Nucleic Acids Res. 2002;30(1):207–210. doi:10.1093/nar/30.1.207
7. Bierie B, Moses HL. Tumour microenvironment: tGFβ: the molecular Jekyll and Hyde of cancer. Nat Rev Cancer. 2006;6(7):506–520. doi:10.1038/nrc1926
8. Flavell RA, Sanjabi S, Wrzesinski SH, Licona-Limon P. The polarization of immune cells in the tumour environment by TGFβ. Nat Rev Immunol. 2010;10(8):554–567. doi:10.1038/nri2808
9. Tian M, Neil JR, Schiemann WP. Transforming growth factor-β and the hallmarks of cancer. Cell Signal. 2011;23(6):951–962. doi:10.1016/j.cellsig.2010.10.015
10. Liu G, Ma H, Qiu L, et al. Phenotypic and functional switch of macrophages induced by regulatory CD4+CD25+ T cells in mice. Immunol Cell Biol. 2011;89:130–142.
11. Kamarajah SK. Pancreaticoduodenectomy for periampullary tumours: a review article based on Surveillance, End Results and Epidemiology (SEER) database. Clin Transl Oncol. 2018;20:1153–1160.
12. Hsu HP, Yang TM, Hsieh YH, Shan YS, Lin PW. Predictors for patterns of failure after pancreaticoduodenectomy in ampullary cancer. Ann Surg Oncol. 2007;14:50–60. doi:10.1245/s10434-006-9136-3
13. Ecker BL, Vollmer CM
14. Lee CS. Transforming growth factor alpha immunoreactivity in human gallbladder and extrahepatic biliary tract tumours. Eur J Surg Oncol. 1998;24(1):38–42. doi:10.1016/S0748-7983(98)80123-6
15. Zhu L, Kim K, Domenico DR, Appert HE, Howard JM. Adenocarcinoma of duodenum and ampulla of vater: clinicopathology study and expression of p53, c-neu, TGF-α, CEA, and EMA. J Surg Oncol. 1996;61(2):100–105. doi:10.1002/(SICI)1096-9098(199602)61:2<100::AID-JSO3>3.0.CO;2-G
16. Zhao M, Mishra L, Deng C-X. The role of TGF-β/SMAD4 signaling in cancer. Int J Biol Sci. 2018;14(2):111–123. doi:10.7150/ijbs.23230
17. Jayaramayya K, Balachandar V, Santhy KS. Ampullary carcinoma—a genetic perspective. Mutat Res. 2018;776:10–22. doi:10.1016/j.mrrev.2018.03.002
18. Hsu H-P, Shan Y-S, Lai M-D, Lin P-W. Osteopontin-positive infiltrating tumor-associated macrophages in bulky ampullary cancer predict survival. Cancer Biol Ther. 2010;10(2):144–154. doi:10.4161/cbt.10.2.12160
19. Edge SB, Byrd DR, Compton CC, Fritz AG, Greene FL, Trotti A. AJCC Cancer Staging Manual.
20. Bindea G, Mlecnik B, Hackl H, et al. ClueGO: a cytoscape plug-in to decipher functionally grouped gene ontology and pathway annotation networks. Bioinformatics. 2009;25(8):1091–1093. doi:10.1093/bioinformatics/btp101
21. Bindea G, Galon J, Mlecnik B. CluePedia cytoscape plugin: pathway insights using integrated experimental and in silico data. Bioinformatics. 2013;29(5):661–663. doi:10.1093/bioinformatics/btt019
22. Daigneault M, Preston JA, Marriott HM, Whyte MKB, Dockrell DH, Doherty TM. The identification of markers of macrophage differentiation in PMA-stimulated THP-1 cells and monocyte-derived macrophages. PLoS One. 2010;5(1):e8668. doi:10.1371/journal.pone.0008668
23. Overman MJ, Zhang J, Kopetz S, et al. Gene expression profiling of ampullary carcinomas classifies ampullary carcinomas into biliary-like and intestinal-like subtypes that are prognostic of outcome. PLoS One. 2013;8(6):e65144. doi:10.1371/journal.pone.0065144
24. Lawson DA, Bhakta NR, Kessenbrock K, et al. Single-cell analysis reveals a stem-cell program in human metastatic breast cancer cells. Nature. 2015;526(7571):131–135. doi:10.1038/nature15260
25. Maeda H, Kuwahara H, Ichimura Y, Ohtsuki M, Kurakata S, Shiraishi A. TGF-beta enhances macrophage ability to produce IL-10 in normal and tumor-bearing mice. J Immunol. 1995;155(10):4926–4932.
26. Laganà AS, Salmeri FM, Ban Frangež H, Ghezzi F, Vrtačnik-Bokal E, Granese R. Evaluation of M1 and M2 macrophages in ovarian endometriomas from women affected by endometriosis at different stages of the disease. Gynecol Endocrinol. 2019;30:1–4.
27. Pinto ML, Rios E, Durães C, et al. The two faces of tumor-associated macrophages and their clinical significance in colorectal cancer. Front Immunol. 2019;10:1875. doi:10.3389/fimmu.2019.01875
28. Porcheray F, Viaud S, Rimaniol A-C, et al. Macrophage activation switching: an asset for the resolution of inflammation. Clin Exp Immunol. 2005;142(3):481–489. doi:10.1111/j.1365-2249.2005.02934.x
29. Barrett T, Wilhite SE, Ledoux P, et al. NCBI GEO: archive for functional genomics datasets-update. Nucleic Acids Res. 2013;41:D991–D995. doi:10.1093/nar/gks1193
30. Schuierer S, Tranchevent LC, Dengler U, Moreau Y. Large-scale benchmark of endeavour using MetaCore maps. Bioinformatics. 2010;26(15):1922–1923. doi:10.1093/bioinformatics/btq307
31. Yokobori T, Nishiyama M. TGF-β signaling in gastrointestinal cancers: progress in basic and clinical research. J Clin Med. 2017;6(1):11. doi:10.3390/jcm6010011
32. Connolly EC, Freimuth J, Akhurst RJ. Complexities of TGF-β targeted cancer therapy. Int J Biol Sci. 2012;8(7):964–978. doi:10.7150/ijbs.4564
33. Gong D, Shi W, Yi S-J, Chen H, Groffen J, Heisterkamp N. TGFβ signaling plays a critical role in promoting alternative macrophage activation. BMC Immunol. 2012;13(1):31. doi:10.1186/1471-2172-13-31
34. Zhang F, Wang H, Wang X, et al. TGF-β induces M2-like macrophage polarization via SNAIL-mediated suppression of a pro-inflammatory phenotype. Oncotarget. 2016;7(32):52294–52306. doi:10.18632/oncotarget.10561
35. Choi S, Kim H-R, Leng L, et al. Role of macrophage migration inhibitory factor in the regulatory T cell response of tumor-bearing mice. J Immunol. 2012;189(8):3905–3913. doi:10.4049/jimmunol.1102152
36. Reome JB, Hylind JC, Dutton RW, Dobrzanski MJ. Type 1 and type 2 tumor infiltrating effector cell subpopulations in progressive breast cancer. Clin Immunol. 2004;111(1):69–81. doi:10.1016/j.clim.2003.11.013
 © 2020 The Author(s). This work is published and licensed by Dove Medical Press Limited. The full terms of this license are available at https://www.dovepress.com/terms.php and incorporate the Creative Commons Attribution - Non Commercial (unported, v3.0) License.
By accessing the work you hereby accept the Terms. Non-commercial uses of the work are permitted without any further permission from Dove Medical Press Limited, provided the work is properly attributed. For permission for commercial use of this work, please see paragraphs 4.2 and 5 of our Terms.
© 2020 The Author(s). This work is published and licensed by Dove Medical Press Limited. The full terms of this license are available at https://www.dovepress.com/terms.php and incorporate the Creative Commons Attribution - Non Commercial (unported, v3.0) License.
By accessing the work you hereby accept the Terms. Non-commercial uses of the work are permitted without any further permission from Dove Medical Press Limited, provided the work is properly attributed. For permission for commercial use of this work, please see paragraphs 4.2 and 5 of our Terms.