")
Back to Journals » Open Access Emergency Medicine » Volume 11
Can Venous Blood Gas Be Used as an Alternative to Arterial Blood Gas in Intubated Patients at Admission to the Emergency Department? A Retrospective Study
Authors Schütz N, Roth D, Schwameis M , Röggla M, Domanovits H
Received 1 September 2019
Accepted for publication 15 November 2019
Published 23 December 2019 Volume 2019:11 Pages 305—312
DOI https://doi.org/10.2147/OAEM.S228420
Checked for plagiarism Yes
Review by Single anonymous peer review
Peer reviewer comments 2
Editor who approved publication: Dr Hans-Christoph Pape
Nikola Schütz, Dominik Roth, Michael Schwameis, Martin Röggla, Hans Domanovits
Department of Emergency Medicine, Medical University of Vienna, Vienna A-1090, Austria
Correspondence: Nikola Schütz
Department of Emergency Medicine, Medical University of Vienna, Währinger Gürtel 18-20, Vienna A-1090, Austria
Tel +4314040019640
Fax +4314040019650
Email [email protected]
Objective: Blood gas analysis plays an important role in both diagnosis and subsequent treatment of critically ill patients in the emergency department and the ICU. Historically, arterial blood is predominantly used for blood gas analysis. The puncture is painful and complications may occur. The purpose of the present study was to evaluate the agreement between arterial and venous blood gas analysis and whether the sole use of venous blood gas analysis would have changed therapy.
Methods: Adult patients who were intubated in the field and received an arterial and venous blood gas analysis within 15 mins after admission to the ED were eligible for inclusion. The values for pH, pCO2, HCO3-, base excess and lactate levels were collected retrospectively. Mean differences were calculated by subtracting venous from arterial values. The agreement between venous and arterial measurements was assessed using the method of Bland and Altman. Blood gases were assessed by two independent physicians using a standardized questionnaire to determine whether the use of venous blood gases would have led to a different interpretation of the situation (other diagnostic path) or a change of therapy (eg. respirator adjustment). Acceptable limits were defined before the collection of data started.
Results: Fifty patients (62% male, median age 63years) who were treated at the Emergency Department between June 1, 2014 and December 31, 2014 were included in the study. Following average differences and limits of agreement (LOA) were documented: pH 0.02312 with LOA from −0.048 to 0.094; pCO2 −3.612 mmHg with LOA from −15 to 8.1 mmHg; BE −0.154 mmol/l with LOA from −3.7 to 3.4 mmol/l; HCO3−0.338 mmol/l with LOA from −2.27 to 2.9 mmol/l; Lactate −0.124 mg/dl with LOA from −2.28 to 2.03 mg/dl. Using venous blood gas results 100% of the patients with metabolic alkalosis were correctly diagnosed. Metabolic acidosis was detected with a high sensitivity (80.64%), specificity (89.47%) and positive predictive value (92.59%). The answers to lactate and acidosis due to AKI showed a specificity and positive predictive value of 100%. The respiratory adjustment showed a high sensitivity (91.89%) but a low specificity (38.46%).
Conclusion: For pH, bicarbonate, BE and lactate venous blood gases can be used as surrogates for arterial measurements. Venous pCO2 can be used for screening of hypercapnia and trending. Respirator adjustments may be done too often if the venous blood gas is used.
Keywords: blood gas analysis, intubation, venous and arterial blood sampling, questionnaire
Introduction
Arterial blood gas analysis is the gold standard to evaluate the acid–base balance, oxygenation and ventilation in intensive care patients. Arterial puncture however is painful and may lead to complications including bleeding and hematoma, infection, embolization and the occurrence of aneurysms1 or even compartment syndrome.2 Another clinically well-known disadvantage of arterial puncturing is the shortage of puncture sites after multiple unsuccessful punctures. This may impede subsequent procedures including coronary catheterization or shunt surgery. It is also possible that venous blood is obtained instead of arterial blood, necessitating repetitive puncture at another site.3 At the intensive care unit, the arterial puncture is not only used for a single blood draw but for the placement of an arterial catheter. This simplifies additional blood draws and continuous blood pressure monitoring. The radial and femoral arteries are commonly used.
There are no absolute contraindications against arterial puncturing. In patients with a high risk of bleeding (eg. during thrombolysis or in disseminated intravascular coagulation (DIC)) puncture should only be performed, if the information gained is essential and outweighs the risks.
Due to the aforementioned difficulties in arterial puncturing, venous blood gas analysis might serve as an alternative (except for the evaluation of oxygenation), especially in the emergency department. We therefore aimed to assess the agreement between venous and arterial blood gas measurements at admission to the emergency department, and whether differences between measurements would affect clinicians’ decisions.
Materials and Methods
This retrospective observational study was conducted at the Emergency Department of the Medical University of Vienna, a 2200-bed tertiary care hospital. The Emergency Department encompasses an outpatient care section and an affiliated intensive care unit. The study was approved by the local Ethics Committee of the Medical University of Vienna and conducted in accordance with the Declaration of Helsinki (seventh revision, 2013). As this was a retrospective study informed patient consent to review the medical records was not required by the Ethics Committee of the Medical University of Vienna. To ensure patient data confidentiality, data were anonymized, entered into a password-locked database and stored safely on a local computer at the Emergency Department accessible to study members only.
Adult patients who were intubated on admission and received an arterial and venous blood gas analysis within 15 mins were eligible for inclusion. At our department, venous blood gas analysis is normally performed immediately at admission (from pre-existing venous lines. Arterial blood gas analysis is obtained directly after establishment of an arterial line. Patients were excluded if the time-period between venous and arterial sampling exceeded 15 mins.
PH, pCO2, HCO3− values as well as base excess and lactate levels were collected from both venous and arterial blood gases. Additionally, we collected the following information: pO2, gender, age, admission diagnosis, time of venous sample, time of arterial sample, respirator settings (respiratory minute volume, tidal, PEEP, peripheral O2-saturation, FiO2), hemodynamic parameters (heart rate, blood pressure, temperature), signs of aspiration, tube position.
At our department, the ABL800 Flex (Radiometer A/S, Copenhagen, Denmark) is used to analyze the venous and arterial blood samples. Pulse oximetry is performed using the Philips Intellivue X2 and etCO2 is measured with the Philips Intellivue MP70 (both Royal Philips, Amsterdam, The Netherlands).
Statistical Analysis
We report absolute and relative frequencies, mean and standard deviation or median and 25–75% interquartile range, as appropriate. The mean differences were calculated as arterial minus venous measurements. The agreement between venous and arterial measurements was compared using the method of Bland and Altman.4 Clinically relevant limits for the differences between arterial and venous measurements were defined as follows: pH ± 0.04; pCO2 ± 5 mmHg; HCO3- ± 3 mmol/l; BE ± 3 mmol/l; Lactate ± 3 mg/dl. We calculated the absolute and relative frequencies of measurements within these limits. The limits were defined by using our laboratories’ thresholds.5 We compared the Bland–Altman Plots and LOA to our set limits.
The blood gases were handed to two independent emergency physicians. They were also given a short summary of the situation and the actual respirator setting. We used a standardized questionnaire (Table 1) to determine whether the use of the blood gases would have led to a different interpretation of the situation (other diagnostic path) or a change in therapy (eg. respirator adjustment). Respirator adjustments included measures to increase or decrease the tidal volume, respiratory rate or the FiO2. One physician was handed the arterial blood gas, the other one the venous blood gas. We alternated venous and arterial blood gases between the two physicians. We decided to count the arterial blood gas answers as “correct” and compare them to the venous blood gas answers. For each question, we calculated specificity, sensitivity, negative predictive value and positive predictive value to evaluate how similar or different the interpretations of the venous blood gases were in comparison to the arterial blood gases (Table 2).
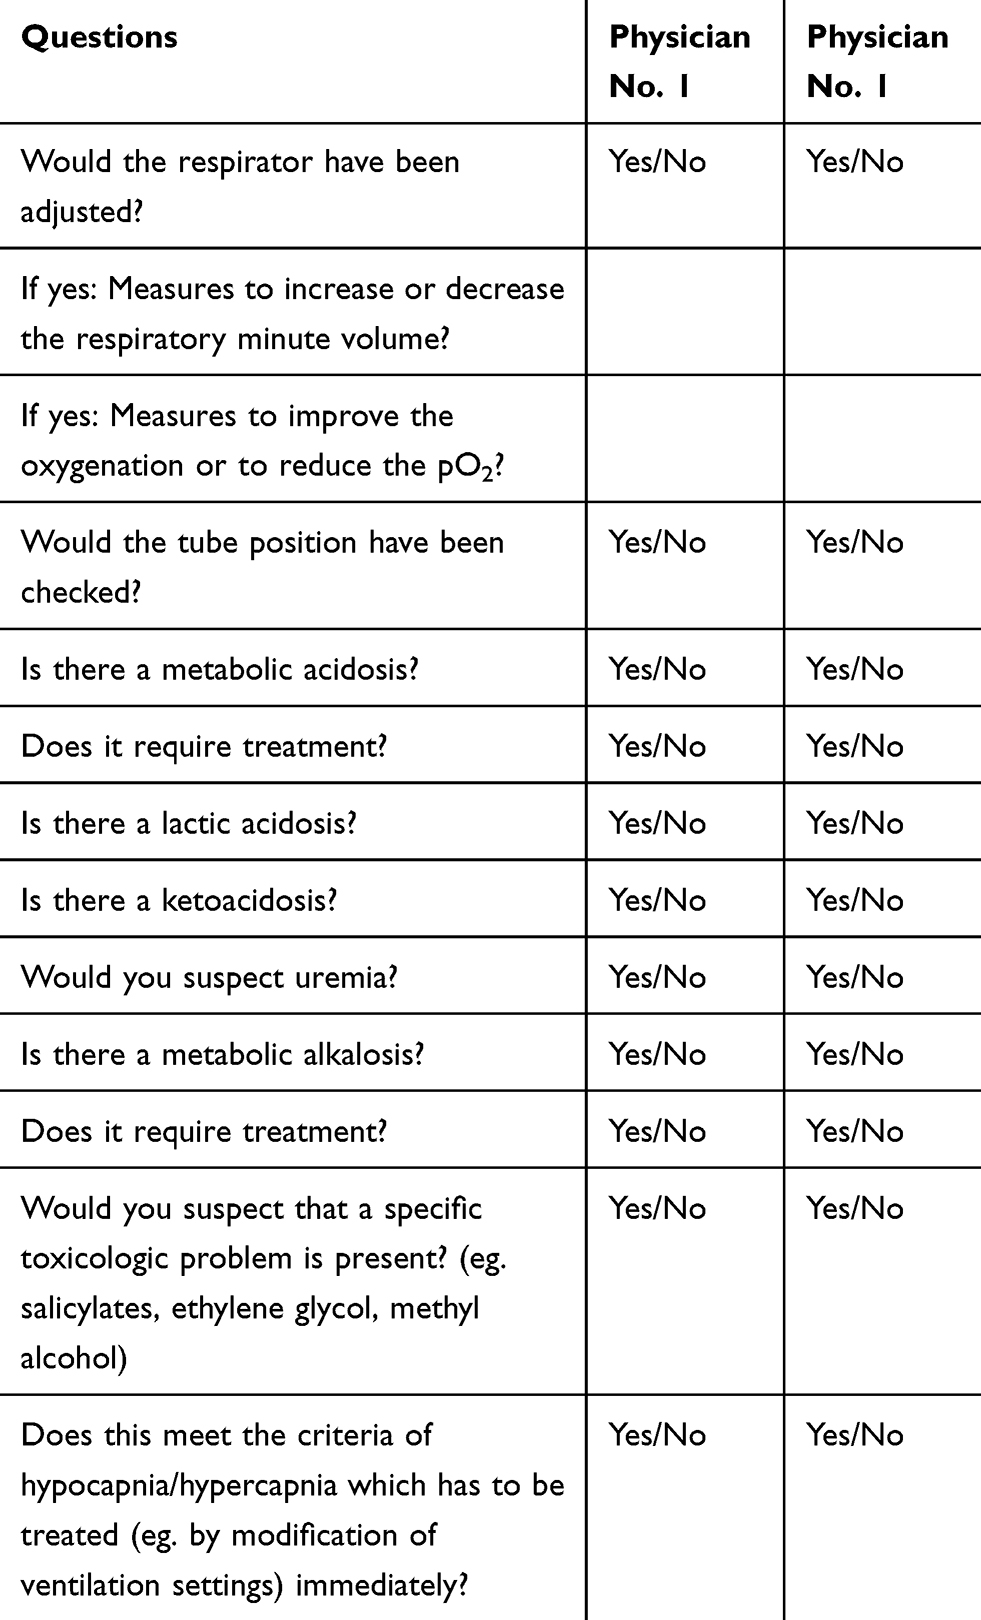 |
Table 1 Questionnaire |
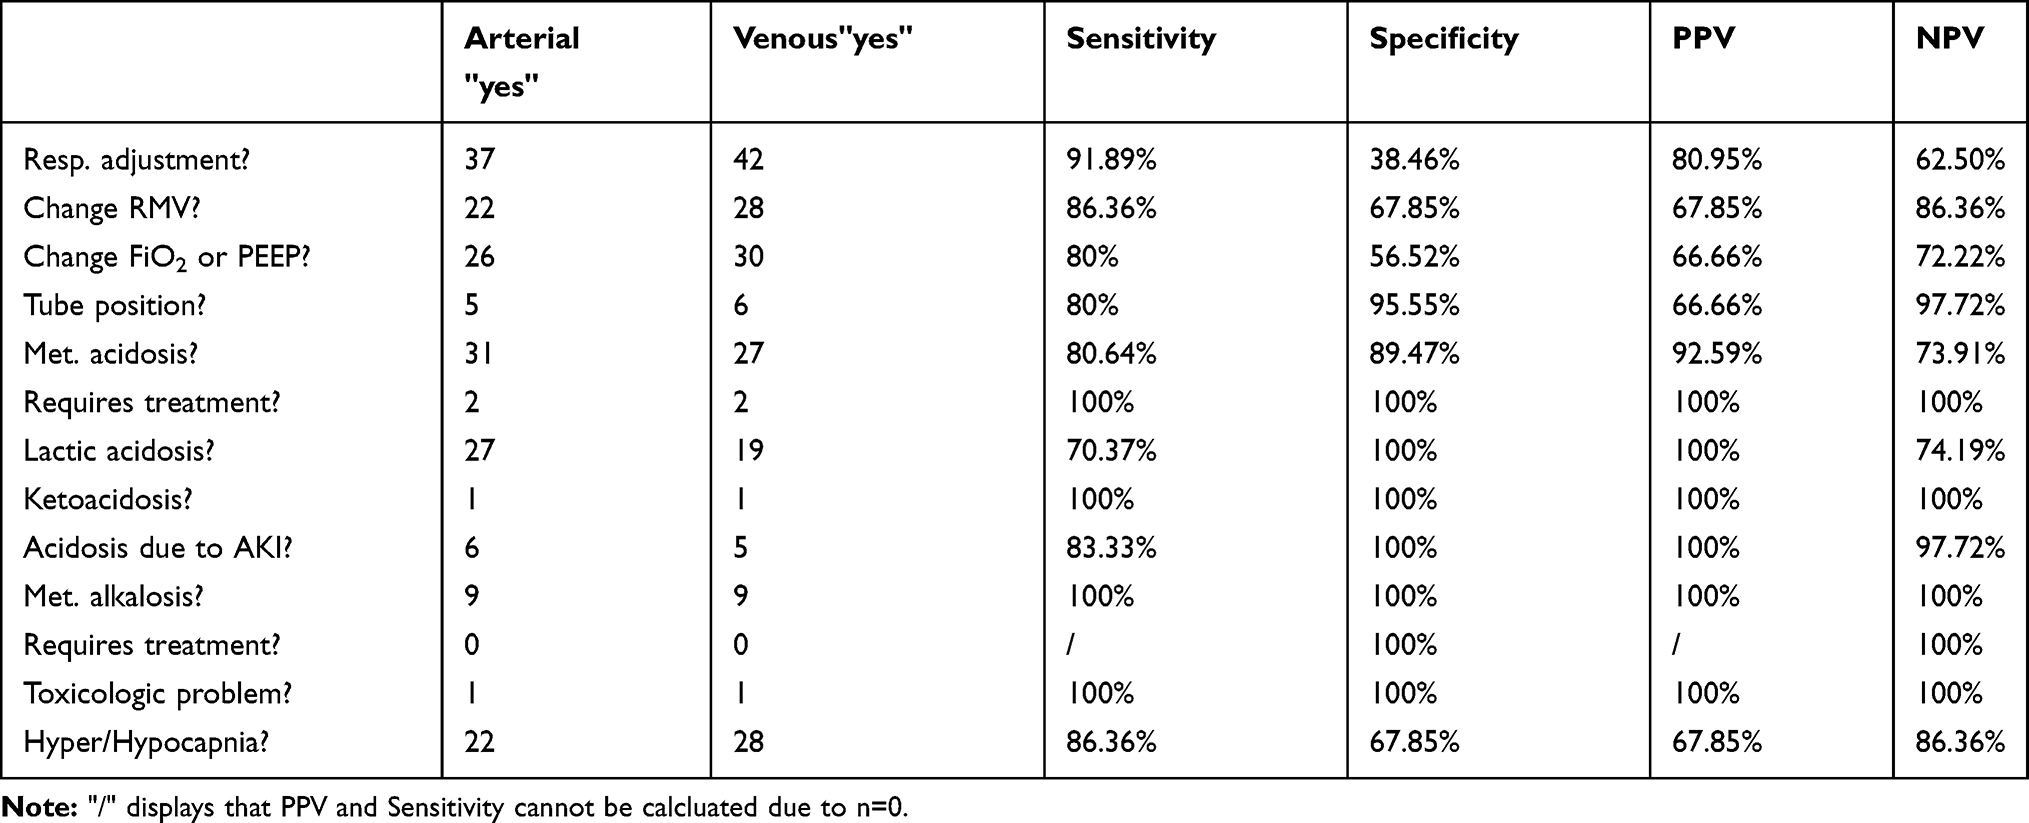 |
Table 2 Questionnaire Answered “Yes” |
Results
The study included 50 patients (62% male, median age 63years) brought to the Emergency Department from June 1, 2014 to December 31, 2014. The most common diagnosis was cardiac arrest (n=22; 44%), followed by respiratory insufficiency (n=6; 12%) and myocardial infarction (n=6; 12%) (Table 3).
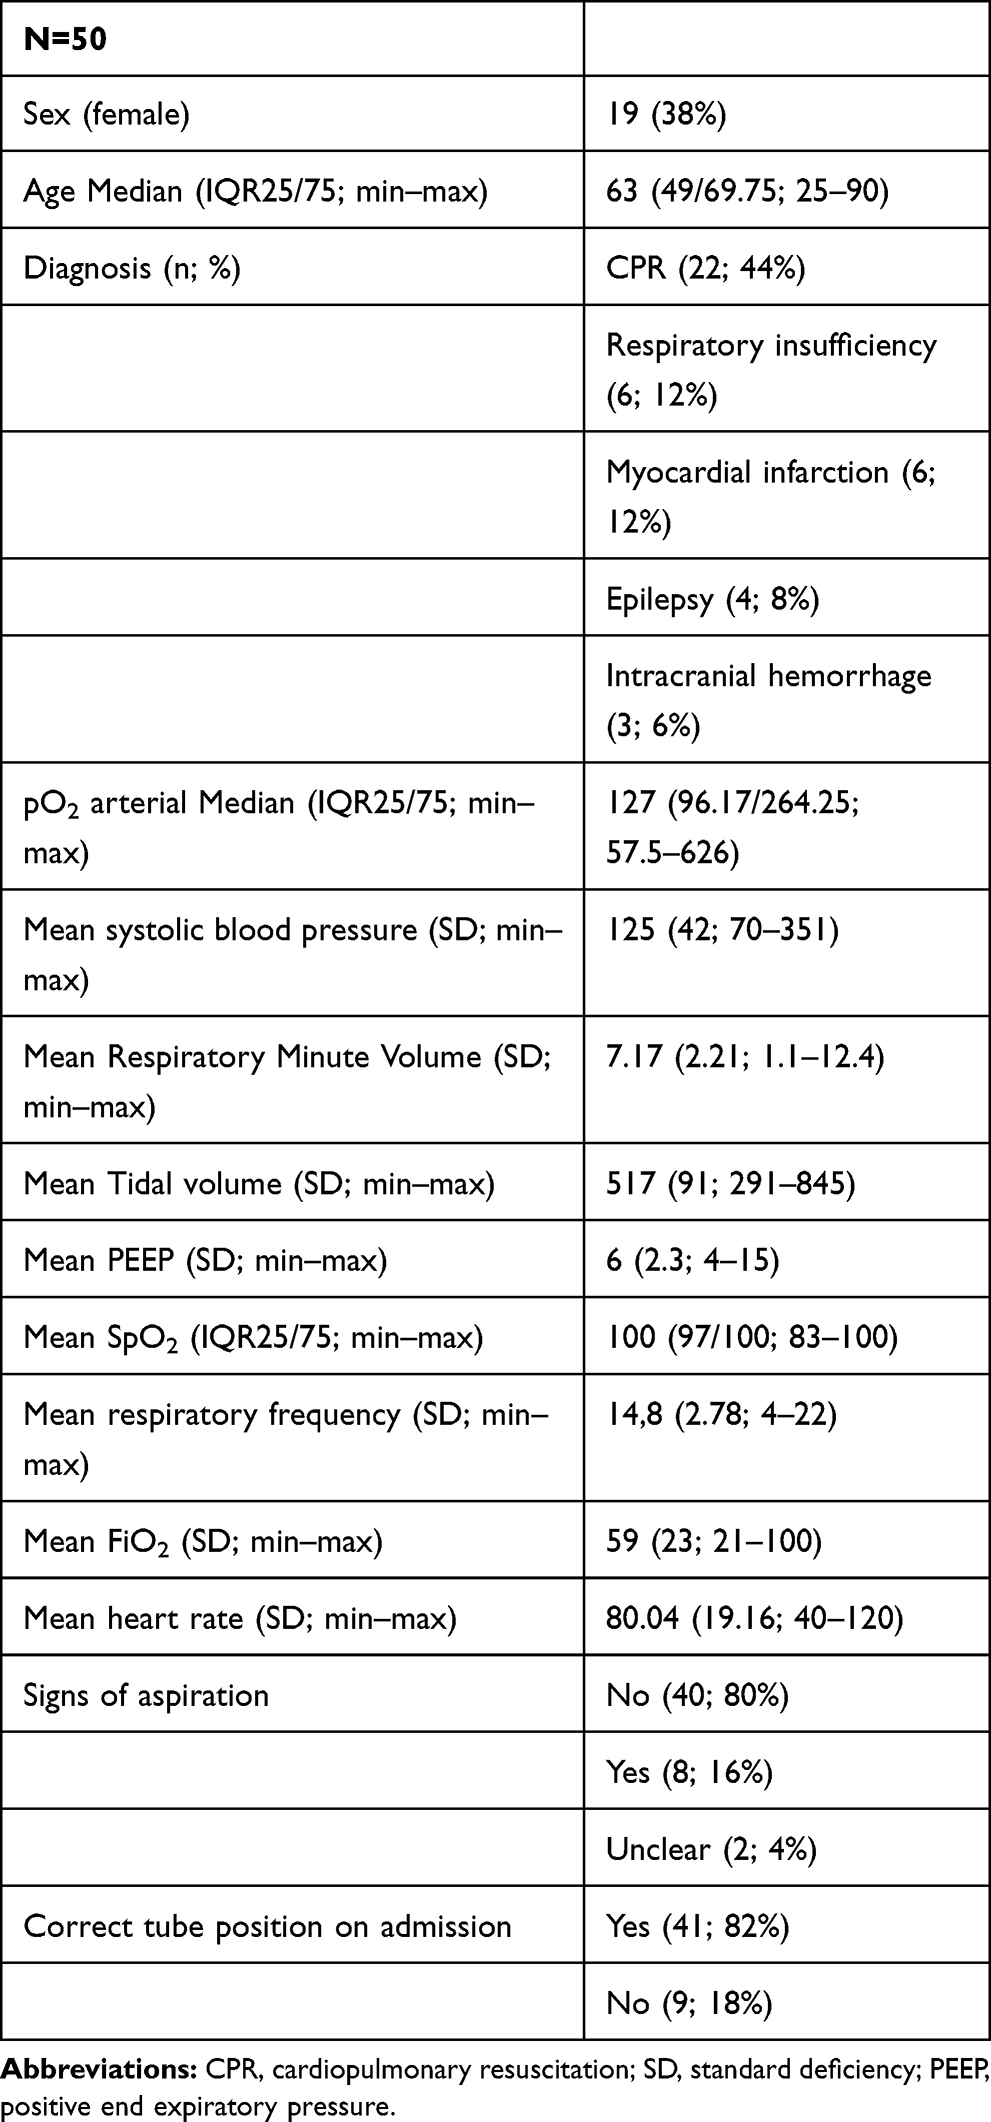 |
Table 3 Baseline Characteristics of the Study Cohort |
The venous pH was on average 0.02312 (SD 0.03661729) lower than the arterial pH (Figure 1); the venous pCO2 was on average 3.612 mmHg (SD 6.000921263) higher than the arterial pCO2 (Figure 2); the venous HCO3- was on average 0.338 mmol/l (SD 1.332950112) lower than the arterial HCO3-; the venous BE was on average 0.154 (SD 1.81098978) higher than the arterial BE and the venous lactate was on average 0.124 (SD 1.10391304) higher than the arterial lactate (Table 4, Figure 3).
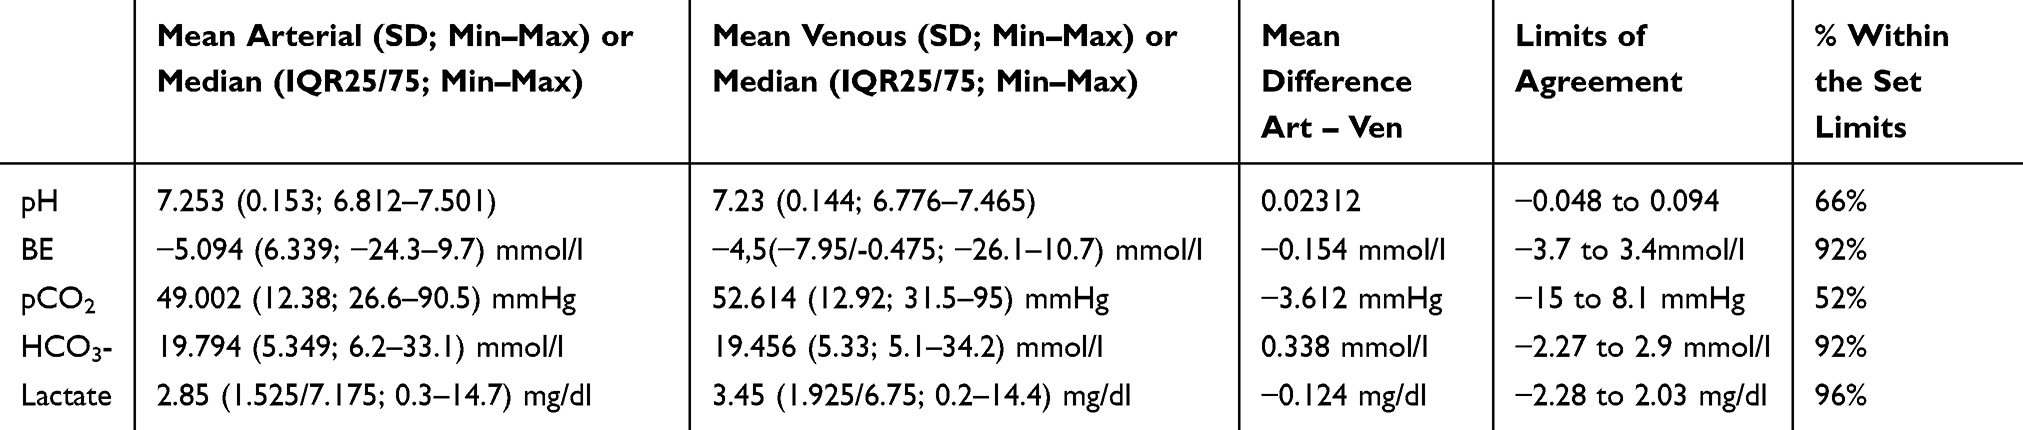 |
Table 4 Venous and Arterial Measurements |
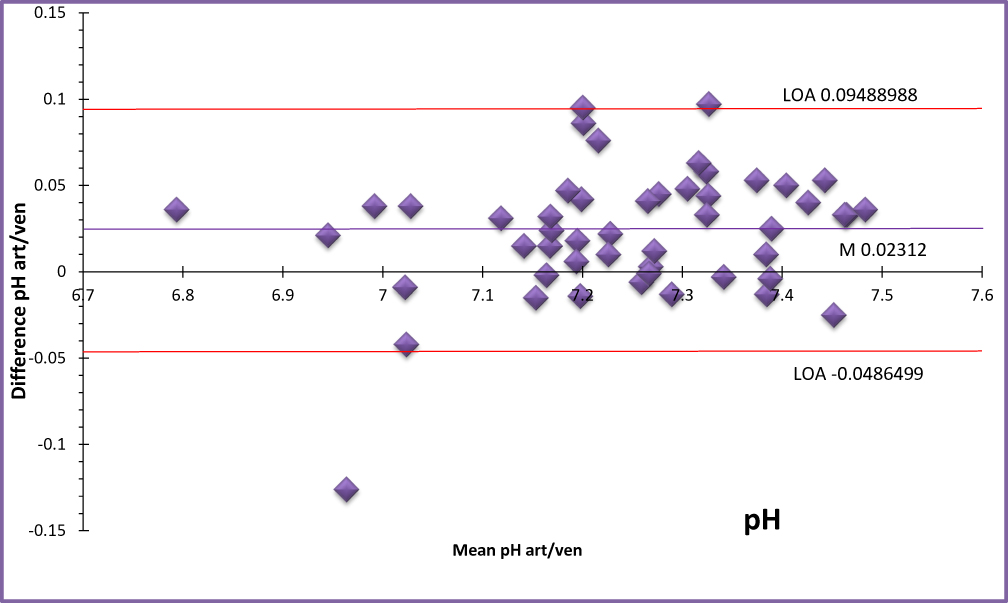 |
Figure 1 Bland–Altman pH. Squares represent individual measurements.Abbreviations: LOA, limits of agreement; art, arterial; ven, venous. |
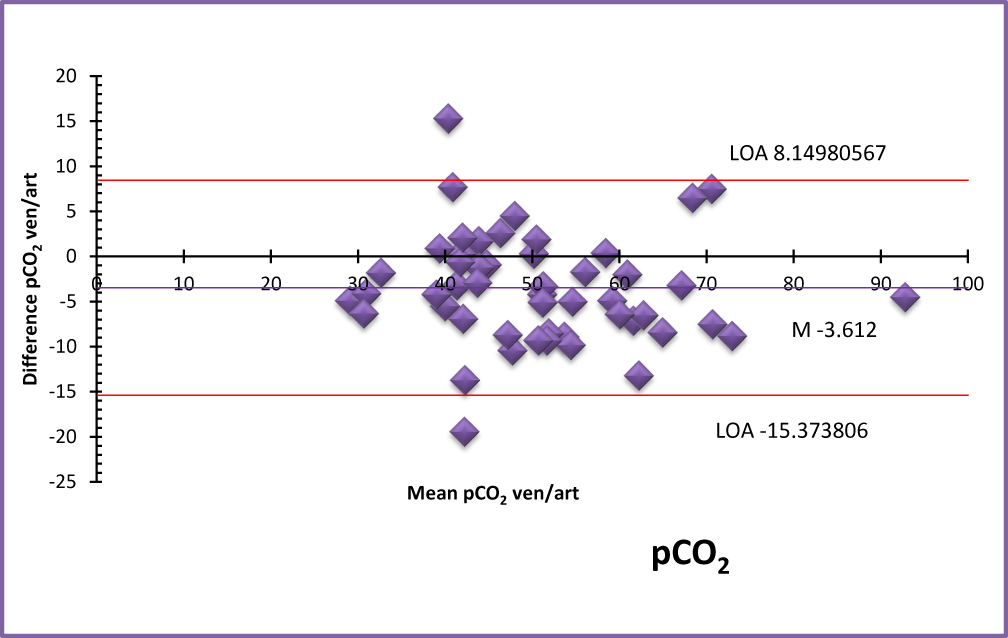 |
Figure 2 Bland–Altman pCO2. Squares represent individual measurements.Abbreviations: LOA, limits of agreement; art, arterial; ven, venous. |
 |
Figure 3 Bland–Altman lactate. Squares represent individual measurements.Abbreviations: LOA, limits of agreement; art, arterial; ven, venous. |
The highest rate of results within the predefined limits was observed for lactate (96% within limits; LOA −2.28 to 2.03 mg/dl) the lowest for pCO2 (52% within limits; LOA −15 to 8.1 mmHg)(Figure 3).
One hundred percent of patients with metabolic alkalosis could be detected and were correctly diagnosed using the venous blood gas. The diagnosis of metabolic acidosis showed a high sensitivity (80.64%), specificity (89.47%) and positive predictive value (92.59%). The answers to lactate acidosis due to AKI showed a specificity and positive predictive value of 100%. The answers to “respiratory adjustment” showed a high sensitivity (91.89%) but a low specificity (38.46%) (Table 2).
We found only a few statistical outliers in our Bland–Altman Plots. One patient had high differences in HCO3- (4.6mmol/l), pCO2 (15.3 mmHg) and BE (6.7 mmol/l). In another patient, we saw those differences in pH (0.126 units), BE (6.8 mmol/l) and lactate (3.4 mmol/l).
Discussion
In this study including intubated adults admitted to the Emergency Department, we aimed at assessing the agreement between venous and arterial blood gas results and whether the use of venous instead of arterial blood gases would lead to a different interpretation of the patients’ conditions (other diagnostic path) or a change in therapy (eg. respirator adjustment). As the acute management of critically ill patients in the ED is commonly based on arterial blood gas results, we were particularly interested in whether acute treatment strategies would change when relying solely on venous blood gas values.
We found a mostly good agreement between venous and arterial blood gas results, which is consistent with previous data (REF). Sixty-six percent of pH measurements were within the set limits. In the literature, similar LOA were accepted suggesting venous pH being a good surrogate parameter.6–8 A previous study done by Kelly et al showed LOA of −0.11 to 0.04 units, similar to our LOA (−0.05 units to 0.09 units).9 Comparing our study results to others we found limits set by Rang et al using a survey.10 Eighty-two percent of our measurements could be found within those limits. The venous pH can be used as a surrogate parameter for the arterial pH. It should be noted, however, that there is no clear data for clinically relevant limits.
Ninety-two percent of HCO3 measurements were within the set limits. Kelly et al showed a mean difference of −1.2 mmol/l and LOA between −5.12 and 2.73 mmol/l.11 In comparison, we found better agreement between venous and arterial bicarbonate (mean difference 0.338 mmol/l, LOA −2.27 to 2.9 mmol/l).
Ninety-three percent of the patients with hypercapnia were correctly identified. Venous pCO2 may thus be used to screen for hypercapnia and for trend monitoring but cannot fully replace the arterial pCO2. This observation reflects previous data.12,13
Ninety-two percent of BE measurements were within the set limits. In the literature, we could find similar mean values and narrower LOA Several previous studies concluded that the venous BE can be used as a surrogate parameter, but data are conflicting.8,14–16 Our results suggest that the venous BE can be used as a surrogate parameter for the arterial BE because of our LOA being narrow enough for the limits we set even though they were wider than most values we found in the literature.
We found excellent agreement between venous and the arterial lactate levels, comparable to previous literature.17 A study from 2016 found a greater difference between arterial and venous lactate if the value is over 4 mmol/l. We could not find any concrete proof for this in our study.18 Hynes et al found a mean difference of 0.16 with LOA of 1.10 to 1.40. Our LOA were wider than in this study.19 This may be due to the different patient population analyzed in this study. Against our initial assumption, peripheral venous lactate levels were not always higher than arterial levels. Thirty-four percent of our patients had higher arterial measurements. Possible explanations are speculative ranging from differences in the puncture site and time of blood sampling to the hemodynamic situation.
Our questionnaire analysis showed that most of the questions were correctly answered using the venous blood gas. One hundred percent of the patients with metabolic alkalosis were correctly diagnosed. 91% of the patients needing respiratory adjustment would have gotten it with the venous blood gas on hand. However, the respirator would have been adjusted for 62% of the patients not needing it.
We attributed these changes to the known differences in pO2 and pCO2 between the venous and the arterial blood gas.
Most of the acid–base disorders can be correctly diagnosed with the venous blood gas, making it a good tool for early interpretation and therapeutic actions before the arterial line is present. Concerning the respirator adjustment, we would recommend using the arterial blood gas as the conclusions drawn from the venous blood gas led to incorrect changes in therapy.
To explain our statistical outliers we tried to find similarities between the cases in question. Most of them can be explained with the severity of the case (sepsis, long resuscitation times, metabolic dysfunction) while for others we could not find any obvious explanation.
Most studies found in the literature investigating the difference between arterial and venous blood gases focused on specific diseases or conditions including COPD, hypercapnia or dyspnea or only on one value. In contrast, we analyzed all consecutive patients who were intubated in the filed and admitted to the Emergency Department independent of the underlying disease. Our study cohort may thus better reflect the patient population encountered in daily clinical practice at an Emergency Department.
Limitations
The study is mainly limited by its small sample size. The lack of clearly defined clinically acceptable limits in the literature further limits the interpretability of our results. A general definition of acceptable limits would be helpful for further studies and clinical practice. Furthermore, our collective included mainly male patients over 50 years. We could only find few extremes in the patients’ vital signs (BP, SpO2, RF). However, the ones we could find were very distinct (BP min-max 70–35; SpO2 min 83; RF min-max 4–22) which indicates that our collective was made up of mostly stable, but also some critically ill patients. This subgroup of intubated patients could be examined more thoroughly in a larger collective.
Conclusion
PH, bicarbonate, BE and lactate from venous blood can be used as surrogates for arterial measurements. Venous pCO2 can be used for screening of hypercapnia and trending. Most acid–base disorders can be correctly diagnosed with the venous blood gas. We would still recommend using an arterial blood gas for correct respirator adjustment.
Disclosure
The authors declare that they have no conflicts of interest in this work.
References
1. Mortensen JD. Clinical sequelae from arterial needle puncture, cannulation, and incision. Circulation. 1967;35(6):1118–1123. doi:10.1161/01.CIR.35.6.1118
2. Bisarya K, George S, El Sallakh S. Case report acute compartment syndrome of the forearm following blood gas analysis postthrombolysis for pulmonary embolism. Eplasty. 2013;13:e15.
3. Dev SP, Hillmer MD, Ferri M. Videos in clinical medicine. arterial puncture for blood gas analysis. N Engl J Med. 2011;364(5):e7. doi:10.1056/NEJMvcm0803851
4. Bland JM, Altman DG. Statistical methods for assessing agreement between two methods of clinical measurement. Lancet Lond Engl. 1986;1(8476):307–310. doi:10.1016/S0140-6736(86)90837-8
5. Allgemeines Krankenhaus der Stadt Wien - Medizinischer Universitätscampus - AKH Wien - Referenzwerte [Internet]. [cited April 9, 2019]. Available from: https://www.akhwien.at/default.aspx?pid=3986.
6. Malatesha G, Singh NK, Bharija A, Rehani B, Goel A. Comparison of arterial and venous pH, bicarbonate, PCO2 and PO2 in initial emergency department assessment. Emerg Med J. 2007;24(8):569–571. doi:10.1136/emj.2007.046979
7. Treger R, Pirouz S, Kamangar N, Corry D. Agreement between central venous and arterial blood gas measurements in the intensive care unit. Clin J Am Soc Nephrol. 2010;5(3):390–394. doi:10.2215/CJN.00330109
8. Middleton P, Kelly A-M, Brown J, Robertson M. Agreement between arterial and central venous values for pH, bicarbonate, base excess, and lactate. Emerg Med J. 2006;23(8):622–624. doi:10.1136/emj.2006.035915
9. Kelly AM, McAlpine R, Kyle E. Venous pH can safely replace arterial pH in the initial evaluation of patients in the emergency department. Emerg Med J. 2001;18(5):340–342. doi:10.1136/emj.18.5.340
10. Rang LCF, Murray HE, Wells GA, Macgougan CK. Can peripheral venous blood gases replace arterial blood gases in emergency department patients? CJEM. 2002;4(1):7–15. doi:10.1017/S1481803500006011
11. Kelly A-M, McAlpine R, Kyle E. Agreement between bicarbonate measured on arterial and venous blood gases. Emerg Med Australas. 2004;16(5–6):407–409. doi:10.1111/j.1742-6723.2004.00642.x
12. Ak A, Ogun CO, Bayir A, Kayis SA, Koylu R. Prediction of arterial blood gas values from venous blood gas values in patients with acute exacerbation of chronic obstructive pulmonary disease. Tohoku J Exp Med. 2006;210(4):285–290. doi:10.1620/tjem.210.285
13. Kelly A-M, Kerr D, Middleton P. Validation of venous pCO2 to screen for arterial hypercarbia in patients with chronic obstructive airways disease. J Emerg Med. 2005;28(4):377–379. doi:10.1016/j.jemermed.2004.10.017
14. Razi E, Nasiri O, Akbari H, Razi A. Correlation of arterial blood gas measurements with venous blood gas values in mechanically ventilated patients. Tanaffos. 2012;11(4):30–35.
15. Malinoski DJ, Todd SR, Slone S, Mullins RJ, Schreiber MA. Correlation of central venous and arterial blood gas measurements in mechanically ventilated trauma patients. Arch Surg. 2005;140(11):1122–1125. doi:10.1001/archsurg.140.11.1122
16. Martin CM, Priestap F. Agreement between venous and arterial blood gas analysis of acid-base status in critical care and ward patients: a retrospective cohort study. Can J Anaesth. 2017;64(11):1138–1143. doi:10.1007/s12630-017-0951-8
17. Mikami A, Ohde S, Deshpande GA, Mochizuki T, Otani N, Ishimatsu S. Can we predict arterial lactate from venous lactate in the ED? Am J Emerg Med. 2013;31(7):1118–1120. doi:10.1016/j.ajem.2013.03.034
18. Theerawit P, Na Petvicharn C, Tangsujaritvijit V, Sutherasan Y. The correlation between arterial lactate and venous lactate in patients with sepsis and septic shock. J Intensive Care Med. 2016.
19. Hynes D, Bates S, Loughman A, Klim S, French C, Kelly A-M. Arteriovenous blood gas agreement in intensive care patients with varying levels of circulatory compromise: a pilot study. Crit Care Resusc. 2015;17(4):253–256.
 © 2019 The Author(s). This work is published and licensed by Dove Medical Press Limited. The full terms of this license are available at https://www.dovepress.com/terms.php and incorporate the Creative Commons Attribution - Non Commercial (unported, v3.0) License.
By accessing the work you hereby accept the Terms. Non-commercial uses of the work are permitted without any further permission from Dove Medical Press Limited, provided the work is properly attributed. For permission for commercial use of this work, please see paragraphs 4.2 and 5 of our Terms.
© 2019 The Author(s). This work is published and licensed by Dove Medical Press Limited. The full terms of this license are available at https://www.dovepress.com/terms.php and incorporate the Creative Commons Attribution - Non Commercial (unported, v3.0) License.
By accessing the work you hereby accept the Terms. Non-commercial uses of the work are permitted without any further permission from Dove Medical Press Limited, provided the work is properly attributed. For permission for commercial use of this work, please see paragraphs 4.2 and 5 of our Terms.