")
Back to Journals » Clinical Epidemiology » Volume 10
Can information on functional and cognitive status improve short-term mortality risk prediction among community-dwelling older people? A cohort study using a UK primary care database
Authors Sultana J , Fontana A , Giorgianni F, Basile G, Patorno E, Pilotto A, Molokhia M , Stewart R, Sturkenboom M , Trifirò G
Received 4 July 2017
Accepted for publication 11 October 2017
Published 19 December 2017 Volume 2018:10 Pages 31—39
DOI https://doi.org/10.2147/CLEP.S145530
Checked for plagiarism Yes
Review by Single anonymous peer review
Peer reviewer comments 2
Editor who approved publication: Professor Henrik Sørensen
Janet Sultana,1,2 Andrea Fontana,3 Francesco Giorgianni,1 Giorgio Basile,1 Elisabetta Patorno,4 Alberto Pilotto,5 Mariam Molokhia,6 Robert Stewart,7 Miriam Sturkenboom,2 Gianluca Trifirò1,2
1Department of Biomedical and Dental Sciences and Morphofunctional Imaging, University of Messina, Messina, Italy; 2Department of Medical Informatics, Erasmus University Medical Centre, Rotterdam, the Netherlands; 3Unit of Biostatistics, IRCCS Casa Sollievo della Sofferenza, San Giovanni Rotondo, Italy; 4Division of Pharmacoepidemiology and Pharmacoeconomics, Department of Medicine, Brigham and Women’s Hospital and Harvard Medical School, Boston, USA; 5Geriatrics Unit, Department of Geriatric Care, Ortho Geriatrics and Rehabilitation, Frailty Area, E.O. Galliera Hospital, Genova, Italy; 6Department of Primary Care and Public Health Sciences, King’s College, London, UK; 7Department of Psychological Medicine, Institute of Psychiatry, Psychology and Neuroscience King’s College London, UK
Background: Functional and cognitive domains have rarely been evaluated for their prognostic value in general practice databases. The aim of this study was to identify functional and cognitive domains in The Health Improvement Network (THIN) and to evaluate their additional value for the prediction of 1-month and 1-year mortality in elderly people.
Materials and methods: A cohort study was conducted using a UK nationwide general practitioner database. A total of 1,193,268 patients aged 65 years or older, of whom 15,300 had dementia, were identified from 2000 to 2012. Information on mobility, dressing and accommodation was recorded frequently enough to be analyzed further in THIN. Cognition data could not be used due to very poor recording of data in THIN. One-year and 1-month mortality was predicted using logistic models containing variables such as age, sex, disease score and functionality status.
Results: A significant but moderate improvement in 1-year and 1-month mortality prediction in elderly people was observed by adding accommodation to the variables age, sex and disease score, as the c-statistic (95% confidence interval [CI]) increased from 0.71 (0.70–0.72) to 0.76 (0.75–0.77) and 0.73 (0.71–0.75) to 0.79 (0.77–0.80), respectively. A less notable improvement in the prediction of 1-year and 1-month mortality was observed in people with dementia.
Conclusion: Functional domains moderately improved the accuracy of a model including age, sex and comorbidities in predicting 1-year and 1-month mortality risk among community-dwelling older people, but they were much less able to predict mortality in people with dementia. Cognition could not be explored as a predictor of mortality due to insufficient data being recorded.
Keywords: elderly, frailty, database, mortality
Introduction
The past 2 decades have seen a significant increase in the number of observational studies investigating drug safety using electronic health care databases, particularly in elderly populations. Mortality is a widely explored outcome in such pharmacoepidemiological studies.1 However, the data sources used to carry out such studies usually capture information that is limited to demographic information, medical history (diagnoses, laboratory results and medical procedures) and drug prescribing.2 As a result, pharmacoepidemiological studies investigating the risk of death and other outcomes may suffer from unmeasured confounding due to frailty, if this remains unmeasured and unaccounted for in analyses. To date, there is no gold standard method of measuring frailty although a recent review suggests that a frailty index consisting of comorbidities and health care claims which are indicative of frailty may be the best approach toward adjusting risk estimates in observational studies based on claims data.2
In clinical practice, the two most commonly used models of frailty are: 1) the phenotype model, defined by unintended weight loss, fatigue, general weakness, reduced walking speed and limited physical activity,3 and 2) the cumulative deficit model, defined by comorbidities and impaired functionality or disability.4 Although a recently published study proposed a composite “frailty” score for primary care databases containing disease and non-disease indicators of health,5,6 the value of individual non-disease indicators of frailty as predictors of mortality in such data sources remains unknown.
The aim of this study was therefore to investigate, using a large primary care database: 1) how frequently data on cognitive and functionality status are recorded in elderly community-dwelling people, and 2) the extent to which cognitive and functional status improve the prediction of mortality beyond commonly used covariates such as age, sex and comorbidities.
Materials and methods
Data source and study population
The Health Improvement Network (THIN) database was used to carry out the study. THIN contains electronic patient data recorded by general practitioners (GPs) during routine clinical practice and currently has anonymized clinical data for 11 million people (covering approximately 6.2% of the UK population) registered with 562 general practices across the UK. Demographic data in THIN are found in a patient file containing patient’s date of birth, date of death where applicable, sex, date of registration within the database, and registration status within the database (i.e., whether the patient is active or has been transferred out of the database). All people in the database have a unique and de-identified code that is used to link the patient file with other files, such as the medical file. The medical file contains medical diagnoses, related information, such as information on functional and cognitive domains, and the date when this information was recorded. Data on medical diagnoses in the medical file are coded using Read codes, the standard clinical terminology system that is used in general practice in the UK. THIN also has a prescription file that contains data on prescribed drugs, such as the date of prescription, the generic name, the strength and the formulation of the prescribed drug. Drug information is coded through British National Formulary (BNF) and Multilex codes. The current study did not involve direct contact with human participants since all the data used were collected retrospectively during routine clinical practice. All patient-level data used were anonymized. The current study was part of a larger study approved by the EPIC Scientific Review Committee (SRC 13-085). Written patient consent was not required as all data was anonymized and analyzed retrospectively.
Within THIN, a cohort of people aged 65 years and older, as well as a sub-cohort of people in this age range having a dementia diagnosis, was identified. Patients in the cohort of elderly people were included in the study if they were aged 65 years and older with at least 1 year of database history. The study period started from January 1, 2000, and extended to May 31, 2012 (last data drawn). The cohort entry date was therefore the date at which 1 year of database history was accumulated, the date at which people reached 65 years of age or January 1, 2000, whichever came last.
Demographics and clinical history
Demographic characteristics (age and sex) were evaluated at the cohort entry date, while clinical characteristics were evaluated any time prior to the cohort entry date. The comorbidities chosen to describe the health status of the study population consisted of 15 diseases that are part of the Quality and Outcomes Framework (QOF) program, a voluntary scheme available to all GPs in the UK which incentivizes GPs to register certain diseases:5 asthma, atrial fibrillation, cancer (excluding non-melanotic skin cancer), chronic kidney disease stages 3–5, chronic obstructive pulmonary disease, coronary heart disease, dementia, depression, diabetes, epilepsy, heart failure, hypertension, hypothyroidism, psychosis, schizophrenia, bipolar disorders and stroke/transient ischemic attack. However, the disease score employed in the current study consists of only nine out of the 15 QOF diseases that were found to be predictive of mortality with a hazard ratio of 1.2 or higher (i.e., the standard QOF score) according to the original paper by Carey et al.5 The following weights were applied to each of the nine QOF diseases based on the size of the hazard ratio, thus quantifying the association between that disease and mortality in elderly people: 1 point was assigned to atrial fibrillation, 3 points were assigned to cancer; 2 points were assigned to chronic obstructive pulmonary disease, 3 points were assigned to dementia, 1 point was assigned to diabetes, 2 points were assigned to epilepsy, 2 points were assigned to heart failure, 2 points were assigned to psychosis, schizophrenia and bipolar disease, 1 point was assigned to stroke or transient ischemic attack. These diseases were identified in THIN using Read codes (Supplementary materials).
Functional and cognitive domains
The THIN medical file was searched for Read codes related to the following functional/cognitive domains as identified in a comprehensive geriatric assessment chart previously used in geriatric epidemiological research:7,8 nursing home resident or otherwise, activities of daily living (bathing, cooking, dressing, feeding, house cleaning, money management, personal hygiene and toileting), nursing needs (bladder or bowel incontinence, nasogastric tube or other feeding tube, nephrostomy, long-term oxygen treatment, tracheostomy and urinary catheter), the presence of pressure sores, independence in mobility, and cognitive decline. Once the most frequently recorded functional and cognitive codes were identified, these were grouped into functional/cognitive domains, i.e., umbrella terms for a particular aspect of functional/cognitive ability such as mobility (Supplementary materials). Functional and cognitive domains were categorized into two or more levels to allow the identification of patients who were frailer than others, thus accounting for severity. For example, a functional/cognitive domain level would be given a value of 0 if it indicated good mobility and 1 if it indicated poor mobility (Supplementary materials).
The proportion of functional and cognitive domains identified in THIN was calculated by dividing the number of patients with at least one relevant code recorded in the medical file from 2000 to 2012 by the number of eligible patients during the study period. This was performed to identify which functional and cognitive domains were recorded frequently enough to be included in the mortality prediction (arbitrarily defined as a threshold of at least 5,000 people based on preliminary patient frequencies).
For the cohort of elderly people as well as people with dementia having a recorded functional and cognitive domain, the index date was assigned as the date when subjects had a first recorded functional/cognitive domain. Age and comorbidities were reevaluated at this date.
Statistical analysis
Demographic and clinical characteristics were reported as mean ± standard deviation (SD) or median (interquartile range) and frequency (percentage) for continuous and categorical variables, respectively.
The crude mortality rates within 1 year of follow-up (events per 100 person-years) and the crude mortality rates within 1 month of follow-up (events per 100 person-months) after the first-recorded functional/cognitive domains were calculated starting from the index date for all people aged 65 years and older and those with dementia, separately. This was performed by dividing the number of deaths by the number of person-years or person-months at risk, and multiplying this by 100.
Multivariable logistic models were fitted to predict 1-year and 1-month mortality risk and were applied to: 1) all patients, and 2) patient subgroups within each functional/cognitive domain. When considering all patients, the discriminatory ability (i.e., the ability to distinguish subjects who will die from those who will not) achieved by a model, which included patient’s age and sex only (model 1), was evaluated and compared to the discriminatory ability achieved by a new model additionally including the QOF comorbidity score (model 2). When considering patient subgroups, the discriminatory ability of the model which included patient’s age, sex and QOF comorbidity score was compared to that achieved by a new model which further included the functional and cognitive domains (model 3).
The discriminatory ability achieved by each model was assessed by computing the area under the receiver operating characteristic (ROC) curve (AUC; also known as the c-statistic) along with its 95% confidence interval (95% CI).9 Comparisons between the c-statistics estimated from different models were performed following the DeLong et al method,10 and improvement in discriminatory ability was further evaluated by the integrated discrimination improvement (IDI).11 In comparing the models, the IDI measures the increment in the predicted probabilities for the subset developing the event and the decrement for the subset not developing the event. It can also be interpreted as the change in R2 coefficient obtained by adding the new covariate to the model (the magnitude of this change depends on the discriminatory ability provided by the model without the covariate). Moreover, the calibration of the models was evaluated. Calibration reflects the extent to which the predicted probabilities and actual probabilities agree, and two well-known statistics were estimated: the calibration in the large and the calibration slope.12 The calibration can be described by an intercept, which indicates the extent to which predictions are systematically too low or too high (calibration in the large), and a calibration slope, which should be 1.13
A two-sided p-value <0.05 was considered for statistical significance. All data management and statistical analyses were conducted using SAS version 9.4 (SAS Institute Inc., Cary, NC, USA).
Subgroup and sensitivity analysis
The multivariable logistic models were stratified by sex to see whether mortality prediction differed between males and females. Moreover, to evaluate the presence of a potential selective registration of the functional/cognitive domains, mortality rates and Kaplan–Meier curves were estimated within 1 year of follow-up among people aged 65 years and older in THIN with and without a functional/cognitive domain recorded, irrespective of functional/cognitive domain severity.
Results
Cohort characteristics
From 2000 to 2012, 1,193,268 people aged 65 years or older were identified in THIN. The mean (SD) age of this study population was 70.7 (6.8) years and 55% were male (Supplementary materials). The dementia cohort included 15,300 people of whom 65% were males, with a mean (SD) age of 79.3 (6.2) years. The overall median survival time of the full cohort (survival from the cohort entry date until their date of death) was 5.5 years (interquartile range: 2.5–9.9), while this was lower in people with dementia, at 1.8 years (interquartile range: 0.8–3.5).
Within 1 year of follow-up, the crude mortality rate among all people aged 65 years and older was 3.0 per 100 person-years (34,337 deaths observed in 1,138,128 person-years), while the crude mortality rate estimated within 1 month of follow-up was 0.3 per 100 person-months (3,166 deaths observed in 1,189,315 person-months). Among people with a dementia diagnosis, the crude mortality rate at 1 year of follow-up was 13.0 per 100 person-years (1,656 deaths observed in 12,778 person-years) while the crude mortality rate within 1 month of follow-up was 1.1 per 100 person-months (171 deaths observed in 15,083 person-months).
Functional and cognitive domains
After the functional and cognitive domains found in THIN were defined, it was found that mobility (4.6%), accommodation (2.0%) and dressing ability (0.4%) were the most commonly recorded, each exceeding a threshold of 5,000 people with a recorded code (Table 1); therefore, only these domains were used to evaluate improvement in the model’s prognostic ability. The mobility domain was a two-level variable (i.e., 0 = good mobility, 1 = poor mobility), accommodation was a three-level variable (i.e., 0 = lives with relatives or not alone, 1 = lives alone in noninstitutional accommodation, 2 = lives in nursing home or other institutional accommodation) and dressing ability was a two-level variable (i.e., 0 = independent, 1 = dependent). As shown in Supplementary materials, all of three domains were recorded for only 217 (0.02%) people.
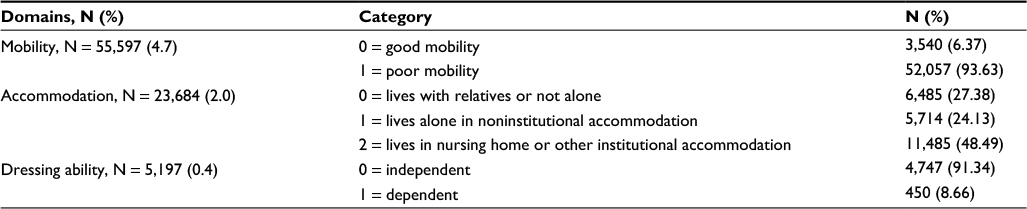 | Table 1 Most commonly registered functional domains in THIN among all patients aged 65 years or older Abbreviation: THIN, The Health Improvement Network. |
Prediction of 1-year and 1-month mortality in elderly people
Compared to the model based on age and sex only, the inclusion of the QOF comorbidity score significantly improved the model’s prediction accuracy of 1-year mortality in patients ≥65 years, with the c-statistic increasing from 0.78 (95% CI: 0.78–0.79) to 0.82 (0.81–0.82) (p-value <0.001; Table 2). All functional domains statistically improved the discriminatory power of the models. Compared to age, sex and QOF comorbidity score, the greatest improvement in prediction accuracy was found for accommodation, as shown by an increase in c-statistic from 0.71 (0.70–0.72) to 0.76 (0.75–0.77) (p-value <0.001) as well as by a higher IDI, at 0.036 (0.033–0.039) (p-value <0.001). Overall, the functional domains predicted 1-month mortality slightly better than 1-year mortality in the wider cohort (Table 3). The models for all elderly people were found to be highly calibrated based on the calibration in the large and calibration in the slope statistics (Supplementary materials).
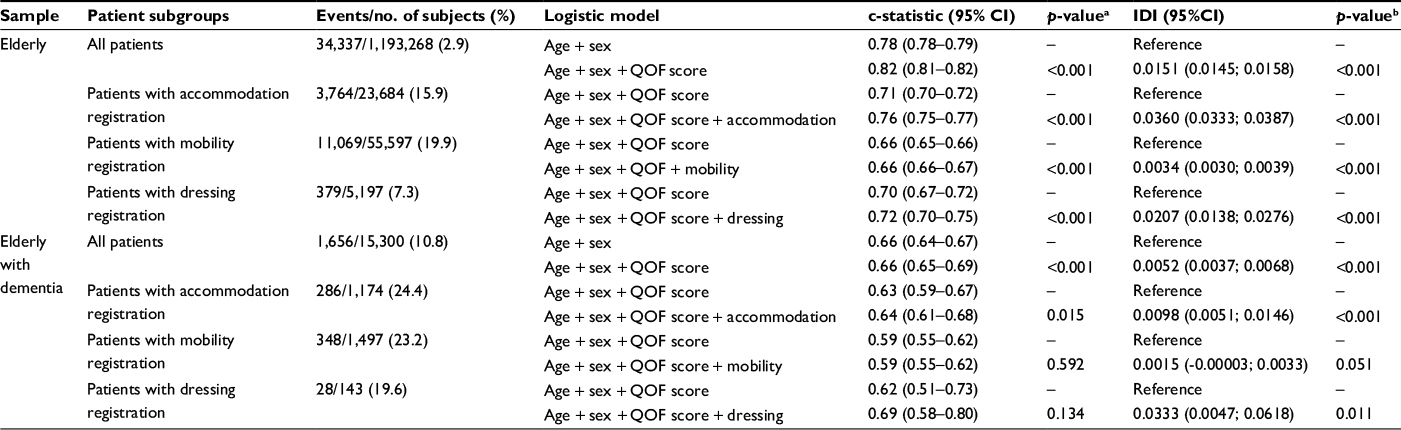 | Table 2 One-year mortality risk prediction in a cohort of patients aged 65 years and older, and those with dementia in THIN Notes: ap-value from DeLong test for difference between the two c-statistics. bp-value from test that IDI is not significantly different from zero. Abbreviations: CI, confidence interval; IDI, integrated discrimination improvement; QOF, Quality and Outcomes Framework; THIN, The Health Improvement Network. |
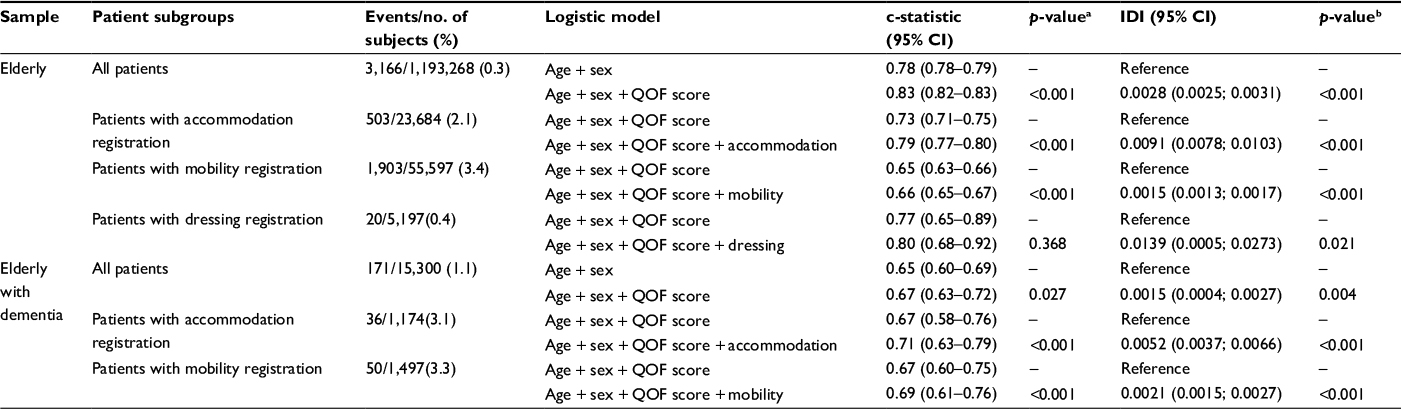 | Table 3 One-month mortality prediction in a cohort of patients aged 65 years and older, and those with dementia in THIN Notes: ap-value from DeLong test for difference between the two c-statistics. bp-value from test that IDI is not significantly different from zero. Abbreviations: CI, confidence interval; IDI, integrated discrimination improvement; QOF, Quality and Outcomes Framework; THIN, The Health Improvement Network. |
Prediction of 1-year and 1-month mortality in elderly people with dementia
In the sub-cohort with dementia, only accommodation statistically improved the model’s prediction accuracy of 1-year mortality, albeit very modestly, with the c-statistic increasing from 0.63 (0.59–0.67) to 0.64 (0.61–0.68) (p-value 0.015) and an IDI value of 0.0098 (0.005–0.015) (p-value <0.001; Table 2). The model’s prediction accuracy in the dementia sub-cohort was relatively poor for 1-month mortality, as indicated by the lack of improvement in model discrimination when the QOF comorbidity score was added to age and sex as predictors (Table 3). Accommodation and mobility improved the 1-month mortality prediction modestly in the dementia sub-cohort with c-statistics increasing from 0.67 (0.58–0.76) to 0.71 (0.63–0.79) and 0.67 (0.60–0.75) to 0.69 (0.61–0.76), respectively (p-value <0.001 for both). The effect of dressing on the logistic models predicting 1-month mortality in patients with dementia could not be evaluated as there were too few patients (n = 143) with data recorded for this domain and very low number of events (n = 2). The models for all elderly people with dementia were also found to be highly calibrated based on the calibration in the large and calibration in the slope statistics (Supplementary materials).
Subgroup and sensitivity analysis
The subgroup analyses showed that there was no major difference between mortality prediction at 1 year and 1 month for females and males in either the full cohort or the dementia cohort, despite high model calibration (Supplementary materials). Post hoc analyses aiming to shed light on potential selective recording of functional domains identified showed that having a recorded functional/cognitive domain (irrespective of severity) was associated with higher mortality rates than not having a functional/cognitive domain at all (Supplementary materials). This difference was most pronounced for mobility and accommodation and less so for dressing.
Discussion
Findings in context
The main finding from this study is that information on functional domains found in a large primary care database moderately improves the prediction mortality at 1 year, and to a lesser extent at 1 month in mortality in elderly people, when included in a model in addition to age, sex and a comorbidity (QOF) score. This finding suggests that electronic primary health care databases such as THIN have currently unused potential to provide a more global assessment of geriatric health status compared to the standard diagnostic and prescription data that are usually used in pharmacoepidemiology studies. In addition, functionality status may possibly be used to address residual confounding. A recent study was able to develop an electronic frailty index using proxies of frailty in THIN to identify people with mild, moderate and severe frailty, taking into account a range of deficits, including clinical signs, symptoms, diseases and disabilities. This frailty index is an important development for future research conducted in electronic health care databases, suggesting that such data sources should be explored for their potential to harness frailty-related data in elderly people.
Accommodation was found to be the best predictor of mortality at 1 year among older people, more generally, and those with dementia specifically, most likely because people who live relatively independently or have social support are likely to be healthier overall than those who are institutionalized.14 Based on our classification of severity for this domain, people living with relatives or not alone were considered to have the lowest risk of death while those living in a nursing home were considered to have the highest risk of death. The assumption underlying this choice was that people not living alone may have a greater social and medical support, leading to a potentially low degree of frailty, while people in a nursing home are already a much frailer population and therefore may be at higher risk of death. The latter was shown to be true using THIN database.15 Based on the performance of the age-, sex- and comorbidity-adjusted models, we can conclude that the findings support our reasoning. Due to the limited information available on the nature of the living arrangements, the classification system used was however very simple and did not reflect the actual variety of such arrangements, each of which may have a different implication for functionality.16
Data on cognition, a domain with great potential for the identification of frailty, in particular in people with dementia, was very poorly recorded in this database and as a result could not be used to predict mortality. In general, among people with dementia, the functional domains were much less powerful in predicting mortality compared to those in elderly people overall. This is likely to be because a population with heterogeneous traits is a prerequisite for the prediction analysis, whereas the presence of a dementia diagnosis could result in the selection of a population with more homogeneous health risks. As a result, future pharmacoepidemiological research restricting similar analyses solely to people with dementia may be similarly subject to such limitations in the prediction of mortality. It may be worth exploring whether the functionality domains identified have other applications.
As expected, the number of deaths was substantially reduced when considering a time window of 1 month, leading to a significant loss of statistical power. As a result, findings regarding 1-month mortality should be interpreted with caution. Educational interventions to promote the systematic assessment and recording of data on functional status for elderly people by GPs could improve the identification of frail patients, even within such short time frames in general medical practice. This in turn could inform clinicians on which category of patients requires more cautious pharmacological management, thus optimizing the quality of care in clinical practice on a large scale. There are currently existing databases that contain systematically recorded frailty data. An example is the Arianna database, a general practice database in Caserta (Campania region, Italy) where data on functional status (using the Barthel scale or Barthel index), mobility, accommodation, comprehension of language, hearing and visual impairment and mental health (using the Short Portable Mental Status Questionnaire [SPMSQ]) is recorded systematically by GPs for approximately 75% of people aged 65 years and older.17 Another example is the systematic registration of results of the SPMSQ, the Barthel index and the Exton-Smith Pressure Sore Scale, as well as nursing care requirements and social network support for all elderly people requesting nursing home admission or home-based nursing assistance from the national health care system in Padua (Veneto region, Italy). These data are available in the Administrative Repository Database of the ULSS 16 in Padova.8
Strengths and limitations
A primary strength of this study is its novelty in systematically searching a large primary care database containing 11 million people for functional and cognitive domains and the evaluation of these indicators as predictors of mortality. The use of comorbidities and functional domains that relate to impaired functionality is consistent with the cumulative deficit model of frailty,4 and currently developed electronic frailty index.6 Given the close link between accommodation status (e.g., institutional care), disability (based on independence or otherwise in the two activities of daily living evaluated) and frailty, we consider the choice of these functional domains to be justified as proxies of frailty and potential risk factors for death. Indeed, these domains were shown to be clinically meaningful as components of a frailty score in predicting mortality in previous work from which the functional domains in the current study were derived.7,8,17,18 A major strength of the current study is the use of the QOF comorbidity score as a reference model when comparing the performance of the functional and cognitive domains, since the QOF comorbidity score has been recently used and validated in a cohort of elderly people identified in THIN and found to predict mortality better than the Charlson comorbidity score. The models themselves were thoroughly tested for discrimination and calibration. The current study also investigated the value of data on functionality status in view of potential selective data recording on the prediction of mortality, which to our knowledge has not been done previously.
However, this study also has some limitations. The prevalence of selected diseases, including dementia, identified in THIN may be lower than expected. The reason for this is that data are recorded during routine medical practice and not for direct research purposes. This may affect the generalizability of the results but not the validity. The number of people with at least one functionality domain recorded was low, and is therefore unlikely to reflect the real proportion of functionality problems in all elderly people. The predictive accuracy of the logistic models used was contingent on the frequency of functional domain codes recorded in the database, which was found to be generally low. In addition, the discriminatory power of the models was limited by the relatively narrow range of risk factors, that is, age, sex and the QOF morbidity score. While a greater variety and volume of functionality data would have improved the discrimination of the models, the current study highlights that the prediction of mortality is nevertheless improved moderately in older people even using limited data on functional domains. The information available on functional domains was simple compared to the complexity and range of possible impairment, which we had to limit description of to binary variables for mobility and dressing ability, and to three simple categories for accommodation. Although the impact of multiple functionality problems on the risk of mortality in elderly people is important, given that elderly people may very well have more than one functionality impairment, it was not possible to study this due to the very low number of people with more than one functionality problem. The QOF comorbidity score did not improve mortality prediction as significantly in people with dementia, suggesting that factors other than those analyzed may have played a role in the mortality risk among these patients. In fact, the inclusion of accommodation in the logistic models predicting mortality at 1 year and 1 month in people with dementia improved the prediction of mortality (compared to the model including age, sex and QOF morbidity score) more than the inclusion of the QOF morbidity score (compared to the model including only age and sex). Furthermore, post hoc analysis showed that functionality variables were selectively recorded among people who appeared to be at higher risk of death. While this reduces the generalizability of results to people not having a functionality code recorded, the validity of the findings for people with a functionality code recorded is not affected.
Conclusion
The limited data recorded on functionality domains in a large UK primary care database moderately improved the prediction of mortality in elderly people and were much less powerful when predicting mortality in people with dementia. Data on cognition were recorded too poorly for this domain to be explored as a predictor of mortality. Such proxies of frailty may be of value in accounting for some unmeasured confounding in epidemiologic analyses, provided that the limitations of this data are well understood.
Acknowledgments
This study was supported by the Italian Health Ministry in the context of the Project “Assessment of the safety of antipsychotic drugs in elderly with dementia: an international, population-based study using healthcare databases” (grant number GR-2009-1607316). This work was also supported through the MPI_AGE European project co-funded by the Consumers, Health, Agriculture and Food Executive Agency (CHAFEA) in the framework of the European Innovation Partnership on Active and Healthy Aging Second Health Program 2008–2013. The contents of this paper are the sole responsibility of the authors and can under no circumstances be regarded as reflecting the position of the European Union. The funders played no role in the selection of study design; in the collection, analysis and interpretation of data; in the writing of the report and in the decision to submit the paper for publication.
Disclosure
The authors report no conflicts of interest in this work.
References
Trifiró G, Sultana J, Spina E. Are the safety profiles of antipsychotic drugs used in dementia the same? An updated review of observational studies. Drug Saf. 2014;37(7):501–520. | ||
Kim DH, Schneeweiss S. Measuring frailty using claims data for pharmacoepidemiologic studies of mortality in older adults: evidence and recommendations. Pharmacoepidemiol Drug Saf. 2014;23(9):891–901. | ||
Fried LP, Tangen CM, Walston J, et al; Cardiovascular Health Study Collaborative Research Group. Frailty in older adults: evidence for a phenotype. J Gerontol A Biol Sci Med Sci. 2001;56(3):M146–M156. | ||
Rockwood K, Mitnitski A. Frailty in relation to the accumulation of deficits. J Gerontol A Biol Sci Med Sci. 2007;62(7):722–727. | ||
Carey IM, Shah SM, Harris T, DeWilde S, Cook DG. A new simple primary care morbidity score predicted mortality and better explains between practice variations than the Charlson index. J Clin Epidemiol. 2013;66(4):436–444. | ||
Clegg A, Bates C, Young J, et al. Development and validation of an electronic frailty index using routine primary care electronic health record data. Age Ageing. 2016;45(3):353–360. | ||
Pilotto A, Gallina P, Fontana A, et al. Development and validation of a Multidimensional Prognostic Index for mortality based on a standardized Multidimensional Assessment Schedule (MPI-SVaMA) in community- dwelling older subjects. J Am Med Dir Assoc. 2013;14(4):287–292. | ||
Pilotto A, Panza F, Copetti M, et al; MPI_AGE Project Investigators. Statin treatment and mortality in community-dwelling frail older patients with diabetes mellitus: a retrospective observational study. PLoS One. 2015;10(6):e0130946. | ||
Hanley JA, McNeil BJ. The meaning and use of the area under a receiver operating characteristic (ROC) curve. Radiology. 1982;143(1):29–36. | ||
DeLong ER, DeLong DM, Clarke-Pearson DL. Comparing the areas under two or more correlated receiver operating characteristic curves: a nonparametric approach. Biometrics. 1988;44(3):837–845. | ||
Pencina MJ, D’Agostino RB Sr, D’Agostino RB Jr, Vasan RS. Evaluating the added predictive ability of a new marker: from area under the ROC curve to reclassification and beyond. Stat Med. 2008;27(2):157–172. | ||
Debray TP, Vergouwe Y, Koffijberg H, Nieboer D, Steyerberg EW, Moons KG. A new framework to enhance the interpretation of external validation studies of clinical prediction models. J Clin Epidemiol. 2015;68(3):279–289. | ||
Steyerberg EW, Vickers AJ, Cook NR, et al. Assessing the performance of prediction models: a framework for traditional and novel measures. Epidemiology. 2010;21(1):128–138. | ||
Tabue-Teguo M, Kelaiditi E, Demougeot L, Dartigues JF, Vellas B, Cesari M. Frailty index and mortality in nursing home residents in France: results from the INCUR study. J Am Med Dir Assoc. 2015;16(7):603–606. | ||
Shah SM, Carey IM, Harris T, DeWilde S, Cook DG. Mortality in older care home residents in England and Wales. Age Ageing. 2013;42(2):209–215. | ||
Müller F, Hagedoorn M, Tuinman MA. Chronic multimorbidity impairs role functioning in middle-aged and older individuals mostly when non-partnered or living alone. PLoS One. 2017;12(2):e0170525. | ||
Guerriero F, Orlando V, Tari DU, et al. How healthy is community-dwelling elderly population? Results from Southern Italy. Transl Med UniSa. 2016;13:59–64. eCollection 2015. | ||
Angleman SB, Santoni G, Pilotto A, Fratiglioni L, Welmer AK; MPI_AGE Project Investigators. Multidimensional Prognostic Index in association with future mortality and number of hospital days in a population-based sample of older adults: results of the EU funded MPI_AGE project. PLoS One. 2015;10(7):e0133789. |
 © 2017 The Author(s). This work is published and licensed by Dove Medical Press Limited. The full terms of this license are available at https://www.dovepress.com/terms.php and incorporate the Creative Commons Attribution - Non Commercial (unported, v3.0) License.
By accessing the work you hereby accept the Terms. Non-commercial uses of the work are permitted without any further permission from Dove Medical Press Limited, provided the work is properly attributed. For permission for commercial use of this work, please see paragraphs 4.2 and 5 of our Terms.
© 2017 The Author(s). This work is published and licensed by Dove Medical Press Limited. The full terms of this license are available at https://www.dovepress.com/terms.php and incorporate the Creative Commons Attribution - Non Commercial (unported, v3.0) License.
By accessing the work you hereby accept the Terms. Non-commercial uses of the work are permitted without any further permission from Dove Medical Press Limited, provided the work is properly attributed. For permission for commercial use of this work, please see paragraphs 4.2 and 5 of our Terms.