")
Back to Journals » International Journal of Nanomedicine » Volume 17
Camptothecin-Loaded and Manganese Dioxide-Coated Polydopamine Nanomedicine Used for Magnetic Resonance Imaging Diagnosis and Chemo-Photothermal Therapy for Lung Cancer
Authors Su M, Chen Y, Jia L , Zhang Z
Received 21 January 2022
Accepted for publication 8 November 2022
Published 28 December 2022 Volume 2022:17 Pages 6687—6705
DOI https://doi.org/10.2147/IJN.S359300
Checked for plagiarism Yes
Review by Single anonymous peer review
Peer reviewer comments 4
Editor who approved publication: Professor Lei Yang
Mingliang Su,* Yukun Chen,* Lijun Jia, Zhanxia Zhang
Cancer Institute, Longhua Hospital, Shanghai University of Traditional Chinese Medicine, Shanghai, 200032, People’s Republic of China
*These authors contributed equally to this work
Correspondence: Lijun Jia; Zhanxia Zhang, Email [email protected]; [email protected]
Introduction: Camptothecin (CPT) is a cytotoxic quinolone alkaloid (isolated from a traditional Chinese medicine Camptotheca acuminata), used for the treatment of various malignancies, which inhibits DNA topoisomerase I (Topo I). However, its drawbacks, such as poor water solubility, stability, and highly toxic side effects, limit its clinical application. Therefore, CPT needs to be prepared as a nanomedicine to improve solubility, reduce side effects, and synergize with other therapies to improve efficacy.
Methods: In this work, we constructed CPT NPs (nanoparticles), which were CPT-loaded and manganese dioxide (MnO2)-coated polydopamine (PDA) nanomedicine. In vitro, we explored the antitumor effect including CPT NPs-induced cell proliferation inhibition, apoptosis and ferroptosis for tumor cell lines. In vivo, we established LLC tumor-bearing mice model to evaluate their tumor imaging and anticancer effects.
Results: CPT NPs improve the water solubility and stability of CPT and reduce its toxic effects. It has good biocompatibility, excellent photothermal conversion ability for photothermal therapy (PTT) and pH release in the tumor microenvironment. It can inhibit tumor cell proliferation, induce apoptosis and result in ferroptosis of tumor cells. More significantly, this nanomedicine can provide information for the location and diagnosis of tumors via magnetic resonance imaging. In general, the nanomedicine integrated with diagnosis and treatment has excellent anticancer effect.
Discussion: Altogether, this nanomedicine possesses the ability to diagnose and therapy through magnetic resonance imaging and chemo-photothermal therapy, respectively. In addition, the integrated diagnosis and treatment nanomedicine has potential clinical application prospects through treating lung cancer with high efficiency and low side effect. It can support the construction of related nano-delivery systems.
Graphical Abstarct:
Keywords: photothermal therapy, ferroptosis, NMR imaging, pH response, camptothecin
Graphical Abstract:
Lung cancer originates from bronchial mucosa or glands. It is one of the foremost common dangerous tumors within the world, with a very high mortality rate (22%) and a relatively poor prognosis (19% of 5-year relative survival rate).1 However, western medicine surgery, chemotherapy drugs, targeted treatment and immunotherapy adapt possess large trauma, high toxic side effects, drug resistance and limited population, respectively.2–4 Treatment of lung cancer still faces great challenges. Therefore, it is imperative to develop ideal cancer drugs with excellent efficacy to tumor tissue and low potential toxicity to normal tissue.
In recent years, various natural products have been extensively explored for their therapeutic uses, such as antitumor, anti-infection and anti-bacteria, which have played an important role in improving human health.5,6 Especially, antitumor active materials isolated from traditional Chinese medicine have become the hot subject of anti-cancer drugs due to their excellent anti-cancer efficacy. Conventional Chinese anticancer drugs mainly include paclitaxel, camptothecin, vinblastine, homoharringtonine, etc.7 Camptothecin (CPT) is a common plant anticancer drug, which is extracted from camptotheca acuminata in south-central and south-western China.8 It is a cytotoxic quinoline alkaloid by inhibiting DNA topoisomerase I (Topo I).9 It possesses superior antitumor efficacy, anti-proliferation effect, apoptosis induction ability in breast, lung, colon, ovarian, melanoma and other cancers.10–14 However, the inherent disadvantages of high side effects, poor water-solubility and structural instability of CPT limit its clinical application.15 Scientists strive to improve the performance of CPT through a variety of means to meet the requirements of clinical applications, such as structural modification, nanoformulation, prodrugs, etc.16–18
Nanomedicine has enormously superiority to cancer treatment due to its advantages of the prolonged elimination half-life of drugs, penetration through body barriers (eg, blood–brain barrier), targeted delivery, controlled release, etc.19 Photothermal therapy (PPT), as a new anti-cancer method based on nanomaterials, has pulled in scientists’ consideration due to its advantages of non-invasive, simple process, high efficiency and low side effects, etc.20,21 An increasing number of photothermal reagents are being developed, such as pH-sensitive near-infrared (NIR) dye nanoparticles, NIR-II dye formazanate boron difluoride formazanate nanoparticles and photothermal nanofibres.22–24 The NIR light with a strong penetrating ability is served as an energy source. The nano-photothermal therapy agent that is actively or passively enriched in tumor tissues can generate heat under the irradiation of NIR light to achieve the purpose of destroying the growth of tumor cells. However, currently commonly used photothermal nanomaterials such as gold nanorods, carbon nanotubes and graphenes are often difficult to degrade in vivo. The development of biodegradable nanomaterials with superior photothermal performance has been the pursuit of researchers. Inspired by mussel adhesion proteins, neurotransmitter dopamine (DA) with similar functional groups was found, which can oxidize autolymerization forming polydopamine (PDA, natural melanin) and has excellent biocompatibility.25,26 Importantly, PDA is a well-performing infrared photothermal agent that can be used in PTT.27 In addition, PDA nanomaterial can be released in the acidic tumor microenvironment (the aerobic glycolysis of tumor cells producing the accumulation of acidic metabolites such as lactates and protons, etc) due to the protonation of amino groups in the PDA scaffolds.28,29 Furthermore, propelled by its stimuli-responsive drug release in hyperthermal or acidic conditions, PDA was capitalized as a responsive medicate carrier.30,31 Therefore, the PDA nanocarrier is an ideal candidate for anticancer Chinese medicine nanomedicine.
The early diagnosis of cancer is exceptionally vital for improving the patient survival rate. Conventional diagnostic technologies mainly include magnetic resonance imaging (MRI), computed tomography (CT) and ultrasound (US), etc. MRI contrast agent indirectly changes the signal intensity of the tissue through internal and external relaxation effect and susceptibility effect. The most widely used contrast agent, gadolinium diethotriamine pentaacetate (Gd-DTPA), has high toxic side effects and chemical toxicity, most of which are dizziness, nausea and vomiting, rash, difficult breathing, low blood pressure, bronchial asthma and pulmonary edema.32–36 Other replaceable magnetic contrast agents mainly include iron (Fe) and manganese (Mn), etc. Notably, Mn is one of the essential trace elements of the human body (12–20 mg), and Mn-based nanoparticle systems (such as Mn2+, MnO2, MnSiO3, Mn3O4, etc) have been extensively studied in MRI instead.37–40 Mn2+ is mainly applied to T1 weighted imaging (T1-WI) by reducing the T1 relaxation time and enhancing tissue signal strength.41 Multifunctional photothermal materials such as polydopamine (PDA) can form nanocomplex particles with MRI and PTT functions by hybridization or integrating manganese groups.42,43 Importantly, it’s reported that Mn-based nanomedicine can induce ferroptosis of tumor cells by consuming glutathione (GSH) to produce Mn2+.44 Ferroptosis is a newly discovered form of programmed cell death, which is mainly characterized by metal iron-dependent lipid peroxides damage in mitochondria. In addition, ferroptosis causes the death of tumor cells through GSH consumption, glutathione peroxidase 4 (GPX4) inactivation, reactive oxygen species (ROS) and lipid peroxides (LPO) accumulation, etc.45
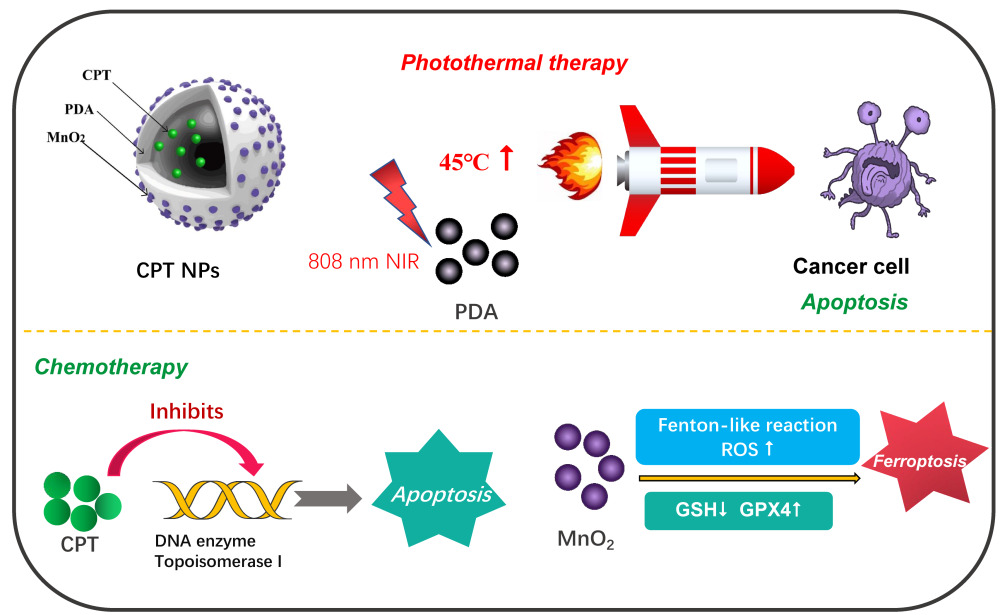
In the present paper, as shown in Figure 1, CPT-loaded and MnO2-coated PDA nanomedicines (CPT NPs) were developed. The nanomedicine not only improved the water soluble and stability but also reduced its toxic side effects.46,47 In addition, the PDA nanocarrier possessed excellent biocompatibility and photothermal conversion capacity for PPT.48,49 Notably, the CPT NPs were used in T1-weighted MRI and induced ferroptosis in tumor cells. As an integrated platform, the nanomedicine has the potential to accurately monitor tumors for diagnosis via NMR imaging and dramatically improve the therapeutic effect through combining chemotherapy and PPT. In addition, the nanomedicine could be loaded with other anti-cancer agents or a combination of two drugs (or gene therapeutic agents). Therefore, the nanomedicine delivery system has potential clinical application in the construction of an integrated diagnosis and treatment platform.
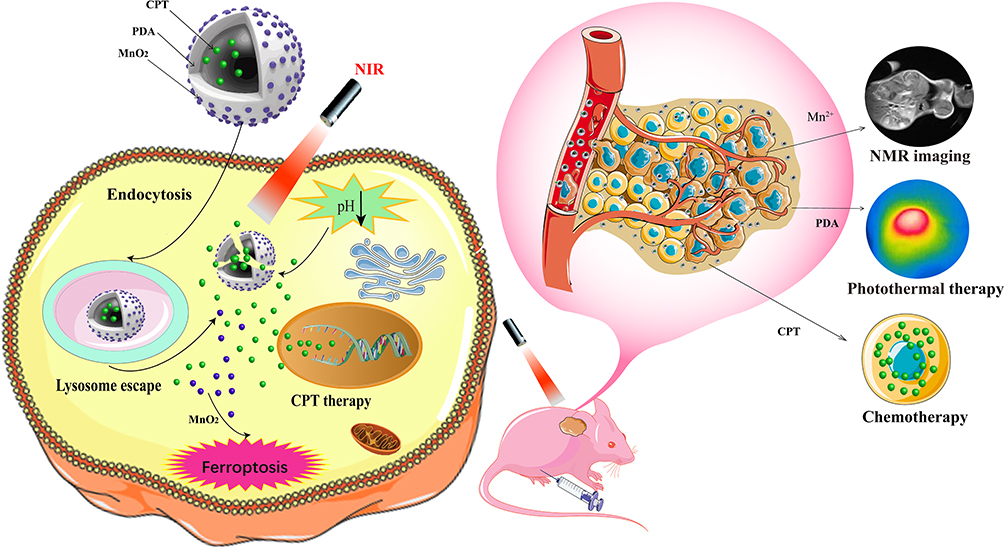 |
Figure 1 Schematic diagram of CPT-loaded and MnO2-coated polydopamine nanomedicine (CPT NPs) used for the treatment of lung cancer. |
Materials and Methods
Materials, Cells and Animals
CPT, dopamine hydrochloride, ammonium hydroxide (NH3·H2O) and glutathione were purchased from Aladdin (Shanghai, China). Potassium permanganate (KMnO4) and ethanol absolute were purchased from Sinopharm Chemical Reagent Co., Ltd. (Shanghai, China). Annexin V-FITC and propidium iodide (PI) were purchased from US Everbright® Inc. Co., Ltd. (Suzhou, China). DCFH-DA and dimethyl sulfoxide (DMSO) were purchased from Sigma-Aldrich (United States). Antibody against β-actin was obtained from HuaBio (Hangzhou, China). Antibodies against caspase-3 and cleaved-caspase-3 (C-Caspase 3) were obtained from Cell Signaling Technology (Beverly, MA, United States). Anti-GPX4 antibody was purchased from Abcam (England). PBS (pH 7.4/5.0) was purchased from Basa Media (Shanghai, China). Acetonitrile and methanol were obtained from Macklin Co., Ltd. (Shanghai, China). 4′,6-Diamidino-2-phenylindole (DAPI) was purchased from Sigma-Aldrich (United States). C11-BODIPY581/591 was purchased from Thermo Fisher Scientific (United States). Lyso-Tracker® Red was purchased from Beyotime (Shanghai, China). Cell counting kit-8 (CCK-8) and ECL kit were purchased from Share Bio (Shanghai, China). Alanine transaminase (ALT), aspartate aminotransferase (AST), creatinine (CRE) and reduced glutathione (GSH) activity assay kits were purchased from Nanjing Jiancheng Bioengineering Institute (Nanjing, China). All other organic solvents used in this study were analytically graded, and all chemicals without further purification were used.
Human lung adenocarcinoma cells (A549) and murine Lewis lung carcinoma cells (LLC) were obtained from the American Type Culture Collection (Manassas, VA, United States). These cells were cultured in Dulbecco’s modified Eagle’s medium (DMEM, BasalMedia, Shanghai, China) supplemented with 10% fetal bovine serum (FBS, BasalMedia, Shanghai, China) and 1% penicillin–streptomycin solution (BasalMedia, Shanghai, China) at 37 °C with 5% carbon dioxide (CO2).
Six-week-old male BALB/c nude mice (approximately 20 g body weight) were sourced from Shanghai Lingchang Biotechnology Co., Ltd (Shanghai, China). The tumor model was developed by subcutaneously injecting 2×10⁵ LLC cells (suspended in PBS) into the right axilla of each mouse. When the tumor volumes reach 50 mm3, the mice are ready for use. The animal study was performed according to the protocols approved by the Animal Ethics Committee of Shanghai University of traditional Chinese medicine affiliated to Longhua Hospital (SYXK 2018–0036; LHERAW-20012).
Methods
The Synthesis of Nanomedicine
The CPT NPs were synthesized in a classical Stöber method with modifications.50 Specifically, 9 mL of ultrapure water and 3 mL of ethanol were mixed up for 30 minutes (min). Then, 200 μL of NH3·H2O and 50 mg of CPT in 2 mL of ethanol were added to the above mixture, respectively. Subsequently, 100 mg of dopamine hydrochloride in 1 mL of ultrapure water was added, and the mixture was stirred for 12 hours (h). At last, the PDA nanomedicine was collected via centrifugation to detach the unloaded drug at 1×10⁴ rpm for 20 min, washed twice with ultrapure water. As for the modification of manganese dioxide (MnO2), the obtained nanomedicine was firstly dispersed in 15 mL of ultrapure water. Subsequently, 30 mg of KMnO4 in 5 mL of ultrapure water was added to the above mixture, and the mixture was stirred for 6 h. Finally, the MnO2-coated nanomedicine was collected by centrifugation at 1×10⁴ rpm for 20 min, washed twice with ultrapure water, and dispersed in 10 mL of ultrapure water for the following experiments. Similarly, the blank PDA NPs were synthesized using the aforementioned method, except for adding the anticancer agent CPT.
Characterization of Nanomedicine
The CPT NPs were characterized using transmission electron microscopy (TEM) and dynamic light scattering (DLS) instruments. The suspension was first added dropwise to the parafilm in a wet Petri dish and the vesicles were deposited on a cuprum-coated grid (300 mesh) for 3 min. Subsequently, the grids were analyzed using the TEM (JEM-1230, JEOL). DLS (Malvern Zeta Sizer Nano ZS90) was used for particle size distribution and zeta potential analysis. For stability analysis, we examined the hydrodynamic size change of CPT NPs every 2 days within 14 days using DLS. An EDX energy spectrum analyzer (AMETEK EDAX) was used to detect whether the MnO2 were successfully coated onto the surface of PDA nanoparticles.
The Encapsulation Efficiency of CPT in the Nanomedicine
The entrapment efficiency of CPT in nanomedicine was detected. CPT NPs were purified, weighed and dissolved in 1 mL of acetonitrile. Then, the concentration of CPT in the sample was determined using an Agilent 1260 infinity LC (liquid chromatograph) system and Thermo Accucore C18 column (100 mm, 2.1 mm, 2.6 m). The mobile phase was 0.1% of formic acid and acetonitrile. The eluent was transferred to MS (mass spectrometer) within 3.5–7.5 min. The positive ion electrospray mode was detected by MS through multi-reaction monitoring. The method for calculating the encapsulation efficiency of CPT was the ratio of the entrapment amount of CPT in NPs to that amount of CPT added for synthesizing nanomedicine.
CPT Release from the Nanomedicine Triggering by pH
PBS with pH 5.0 and 7.4 was selected as the drug release fluids to simulate the tumor and normal environment. To determine the realized profiles of CPT in the CPT NPs, 25 µL of CPT NPs (4 mg/mL) were placed in 1 mL of drug release fluids (pH 7.4 or 5.0) and fully dispersed, each provided without or with 808 nm of NIR light (2 W∙cm−2, 5 min). Then, the samples were regularly transferred to the culture bed with agitation at 37 °C. After the prescribed time, the supernatant was separated from the samples through centrifugation. Then, the supernatant was measured by a nano-drop UV-Vis spectrophotometer at 363 nm with a standard curve (absorbance versus concentration), and a drug release curve was drawn.
Biocompatibility of the Blank PDA NPs
A549 and LLC Cells in the exponential growth phase were seeded in 96-well plates (3000 per well) in triplicate and cultured overnight, followed by incubating with blank PDA NPs at a series of indicated concentration gradients for 48 h. Then, the viability of cells was detected by the CCK-8 luminescence assay (BD Pharmingen, Franklin Lakes, New Jersey, United States).
Endosomal Escape of the Nanomedicine
The cellular uptake and endosomal escape of the nanomedicine were evaluated by a confocal laser scanning microscope (CLSM, Leica SP8). A549 and LLC cells at logarithmic phase were seeded into a 20-mm plates at a density of 1× 10⁵ cells per well and cultured overnight, and followed by incubation with CPT NPs (CPT dose: 1 µM). After incubating for 6 h, removing the media, and the cells were washed with cold PBS for three times. Then, the cells were further stained with Lyso-Tracker ® Red for 30 min to assess the endosome escape ability of the nanomedicine. Next, the cells were fixed with 5% of glutaraldehyde solution for 20 min and viewed using the CLSM with DAPI channel for CPT NPs and TRITC channel for the Lyso-Tracker.
Cell Viability Assay
A549 and LLC Cells in the exponential growth phase were seeded in 96-well plates (3000 per well) in triplicate, and cultured overnight. Then, the cells were treated with free CPT, CPT NPs, CPT NPs at indicated concentrations under laser irradiation (808 nm, 2 W∙cm−2, 5 min) for 48 h, followed by the CCK-8 luminescence assay (BD Pharmingen, Franklin Lakes, New Jersey, United States).
Apoptosis Assay
A549 and LLC cells were seeded in 6-well plates in triplicate and cultured for 24 h. Next, the cells were incubated with free CPT, two samples of CPT NPs (250 nM of CPT for A549 cells, 1000 nM of CPT for LLC cells) for 24 h. One of the CPT NPs samples was treated with 808-nm laser (2 W/cm2, 5 min) and continued to culture for additional 24 h. Apoptosis was tested by flow cytometry analysis (FACSJazz, BD Biosciences, United States) with annexin V-FITC/PI double staining.
Western Blotting
Proteins were extracted from tumor cells or tissues with RIPA lysis buffer. The concentrations of proteins were detected by a protein assay kit. After separating the total proteins of the samples with Gel electrophoresis (SDS-PAGE), the proteins were transferred onto a polyvinylidene fluoride membrane (PVDF) blocked within 5% nonfat milk in TBST for 1 h. The membranes were incubated with primary antibodies at 4 °C overnight. Next, the membranes were washed three times with TBST and incubated with secondary antibodies for 1 h. After being washed thrice with TBST, immunoreactive bands were visualized with an ECL kit and filmed using a chemiluminescence image analysis system (Tanon, Shanghai, China). Finally, Image J software was used to semi-quantitatively analyze the Western blotting results.
GSH Content
A549 and LLC cells were seeded on dishes and cultured overnight. Free CPT, two samples of CPT NPs (250 nM of CPT for A549 cells, 1000 nM of CPT for LLC cells) were added and cultured for 8 h. Then, one of the CPT NPs samples was irradiated with 808 nm of laser (2 W∙cm−2, 5 min) and cultured for additional 8 h. The glutathione content was measured with a glutathione assay kit based on measured absorbance at 450 nm by a microplate reader (BD Pharmingen, Franklin Lakes, New Jersey, United States).
Mn2+ Concentration
A549 and LLC cells were seeded on dishes and cultured overnight. Free CPT, two samples of CPT NPs (250 nM of CPT for A549 cells, 1000 nM of CPT for LLC cells) were added and cultured for 8 h. Then, one of the CPT NPs samples was irradiated with 808 nm of laser (2 W∙cm−2, 5 min) and cultured for additional 8 h. An ultrasonic cell crusher was used to crush the tumor cells as a way to extract the cytosol. Tumor tissue used for MRI is pulverized with a tissue grinder to extract the tissue fluid. The obtained samples were centrifuged and filtered through a 200 μm membrane. Then, the concentration of CPT in the sample was determined using an ICP-OES (Agilent ICPOES 730, United States).
ROS Level
A549 and LLC cells were seeded in 6-well plates in triplicate and cultured for 24 h. Then, free CPT, two samples of CPT NPs (CPT dose, 250 nM for A549 cells, 1000 nM for LLC cells) were added to the cells and cultured for 8 h. Then, one of the CPT NPs samples was treated with 808 nm of laser (2 W∙cm−2, 5 min) and cultured for additional 16 h. Subsequently, the cells were incubated with 1 μM of DCFH-DA for 20 min. After the cells were harvested, the ROS level was evaluated by a flow cytometry analysis (FACSJazz, BD Biosciences, United States).
Lipid Peroxide Measurement
A549 and LLC cells were seeded on a confocal dish and cultured overnight. Then, the cells were separately incubated with free CPT, two samples of CPT NPs (250 nM of CPT for A549 cells, 1000 nM of CPT for LLC cells). After being incubated for 8 h, one of the CPT NPs samples was treated with 808 nm NIR (2 W∙cm−2, 5 min) and cultured for an additional 16 h. The cells were stained with C11-BODIPY 581/591 and incubated for 30 min. Then, the intracellular lipid peroxide content in the cells was observed using a CLSM (Leica SP8). ImageJ software was used to semi-quantitatively analyze the fluorescence intensity.
MRI Signal Measurement
Different concentrations (0.25, 0.125, 0.0625 and 0.03125 mg/mL) of CPT NPs (1 mL) were dispersed in 10 mM of glutathione solution placed in centrifugal tubes. The mixture was vortexed every 10 min and allowed to incubate for 1 h. The samples were imaged by a 0.5-T magnetic resonance instrument (TR: 100.0 ms; TE: 13.01 ms; field of view: 128×128 mm; slice: 3.0 mm). When the tumor volume was reached around 500 mm3, in vivo imaging studies were performed. We intraperitoneally injected CPT NPs solution (100 µL, at a CPT dose of 2 mg/kg) into the tumor-bearing mice, and conducted MRI of the mice at different times (0, 12, 24, 48 and 72 h) with the 3.0 T magnetic resonance instrument (TR: 550.0 ms; TE: 9.3 ms; field of view: 60×60 mm; slice: 2.0 mm). The signal of contrast enhancement was analyzed using ImageJ software.
The Photothermal Conversion Capability of the Nanomedicine
To verify the photothermal conversion efficiency, the warming effect of CPT NPs at 1 mg/mL was treated with different light intensity of NIR light at 808 nm (0.5, 1, 2, 4 W∙cm−2) for 10 min. The PBS was used as a control group, and 1 mg of blank PDA NPs and CPT NPs were respectively dispersed in 1 mL of ultrapure water and then treated with an 808 nm of NIR light (2 W∙cm−2) for 10 min. Data were recorded, and the temperature rise curves were plotted. For photothermal imaging in vitro of nanomedicine, 1 mg of CPT NPs and blank PDA NPs were dispersed in 1 mL of ultrapure water and then treated with 808-nm NIR light (2 W∙cm−2) for 10 min, using PBS as a control group. Photothermal images of the samples were recorded after 10 min irradiation using an infrared camera (FOTRIC 220, Shanghai, China). For the photothermal stability, the CPT NPs were treated with 808-nm NIR light laser at 2 W∙cm−2 for 10 min, and the temperature was recorded. After cooling down to room temperature, the same operation was repeated four more times to analyze the photothermal stability of the CPT NPs.
In vivo thermal imaging and photothermal therapeutic efficacy were investigated in subcutaneous LLC tumor-bearing mice. BALB/c nude mice were intraperitoneal injected PBS, free CPT, blank PDA NPs and CPT NPs (CPT dose, 2 mg/kg bodyweight). After administration for 24 h, tumors were irradiated with an 808-nm laser at an intensity of 2 W∙cm−2 for 5 min. Images and regional temperatures of tumors were detected with an infrared camera (FOTRIC 220, Shanghai, China).
The Distribution of Nanomedicine in Mice
The fluorescence of CPT in the nanomedicine was weak due to the quenching of the PDA nanocarrier. Hence, red fluorescent dye rhodamine B (Rb) was used to label the nanomedicine. Rb dye was incubated with CPT NPs for 2 h to form the Rb-labeled CPT NPs (Rb@CPT NPs). Subcutaneous tumor nude mice were intraperitoneal injected 100 μL of Rb@CPT NPs (2 mg/mL) at a series of predetermined times. After 48 h, the mice were euthanized. The tumors and major organs (heart, liver, spleen, lung, kidney) were collected to observe the in vivo fluorescence distribution of the nanomedicine in mice. In vivo biodistribution of Rb@CPT NPs was evaluated by a VISQUE in vivo imaging system (VISQUE® Invivo Smart-LF, United States) at the PE (red) channel.
In vivo Antitumor Efficacy of the Nanomedicine
The subcutaneous tumor model was established to study the antitumor efficacy of the nanomedicine. The tumor volume was measured using a caliper, and tumor volume was calculated using the formula: V= 0.5∙L∙W2, where length (L) is the longest diameter and width (W) is the shortest diameter perpendicular to the length. When the tumor volume reached 50 mm3, the mice were randomly divided into seven groups (n = 6 per group). The formulations were PBS, PBS with laser irradiation (2 W∙cm−2, 5 min), blank PDA NPs (2 mg/mL), blank PDA NPs (2 mg/mL) with laser irradiation, free CPT (2 mg/kg), CPT NPs (at a CPT dose of 2 mg/kg and 2 mg/mL of PDA NPs), and CPT NPs with laser irradiation (808 nm, 2 W∙cm2, 5 min), and intraperitoneal administered every 2 days. The light irradiation was applied at 6 h post dosing. The body weight and tumor volume of all mice were continuously monitored every other day during the whole treatment. At the end of the efficacy study (day 14), the mice were sacrificed to collect tumor tissues to evaluate tumor burden (tumor volume and tumor weight) and the analysis of cleaved caspase-3 and GPX4 activity. In addition, orbital blood obtained before mice sacrifice was mainly used to evaluate the hepatorenal function of the nanomedicine using alanine transaminase (ALT), aspartate aminotransferase (AST) and creatinine (Cre) activity assay kits.
Statistical Analysis
Data have been presented as mean ± standard deviation (SD). Statistically significant differences between the two groups were analyzed by hypothesis testing with the two-sample t-test, and indicated by *p < 0.05, **p < 0.01 and ***p < 0.001. p < 0.05 was considered statistically significant in all analyses (95% confidence level).
Results and Discussion
Synthesis and Characterization of the Nanomedicine
CPT nanomedicine was synthesized through oxidative polymerization of DA in a basic alcohol aqueous solution. Subsequently, MnO2 was deposited on the surface of nanomedicine via incubation with potassium permanganate in aqueous solution. In order to evaluate the morphology and size of CPT NPs, transmission electron microscopy (TEM) and dynamic light scattering (DLS) were used. As shown in Figure 2A and B, the synthesized nanomedicine displayed a spherical and uniform morphology with a diameter of around 340 nm. In addition, the zeta potential was detected. As shown in Figure S1, the zeta potentials of CPT nanomedicine in the absence and presence of MnO2 were −49 mV and −20 mV, respectively. The rise of zeta potential was ascribed to the deposition of MnO2. To better verify the coat of MnO2, an energy dispersive X-ray spectroscopy (EDX) was also performed. As shown in Figure 2C, MnO2 was deposited onto the surface of the PDA nanomedicine. In addition, the stability of the nanomedicine was detected due to the great importance for in vivo application. As shown in Figure S2, the hydrodynamic size change was insignificant within 14 days, suggesting that the nanomedicine has a good stability. For potential applications of MRI, in vitro MRI T1-weighted imaging of CPT NPs was explored. As shown in Figure 2D, the T1 MRI signals were gradually enhanced during the increase of Mn2+ concentration, and the associated relaxation rate was 13.108 mM−1S−1, indicating the MnO2-coated nanomedicine has a good MRI ability. Altogether, we successfully synthesized spherical CPT-loaded and MnO2-coated PDA nanomedicine, which had moderate size and relatively uniform, as well as excellent MRI ability.
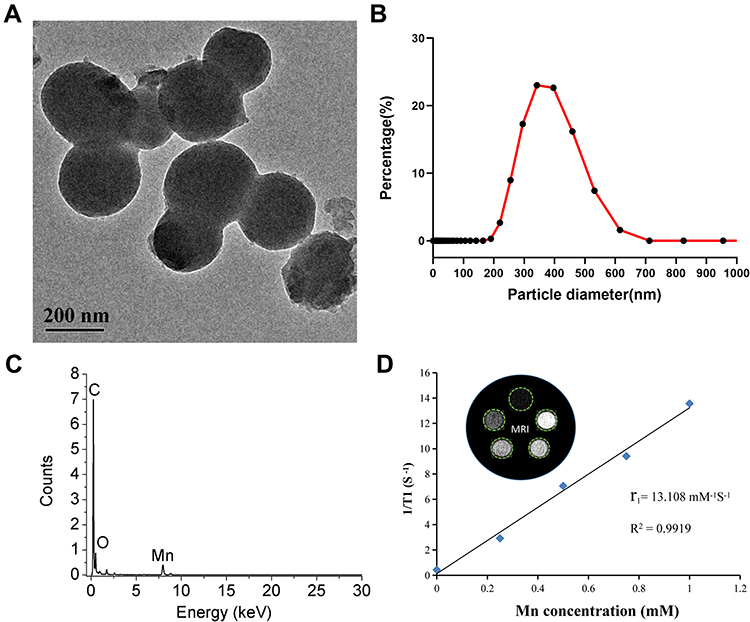 |
Figure 2 Characterizations of CPT-loaded and MnO2-coated nanomedicine (CPT NPs). (A) Transmission electron microscopy (TEM) image, scale bar: 200 nm. (B) Particle size distribution analysis performed with a dynamic light scattering (DLS). (C) Energy spectrum (EDX) of CPT NPs. (D) T1-weighted MR images and the relaxivity of CPT NPs at a series of concentrations. |
Photothermal Efficiency and pH Release Profiles
For proving the PTT of CPT NPs, the photothermal response of the nanomedicine was investigated. The photothermal conversion curves with power density were explored. As shown in Figure 3A, the temperature gradually increased with the increase of power density and time. But 4 W∙cm−2 was a little bit high, so 2 W∙cm−2 was selected for subsequent optothermal experiments. As shown in Figure 3B, PBS exhibited insignificant temperature change and the maximal temperature only increased to 28.5 °C after 10 min of NIR laser irradiation (808 nm, 2 W∙cm−2). In comparison, the temperatures of blank PDA NPs increased rapidly with time and reached saturation in 10 min. CPT NPs showed similar temperature rising profiles. The maximal temperatures of the blank PDA NPs and CPT NPs in 10 min increased to 46.8 and 49.7 °C, respectively. Photothermal images of the samples were recorded after 10 min irradiation using an infrared camera. As shown in Figure 3C, PBS exhibited insignificant temperature change and the maximal temperature only increased to 28.5 °C after 10 min of NIR laser irradiation, the maximal temperatures of the blank PDA nanocarrier and CPT NPs increased to 46.1 and 49.2 °C, respectively. In addition, the photothermal stability of the CPT NPs was also performed. As shown in Figure S3, the photothermal conversion ability of the CPT NPs was not affected after five cycles of irradiation and cessation of irradiation. Therefore, the CPT NPs had excellent photothermal effect and photothermal stability. And its nanomedicine was favorable for use as a PTT agent.
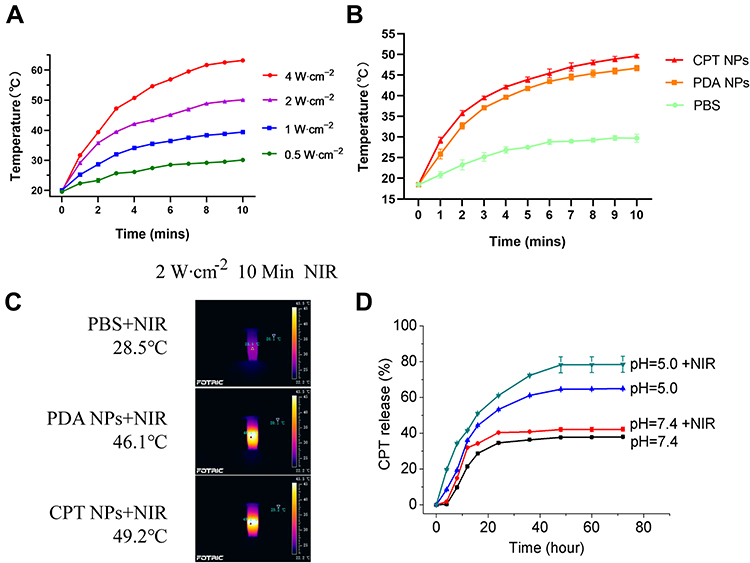 |
Figure 3 Photothermal conversion and pH-controlled release of the CPT NPs. (A) Warming curves of 1 mg/mL of CPT NPs after 10 min of 808 nm laser irradiation at different powers (0.5, 1, 2, 4 W∙cm−2), error bars represent the mean ± SD (standard deviation, n=3). (B) Temperature curves of the PBS buffer, blank PDA NPs and CPT NPs after treatment with 808 nm laser irradiation (2 W∙cm−2, 5 min), error bars represent the mean ± SD (standard deviation, n = 3). (C) Pictures of the PBS buffer, blank PDA NPs and CPT NPs after treatment with 808 nm laser irradiation (2 W∙cm−2, 5 min). (D) CPT release from CPT NPs after treatment with PBS buffer at pH=7.4 or pH=5.0 in the absence and presence of 808 nm laser irradiation (2 W∙cm−2, 5 min). |
The encapsulation efficiency of CPT in the CPT-loaded nanomedicine was obtained using a LC-MS method. As shown in Figure S4, the encapsulation efficiency was 66.6%, indicating the nanomedicine had a high encapsulation rate. As for the pH release of the nanomedicine, the stimuli release profile of pH and NIR light in CPT-loaded PDA nanomedicine was further evaluated. As shown in Figure 3D, 37.9% of CPT was released in pH 7.4 buffer, while 42.3% of CPT was released in pH 7.4 buffer with NIR irradiation (2 W∙cm−2, 5 min). Thus, NIR irradiation accelerated the release of CPT. Notably, CPT release was 65.1% and 78.5% from CPT nanomedicine in pH 5.0 buffer in the absence and presence of NIR irradiation, respectively. TEM images of nanomedicine under acidic conditions were also performed. As shown in Figure S5, nanomedicine was deformed and broken under acidic conditions. These results indicated that the nanomedicine has the potential of controlled release in acidic tumor microenvironment plus NIR irradiation.
Biocompatibility of the Blank PDA NPs
Dopamine (DA) is a neurotransmitter that self-aggregates to form PDA, and its biodegradable metabolites are homovanillic acid and trihydroxyphenylacetic acid. In addition, manganese is an essential trace element in the human body. Therefore, the blank PDA NPs should have good biocompatibility in theory. As shown in Figure S6, the cell viabilities of lung cancer A549 and LLC cells were still higher than 75% when the concentration of the blank PDA NPs was up to 20 μg/mL, suggesting the blank PDA NPs have an excellent biocompatibility.
Lysosomal Localization of Nanomedicine
For anticancer drug therapy, the uptake ability by tumor cells is an important factor affecting the therapeutic efficacy. Subsequently, the cell uptake and endosomal localization of CPT NPs were performed in A549 and LLC cells. Lysosome was stained by Lysotracker Red, and no additional dye was labeled on nanomedicine due to the intrinsic blue fluorescence of CPT. As shown in Figure 4, blue fluorescence of CPT could be observed in A549 and LLC cells from the confocal images, indicating that the CPT NPs could be successfully uptaken by tumor cells. Notably, the blue fluorescence did not completely overlap with the red fluorescence, indicating the nanomedicine could escape from the lysosome and enter cell cytoplasm or nucleus to inhibit the growth of lung cancer due to the destabilization of the lysosome membrane.51
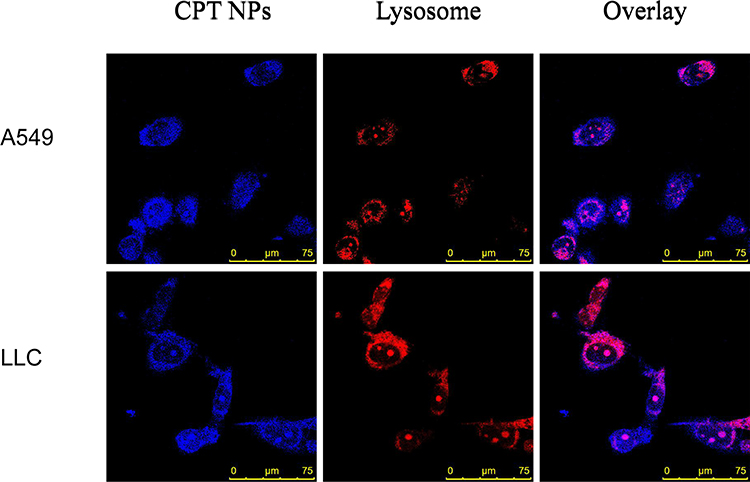 |
Figure 4 Lysosomal localization. Fluorescence microscopy images of A549 and LLC cells after incubating with CPT NPs (1 μM) for 8 hours, the blue color was CPT, the red color was lysosomal tracker, scale bar is 75 μm. |
In vitro Antitumor Activity
To explore the anticancer activity of the CPT NPs in vitro, the cell viability and apoptosis experiments of free CPT, CPT NPs and CPT NPs with 808 nm laser irradiation were evaluated. As shown in Figure 5A, the viability of A549 cells treated with free CPT was a little lower than that of CPT NPs, while CPT NPs plus 808 nm laser irradiation had the lowest cell viability. And the IC50 of free CPT, CPT NPs and CPT NPs with 808 nm laser irradiation in A549 cells were 268.2 nM, 214.9 nM and 144.1 nM, respectively. In addition, an apoptotic analysis was also performed. As shown in Figure 5B and C, the apoptosis rates of A549 cells after treatment with CPT NPs plus 808 nm laser irradiation and CPT NPs were respectively measured to be 26.5% and 19.6%, which was higher than that of 13.3% from free CPT. In the meantime, apoptosis factor cleaved caspase-3 was also detected using Western blotting (WB). As shown in Figure 5D and E, the expression of cleaved caspase-3 in A549 cells after treating with CPT NPs without and with NIR irradiation was obviously upregulated, and the expression of total caspase-3 in A549 cells was obviously downregulated, which exhibited a similar trend to Figure 5B and C. All these results suggested that the CPT NPs with PPT could dramatically inhibit the proliferation and promote the apoptosis of lung cancer A549 cells.
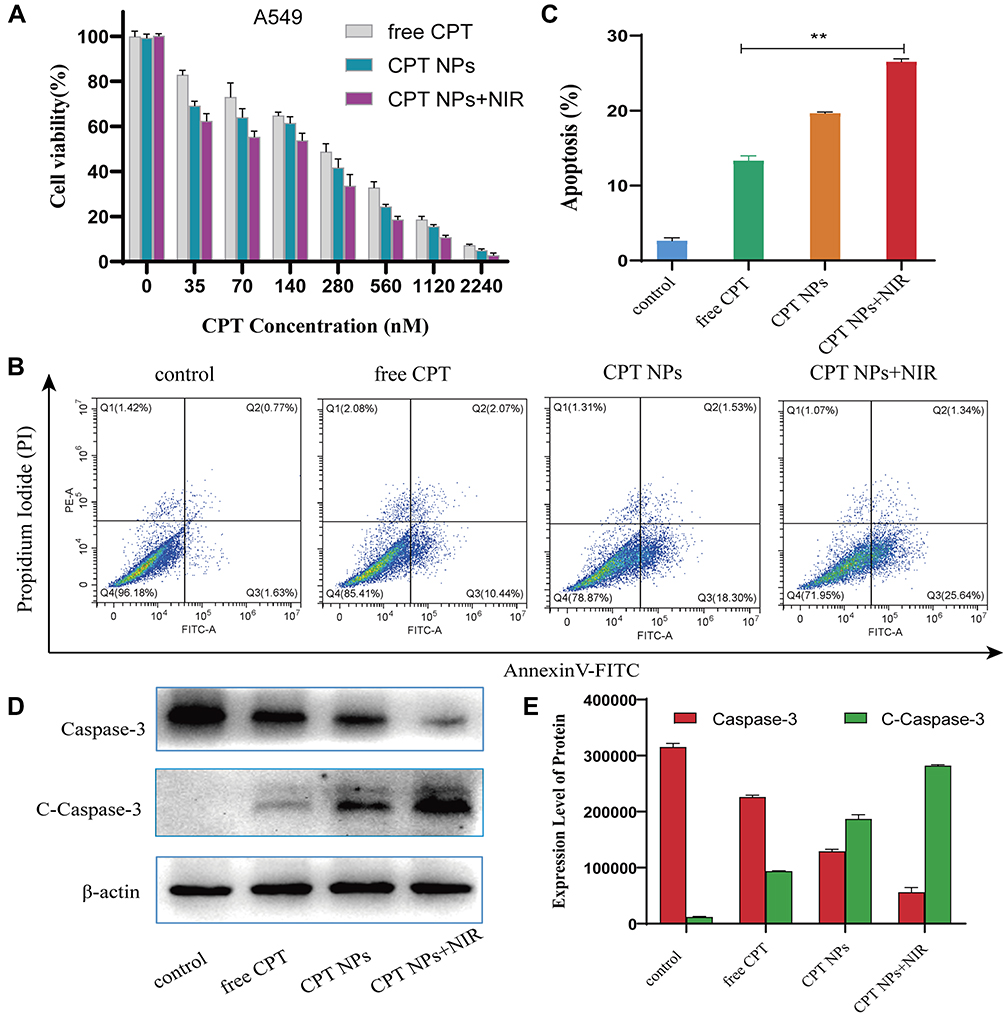 |
Figure 5 In vitro anticancer activity of the CPT NPs in lung cancer A549 cells. (A) Cell viability of the A549 cells after incubation with different concentration of free CPT, CPT NPs in the absence and presence of laser irradiation (2 W∙cm−2, 5 min) for 48 hours, error bars represent the mean ± SD (standard deviation, n = 3). (B) Flow cytometric analysis of A549 cell apoptosis after treatment with 250 nM of free CPT, CPT NPs without and with NIR irradiation on the basis of Annexin V and FITC-PI staining. (C) Statistical analysis of the apoptotic cells corresponding to (B), error bars represent the mean ± SD (standard deviation, n = 3), **p< 0.01. (D) Western blotting analysis of total Caspase-3 and cleaved Caspase-3 (C-Caspase-3) corresponding to (B). (E) Semi-quantitative of total Caspase-3 and C-Caspase-3 expression. |
The anticancer activity of the CPT NPs in lung cancer LLC cells was also evaluated. As shown in Figure 6A, the IC50 values of free CPT, CPT NPs and CPT NPs with NIR irradiation were 1278.0 nM, 773.1 nM and 395.7 nM, respectively. CPT NPs plus NIR irradiation had the best ability to inhibit the proliferation of LLC cells. Subsequently, the apoptotic analysis was also performed. As shown in Figure 6B and C, the apoptosis rates of LLC cells after treatment with CPT NPs plus NIR irradiation (26.7%) and CPT NPs (16.9%) were significantly higher than that of free CPT (11.2%). As shown in Figure 6D andE, the expression of cleaved caspase-3 in LLC cells after treating with CPT NPs without and with NIR irradiation was obviously upregulated, and the expression of total caspase-3 in LLC cells was downregulated, which were consistent with the results of apoptosis analysis in Figure 6B and C. Altogether, when combined with PPT, CPT NPs possessed excellent antitumor activity in vitro.
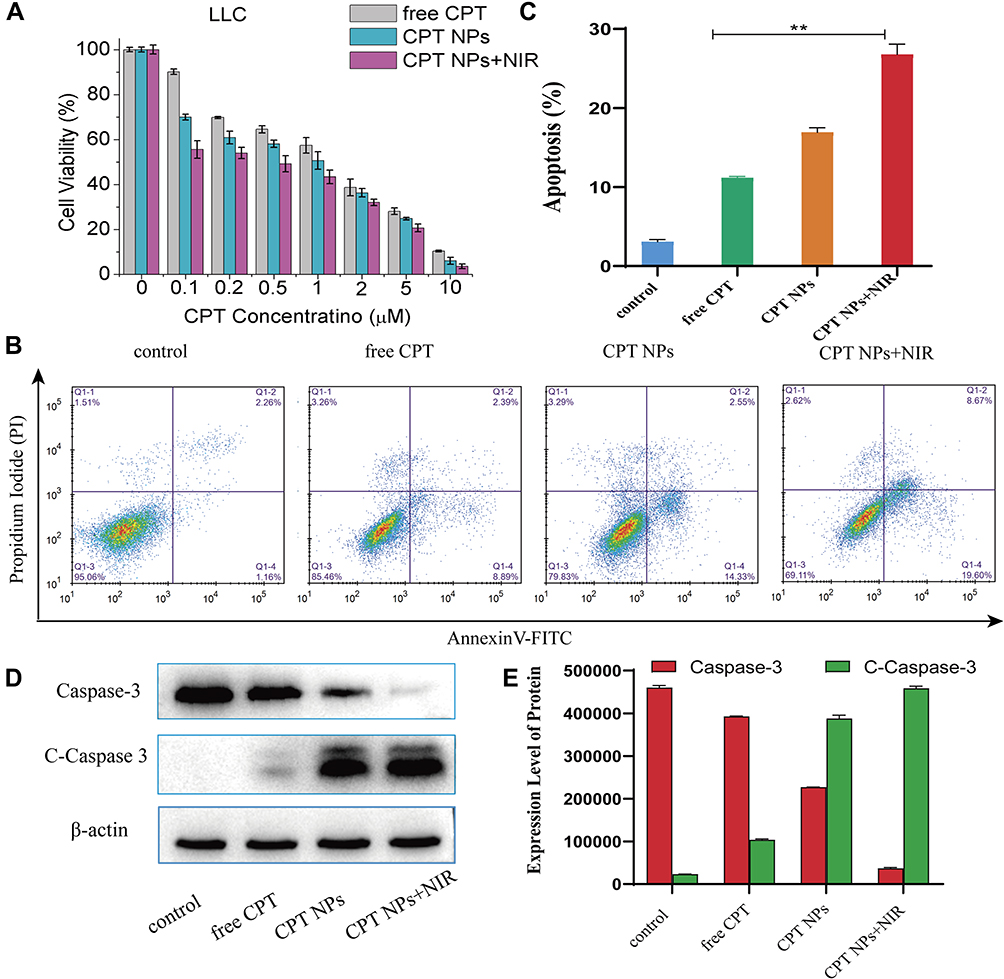 |
Figure 6 In vitro anticancer activity of the CPT NPs in lung cancer LLC cells. (A) Cell viability of LLC cells after incubating with different concentrations of free CPT, CPT NPs in the absence and presence of laser irradiation (2 W∙cm−2, 5 min), error bars represent mean ± SD (standard deviation, n = 3). (B) Flow cytometric analysis of LLC cells after treating with 1000 nM of free CPT, CPT NPs without and with NIR irradiation by Annexin V and FITC-PI staining. (C) Statistical analysis of apoptosis cells corresponding to (B), error bars represent mean ± SD (standard deviation, n = 3), **p< 0.01. (D) Western blotting analysis of total Caspase-3 and C-Caspase-3 corresponding to (B). (E) Semi-quantitative of total Caspase-3 and C-Caspase-3 expression. |
Ferroptosis in Lung Cancer Cells Induction by CPT NPs
MnO2 can induce ferroptosis in tumor cells according to some literatures.52,53 As shown in Figure 7A schematic diagram, on one hand, MnO2 in the nanomedicine was first reduced to Mn2+ by glutathione (GSH), then glutathione peroxidase 4 (GPX4) was inactivated, resulting in ferroptosis. On the other hand, Fenton-like reaction induced by Mn2+ consumed hydrogen peroxide (H2O2) and produced hydroxyl (∙OH) radical, thereby causing intracellular accumulation of lipid peroxidation (LPO) to result in ferroptosis eventually. To verify the occurrence of ferroptosis, GSH, GPX4, ROS and LPO in A549 cells were detected. As shown in Figure 7B–D, the cells after treating with CPT NPs without and with NIR irradiation exhibited lower GSH levels and GPX4 expression. The Mn2+ concentration of CPT NPs group and CPT NPs with NIR irradiation group were 12.9 μM and 13.3 μM according to Figure 7E. As shown in Figure 7F–H, compared with control and free CPT groups, the ROS (DCFH-DA) levels and LPO signals (the ratio of oxidized/reduced status) of CPT NPs group and CPT NPs with NIR irradiation group had a significant rise than that of control and free CPT groups. These results suggested that the CPT NPs induced the ferroptosis of lung cancer A549 cells.
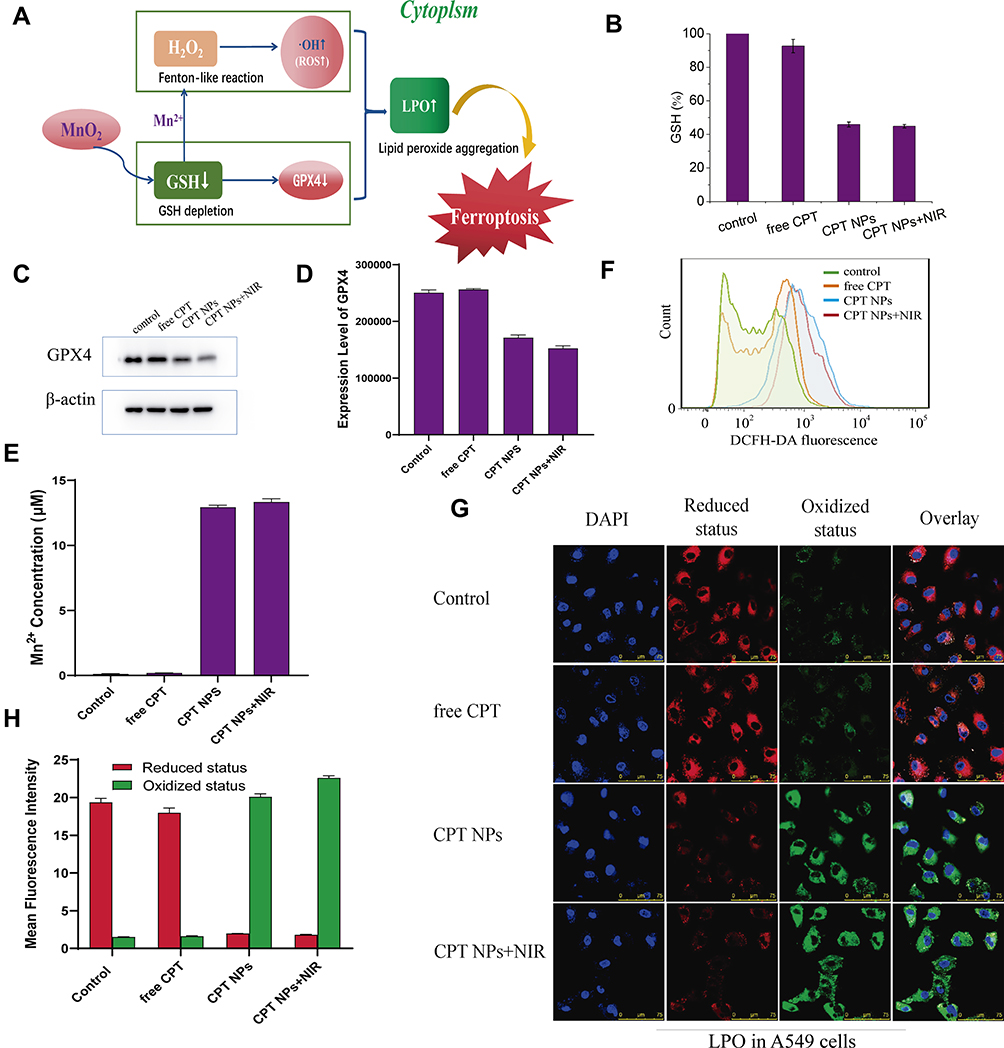 |
Figure 7 CPT NPs induces ferroptosis in lung cancer A549 cells. (A) Schematic diagram. (B) GSH measurements of A549 cells after treating with 250 nM of free CPT, CPT NPs without and with NIR irradiation (2 W∙cm−2, 5 min), error bars represent mean ± SD (standard deviation, n = 3). (C) Western blotting analysis of GPX4. (D) Semi-quantitative of GPX4 expression. (E) Mn2+ concentration. (F) ROS detection. (G) Lipid peroxidation (LPO) analysis Oxidized status (green fluorescence, ex/em 490/510 nm) and Reduced status (red fluorescence, ex/em 580/600 nm) of C11-BODIPY 581/591, scale bar is 75 μm. (H) Semi-quantification of C11-BODIPY 581/591 fluorescence. |
Subsequently, the ferroptosis of lung cancer LLC cells induced by the CPT NPs was also evaluated. As shown in Figure 8A–G, compared with control and free CPT groups, the CPT NPs without and with NIR irradiation possessed low GSH levels and GPX4 expression, high Mn2+ concentration, ROS levels and LPO signals (the ratio of oxidized/reduced status) in lung cancer LLC cells. Altogether, this nanomedicine could cause the ferroptosis of lung cancer through the decrease of GSH and GPX4, as well as the increase of ROS and LPO.
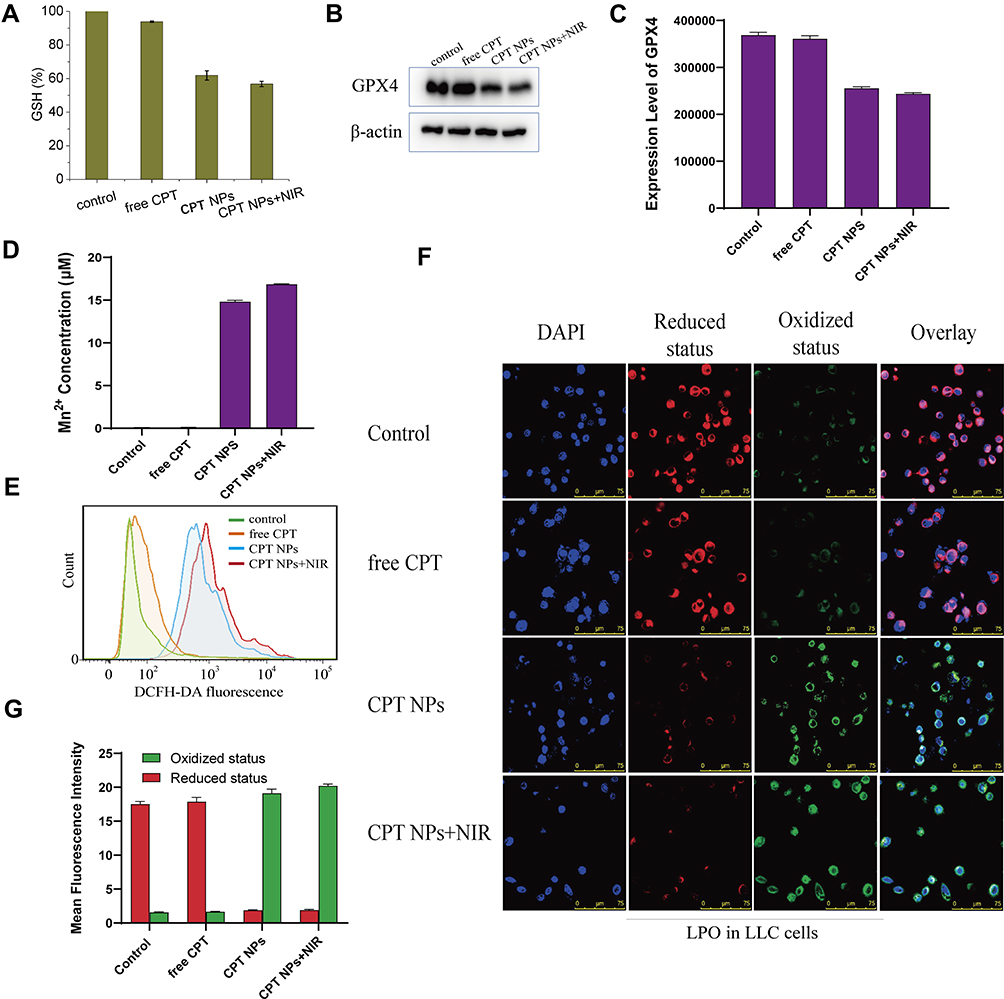 |
Figure 8 CPT NPs induces ferroptosis in lung cancer LLC cells. (A) GSH measurements of LLC cells after treating with 1000 nM of free CPT, CPT NPs without and with NIR irradiation (2 W∙cm−2, 5 min), error bars represent mean ± SD (standard deviation, n = 3). (B) Western blotting analysis of GPX4. (C) Semi-quantitative of GPX4 expression. (D) Mn2+ concentration. (E) ROS detection. (F) Lipid peroxidation (LPO) analysis, oxidized status (green fluorescence, ex/em 490/510 nm) and Reduced status (red fluorescence, ex/em 580/600 nm) of C11-BODIPY 581/ 591, scale bar is 75 μm. (G) Semi-quantification of C11-BODIPY 581/591 fluorescence. |
MRI and Photothermal Imaging of Nanomedicine
In order to construct the integration of diagnosis and treatment of nanomedicine, MRI (MnO2) and photothermal imaging (PDA) of CPT NPs were explored. As shown in Figure 9A and B, the accumulated CPT NPs in the mice and the MRI signal reached its maximum at 24 h, then the signal gradually decreased. A similar trend was observed for the Mn2+ concentration in tumor tissue according to Figure S7. The results indicated the CPT NPs had the good MRI ability in mice. Subsequently, photothermal imaging of the nanomedicine was also evaluated. As shown in Figure 9C and D, CPT NPs and blank PDA NPs with NIR irradiation possessed higher temperature than that of control and free CPT groups, revealing the nanomedicine had excellent photothermal conversion efficiency and possessed the ability of PPT.
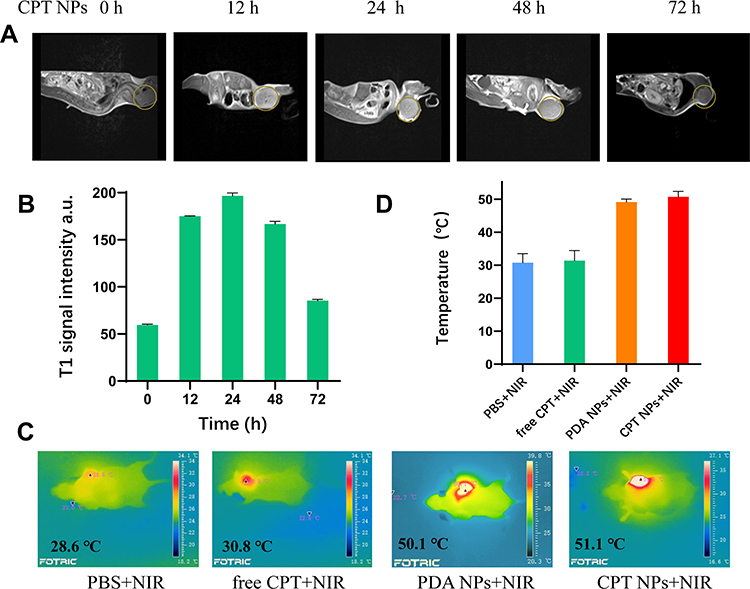 |
Figure 9 Nuclear magnetic imaging and photothermal imaging. (A) NMR imaging. (B) Statistical analysis corresponding to (A), error bars represent mean ± SD (standard deviation, n = 3). (C) Photothermal imaging. (D) Statistical analysis corresponding to (C), error bars represent mean ± SD (standard deviation, n = 3). |
In vivo Anticancer Activities
Drug distribution was detected using an in vivo imaging of small animals. The CPT NPs were labeled with rhodamine B due to the weak fluorescence of CPT quenching by PDA.54 As shown in Figure S8, the nanomedicine was mainly distributed in the liver and kidney organs, as well as tumor sites. Fluorescent signals of CPT NPs were still observed at the tumor site in 48 h. The result suggested that the nanomedicine could reach the tumor site and inhibit tumor growth, it could be subsequently metabolized through the liver and kidney. The nanomedicine had a good EPR effect within 48 h.
The antitumor efficacy of the CPT NPs was studied in LLC tumor-bearing mice. As shown in Figure 10A, the NIR laser group showed an impact similar to that of the control group, indicating that laser irradiation had no significant influence on the tumor-bearing mice without photothermal reagent. The blank PDA NPs group had no remarkable change compared to the control group, revealing the PDA nanocarrier possessed good biocompatibility. An NIR laser exposure of mice injected with blank NPs had an obvious tumor inhibition effect, suggesting that PPT can inhibit the growth of lung cancer. In addition, free CPT could significantly inhibit the growth of lung cancer due to its antitumor activity. However, CPT NPs showed better antitumor activity, indicating the nanomedicine could better inhibit the growth of lung cancer through controlled release and ferroptosis. Notably, the best performance was achieved by the mouse group that received the CPT NPs and NIR radiation exposure, revealing the nanomedicine combined with PPT could best inhibit the growth of lung cancer. Tumor images (Figure 10B), tumor weight (Figure 10C), apoptosis factor cleaved-caspase-3 expression (Figure 10D) and its semi-quantitative analysis (Figure 10E) were consistent with the tumor volume data. Ferroptosis factor GPX4 expression was also evaluated. As shown in Figure 10F and G, the CPT NPs without and with NIR irradiation had lower GPX4 expression than that of the control and the free CPT groups, suggesting the nanomedicine had the ability to induce ferroptosis in lung cancer cells. All these results demonstrate that the pH-triggered release of CPT in the tumors, and the local hyperthermic ablation efficacy of PDA, as well as ferroptosis of MnO2 contributed to the excellent antitumor activity of the CPT NPs.
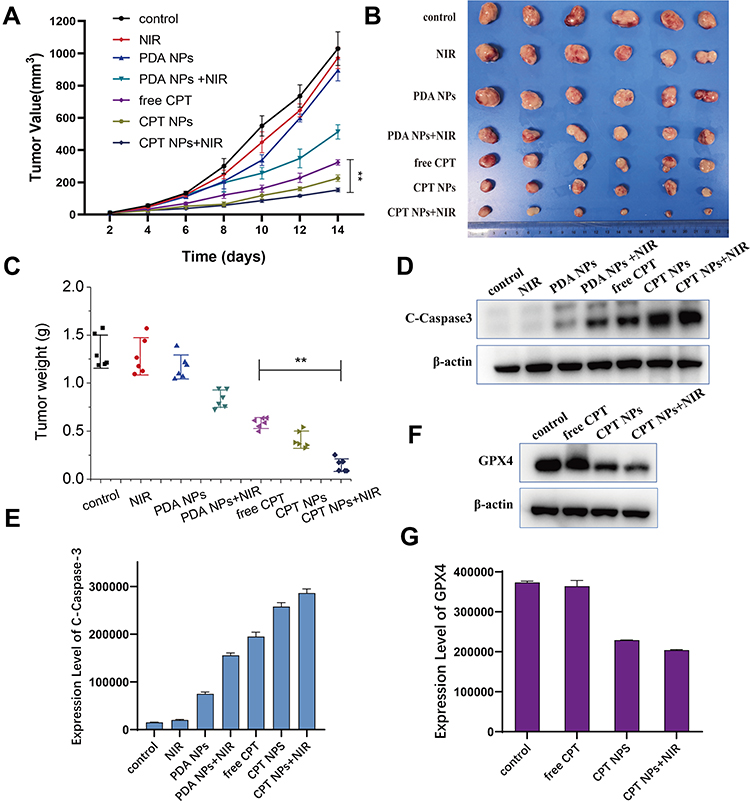 |
Figure 10 In vivo antitumor efficacy of the CPT NPs. (A) Tumor volume of LLC tumor bearing mice after systemic administration of saline only, NIR irradiation, blank PDA NPs, blank PDA NPs with NIR irradiation, free CPT, CPT NPs and CPT NPs plus NIR irradiation (2 W∙cm−2, 5 min), error bars represent mean ± SD (standard deviation, n = 6), **p<0.01. (B) Tumor photo. (C) Tumor weight, error bars represent mean ± SD (standard deviation, n = 6), **p<0.01. (D) Western blotting of C-Caspase-3. (E) Semi-quantitative of C-Caspase-3 expression. (F) Western blotting of GPX4 expression. (G) Semi-quantitative of GPX4 expression. |
As for the potential side effects of the nanomedicine, neither mouse death nor significant drop in body weight (Figure 11A) was observed during the monitoring period. In addition, no skin burn was found on the mice due to the relatively low power density (2 W∙cm−2) and time interval (5 min) used for PTT. Furthermore, hepatorenal toxicity of the CPT NPs was assessed in terms of ALT, AST and Cre using mouse serum. As shown in Figure 11B–D, the free CPT had the highest ALT, AST and Cre levels, while the CPT NPs without or with NIR laser had a relatively low influence on the hepatorenal function of the mice. Moreover, the blank PDA nanocarrier had no significant influence on the hepatorenal function, indicating that the nanomedicine possessed excellent biocompatibility.
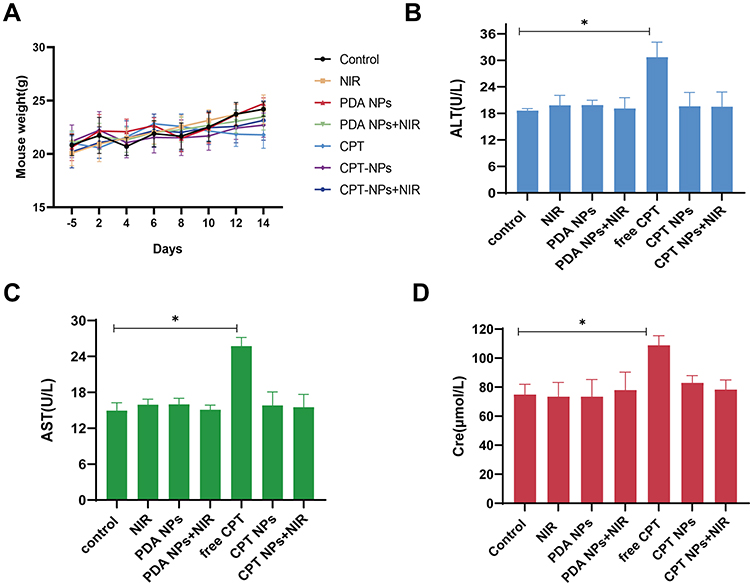 |
Figure 11 Mouse weight and changes in hepatorenal function indices. (A) Mouse weight, (B) ALT (alanine transaminase), (C) AST (aspartate transaminase) and (D) Cre (creatinine) values after treating with saline, NIR irradiation, blank PDA NPs, blank PDA NPs with NIR irradiation (2 W∙cm−2, 5 min), free CPT, CPT NPs and CPT NPs plus NIR irradiation, error bars representing mean ±SD (standard deviation, n=6), *p< 0.05. |
Conclusion
In summary, we developed a CPT-loaded and MnO2-coated PDA nanomedicine (CPT NPs). The CPT NPs had good biocompatibility and could release the anticancer drug CPT in low pH tumor microenvironment. Moreover, the CPT NPs had excellent photothermal conversion efficiency and could use for the PTT. Due to the modification of MnO2, the nanomedicine showed good MRI property. In addition, this nanomedicine could cause the ferroptosis of lung cancer cells. Notably, the nanomedicine could inhibit the growth of lung cancer cells with high efficiency and low toxicity in vitro and in vivo. More importantly, the nanomedicine delivery system could be applied to one or more other anticancer (genetic) drugs. Therefore, the nanodelivery platform provided a certain reference value for the construction of traditional Chinese medicine nanomedicine integrated in diagnosis and treatment.
Ethics Approval and Consent to Participate
All animal experiments were approved by the Institutional Animal Ethics Committee of Shanghai University of traditional Chinese medicine affiliated to Longhua Hospital (LHERAW-20012). In addition, all institutional and national guidelines for the care and use of animals were followed.
Funding
This work was supported by the National Natural Science Foundation of China (Grant Nos. 81625018, 81820108022, 82003297), Natural Science Foundation of Shanghai (20ZR1459100), Biomedical Science and Technology Support Project of Shanghai (22S11900800), Innovation Program of Shanghai Municipal Education Commission (2019-01-07-00-10-E00056), Program of Shanghai Academic/Technology Research Leader (18XD1403800), National Thirteenth Five-Year Science and Technology Major Special Project for New Drug and Development (2017ZX09304001).
Disclosure
Mingliang Su and Yukun Chen are co-first authors for this study. The authors declare that they have no competing interests in this work.
References
1. Sung H, Ferlay J, Siegel RL, et al. Global cancer statistics 2020: GLOBOCAN estimates of incidence and mortality worldwide for 36 cancers in 185 countries. CA Cancer J Clin. 2021;71(3):209–249. doi:10.3322/caac.21660
2. Thomas A, Liu SV, Subramaniam DS, Giaccone G. Refining the treatment of NSCLC according to histological and molecular subtypes. Nat Rev Clin Oncol. 2015;12(9):511–526. doi:10.1038/nrclinonc.2015.90
3. Jamal-Hanjani M, Wilson GA, McGranahan N, et al. Tracking the evolution of non-small-cell lung cancer. N Engl J Med. 2017;376(22):2109–2121. doi:10.1056/NEJMoa1616288
4. Rotow J, Bivona TG. Understanding and targeting resistance mechanisms in NSCLC. Nat Rev Cancer. 2017;17(11):637–658. doi:10.1038/nrc.2017.84
5. Varghese R, Dalvi YB. Natural products as anticancer agents. Curr Drug Targets. 2021;22(11):1272–1287. doi:10.2174/1389450121999201230204526
6. Fatima A, Yasir S, Khan MS, Manan S, Ullah MS, Ul-Islam M. Plant extract-loaded bacterial cellulose composite membrane for potential biomedical applications. J Bioresour Bioprod. 2021;6(1):26–32. doi:10.1016/j.jobab.2020.11.002
7. Luo H, Vong CT, Chen H, et al. Naturally occurring anti-cancer compounds: shining from Chinese herbal medicine. Chin Med. 2019;14(1):48. doi:10.1186/s13020-019-0270-9
8. Wall ME, Wani MC, Cook CE, Palmer KH, McPhail AT, Sim GA. Plant antitumor agents. I. The isolation and structure of camptothecin, a novel alkaloidal leukemia and tumor inhibitor from camptotheca acuminata1, 2. J Am Chem. 1966;88(16):3888–3890. doi:10.1021/ja00968a057
9. Hsiang YH, Hertzberg RP, Hecht SM, Liu LF. Camptothecin induces protein-linked DNA breaks via mammalian DNA topoisomerase I. J Biol Chem. 1985;260(27):14873–14878. doi:10.1016/s0021-9258(17)38654-4
10. Zhang HP, Zhu JL, Chu BY, Chen LJ, Qian ZY. Preparation, characterization and in vivo antitumor evaluation of a micellar formulation of camptothecin prodrug. Nanosci Nanotechnol Lett. 2017;9(11):1755–1766. doi:10.1166/nnl.2017.2554
11. Dai M, Xu X, Jia S, et al. Preparation of camptothecin-loaded PCEC microspheres for the treatment of colorectal peritoneal carcinomatosis and tumor growth in mice. Cancer Lett. 2011;312(2):189–196. doi:10.1016/j.canlet.2011.08.007
12. Tai W, Mo R, Lu Y, Jiang T, Gu Z. Folding graft copolymer with pendant drug segments for co-delivery of anticancer drugs. Biomaterials. 2014;35(25):7194–7203. doi:10.1016/j.biomaterials.2014.05.004
13. Gigliotti CL, Minelli R, Cavalli R, et al. In vitro and in vivo therapeutic evaluation of camptothecin-encapsulated β-cyclodextrin nanosponges in prostate cancer. J Biomed Nanotechnol. 2016;12(1):114–127. doi:10.1166/jbn.2016.2144
14. Ulukan H, Swaan PW. Camptothecins: a review of their chemotherapeutic potential. Drugs. 2002;62(14):2039–2057. doi:10.2165/00003495-200262140-00004
15. Pommier Y. Topoisomerase I inhibitors: camptothecins and beyond. Nat Rev Cancer. 2006;6(10):789–802. doi:10.1038/nrc1977
16. Chazin Ede L, Reis Rda R, Junior WT, Moor LF, Lucas F, Vasconcelos TR. An overview on the development of new potentially active camptothecin analogs against cancer. Mini Rev Med Chem. 2014;14(12):953–962. doi:10.2174/1389557514666141029233037
17. Zhang X, Tang K, Wang H, et al. Design, synthesis, and biological evaluation of new cathepsin B-sensitive camptothecin nanoparticles equipped with a novel multifuctional linker. Bioconjug Chem. 2016;27(5):1267–1275. doi:10.1021/acs.bioconjchem.6b00099
18. Sriram D, Yogeeswari P, Thirumurugan R, Ratan Bal TR. Camptothecin and its analogues: a review on their chemotherapeutic potential. Nat Prod Res. 2005;19(4):393–412. doi:10.1080/14786410412331299005
19. Bian K, Zhang X, Liu K, et al. Peptide-directed hierarchical mineralized silver nanocages for anti-tumor photothermal therapy. ACS Sustain Chem Eng. 2018;6(6):7574–7588. doi:10.1021/acssuschemeng.8b00415
20. Jiang Y, Fei W, Cen X, Tang Y, Liang X. Near-infrared light activatable multimodal gold nanostructures platform: an emerging paradigm for cancer therapy. Curr Cancer Drug Targets. 2015;15(5):406–422. doi:10.2174/1568009615666150407125333
21. Hussein EA, Zagho MM, Nasrallah GK, Elzatahry AA. Recent advances in functional nanostructures as cancer photothermal therapy. Int J Nanomedicine. 2018;13:2897–2906. doi:10.2147/IJN.S161031
22. Qu XY, Hong Y, Cai H, et al. Promoted intramolecular photoinduced-electron transfer for multi-mode imaging-guided cancer photothermal therapy. Rare Met. 2022;41(1):56–66. doi:10.1007/s12598-021-01795-0
23. Hd A, Zc A, Tian ZA, et al. Boron difluoride formazanate dye for high-efficiency NIR-II fluorescence imaging-guided cancer photothermal therapy. Chin Chem Lett. 2022;33(5):2501–2506. doi:10.1016/j.cclet.2021.11.079
24. Xiong R, Hua D, Van Hoeck J, et al. Photothermal nanofibres enable safe engineering of therapeutic cells. Nat Nanotechnol. 2021;16(11):1281–1291. doi:10.1038/s41565-021-00976-3
25. Peiyu S, Liying T, Zhen Z, Xinling W. Dopamine-containing mussel mimetic polyurethane. Acta Polymerica Sinica. 2009;9(8):803–808. doi:10.3724/SP.J.1105.2009.00803
26. Lee H, Dellatore SM, Miller WM, Messersmith PB. Mussel-inspired surface chemistry for multifunctional coatings. Science. 2007;318(5849):426–430. doi:10.1126/science.1147241
27. Farokhi M, Mottaghitalab F, Saeb MR, Thomas S. Functionalized theranostic nanocarriers with bio-inspired polydopamine for tumor imaging and chemo-photothermal therapy. J Control Release. 2019;309:203–219. doi:10.1016/j.jconrel.2019.07.036
28. Wang X, Zhang J, Wang Y, et al. Multi-responsive photothermal-chemotherapy with drug-loaded melanin-like nanoparticles for synergetic tumor ablation. Biomaterials. 2016;81:114–124. doi:10.1016/j.biomaterials.2015.11.037
29. Zhang J, Cui YX, Feng XN, Cheng M, Tang AN, Kong DM. pH-controlled intracellular in situ reversible assembly of a photothermal agent for smart chemo-photothermal synergetic therapy and ATP imaging. ACS Appl Mater Interfaces. 2019;11(43):39624–39632. doi:10.1021/acsami.9b14186
30. Yang G, Liu J, Wu Y, Feng L, Liu Z. Near-infrared-light responsive nanoscale drug delivery systems for cancer treatment. Coord Chem Rev. 2016;320:100–117. doi:10.1016/j.ccr.2016.04.004
31. Li S, Li Z, Pang J, et al. Polydopamine-mediated carrier with stabilizing and self-antioxidative properties for polyphenol delivery systems. Ind Eng Chem Res. 2018;57(2):590–599. doi:10.1021/acs.iecr.7b04070
32. Roberts DR, Holden KR. Progressive increase of T1 signal intensity in the dentate nucleus and globus pallidus on unenhanced T1-weighted MR images in the pediatric brain exposed to multiple doses of gadolinium contrast. Brain Dev. 2016;38(3):331–336. doi:10.1016/j.braindev.2015.08.009
33. Weinmann HJ, Brasch RC, Press WR, Wesbey GE. Characteristics of gadolinium-DTPA complex: a potential NMR contrast agent. AJR Am J Roentgenol. 1984;142(3):619–624. doi:10.2214/ajr.142.3.619
34. Rogosnitzky M, Branch S. Gadolinium-based contrast agent toxicity: a review of known and proposed mechanisms. Biometals. 2016;29(3):365–376. doi:10.1007/s10534-016-9931-7
35. Hu HH, Pokorney A, Towbin RB, Mille JH. Increased signal intensities in the dentate nucleus and globus pallidus on unenhanced T1-weighted images: evidence in children undergoing multiple gadolinium MRI exams. Pediatr Radiol. 2016;46(11):1590–1598. doi:10.1007/s00247-016-3646-3
36. Miller JH, Hu HH, Pokorney A, Cornejo P, Towbin R. MRI brain signal intensity changes of a child during the course of 35 gadolinium contrast examinations. Pediatrics. 2015;136(6):e1637–e1640. doi:10.1542/peds.2015-2222
37. Dou Y, Li X, Yang W, et al. PB@Au core-satellite multifunctional nanotheranostics for magnetic resonance and computed tomography imaging in vivo and synergetic photothermal and radiosensitive therapy. ACS Appl Mater Interfaces. 2017;9(2):1263–1272. doi:10.1021/acsami.6b13493
38. Yang GB, Gong H, Liu T, Sun XQ, Cheng L, Liu Z. Two-dimensional magnetic WS2@Fe3O4 nanocomposite with mesoporous silica coating for drug delivery and imaging-guided therapy of cancer. Biomaterials. 2015;60:62–71. doi:10.1016/j.biomaterials.2015.04.053
39. Jin Y, Li Y, Ma X, et al. Encapsulating tantalum oxide into polypyrrole nanoparticles for X-ray CT/photoacoustic bimodal imaging-guided photothermal ablation of cancer. Biomaterials. 2014;35(22):5795–5804. doi:10.1016/j.biomaterials.2014.03.086
40. Wen L, Chen L, Zheng S, et al. Ultrasmall biocompatible WO3-x nanodots for multi-modality imaging and combined therapy of cancers. Adv Mater. 2016;28(25):5072–5079. doi:10.1002/adma.201506428
41. Lee JH, Silva AC, Merkle H, Koretsky AP. Manganese-enhanced magnetic resonance imaging of mouse brain after systemic administration of MnCl2: dose-dependent and temporal evolution of T1 contrast. Magn Reson Med. 2005;53(3):640–648. doi:10.1002/mrm.20368
42. Liu Y, Ai K, Lu L. Polydopamine and its derivative materials: synthesis and promising applications in energy, environmental, and biomedical fields. Chem Rev. 2014;114(9):5057–5115. doi:10.1021/cr400407a
43. Chen Z, Jiao Z, Pan D, et al. Recent advances in manganese oxide nanocrystals: fabrication, characterization, and microstructure. Chem Rev. 2012;112(7):3833–3855. doi:10.1021/cr2004508
44. Fei W, Chen D, Tang H, et al. Targeted GSH-exhausting and hydroxyl radical self-producing manganese-silica nanomissiles for MRI guided ferroptotic cancer therapy. Nanoscale. 2020;12(32):16738–16754. doi:10.1039/d0nr02396e
45. Stockwell BR, Friedmann Angeli JP, Bayir H, et al. Ferroptosis: a regulated cell death nexus linking metabolism, redox biology, and disease. Cell. 2017;171(2):273–285. doi:10.1016/j.cell.2017.09.021
46. Zheng W, Fan H, Wang L, Jin Z. Oxidative self-polymerization of dopamine in an acidic environment. Langmuir. 2015;31:11671–11677. doi:10.1021/acs.langmuir.5b02757
47. Jiang J, Zhu L, Zhu L, Zhu B, Xu Y. Surface characteristics of a self-polymerized dopamine coating deposited on hydrophobic polymer films. Langmuir. 2011;27(23):14180–14187. doi:10.1021/la202877k
48. Ho CC, Ding SJ. The pH-controlled nanoparticles size of polydopamine for anti-cancer drug delivery. J Mater Sci Mater Med. 2013;24(10):2381–2390. doi:10.1007/s10856-013-4994-2
49. Zhang R, Su S, Hu K, et al. Smart micelle@polydopamine core-shell nanoparticles for highly effective chemo-photothermal combination therapy. Nanoscale. 2015;7(46):19722–19731. doi:10.1039/c5nr04828a
50. Bao X, Zhao J, Sun J, Hu M, Yang X. Polydopamine nanoparticles as efficient scavengers for reactive oxygen species in periodontal disease. ACS Nano. 2018;12(9):8882–8892. doi:10.1021/acsnano.8b04022
51. Fay F, Quinn DJ, Gilmore BF, McCarron PA, Scott CJ. Gene delivery using dimethyldidodecylammonium bromide-coated PLGA nanoparticles. Biomaterials. 2010;31(14):4214–4222. doi:10.1016/j.biomaterials.2010.01.143
52. Prasad P, Gordijo CR, Abbasi AZ, et al. Multifunctional albumin MnO2 nanoparticles modulate solid tumor microenvironment by attenuating hypoxia, acidosis, vascular endothelial growth factor and enhance radiation response. ACS Nano. 2014;8(4):3202–3212. doi:10.1021/nn405773r
53. Tang Q, Cheng Z, Yang N, et al. Hydrangea-structured tumor microenvironment responsive degradable nanoplatform for hypoxic tumor multimodal imaging and therapy. Biomaterials. 2019;205:1–10. doi:10.1016/j.biomaterials.2019.03.005
54. Lee JH, Ryu JS, Kang YK, Lee H, Chung HJ. Polydopamine sensors of bacterial hypoxia via fluorescence coupling. Adv Funct Mater. 2021;31(9):2007993. doi:10.1002/adfm.202007993
 © 2022 The Author(s). This work is published and licensed by Dove Medical Press Limited. The full terms of this license are available at https://www.dovepress.com/terms.php and incorporate the Creative Commons Attribution - Non Commercial (unported, v3.0) License.
By accessing the work you hereby accept the Terms. Non-commercial uses of the work are permitted without any further permission from Dove Medical Press Limited, provided the work is properly attributed. For permission for commercial use of this work, please see paragraphs 4.2 and 5 of our Terms.
© 2022 The Author(s). This work is published and licensed by Dove Medical Press Limited. The full terms of this license are available at https://www.dovepress.com/terms.php and incorporate the Creative Commons Attribution - Non Commercial (unported, v3.0) License.
By accessing the work you hereby accept the Terms. Non-commercial uses of the work are permitted without any further permission from Dove Medical Press Limited, provided the work is properly attributed. For permission for commercial use of this work, please see paragraphs 4.2 and 5 of our Terms.