")
Back to Journals » Patient Related Outcome Measures » Volume 9
Calibration and validation of an item bank for measuring general physical function of patients in medical rehabilitation settings
Authors Cook KF , Kallen MA, Hayes D, Deutscher D, Fritz JM, Werneke MW, Mioduski JE
Received 10 August 2017
Accepted for publication 3 November 2017
Published 28 December 2017 Volume 2018:9 Pages 11—16
DOI https://doi.org/10.2147/PROM.S148788
Checked for plagiarism Yes
Review by Single anonymous peer review
Peer reviewer comments 2
Editor who approved publication: Dr Liana Bruce
Karon F Cook,1 Michael A Kallen,1 Deanna Hayes,2 Daniel Deutscher,3 Julie M Fritz,4,5 Mark W Werneke,6 Jerome E Mioduski2
1Department of Medical Social Sciences, Feinberg School of Medicine, Northwestern University, Chicago, IL, USA; 2Focus On Therapeutic Outcomes, Inc., Knoxville, TN, USA; 3Department of Physical Therapy, Maccabi Healthcare Services, Tel-Aviv, Israel; 4Department of Orthopaedics, University of Utah School of Medicine, Salt Lake City, UT, USA; 5Department of Physical Therapy and Athletic Training, University of Utah School of Medicine, Salt Lake City, UT, USA; 6Private Practice, Waipahu, HI, USA
Objective: The objective of this study was to report the item response theory (IRT) calibration of an 18-item bank to measure general physical function (GPF) in a wide range of conditions and evaluate the validity of the derived scores.
Methods: All 18 items were administered to a large sample of patients (n=2337) who responded to the items in the context of their outpatient rehabilitation care. The responses, collected 1997–2000, were modeled using the graded response model, an IRT model appropriate for items with two or more response options. Inter-item consistency was evaluated based on Cronbach’s alpha and item to total correlations. Validity of scores was evaluated based on known-groups comparisons (age, number of health problems, symptom severity). The strength of a single, general factor was evaluated using a bi-factor model. Results were used to evaluate IRT assumption and as an indicator of construct validity. Local independence of item responses was also evaluated.
Results: Response data met the assumptions of unidimensionality and local independence. Explained common variance of a single general factor was 0.88 (omega hierarchical =0.86). Only two of the 153 pairs of item residuals were flagged for local dependence. Inter-item consistency was high (0.93) as were item to total correlations (mean =0.61). Substantial variation was found in both IRT location (difficulty) and discrimination parameters. All omnibus known-groups comparisons were statistically significant (p<0.001).
Conclusion: Item responses fit the IRT unidimensionality assumptions and were internally consistent. The usefulness of GPF scores in discriminating among patients with different levels of physical function was confirmed. Future studies should evaluate the validity of GPF scores based on an adaptive administration of items.
Keywords: item response theory, computerized adaptive testing, rehabilitation, functional status, patient-reported outcomes
Introduction
The Institute of Medicine has advocated,1 and a number of legislative efforts have supported,2–4 incentivizing performance instead of volume for the US health care delivery system. The envisioned future of a responsive, effective, and efficient health care delivery system that incentivizes performance requires the existence of psychometrically sound patient-reported outcomes measures (PROMs). Increasingly, PROMs are being administered using a tailored approach, known as computer adaptive testing (CAT).5,6 CAT has been developed for use in health outcomes,7,8 rehabilitation,9,10 and clinical applications.11,12 Adaptive item administration is attractive because it reduces respondent burden with little erosion of measurement precision.13,14
Focus On Therapeutic Outcomes, Inc. (FOTO) is an international measurement system that has provided data collection and reporting of medical rehabilitation outcomes since 1994.15,16 In 2001, FOTO began administering PROMs using CAT. The use of CAT requires the development of a bank of items that measure the targeted outcome and whose items have been calibrated using an item response theory (IRT) model.17 Most item banks developed by FOTO have targeted specific body parts.18–23 The purpose of this paper is to report on the calibration and evaluation of an item bank that is domain- rather than body-part-specific – the general physical function (GPF) scale.
Methods
Participants
Study data were drawn from a convenience sample of 2337 adult patients who were treated in clinical facilities participating with FOTO. These participants responded to all 18 items of the GPF item bank and to demographic and clinical questions. Data were collected from 1997 to 2000 in 20 different states in the USA. The study research was ruled exempt from human subjects review by Northwestern University, Chicago, IL institutional review board because the research involved study of existing data which were recorded by the investigator in such a manner that participants cannot be identified.
Instrumentation
GPF item bank
The GPF item bank includes 18 items originally developed to measure functional status. Eleven of the items were adapted from the RAND 36-Item Short Form Health Survey.24 The remainder was developed by FOTO clinician scientists to extend the effective measurement range of the measure. These items targeted lower levels of physical functioning to ensure good discrimination at the “floor” of the measure.
Demographics and clinical characteristics
In addition to responses to GPF items, patients reported their sex, age, impairment category, comorbidity and symptom acuity (“0” = Asymptomatic, no treatment needed at this time; “1” = Symptoms well controlled with current therapy; “2” = Symptoms controlled with difficulty, needs ongoing monitoring and affects daily functioning, “3” = Symptoms poorly controlled, needs frequent adjustment in treatment monitoring, and “4” = Symptoms poorly controlled, history of re-hospitalization).
Analyses
Item analyses, calibration, and scoring
Tests of IRT assumptions
Samejima’s logistic graded response model (GRM)31 was used to calibrate item responses. Like most IRT models, the GRM assumes response data are unidimensional and locally independent.17,25 Typically, the unidimensionality assumption is tested based on a confirmatory factor analysis that posits a single factor model and then evaluates the fit of that model based on standard fit criteria. Newer approaches fit a bifactor model to allow a more direct evaluation of the relevant statistical question of whether item responses are unidimensional enough to warrant calibration using a unidimensional IRT model.26 The bifactor model posits that all items load on a single general factor, and subsets of items load on a single, but different, group factors. From such a model, proportions of total (omega hierarchical) and common variance (explained common variance) accounted for by a general factor are estimated. To obtain these values, we fit a bifactor model using the psych package in R.27 Reise et al recommended “tentative” minimum criterion for omega hierarchical of greater than 0.50 (with >0.75 being preferred)26 and explained common variance ≥0.60.28
Local independence was evaluated by extracting the residuals remaining after responses were fit to a unidimensional confirmatory factor model using MPlus.29 IRT models assume that these residuals are not correlated. Standards for evaluating unidimensionality vary. Reeve et al recommended flagging and considering the deletion of items whose residuals correlate >0.20 with residuals of other items.30
Item level analyses
To estimate inter-item consistency, we calculated Cronbach’s alpha. We also estimated the correlations between item scores and total scores on the remaining items. A range of 0.70 to 0.80 has been recommended as a standard for group level measurement.
IRT calibration and scoring
Responses to the 18 GPF items were calibrated to the GRM31 using Parscale software.32 The GRM is appropriate for items with ordered polytomous responses, which is the format of the GPF items. The GRM allows item discrimination parameters (a) to vary, which is common for functional status items.33,34 After the GRM was fit, a linear transformation was performed so that GPF scores ranged from 0 to 100.
Construct validation
Known-groups construct validity
We hypothesized that lower GPF scores would be observed for those who were older, reported greater symptom severity, and had a higher number of health conditions. Participant ages were grouped into the ranges 18–44, 45–65, and >65. The five symptom severity categories were placed into four comparison groups. Because few participants endorsed the most severe category (“4”), scores of “3” and “4” were grouped into a single category, both of which include the descriptor, “poorly controlled”. Comorbidity groups were those with none, one, two, three, and greater than three comorbidities.
Known-groups hypotheses were tested first at the omnibus level (groups are significantly different overall) using analysis of variance (ANOVA). Comparison between pairs of levels was accomplished using Dunnett T3 Post Hoc Test.35
Unidimensionality
The evaluation of unidimensionality described previously served dual purposes. Unidimensionality is an assumption of the IRT model used to calibrate the item responses. A finding of unidimensionality also supports the construct validity of the measure in that it indicates that, as hypothesized, GPF is a single construct.
Results
Table 1 summarizes the demographic and clinical characteristics of the sample. The majority of respondents were female (63.8%). Mean age in years was 61 (SD =18.3; range 18 to 99); 79.0% were 45 or older. The most common impairment category was stroke (22.4%) followed by orthopedic conditions (18.6%) and pain syndrome (14.4%). Just over half of the sample had experienced symptoms for more than 90 days (50.4%).
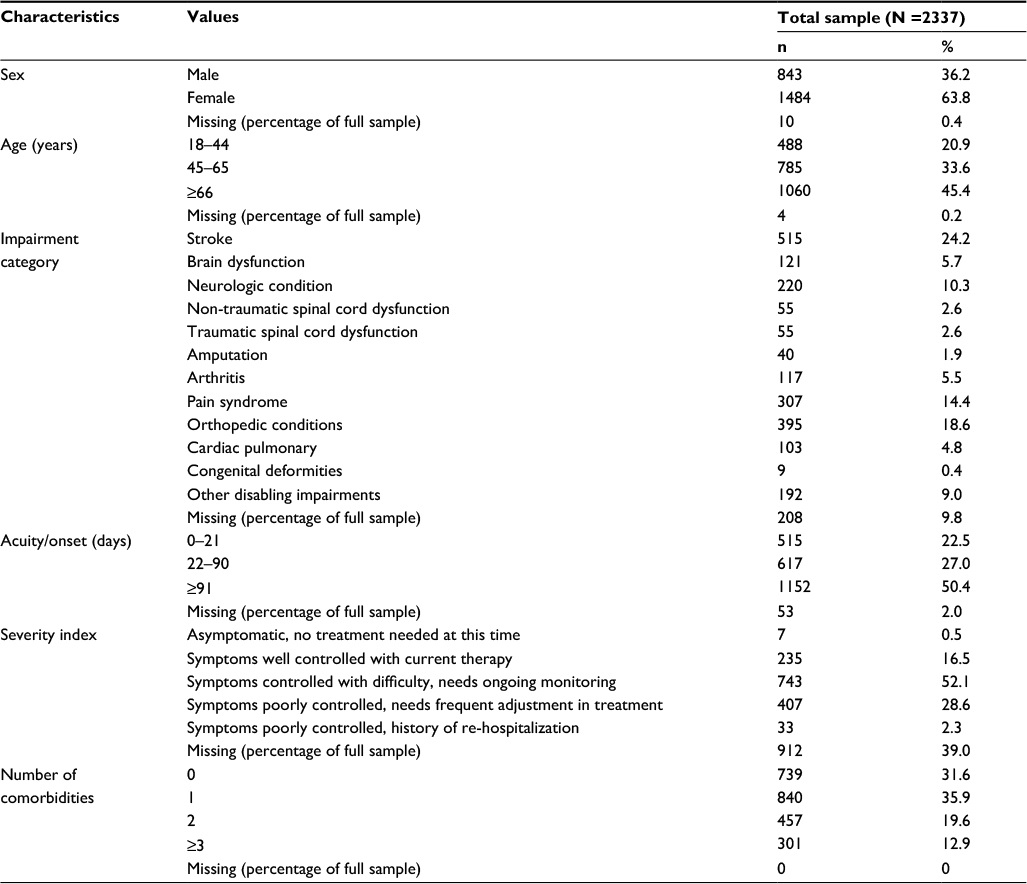 | Table 1 Sample characteristics |
Item analyses, calibration, and scoring
Tests of IRT assumptions
Based on a bi-factor model of responses to the 18 GPF items, we obtained an omega hierarchical value of 0.86 and an explained common variance of 0.88. These values are substantially higher than Reise et al’s suggested criteria for omega hierarchical (ie, greater than >0.75 preferred)26 and explained common variance (ie, ≥0.60), supporting the unidimensionality of the item responses.28
Assessment of local independence resulted in 153 possible paired comparisons between item residuals. Of these, only two had correlations >0.20. The residuals of the items, “How much does your health limit vigorous activities like running, lifting heavy objects, sports?” and “How much does your health limit participating in recreation?” had a correlation of 0.29. The residuals of the items, “How much does your health limit going on vacation?” and “How much does your health limit attending social events?” had a correlation of 0.26.
Item analyses
Cronbach’s alpha for the GPF item responses was very high (0.93). This result indicated very high inter-item consistency. The mean item score to total score correlation was 0.61. Correlation values ranged from 0.34 for the two-response item (“Do you limit the kind of work or other regular daily activities as a result of your physical health?”) to 0.74 (two items: “How much does your health limit climbing one flight of stairs/walking several blocks?”).
IRT calibration and scoring
Table 2 presents the item parameter estimates obtained in the GRM calibration of the GPF items. Items varied in discrimination (a; slope) confirming the need for use of a two-parameter IRT model that accounts both for item location and item discrimination (one-parameter models’ slopes are equal across items). The average location (ie, difficulty) of items on the logit metric ranged from -0.68 (“How much does your health limit completing your toileting?”) to 2.24 (“How much does your health limit vigorous activities like running, lifting heavy objects, sports?”).
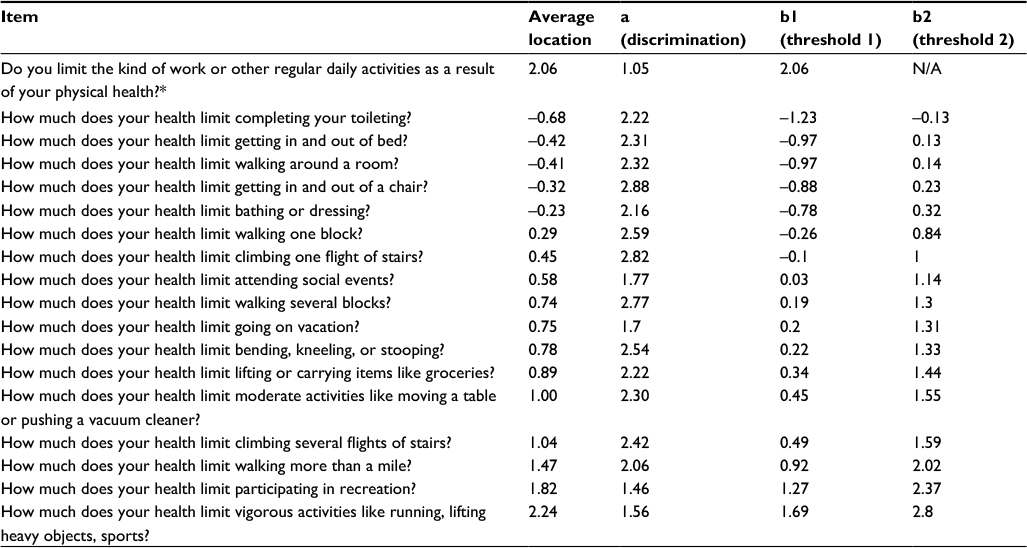 | Table 2 Item parameters for the general physical function scale Notes: *Response categories for this item were “yes” and “no”. For all other items, responses were: “yes, limited a lot”, “yes, limited a little”, and “no, not limited at all”. |
Construct validation
All omnibus known-groups comparisons were statistically significant (p<0.001) (Table 3). All but one pair-wise post hoc group comparison was significant at this level. Those with two comorbidities did not have scores that were significantly greater than those with three or more (p=0.144). The results related to unidimensionality supported that functional status was a single construct when measured in patients in this context.
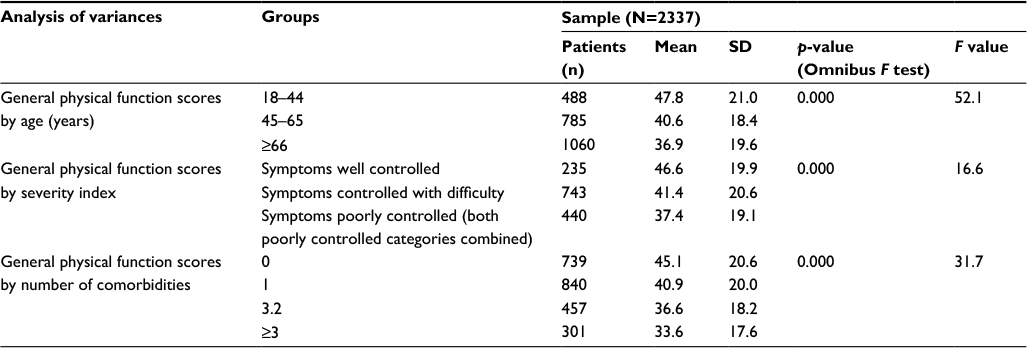 | Table 3 Known-groups validity results |
Limitation
A limitation of this study is that the items were presented to respondents as a full bank, which is convenient for item calibration and evaluation, but is different from administering using CAT. Future studies should evaluate the validity of GPF scores based on an adaptive administration of items.
Conclusion
We examined an item bank with the purpose of assessing GPF of patients receiving care in a rehabilitation setting. Based on the factor analytic results, we concluded that a dominant general factor drove responses to items in this large and medically diverse sample, supporting the unidimensionality of the scale. The assumption of local independence was largely upheld. Inter-item consistency was very high (0.93), and, if the GPF items were intended as a single, 18-item measure, would warrant concerns about redundancy. However, the items were developed as an item bank for CAT administration. Because Cronbach alpha values are a function of the number of items in the scale as well as covariances between item pair responses and variance in total score, values are typically high in item banks where the number of items tend to be larger. The usefulness of GPF scores in discriminating among patients with different levels of functional status was confirmed by the results of the known-groups analyses. The GPF scores effectively distinguished groups expected to have different score levels.
Disclosure
The authors report no conflicts of interest in this work.
References
Institute of Medicine. Rewarding Provider Performance: Aligning Incentives in Medicare. Washington, DC: National Academies Press; 2006. | ||
Grassley C. Medicare Value Purchasing Act of 2005. In: Senate US, ed. S.13562005. Available from: https://www.congress.gov/bill/109th-congress/senate-bill/1356. Accessed December 1, 2017. | ||
Johnson N. Medicare Value-Based Purchasing for Physicians’ Services Act of 2005. U.S. House of Representatives. H.R.36172005. Available from: https://www.congress.gov/bill/109th-congress/house-bill/3617. Accessed December 1, 2017. | ||
Wilson N. Medicare Outpatient Therapy Value-Based Purchasing Act of 2006. U.S. House of Representatives. USHo, ed. H.R.60482006. Available from: https://www.congress.gov/bill/109th-congress/house-bill/6048. Accessed December 1, 2017. | ||
Hart DL, Deutscher D, Werneke MW, Holder J, Wang YC. Implementing computerized adaptive tests in routine clinical practice: experience implementing CATs. J Appl Meas. 2010;11(3):288–303. | ||
Jette AM, Haley SM. Contemporary measurement techniques for rehabilitation outcomes assessment. J Rehabil Med. 2005;37(6):339–345. | ||
Kisala PA, Tulsky DS, Pace N, Victorson D, Choi SW, Heinemann AW. Measuring stigma after spinal cord injury: development and psychometric characteristics of the SCI-QOL Stigma item bank and short form. J Spinal Cord Med. 2015;38(3):386–396. | ||
Sung VW, Griffith JW, Rogers RG, Raker CA, Clark MA. Item bank development, calibration and validation for patient-reported outcomes in female urinary incontinence. Qual Life Res. 2016;25(7):1645–1654. | ||
Amtmann D, Cook KF, Johnson KL, Cella D. The PROMIS initiative: involvement of rehabilitation stakeholders in development and examples of applications in rehabilitation research. Arch Phys Med Rehabil. 2011;92(10 Suppl):S12–S19. | ||
Jette AM, Haley SM, Tao W, Ni P, Moed R, Meyers D, Zurek M. Prospective evaluation of the AM-PAC-CAT in outpatient rehabilitation settings. Phys Ther. 2007;87(4):385–398. | ||
Cook KF, Buckenmaier C 3rd, Gershon RC. PASTOR/PROMIS (R) pain outcomes system: what does it mean to pain specialists? Pain Manag. 2014;4(4):277–283. | ||
Wagner LI, Schink J, Bass M, et al. Bringing PROMIS to practice: brief and precise symptom screening in ambulatory cancer care. Cancer. 2015;121(6):927–934. | ||
Chien TW, Lin WS. Improving inpatient surveys: web-based computer adaptive testing accessed via mobile phone QR codes. JMIR Med Inform. 2016;4(1):e8. | ||
Gamper EM, Petersen MA, Aaronson N, et al. Development of an item bank for the EORTC Role Functioning Computer Adaptive Test (EORTC RF-CAT). Health Qual Life Outcomes. 2016;14:72. | ||
Swinkels IC, Hart DL, Deutscher D, van den Bosch WJ, Dekker J, de Bakker DH, van den Ende CH. Comparing patient characteristics and treatment processes in patients receiving physical therapy in the United States, Israel and the Netherlands: cross sectional analyses of data from three clinical databases. BMC Health Serv Res. 2008;8:163. | ||
Swinkels IC, van den Ende CH, de Bakker D, et al. Clinical databases in physical therapy. Physiother Theory Pract. 2007;23(3):153–167. | ||
Hays RD, Morales LS, Reise SP. Item response theory and health outcomes measurement in the 21st century. Med Care. 2000;38(9 Suppl):II28–II42. | ||
Deutscher D, Hart DL, Stratford PW, Dickstein R. Construct validation of a knee-specific functional status measure: a comparative study between the United States and Israel. Phys Ther. 2011;91(7):1072–1084. | ||
Hart DL, Cook KF, Mioduski JE, Teal CR, Crane PK. Simulated computerized adaptive test for patients with shoulder impairments was efficient and produced valid measures of function. J Clin Epidemiol. 2006;59(3):290–298. | ||
Hart DL, Wang YC, Stratford PW, Mioduski JE. Computerized adaptive test for patients with knee impairments produced valid and responsive measures of function. J Clin Epidemiol. 2008;61(11):1113–1124. | ||
Hart DL, Wang YC, Stratford PW, Mioduski JE. Computerized adaptive test for patients with foot or ankle impairments produced valid and responsive measures of function. Qual Life Res. 2008;17(8):1081–1091. | ||
Hart DL, Wang YC, Stratford PW, Mioduski JE. A computerized adaptive test for patients with hip impairments produced valid and responsive measures of function. Arch Phys Med Rehabil. 2008;89(11):2129–2139. | ||
Hart DL, Werneke MW, Wang YC, Stratford PW, Mioduski JE. Computerized adaptive test for patients with lumbar spine impairments produced valid and responsive measures of function. Spine (Phila Pa 1976). 2010;35(24):2157–2164. | ||
Hays RD, Sherbourne CD, Mazel RM. The RAND 36-Item Health Survey 1.0. Health Econ. 1993;2(3):217–227. | ||
Lord FM. Applications of Item Response Theory to Practical Testing Problems. Hillsdale, NJ: Lawrence Erlbaum Associates; 1980. | ||
Reise SP, Bonifay WE, Haviland MG. Scoring and modeling psychological measures in the presence of multidimensionality. J Pers Assess. 2013;95(2):129–140. | ||
R: A Language and Environment for Statistical Computing. [R version 3.2.5] [computer program]. Vienna, Austria: R Foundation for Statistical Computing; 2016. | ||
Reise SP, Scheines R, Widaman KF, Haviland MG. Multidimensionality and structural coefficient bias in structural equation modeling: a bifactor perspective. Edu Psychol Meas. 2012;73(1):5–26. | ||
Mplus User’s Guide. Seventh Edition, version 7.4 [computer program]. Los Angeles, CA: Muthén & Muthén; 1998–2015. | ||
Reeve BB, Hays RD, Bjorner JB, et al. Psychometric evaluation and calibration of health-related quality of life item banks: plans for the Patient-Reported Outcomes Measurement Information System (PROMIS). Med Care. 2007;45(5 Suppl 1):S22–S31. | ||
Samejima F. Estimation of latent ability using a response pattern of graded scores. ETS Res Bull Ser. 1968:i169. | ||
PARSCALE: IRT item analysis and test scoring for rating-scale data, version 4.1 [computer program]. Chicago, IL: Scientific Software International.; 2003. | ||
Kosinski M, Bjorner JB, Ware JE Jr, Sullivan E, Straus WL. An evaluation of a patient-reported outcomes found computerized adaptive testing was efficient in assessing osteoarthritis impact. J Clin Epidemiol. 2006;59(7):715–723. | ||
McHorney CA, Cohen AS. Equating health status measures with item response theory: illustrations with functional status items. Med Care. 2000;38(9 Suppl):II43–59. | ||
Dunnett CW. A multiple comparison procedure for comparing several treatments with a control. J Am Stat Assoc. 1955;50(272):1096–1121. |
 © 2017 The Author(s). This work is published and licensed by Dove Medical Press Limited. The full terms of this license are available at https://www.dovepress.com/terms.php and incorporate the Creative Commons Attribution - Non Commercial (unported, v3.0) License.
By accessing the work you hereby accept the Terms. Non-commercial uses of the work are permitted without any further permission from Dove Medical Press Limited, provided the work is properly attributed. For permission for commercial use of this work, please see paragraphs 4.2 and 5 of our Terms.
© 2017 The Author(s). This work is published and licensed by Dove Medical Press Limited. The full terms of this license are available at https://www.dovepress.com/terms.php and incorporate the Creative Commons Attribution - Non Commercial (unported, v3.0) License.
By accessing the work you hereby accept the Terms. Non-commercial uses of the work are permitted without any further permission from Dove Medical Press Limited, provided the work is properly attributed. For permission for commercial use of this work, please see paragraphs 4.2 and 5 of our Terms.