")
Back to Journals » Clinical Interventions in Aging » Volume 11
Calf-raise senior: a new test for assessment of plantar flexor muscle strength in older adults: protocol, validity, and reliability
Authors André HI, Carnide F, Borja E, Ramalho F, Santos-Rocha R , Veloso AP
Received 19 June 2016
Accepted for publication 2 August 2016
Published 15 November 2016 Volume 2016:11 Pages 1661—1674
DOI https://doi.org/10.2147/CIA.S115304
Checked for plagiarism Yes
Review by Single anonymous peer review
Peer reviewer comments 2
Editor who approved publication: Dr Richard Walker
Helô-Isa André,1 Filomena Carnide,1 Edgar Borja,2 Fátima Ramalho,1,2 Rita Santos-Rocha,1,2 António P Veloso1
1Laboratory of Biomechanics and Functional Morphology, Interdisciplinary Study Centre for Human Performance (CIPER), Faculty of Human Kinetics (FMH), University of Lisbon, Portugal; 2Sports Science School of Rio Maior (ESDRM), Polytechnic Institute of Santarém, Portugal
Purpose: This study aimed to develop a new field test protocol with a standardized measurement of strength and power in plantar flexor muscles targeted to functionally independent older adults, the calf-raise senior (CRS) test, and also evaluate its reliability and validity.
Patients and methods: Forty-one subjects aged 65 years and older of both sexes participated in five different cross-sectional studies: 1) pilot (n=12); 2) inter- and intrarater agreement (n=12); 3) construct (n=41); 4) criterion validity (n=33); and 5) test–retest reliability (n=41). Different motion parameters were compared in order to define a specifically designed protocol for seniors. Two raters evaluated each participant twice, and the results of the same individual were compared between raters and participants to assess the interrater and intrarater agreement. The validity and reliability studies involved three testing sessions that lasted 2 weeks, including a battery of functional fitness tests, CRS test in two occasions, accelerometry, and strength assessments in an isokinetic dynamometer.
Results: The CRS test presented an excellent test–retest reliability (intraclass correlation coefficient [ICC] =0.90, standard error of measurement =2.0) and interrater reliability (ICC =0.93–0.96), as well as a good intrarater agreement (ICC =0.79–0.84). Participants with better results in the CRS test were younger and presented higher levels of physical activity and functional fitness. A significant association between test results and all strength parameters (isometric, r=0.87, r2=0.75; isokinetic, r=0.86, r2=0.74; and rate of force development, r=0.77, r2=0.59) was shown.
Conclusion: This study was successful in demonstrating that the CRS test can meet the scientific criteria of validity and reliability. The test can be a good indicator of ankle strength in older adults and proved to discriminate significantly between individuals with improved functionality and levels of physical activity.
Keywords: elderly, heel-raise test, ankle, isometric, strength, functionality
Introduction
The aging process associated with a sedentary lifestyle can lead to the decline of some physical capacities, including muscle strength and power,1–3 which is associated with functional limitations in daily living activities4–6 and, therefore, to an increased risk of falling.7,8 The identification of risk factors for falls is claimed to be critical to the development of appropriate preventive intervention strategies aiming at reducing the incidence of falling in the older population.9
Muscle weakness, gait, and balance deficits are considered as intrinsic risk factors with the highest relative risk for falls.8,10 Neuromuscular changes of the ankle muscle–tendon complex appear to play a very important role in the prevention of falls in older people since the plantar flexor muscles are heavily involved in the generation of torque in gait and other functional activities such as stair climbing and chair rising.11–14
Despite such evidence, only a few references can be found in the literature in relation to field tests that can be used to assess ankle muscle strength and power in the older population and their association with mobility decline and/or functionality.15–18 The “timed up and go”, “get up and go”, and “8 foot up and go” tests19–21 are recognized for their potential to predict the risk of falls in older adults.8,22–24 To the authors’ knowledge, these are the only field tests that can provide indirect information about ankle muscle functionality, since their results are dependent on the strength and power generated by lower limb extensor muscles to perform the motor task in the shortest possible period. However, the composite features of these tests – which also involve other abilities such as coordination, reaction speed, and dynamic balance – make it difficult to identify those capacities that have greater significance in the results of the test. An often used field test aiming at assessing the ankle muscle function is the “calf-raise test” (CRT) also known as “heel-rise test”. This test involves continuous concentric and eccentric plantar flexion (PF) actions with a maximum range of motion.15,25–28 Moreover, it could be an effective tool to evaluate the functional performance of older adults, since these actions are necessary for performing typical activities such as walking, ascending/descending stairs, and getting up from a chair.
This test requires neither special equipment nor much time for preparation and administration, which is advantageous for field testing. Although CRT is widely used in clinical evaluations, there is no general consensus in the literature about the description of the test protocol. A systematic review25 identified discrepancies in studies using CRT for assessment of ankle functionality with respect to the main parameters evaluated, values of reliability and validity, and also a lack of standardization of an appropriate protocol for the different objectives.
Moreover, most studies restrict the administration of this test to the young adult25,29 and child population,30,31 and existing protocols are too difficult for older adults.32 To the authors’ knowledge, there is no study that has validated CRT for assessing older adults’ performance, and the few studies targeting this population were not conducted for that purpose.15–17
Considering the above-mentioned limitations, this study aimed to 1) develop a new field test protocol to evaluate the plantar flexor’s strength and power, targeted to functionally independent older adults, the calf-raise senior (CRS) test, and 2) evaluate the reliability and validity of the CRS test, in order to include it in a comprehensive functional fitness (FF) assessment battery.
Patients and methods
Study design and participants
The development and validation of the CRS test involved five cross-sectional studies that included 1) a pilot study prior to testing to define the proper assessment protocol for the above-mentioned objectives; 2) inter- and intrarater agreement; 3) construct; 4) criterion validity; and 5) test–retest reliability studies. The flow diagram of the attendance to the studies is shown in Figure 1.
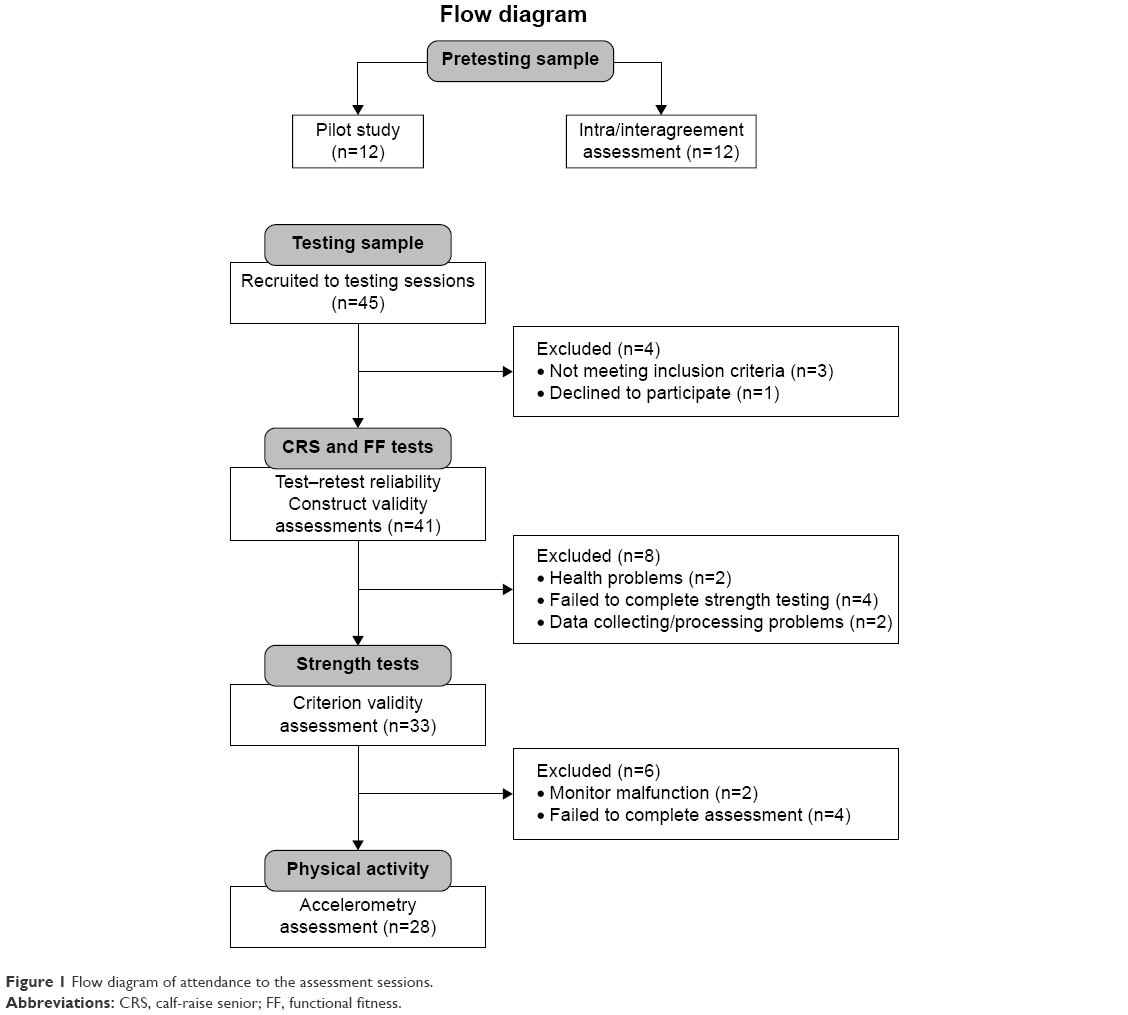 | Figure 1 Flow diagram of attendance to the assessment sessions. |
Forty-five subjects aged 65 years and older, of both sexes, were recruited at different sites in the Lisbon and Tagus Valley region (Portugal) to participate in this study. Participants were randomly selected from day care centers, senior schools, fitness centers, and community physical activity (PA) programs. This procedure aimed at establishing a cohort of older adults with different levels of PA and FF.
Subjects were considered eligible for participation if they were aged 65 years and older, lived independently in the community, and had locomotor autonomy. The following exclusion criteria were considered: difficulty in speaking and/or understanding the Portuguese language; neurologic (Dementia, Parkinson, or stroke) or cardiovascular (including unstable or uncontrolled hypertension) conditions clinically diagnosed by physicians; use of a walking aid; presence of hip, knee, or ankle prosthesis, or other musculoskeletal disease in the lower limb that affected the gait pattern; and surgery within the previous 6 months.
In each study, some participants were excluded for the following reasons: health problems, difficulties in performing strength testing procedures (lack of coordination and/or exhaustion during the assessments), pain in lower limbs or any discomfort during test protocols or in the hours immediately after these, and data collection/processing problems. Reasons for exclusion in the accelerometry analysis were the failure to complete the standards of the protocol, incomplete data, and/or monitor malfunction.
All participants voluntarily agreed to participate in the study and signed an informed consent (including images and/or videos that could be used in scientific papers). The study was approved by the Ethics Committee of Faculty of Human Kinetics, University of Lisbon.
Pilot study
A pilot study was conducted with the aim of comparing the different key parameters of CRT protocols found in the literature25,33 and to define and standardize a simple, low-cost, reliable, and accessible protocol. It should also aggregate ease of performing, administer, and score both among participants and raters. Assessments were carried out 6 months before the beginning of validation/reliability studies in a subset of 12 active seniors, that is, participants who perform moderate-intensity PA for a minimum of 30 minutes 5 days each week or who participate in supervised PA programs with a minimum of 20 minutes vigorous intensity, three or more times a week.34 The PA criterion was determined in order to avoid possible bias in the analysis due to the lack of coordination, balance, or strength, often common in older adults with low levels of physical fitness. Participants were instructed to perform the calf-raise movement continuously during 30 seconds, in each selected task, in a random order, with an interval rest of 3 minutes between them, using the number of raises as an outcome measurement. They were evaluated in four different tasks, which combined the following features: A) unilateral limb support;25,29 B) bilateral limb support;16,32 C) predetermined rate of 60 repetitions·min−1 defined by metronome;15,26,35 and D) maximum repetitions in 30 seconds using a self-determined pace.20 The participants were barefoot, heels on the ground, knees extended, using their fingers supported on a wall for balance. They were asked to raise their heels as high as possible during the test, maintaining the range of movement by placing their head against an upper bar (Figure 2). After finishing the four tasks (AC, AD, BC, and BD), they answered a questionnaire specially developed for this study, with closed and open questions, regarding their perception of the following task characteristics: comfort, difficulty, pain, and effort. Four experienced examiners participated simultaneously in the assessment sessions and answered a modified version of the same questionnaire after finishing all the assessments, considering the feasibility of this protocol regarding the test practicability, ease in scoring, and manageability of equipment.
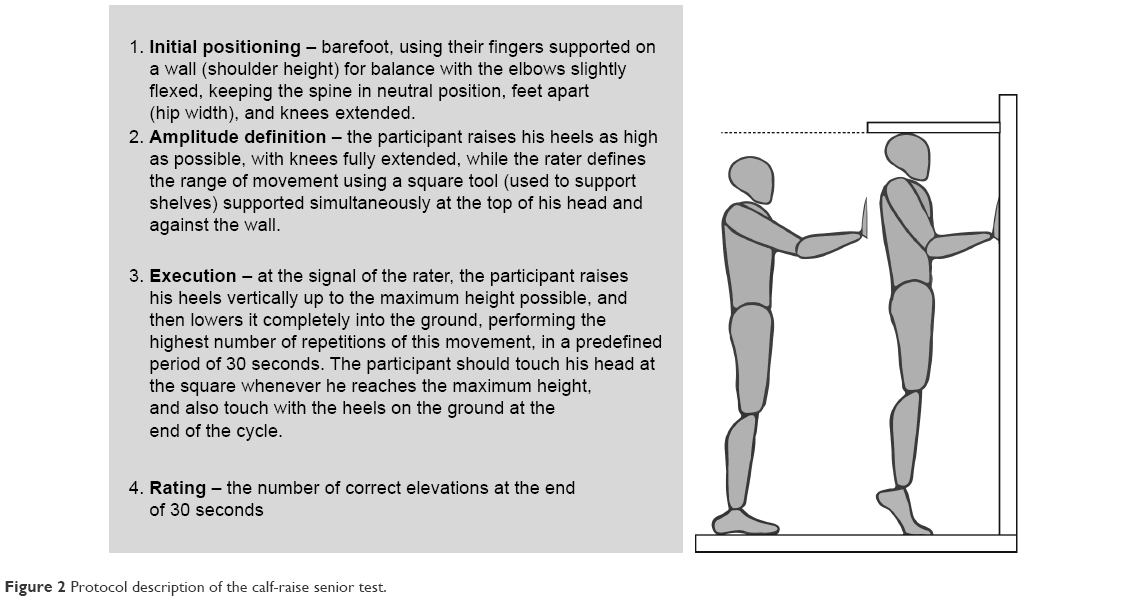 | Figure 2 Protocol description of the calf-raise senior test. |
Inter- and intrarater reliability
Following the participation in the pilot study, the same 12 older adults were enrolled in the intra- and interrater agreement study and completed all required assessments. The participants were evaluated twice by two examiners, following a random order, with an interval of 3 minutes between the assessments. The examiners were blinded to the results of previous measurements and were advised to repeat the instructions and to motivate all participants across all assessments similarly. The results of each participant’s tests were compared between raters to verify the interrater reliability of CRS test, and the results of the same individuals and raters were compared to evaluate the intrarater reliability.
Validation and reliability
Participants attended an assessment protocol that lasted 2 weeks, including three testing sessions, with a 1-week interval between the first and second sessions and 48–72 hours between the second and third, with the following structure: first session – assessment of demographics and health through questionnaires,36 FF tests, and familiarization of the CRS test; second session – CRS test, anthropometry, and isokinetic dynamometer strength assessment familiarization, described later; and third session – final strength assessment. Pretesting sessions, with the participation of seven elderly subjects, were conducted prior to testing in order to define the strength protocol.
CRS protocol
The CRS test was conducted in two different sessions with an interval of 1 week between them, in order to assess the test–retest reliability. These tests were conducted by two raters with specific training and experience in pretesting sessions. Participants were tested by the same examiner in the two sessions, and the CRS test protocol was defined, after the results of pilot study, as shown in Figure 2.
Physical activity
Free-living PA energy expenditure was also measured using a uniaxial accelerometer Actigraph GT1M model (Manufacturing Technology Inc., Tampa, FL, USA). Participants were asked to use the device for 7 consecutive days, starting next day, on the right hip, above the iliac crest, using an adjustable elastic belt.37 They were instructed to wear it during waking hours and to remove it while sleeping or doing other activities that could damage the device (eg, bathing and swimming). A daily log was provided to report the periods in which the accelerometer was worn or removed. Data for PA were recorded using epochs of 1 minute, as commonly adopted in previous studies,38,39 and uploaded at the end of the seventh day to the software Actilife Lifestyle (v.3.2) and analyzed by MAHUffe software v.1.9.0.3 (available from www.mrc-epid.cam.ac.uk/).
PA intensity was categorized using the cutoffs established by Freedson et al.37 All logs completed by the subjects were checked and matched against accelerometer data. Continuous sequences of ≥60 consecutive zero counts were excluded from the analysis for the purpose of distinguishing periods in which the accelerometer was not being worn. Individuals failing to provide a minimum of 4 days of valid recording (≥10 h·d−1 or ≥3,000 counts·d−1) were excluded from the study.
Functional fitness
In order to classify the participants according to their functional capabilities, seven relevant tests were selected based on their ability to detect a functional decline associated with aging20,24,40 and their feasibility in clinical settings. Three tests from the “senior fitness tests” battery20 were used to assess strength, agility, and cardiorespiratory function: “chair stand up for 30 seconds”; “8 foot up and go”; and “2-minute step”. Balance function was evaluated using four tests from “Fullerton Advanced Balance”41 (FAB) scale: items 4 – step up and over (FAB4) and 5 – tandem walk (FAB5) to assess dynamic balance and items 6 – stand on one leg (FAB6) and 7 – stand on foam, eyes closed (FAB7) for static balance. Weight and height were also evaluated, allowing the calculation of body mass index (BMI). All the tests were administered by well-trained examiners.
Strength protocol
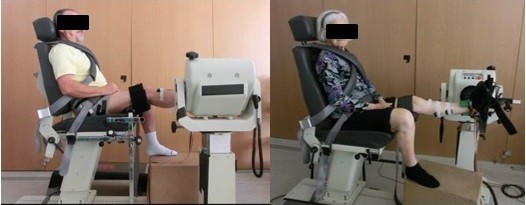
A BiodexSystem III (Biodex Corporation, Shirley, NY, USA) isokinetic dynamometer was used to evaluate both isokinetic and isometric PF strength in the dominant foot. The dominance was defined as the preferred foot to kick a ball. There were only two subjects who showed dominance in the left foot, and they were evaluated using the correspondent leg. The participants were positioned on the equipment in a sitting position in a 5° hip flexion (measurement obtained by manual goniometer) keeping the limb at the maximum comfortable extension possible according to their flexibility limitations. The position was chosen in accordance with previous studies involving the same population42,43 and also considering the results of the pretesting sessions in which subjects showed similar values of strength when comparing sitting and supine lying positions. Additionally, the supine position was described as uncomfortable for the lumbar and cervical spine and the equipment difficult to get in and out of by the frail participants. The knee was sustained by a support in order to avoid hyperextension and equipped with a biaxial electrogoniometer (Biopac System, Inc., Santa Barbara, CA, USA) to verify the stability and lack of involvement of the extensor muscles during movement. In order to stabilize and minimize body movement during testing, each subject was secured to the chair with Velcro straps at the knee, pelvis, and the trunk, and the arms were kept crossed over the chest. The foot was attached to a pedal and fixed with belts. The lateral malleolus was aligned with the rotational axis of the dynamometer, and the reference angle (0°) corresponded to the vertical alignment of the pedal (verified by an aluminum I-beam level). The gravity correction followed procedures provided by the manufacturers. Passive motion was used to warm-up in three series of three-cycle movements of dorsiflexion (DF) and PF using velocities of 60°·s−1, 45°·s−1, and 30°·s−1, respectively (Figure 3).
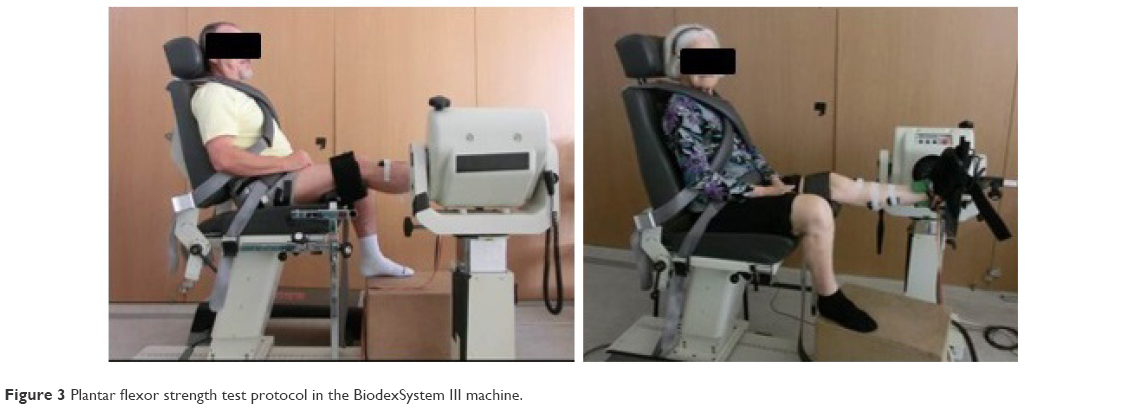 | Figure 3 Plantar flexor strength test protocol in the BiodexSystem III machine. |
Maximal isokinetic (MISK) strength was measured in a concentric/concentric mode in cycles of DF and PF continuous motion at a speed of 30°·s−1 using the maximum strength and a greater range of possible movement. This speed was chosen based on other studies involving older subjects43 and results of pretesting sessions in which the subjects showed a lack of motion control in the transition phase between DF/PF using the rate of 60°·s−1 (which corresponded to the average speed recorded during the CRS test). The protocol was repeated three times with a 2-minute rest between sets. Peak torque was determined as the highest torque generated throughout each individual’s full range of motion from the three trials. The angle of highest torque obtained from each subject in the isokinetic test was chosen to perform the isometric strength testing. In the isometric test, the participants were encouraged to push with maximum PF force against the pedal, statically, and then with the greatest possible speed, holding this contraction for 3–5 seconds, for a total of three sets.42 The predicted isometric strength was determined as the maximum torque generated during each 3–5 seconds contraction, and the best value of the three force–time curves was considered. All the tests were conducted by the same research examiner, who gave standardized instructions and verbal encouragement to the participants. Each session of strength assessment lasted ~1 hour. No adverse events were observed or reported by any subject during either strength or FF tests.
Data collection and processing
Strength parameters
Maximal isometric (MISM) and MISK torques and rate of force development (RFD) were parameters obtained from strength test’s F–t curves. The F–t curve was calculated using the average points obtained from a “moving window of ten samples” with a smoothing procedure of the isokinetic dynamometer (Biodex Corporation) signal. The analysis of the MISM torque and RFD parameters was performed over a period of 0.5 seconds selected from the value corresponding to the peak signal in the range of 3–5 seconds contraction. The MISM torque (N·m) was considered to be the highest value in this period of the F–t curve, and the RFD (N·s−1) the average value selected along the F–t curve divided by the respective sampling time, which is the greater slope of the curve.
Data analysis
Pilot testing was analyzed using a mixed methodological approach that involved quantitative and qualitative methods: frequency distribution analysis of questionnaire responses on each task and condition and through an interpretative content analysis of the responses to address test feasibility, taking into account that this test should be used in older populations with a wide range of functional ability. It should also have a social acceptance and be safe, easy, and quick to administer and score, requiring minimal equipment and space, according to recommendations from Rikli and Jones.20,44
The inter- and intrarater reliability of the CRS test and the test–retest reliability were analyzed using Pearson’s coefficient of correlation (r) and the intraclass correlation coefficient (ICC), using a two-way random-effects model (ICC2,1) with 95% confidence intervals (CIs).45 The benchmarks suggested by Fleiss46 were used to interpret the ICC values. The standard error of measurement and confidence limits were calculated using an Excel spreadsheet according to the principles described in Hopkins.47
In order to determine the criterion validity of the CRS test, the following statistical tests were applied: Pearson’s correlation coefficient and simple linear regression (Enter method) to assess the association between the number of repetitions at the CRS test and the strength parameters48 and Student’s t-test to determine whether CRS results were different for the two groups of strength. CRS test results were considered as the values obtained on the second day of testing (trial 2).
The construct validity of the CRS test was assessed by a comparison between test results (also in trial 2) of subgroups of subjects, which have presumed differences regarding the construct of interest.20 Comparisons were made between groups of participants, considering 1) age (<72 years and ≥72 years; considering participants’ median age); 2) PA profiles verified in accelerometry assessment (less active = moderate/vigorous activity per week <30 min·d−1, sufficiently active = moderate/vigorous activity per week ≥30 min·d−1); and 3) FF profiles considering median scores of total functional fitness score (TFFS) parameter (<14.0 points and ≥14.0 points). The TFFS was obtained by summing all FF variables after recoding continuous ones into the ordinal scale (points) and adapting for sex, according to the norms established by Rikli and Jones.20 Student’s t-test or Mann–Whitney tests were run to determine if there were differences in CRS scores among groups and Cohen’s d effect size to supplement information about the dimension of the effect, considering medium effect sizes as clinically relevant differences (ie, |d|>0.5 and η2P>0.06).48
Receiver-operating characteristic (ROC) curves were developed, and the cutoff points, with the greatest sum of sensitivity and specificity, were determined for the CRS test, since good specificity and good sensitivity are important for developing interventions that can be targeted to the people who are most likely to gain benefit. The optimum cutoff value was determined in order to differentiate the strongest group from the weakest one, using the MISM variable as an outcome measure. A protocol aimed at determining cutoff points >0.5 (or 50%) for specificity and sensitivity was used.
All statistical analyses were performed using IBM SPSS Statistics software (21.0 for Windows), and the statistical significance was accepted at the P<0.05 level.
Results
Forty-one older participants of both sexes (56.1% females), mean age 73.9±7.7 years and BMI of 25.2±2.7 kg·m−2 (body mass: 65.7±10.8 kg and body height: 161.4±0.1 m), met the inclusion criteria and completed all FF tests (days 1 and 2). The characterization of the participants is shown in Table 1.
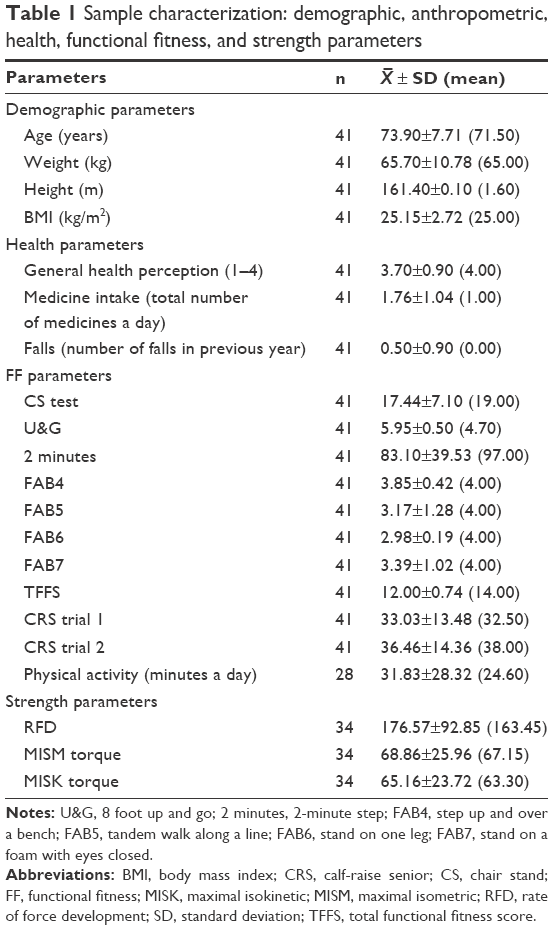 | Table 1 Sample characterization: demographic, anthropometric, health, functional fitness, and strength parameters |
It was possible to verify that all participants were able to score in the test, with the lowest scores in the range of 22 repetitions and the highest 51 repetitions, showing the lack of floor effects.
From those, 33 participants (57% females, mean age: 72.7±6.9 years and BMI: 25.6±2.9 kg·m−2) completed all the tests (days 1, 2, and 3), and their data were included in the convergent validation analysis. Only 28 subjects in this sample presented satisfactory accelerometry data for PA analysis.
The 12 active seniors who participated in the pilot and inter-/intrarater agreement studies were mostly females (61.6%), with a mean age of 72.8±1.87 years, and a BMI of 26.2±0.2 kg·m−2. No differences were found between subgroups and total sample in all evaluated parameters.
Pilot study
The analysis of questionnaire responses revealed that most participants felt more comfortable and secure when performing the calf-raise movements in bilateral support (59.1%) because of difficulties in maintaining their balance using unilateral support. Although there were no differences in preferences for task velocities (50.1% controlled pace vs 49.9% maximum repetitions), 41.7% of the participants failed to follow the predefined cadence properly due to lack of coordination or hearing problems, and it was assumed that maximum self-paced velocity in predetermined time (30 seconds) was the best feature of this test. The raters also reported difficulties in controlling the execution parameters when the tasks were performed in unilateral support, thus preferring bilateral support. In general, participants considered the BD task (maximum repetitions in 30 seconds, bilateral limb support) as one of the four tasks that proved to be most comfortable to perform (30.4% of preferences), choosing in second place the BC task (28.7%, predetermined rate of 60 repetitions·min−1, bilateral support), followed by AC task (21.4%, predetermined pace, unilateral support), and finally the AD task (19.5%, maximum repetitions in 30 seconds, unilateral support).
Intra- and interrater agreement
The results obtained in intra- and interrater agreement studies are shown in Table 2. The mean score presented in the CRS test in the four trials was 31.79±7.01 repetitions, and the mean difference between trials was 0.96±4.32 repetitions.
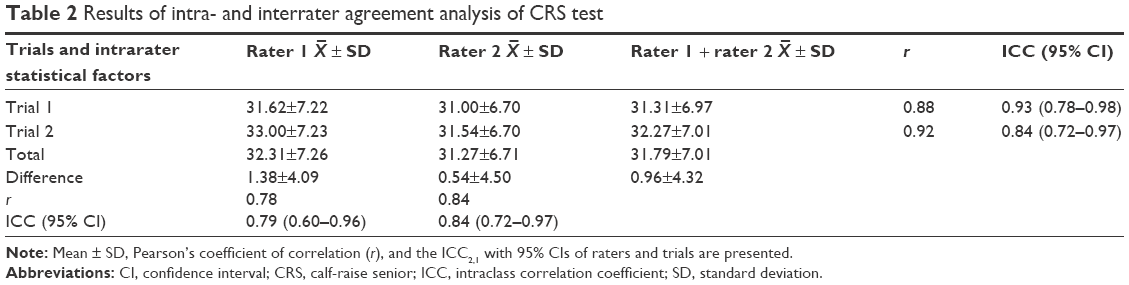 | Table 2 Results of intra- and interrater agreement analysis of CRS test |
The CRS test presented a good intrarater agreement verified by an ICC range from 0.79 (rater 1: r=0.78, 95% CI: 0.60–0.96) to 0.84 (rater 2: r=0.84, 95% CI: 0.72–0.97) when comparing measures 1 and 2 of the same rater and an excellent interrater agreement indicated by an ICC ranging from 0.93 (trial 1: r=0.88, 95% CI: 0.78–0.98) to 0.96 (trial 2: r=0.92, 95% CI: 0.87–0.98) between raters.
Construct validity
Results of the comparison between groups are shown in Table 3 and reveal significant statistical differences on all studied variables, which confirm the construct validity of this test. It was demonstrated a consistent decrease in performance in CRS test across age groups (younger participants 46.23±10.62 vs older participants 27.20±8.95, P<0.01), considering the median age of the participants (72 years). When using other cutoffs (75 years and 80 years), the CRS scores were also different among groups. Similarly, the subjects with higher levels of PA and FF were those who presented better results in the CRS test. Also, as expected, older men were proven to perform better in this test, although females were the largest group. Moreover, large effect sizes were found for all group variables analyzed.
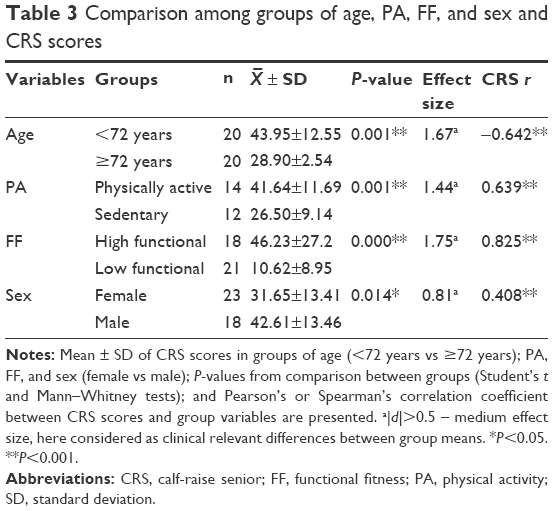 | Table 3 Comparison among groups of age, PA, FF, and sex and CRS scores |
Concurrent (criterion) validity
The CRS test presented moderate-to-high correlations with MISM and MISK torques and moderate correlations with RFD (r=0.87, r=0.86, r=0.77, P<0.001, respectively), on the total group of participants (Table 4).
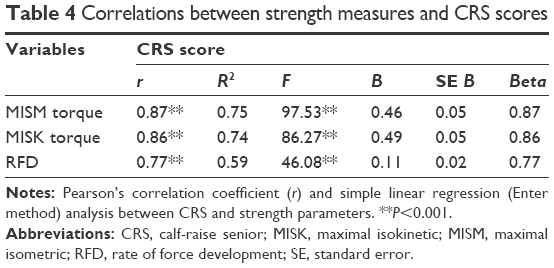 | Table 4 Correlations between strength measures and CRS scores |
Linear regression analysis (Figure 4) established that the number of repetitions in the CRS test could statistically predict maximum PF isometric strength on older participants (F(1,32)=97.53, P<0.00) and CRS test results accounted for 75% of the explained variability in strength. The regression equation was MISM =8.273+1.485× (CRS result). There was the independence of residuals as assessed by a Durbin–Watson statistic of 2.19 (d ≥2). The linear regression calculations using MISK and RFD variables were also positive and statistically significant, but the capacity of the CRS test in predicting ankle isokinetic strength and RFD was lower than isometric strength.
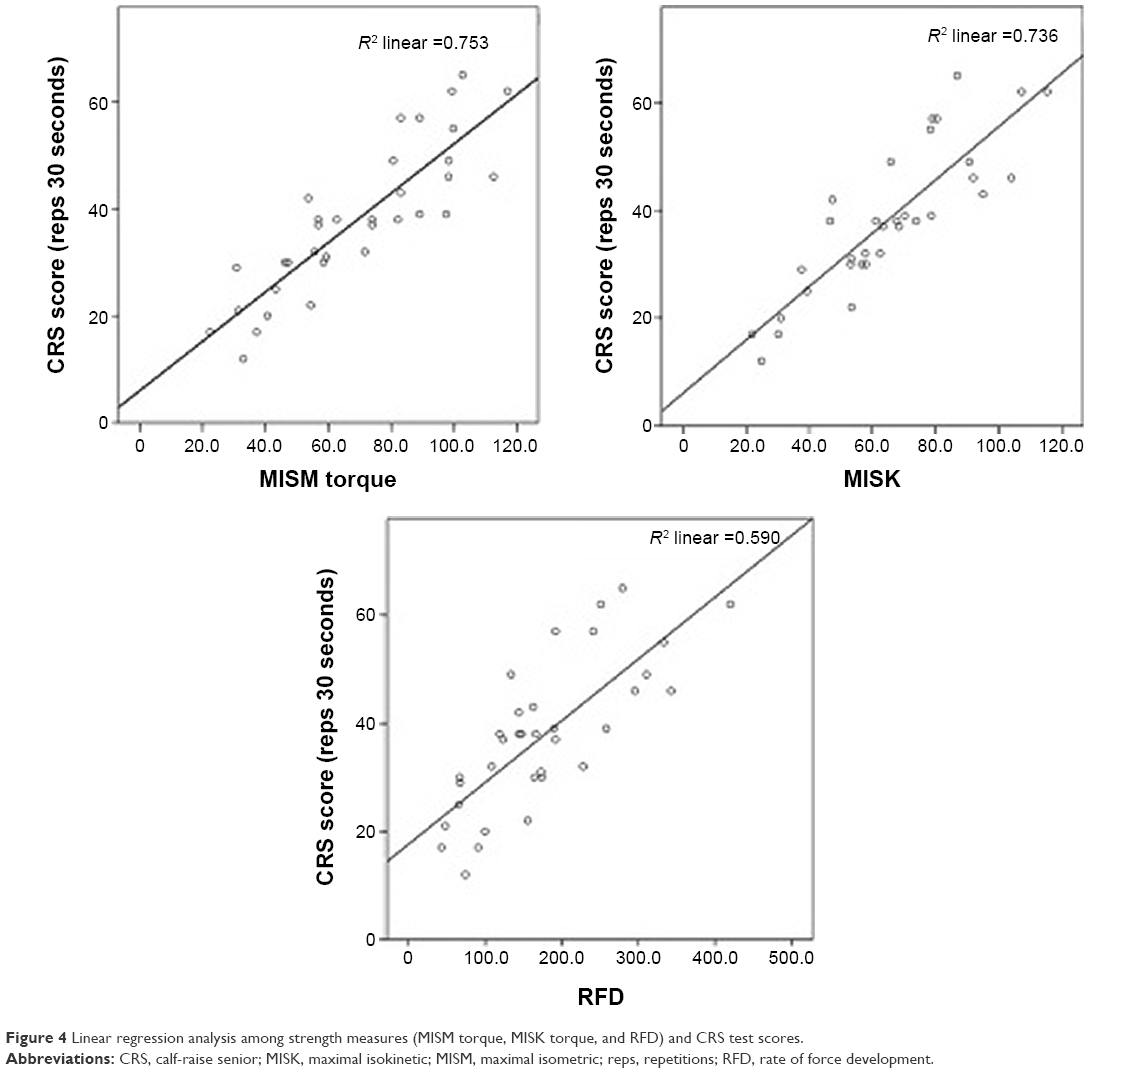 | Figure 4 Linear regression analysis among strength measures (MISM torque, MISK torque, and RFD) and CRS test scores. |
ROC curves were inspected in order to determine cutoff points for the CRS test that better discriminated among the participants who presented best results in isometric tests and those who scored less (Figure 5). The area under the ROC curve was 0.95 (P<0.05), showing that the CRS test would be considered to be “excellent” at separating the strongest from the weakest older participants. For the prediction of strength, the highest combination of sensitivity and specificity was 88% and 18% respectively, with a performance cutoff point of 38 repetitions, indicating that poor performance in the CRS test (<38 repetitions) was associated with a significant reduction in plantar flexor strength.
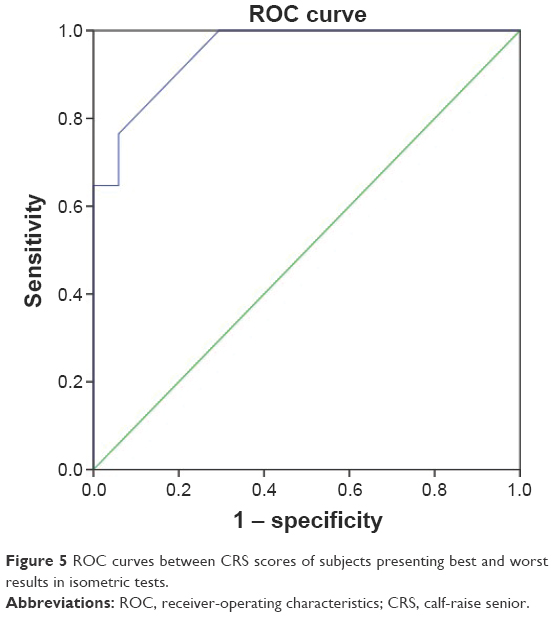 | Figure 5 ROC curves between CRS scores of subjects presenting best and worst results in isometric tests. |
Test–retest reliability
ICC values, with 95% CIs showed excellent reliability for the CRS test (0.903, 95% CI: 0.824–0.947, P<0.001), indicating a very good agreement between the initial test and retest scores. The mean score presented in trial 1 was 33.0±13.5 points and in trial 2 was 36.6±14.5 points, demonstrating that all participants were able to score in the test, showing the lack of floor effects. The mean difference between trials was 3.6 repetitions (±6.3 repetitions), revealing a significant increase (F(1,39)=12.60, P=0.001) between trials and a learning effect, which leads us to use the second attempt as input data for comparisons. The standard error of measurement of CRS test was found to be 1.8 repetitions, indicating that the true score of subjects performing CRS test can be expected to lie within an interval of CRS score ± two repetitions.
Discussion
This study aimed to develop and validate a new field test for assessment of strength and power in the plantar flexors, specifically designed for older adults. Considering that the most relevant batteries for functional assessment in older adults do not include a specific evaluation of this item, which has been referred to as an important predictor of functional decline in older population,16,49 led us to create the CRS test. This test supplements the information provided by the existing tests in order to increase their ability to discriminate the older adults who are at risk of mobility decline and potential risk of falls.
Based on a widely used test in physiotherapy and rehabilitation studies to assess the strength and power in the plantar flexors – the CRT or heel-rise test – a pilot study was conducted in order to establish an assessment protocol that would meet the various requirements indicated in the literature20 for the feasibility of an FF protocol for the older population.
The pilot study showed that most of the participants had problems in comfortably performing the most reported CRT protocol in the literature, indicating that some of the parameters were too demanding for them. Thus, the new assessment protocol, the CRS test, included some modifications to the original protocol in order to allow elderly adults with low levels of strength, balance, coordination and other disabilities associated with aging to perform it comfortably and safely, thereby increasing the feasibility of this test.
One of these changes involved performing the movements in bilateral support to diminish the external resistance and mechanical demands of the movement, which could facilitate balance during the movement, standardize the motion pattern among older subjects with different levels of FF, and decrease the number of performance errors during the test. The change was well accepted both by participants and by raters in this study, the former reporting that the movements were easier and more comfortable and the latter reporting improved ease of scoring due to fewer execution errors by participants.
To allow a comprehensive assessment, eliminating possible biases derived from hearing difficulties, or a reduced reaction speed or low coordinative abilities, which are typical of aging, the predetermined pace (tempo/cadence) of 60 calf raises·min−1 commonly reported in the literature was also changed in this study to the maximum possible velocity in the 30-seconds period. The pattern adopted was inspired by other FF tests for seniors, such as the 30 seconds chair-stand test and the arm-curl test,20 which are widely reported in the literature. Furthermore, it enables a greater emphasis on strength and power capabilities, rather than muscle endurance, which is usually focused on other protocols in which the CR are performed and repeated until fatigue.25,50
In order to facilitate scoring, another change in the original protocol involved the choice of raising the heel as “high as possible” in a fixed amplitude using the head as a reference to height, rather than the heel, as usually shown in other studies.15,25–28 In this test, the head must touch the device whenever the participant performs the upward movement, excluding executions in which this pattern is not observed. This implies that movements have to be performed with the highest possible amplitude throughout the test duration, reducing the variability between each movement cycle and allowing the rater to focus attention on other execution criteria.
All these modifications increased the feasibility of the CRS test for use in community settings, as the protocol has become easier to perform, evaluate, and score in a short time and reduced space, using inexpensive and easily built instruments (stopwatch and square). It is also important to note that the CRS showed good acceptance among the seniors, who did not report pain, discomfort, or excessive fatigue during the tests.
Recently, another study also presented a new protocol designed to overcome the limitations of CRTs usually found in the literature, by developing a simpler and standardized protocol.28 Although this alternative protocol provides numerous advantages over other previously developed CRTs, some factors seem to limit its effects in older populations or other subjects with low levels of physical abilities and/or disabilities. First, this study had a protocol whose execution of movements was performed in unilateral support and pace set by the rhythm of a metronome. As verified during the course of pilot study, both characteristics were rejected by the participants, who have chosen to perform the test in bilateral support and to use a self-selected speed in a predefined period of time (maximum repetitions in 30 seconds) as best suited to their profile. In addition, the protocol presented by Sman et al28 was administered to a younger population (mean age: 24±6.2 years), making it difficult to extrapolate their results to the target population. To the authors’ knowledge, a few studies had investigated the use of CRT as a functional assessment protocol in the older population.15–18 One of those studies15 aimed at verifying whether the number of repetitions in the CRT varied among different age and sex groups and to compare the results with normative values previously defined in other studies. Their results also demonstrated the low feasibility of this protocol with older subjects, since most of the participants from the age of 60 years could perform only two or fewer repetitions (male: range =0–7 repetitions, mean =4.1±1.9; female: range =0–5 repetitions, mean =2.7±1.5). These findings confirm the assumption that the execution of movements in unipedal support and/or that the predefined pace from the rhythm of a metronome are too difficult for most seniors, who usually have balance problems, hearing difficulties, low levels of strength, and many of them are quite sedentary and present substantial declines in their physical capacity. Fujisawa et al32 evaluated the difference in muscle activity between the double-leg heel raise and treadmill walking in a sample of 30 young healthy males (21.5±1.6 years), and their results also supported the decision to use bilateral support during the CRS protocol. This study revealed that the muscle activity in the soleus and gastrocnemius during the CR test was similar to that in walking, demonstrating its usefulness for evaluating the ankle plantar flexor functionality.
It is known that the reliability of a test is essential to ensure the reproducibility of the data and comparison between results from different scientific studies. The reproducibility results are consistent with previous studies (ICCs range =0.94–0.96),27,51 indicating that this instrument has an excellent absolute and relative reliability between two sessions with an interval of 1 week and can be recommended as a reliable assessment protocol of functional strength in older subjects. Although other studies do not have the same protocol parameters of CRS test, this test could be considered to have presented a very high reproducibility. Despite high values of ICCs (0.90) and low standard error of measurement values (2.0), a significant variation between test sessions was observed, which indicates a learning effect and the need to conduct at least one familiarization session before the final evaluation using the CRS test. Thus, use of the second attempt has been suggested as input data for statistical tests, in accordance with the recommendations by Rikli and Jones.20 Regarding interrater reproducibility, the resulting ICC was in an excellent range suggesting that the CRS test was rated similarly across examiners. The high ICC values found in this study indicate that measurement errors provided by independent observers were minimal, and thus, statistical power would not be substantially reduced in subsequent assessments. Similarly, the intrarater reliability was very good (0.79–0.84) showing a small variability in successive assessments by the same examiner. These findings are lower than the previous findings of Dennis et al,52 who found ICCs of 0.99 for both inter- and intrarater agreement analysis. However, results of this previous study are limited, since the observations of the participants’ performance were conducted by video recording, which reduces the likelihood of assessment errors in subsequent evaluations since the performance of the participants does not change between assessments. Altogether, the results presented in this study evidenced a very good reproducibility of the variables analyzed, confirming the reliability of the assessment procedures used in the CRS test.
According to the criteria established by Rikli and Jones,20 a functional test for older adults must be able to assess participants with a wide range of functional capacities in order to be appropriate and safe for the majority of them. Thus, a discriminatory (construct) validity study was developed, aimed at analyzing the degree to which the CRS could discriminate older persons with presumed differences in the construct of interest. In this study, older adults of both sexes who had various functional capacity levels (TFFS range =11.26–12.74 points), ages (66.2–81.6 years), strength levels (MISM range =43.00–94.72 N·m), and PA levels (3.51–60.15 min·day−1) were compared. The results showed that the CRS test was able to discriminate participants with different profiles. It means that the scores in this test tended to decrease with increasing age and to increase as participants presented higher patterns of PA and FF (strength in the lower limbs, balance, agility and mobility). It was also shown that males had higher results than females, which is consistent with that expected for this population, since men tend to have higher strength levels than females of the same age.15,53,54
With regard to the criterion validation, the results of this study support the hypothesis that the CRS test is able to measure the capacities that are intended to measure, that is, strength and power in the plantar flexors. As mentioned by several authors,55,56 when there is a correlation high enough (>0.70) between the results of the field test as intended to validate, and the criterion measure, the substitute test is a valid estimate of this measure. In this case, criterion measures were considered the maximum strength and power in the plantar flexors, evaluated in a laboratory isokinetic dynamometer, which involved the assessment of the maximum isometric and isokinetic torque and RFD. It was demonstrated that the CRS test was significantly correlated with all measures evaluated, with the highest correlations with the maximum isometric torque, followed by the maximum isokinetic torque and RFD. This pattern was also observed by linear regression analysis, which showed that there was a significant positive association with all strength parameters. The stronger association between CRS test scores with isometric strength leads us to assume that, despite continuous movement of PF with the greatest possible speed is mandatory; this movement pattern is more dependent of the maximum strength than the power to achieve a better performance. Indeed, other studies have also found higher associations between explosive dynamic strength movements with isometric strength than the RFD. McGuigan et al57 indicated that in recreationally trained men, the results of a 1RM correlated better with the isometric testing than with RFD, suggesting that the isometric testing could provide a better indication of the dynamic performance of those subjects than RFD. Another study by the same author58 corroborates these findings, showing that RFD was not as critical as the isometric strength to a wrestling athlete’s dynamic strength. Although there are divergences between studies regarding the use of isometric assessments for the prediction of dynamic strength, a systematic review59 revealed that most studies showed moderate-to-strong correlations between isometric strength and dynamic movements, especially in those involving large amounts of explosive strength and power. To the authors’ knowledge, no investigation was conducted in order to assess the criterion validity of the CRT, comparing it with a gold standard measure of strength in the plantar flexors. Only the study carried out by Yocum et al30 provided evidence of the convergent validity of the test, showing low correlation values (r=0.56–0.66) between the scores obtained by children between 5 years and 12 years performing a vertical jump and force measurement using handheld dynamometry. Thus, a potential practical application of these findings is that the CRS test has been proved to be a good indicator of ankle strength in older adults, and consequently, a complementary instrument to the prediction of mobility decline and potential risk of falls in this population.
According to the results of ROC analysis, the cutoff value for discriminating among older adults with higher and lower levels of PF strength was 38 repetitions in 30 seconds. These values are inconsistent with those verified in previous studies, which indicated 25 repetitions,29,60 32–33 repetitions for the general population,51 and 17–22 for females and males,28 respectively, as cutoff values to distinguish between subjects within acceptable standards for normal strength level of PF. Few studies had identified reference values for older adults, and the results varied widely (2.7–21.3).15,17 However, it is not possible to compare these results with that of this study accordingly, since the protocols featured the previously mentioned differences regarding the type of support (bilateral in CRS × unilateral in other studies) and movement speed (maximum possible in 30 seconds in CRS × fixed pace till exhaustion). To the authors’ knowledge, only the studies of Fujisawa et al32 and Flanagan et al16 were conducted in bilateral support, but the procedures and populations were considerably different. The cutoff values in this study (38 repetitions) should be used with caution, since this study has, as a limitation, a relatively small number of participants. Therefore, future studies are recommended with larger sample sizes and more participants in each group of age and sex, examining normative values that could allow comparison between performances of subjects within their respective group. In addition, to reinforce the construct validity of the CRS test, a study involving a biomechanical analysis is suggested to determine whether the movement pattern would be different from older adults with higher or lower levels of FF.
Conclusion
This study aimed to develop a new field test protocol with a standardized measurement of strength and power in plantar flexor muscles, focused on functionally independent older adults. This study was successful in demonstrating that the CRS test can meet the scientific criteria of validity and reliability required by prominent authors in the area.20
Evidence was presented in this study supporting excellent test–retest reliability and interrater reliability, as well as a good intrarater agreement of the CRS test. Indicating its construct validity, this test was able to discriminate effectively between individuals with improved functionality and levels of PA and also to reflect the expected decline in performance with increasing age. This study also supports the hypothesis that CRS test can be an excellent indicator of ankle strength in older adults, as demonstrated by the results of criterion validity analysis performed.
This test is recommended as a complementary assessment tool that can help monitor performance changes in ankle strength and power over time, in order to evaluate the effectiveness of exercise interventions for preventing mobility decline in older adults.
Acknowledgments
The authors are grateful to all the older adults who volunteered to participate in this study. This work was supported by the Portuguese Foundation for Science and Technology (project reference PTDC/DES/72946/2006 and PhD Grant reference SFRH/BD/62429/2009). The funding source of the study had no role in the design, implementation, recruitment, data collection and analysis, or the preparation of this manuscript.
Disclosure
The authors report no conflicts of interest in this work.
References
Reeves ND, Narici MV, Maganaris CN. Musculoskeletal adaptations to resistance training in old age. Man Ther. 2006;11(3):192–196. | ||
Skelton D, Beyer N. Exercise and injury prevention in older people. Scand J Med Sci Sports. 2003;13(1):77–85. | ||
Narici MV, Maganaris CN, Reeves ND, Capodaglio P. Effect of aging on human muscle architecture. J Appl Physiol. 2003;95(6):2229–2234. | ||
Narici MV, Maffulli N. Sarcopenia: characteristics, mechanisms and functional significance. Br Med Bull. 2010;95(1):139–159. | ||
Macaluso A, De Vito G. Muscle strength, power and adaptations to resistance training in older people. Eur J Appl Physiol. 2004;91(4):450–472. | ||
Puthoff ML, Nielsen DH. Relationships among impairments in lower-extremity strength and power, functional limitations, and disability in older adults. Phys Ther. 2007;87(10):1334–1347. | ||
Skelton DA. Effects of physical activity on postural stability. Age Ageing. 2001;30(suppl 4):33–40. | ||
Guideline for the prevention of falls in older persons. American Geriatrics Society, British Geriatrics Society, and American Academy of Orthopaedic Surgeons Panel on Falls Prevention. J Am Geriatr Soc. 2001;49:664–672. | ||
World Health Organization. WHO Global Report on Falls Prevention in Older Age. Geneva: World Health Organization; 2008. | ||
Carter N, Kannus P. Exercise in the prevention of falls in older people. Sports Med. 2001;31(6):427–438. | ||
Kirkwood RN, Trede RG, de Souza Moreira B, Kirkwood SA, Pereira LSM. Decreased gastrocnemius temporal muscle activation during gait in elderly women with history of recurrent falls. Gait Posture. 2011;34(1):60–64. | ||
Judge J, Lindsey C, Underwood M, Winsemius D. Balance improvements in older women: effects of exercise training. Phys Ther. 1993;73(4):254–262. | ||
Judge J, Roy B, Õunpuu S. Step length reductions in advanced age: the role of ankle and hip kinetics. J Gerontol A Biol Sci Med Sci. 1996;51(6):M303–M312. | ||
Suzuki T, Bean JF, Fielding RA. Muscle power of the ankle flexors predicts functional performance in community dwelling older women. J Am Geriatr Soc. 2001;49(9):1161–1167. | ||
Jan M-H, Chai H-M, Lin Y-F, et al. Effects of age and sex on the results of an ankle plantar-flexor manual muscle test. Phys Ther. 2005;85(10):1078–1084. | ||
Flanagan S, Song J-E, Wang M-Y, Greendale G, Azen S, Salem G. Biomechanics of the heel-raise exercise. J Aging Phys Act. 2005;13(2):160. | ||
Hashish R, Samarawickrame SD, Wang M-Y, Yu SS-Y, Salem GJ. The association between unilateral heel-rise performance with static and dynamic balance in community dwelling older adults. Geriatr Nurs. 2015;36(1):30–34. | ||
van Uden CJ, van der Vleuten CJ, Kooloos JG, Haenen J, Wollersheim H. Gait and calf muscle endurance in patients with chronic venous insufficiency. Clin Rehabil. 2005;19(3):339–344. | ||
Mathias S, Nayak U, Isaacs B. Balance in elderly patients: the “Get-Up and Go” test. Arch Phys Med Rehabil. 1986;67(6):387–389. | ||
Rikli R, Jones C. Development and validation of a functional fitness test for community-residing older adults. J Aging Phys Act. 1999;7(2):129–161. | ||
Thrane G, Joakimsen RM, Thornquist E. The association between timed up and go test and history of falls: the tromsø study. BMC Geriatr. 2007;7(1):1. | ||
Moyer VA; U.S. Preventive Services Task Force. Prevention of falls in community-dwelling older adults: US preventive services task force recommendation statement. Ann Intern Med. 2012;157(3):197–204. | ||
Kenny R, Rubenstein LZ, Tinetti ME, et al. Summary of the updated American Geriatrics Society/British Geriatrics Society clinical practice guideline for prevention of falls in older persons. J Am Geriatr Soc. 2011;59(1):148–157. | ||
Rose D, Jones C, Lucchese N. Predicting the probability of falls in community-residing older adults using the 8-foot up-and-go: a new measure of functional mobility. J Aging Phys Act. 2002;10(4):466–475. | ||
Hebert-Losier K, Newsham-West R, Schneiders A, Sullivan S. Raising the standards of the calf-raise test: a systematic review. Med Sci Sports Sci. 2009;12(6):594–602. | ||
Hébert-Losier K, Schneiders AG, Sullivan SJ, Newsham-West RJ, García JA, Simoneau GG. Analysis of knee flexion angles during 2 clinical versions of the heel raise test to assess soleus and gastrocnemius function. J Orthop Sports Phys Ther. 2011;41(7):505–513. | ||
Segura-Ortí E, Martínez-Olmos FJ. Test-retest reliability and minimal detectable change scores for sit-to-stand-to-sit tests, the six-minute walk test, the one-leg heel-rise test, and handgrip strength in people undergoing hemodialysis. Phys Ther. 2011;91(8):1244–1252. | ||
Sman AD, Hiller CE, Imer A, Ocsing A, Burns J, Refshauge KM. Design and reliability of a novel heel rise test measuring device for plantarflexion endurance. Biomed Res Int. 2014;2014:391646. | ||
Lunsford BR, Perry J. The standing heel-rise test for ankle plantar flexion: criterion for normal. Phys Ther. 1995;75(8):694–698. | ||
Yocum A, McCoy SW, Bjornson KF, Mullens P, Burton GN. Reliability and validity of the standing heel-rise test. Phys Occup Ther Pediatr. 2010;30(3):190–204. | ||
Caudill A, Flanagan A, Hassani S, et al. Ankle strength and functional limitations in children and adolescents with type i osteogenesis imperfecta. Pediatr Phys Ther. 2010;22(3):288–295. | ||
Fujisawa H, Suzuki H, Nishiyama T, Suzuki M. Comparison of ankle plantar flexor activity between double-leg heel raise and walking. J Phys Ther Sci. 2015;27(5):1523–1526. | ||
Hébert-Losier K, Schneiders AG, Newsham-West RJ, Sullivan SJ. Scientific bases and clinical utilisation of the calf-raise test. Phys Ther Sport. 2009;10(4):142–149. | ||
Nelson ME, Rejeski WJ, Blair SN, et al. Physical activity and public health in older adults: recommendation from the American College of Sports Medicine and the American Heart Association. Circulation. 2007;116(9):1094. | ||
Hébert-Losier K, Schneiders AG, García JA, Sullivan SJ, Simoneau GG. Influence of knee flexion angle and age on triceps surae muscle fatigue during heel raises. J Strength Cond Res. 2012;26(11):3134–3147. | ||
Valente S. Validação de um Questionário de Saúde e Identificação de Factoresde Risco de Quedas para a População Idosa Portuguesa [Validation of a health Questionnaire and Identification of Fall Risk Factors for the Portuguese Older Population]. [master’s thesis]. Lisbon: Faculty of Human Kinetics – University of Lisbon; 2013. | ||
Freedson PS, Melanson E, Sirard J. Calibration of the computer science and applications, Inc. accelerometer. Med Sci Sports Exerc. 1998;30(5):777–781. | ||
Copeland JL, Esliger DW. Accelerometer assessment of physical activity in active, healthy older adults. J Aging Phys Act. 2009;17(1):17–30. | ||
Pruitt LA, Glynn NW, King AC, et al. Use of accelerometry to measure physical activity in older adults at risk for mobility disability. J Aging Phys Act. 2008;16(4):416. | ||
Hernandez D, Rose D. Predicting which older adults will or will not fall using the fullerton advanced balance scale. Arch Phys Med Rehabil. 2008;89(12):2309–2315. | ||
Rose D, Lucchese N, Wiersma L. Development of a multidimensional balance scale for use with functionally independent older adults. Arch Phys Med Rehabil. 2006;87(11):1478–1485. | ||
Webber SC, Porter MM. Reliability of ankle isometric, isotonic, and isokinetic strength and power testing in older women. Phys Ther. 2010;90(8):1165–1175. | ||
Ordway NR, Hand N, Briggs G, Ploutz-Snyder LL. Reliability of knee and ankle strength measures in an older adult population. J Strength Cond Res. 2006;20(1):82–87. | ||
Rikli R, Jones C. Senior Fitness Test Manual. Champaign, IL: Human Kinetics; 2012. | ||
Weir JP. Quantifying test–retest reliability using the intraclass correlation coefficient and the SEM. J Strength Cond Res. 2005;19(1):231–240. | ||
Fleiss JL. Design and Analysis of Clinical Experiments. Vol. 73. Hoboken, NJ: John Wiley & Sons; 2011. | ||
Hopkins WG. Measures of reliability in sports medicine and science. Sports Med. 2000;30(1):1–15. | ||
Cohen J. Statistical Power Analysis for the Behavioral Sciences. Cambridge: Academic Press; 2013. | ||
Trudelle-Jackson EJ, Jackson AW, Morrow J. Muscle strength and postural stability in healthy, older women: implications for fall prevention. J Phys Act Health. 2006;3(3):292. | ||
Kasahara S, Ebata J, Takahashi M. Analysis of the repeated one-leg heel-rise test of ankle plantar flexors in manual muscle testing. J Phys Ther Sci. 2007;19(4):251–256. | ||
Ross MD, Fontenot EG. Test–retest reliability of the standing heel-rise test. J Sport Rehabil. 2010;9(2):117–123. | ||
Dennis RJ, Finch CF, Elliott BC, Farhart PJ. The reliability of musculoskeletal screening tests used in cricket. Phys Ther Sport. 2008;9(1):25–33. | ||
Doherty TJ. Invited review: aging and sarcopenia. J Appl Physiol. 2003;95(4):1717–1727. | ||
Vandervoort AA, McCOMAS AJ. Contractile changes in opposing muscles of the human ankle joint with aging. J Appl Physiol. 1986;61(1):361–367. | ||
Rikli RE, Jones CJ. Development and validation of a functional fitness test for community-residing older adults. J Aging Phys Act. 1999;7(2):129–161. | ||
Safrit MJ, Wood TM. Introduction to Measurement in Physical Education and Exercise Science. Bel Air, CA: William C. Brown; 1995. | ||
McGuigan MR, Newton MJ, Winchester JB, Nelson AG. Relationship between isometric and dynamic strength in recreationally trained men. J Strength Cond Res. 2010;24(9):2570–2573. | ||
McGuigan MR, Winchester JB, Erickson T. The importance of isometric maximum strength in college wrestlers. J Sports Sci Med. 2006;5(CSSI):108–113. | ||
Juneja H, Verma S, Khanna G. Isometric strength and its relationship to dynamic performance: a systematic review. JESP. 2010;6(2):60–69. | ||
Svantesson U, Osterberg U, Thomee R, Grimby G. Muscle fatigue in a standing heel-rise test. Scand J Rehabil Med. 1998;30(2):67–72. |
 © 2016 The Author(s). This work is published and licensed by Dove Medical Press Limited. The full terms of this license are available at https://www.dovepress.com/terms.php and incorporate the Creative Commons Attribution - Non Commercial (unported, v3.0) License.
By accessing the work you hereby accept the Terms. Non-commercial uses of the work are permitted without any further permission from Dove Medical Press Limited, provided the work is properly attributed. For permission for commercial use of this work, please see paragraphs 4.2 and 5 of our Terms.
© 2016 The Author(s). This work is published and licensed by Dove Medical Press Limited. The full terms of this license are available at https://www.dovepress.com/terms.php and incorporate the Creative Commons Attribution - Non Commercial (unported, v3.0) License.
By accessing the work you hereby accept the Terms. Non-commercial uses of the work are permitted without any further permission from Dove Medical Press Limited, provided the work is properly attributed. For permission for commercial use of this work, please see paragraphs 4.2 and 5 of our Terms.