")
Back to Journals » Neuropsychiatric Disease and Treatment » Volume 16
CACNA1C Risk Variant and Mood Stabilizers Effects in the Prefrontal Cortical Thickness of Mexican Patients with Bipolar Disorder
Authors Rodríguez-Ramírez AM , Meza-Urzúa F, Cedillo-Ríos V, Becerra-Palars C, Jiménez-Pavón J , Morales-Cedillo IP , Sanabrais-Jiménez MA , Hernández-Muñoz S, Camarena-Medellín B
Received 14 January 2020
Accepted for publication 1 April 2020
Published 12 May 2020 Volume 2020:16 Pages 1199—1206
DOI https://doi.org/10.2147/NDT.S245911
Checked for plagiarism Yes
Review by Single anonymous peer review
Peer reviewer comments 2
Editor who approved publication: Dr Roger Pinder
Alejandra Monserrat Rodríguez-Ramírez,1 Fátima Meza-Urzúa,2 Valente Cedillo-Ríos,3 Claudia Becerra-Palars,4 Joanna Jiménez-Pavón,4 Ingrid Pamela Morales-Cedillo,1 Marco Antonio Sanabrais-Jiménez,1 Sandra Hernández-Muñoz,1 Beatriz Camarena-Medellín1
1Departamento de Farmacogenética, Instituto Nacional de Psiquiatría Ramón de la Fuente Muñiz, Mexico City, Mexico; 2Kinder und Jugend Psychiatrie, Klinikum Idar-Oberstein, Idar-Oberstein, Germany; 3Departamento de Imágenes Cerebrales, Instituto Nacional de Psiquiatría Ramón de la Fuente Muñiz, Mexico City, Mexico; 4Dirección de Servicios Clínicos, Instituto Nacional de Psiquiatría Ramón de la Fuente Muñiz, Mexico City, Mexico
Correspondence: Beatriz Camarena-Medellín
Departamento de Farmacogenética, Instituto Nacional de Psiquiatria Ramón de la Fuente Muñiz, Calz. México-Xochimilco 101, Col. San Lorenzo, Huipulco, Mexico City CP 14370, Mexico
Tel +52 55 4160 5075
Fax +52 55 5513 3722
Email [email protected]
Purpose: Bipolar disorder (BD) is a condition associated with structural alterations in the prefrontal cortex (PFC); some genetic variants and mood stabilizer medications like lithium or valproate are associated with these changes. CACNA1C is a gene involved in BD pathology and brain function; carriers of the A allele of rs1006737 are reported to have increased risk for BD and increased cortical thickness (CT) in the PFC compared to non-carriers. Lithium is also associated with increased CT in the PFC of BD subjects compared to the ones on valproate. The influence of these treatments and gene variants over the PFC structure of Mexican subjects has not been explored. Therefore, we evaluate the effects of mood stabilizers and risk A allele of CACNA1C rs1006737 on the prefrontal cortical thickness of Mexican BD patients treated with lithium or valproate.
Patients and Methods: A cross-sectional study of 40 BD type I euthymic adult outpatients (20 treated with lithium and 20 with valproate) who underwent a 3T T1-weighted 3D brain scan and genotyping for CACNA1C risk allele rs1006737 was conducted. We performed a cortical thickness analysis of the dorsolateral and orbitofrontal regions of the prefrontal cortex with BrainVoyager 20.6. The effects of treatment and gene variants were analyzed with a two-way multivariate analysis of covariance.
Results: There was no association of CACNA1C risk allele rs1006737 with CT measures of both PFCs nor significant interaction between the genetic variant and treatment. Mood stabilizers reported the main effect on the CT measures of the right PFC of our sample. Patients on treatment with lithium showed higher mean CT on the right orbitofrontal cortex.
Conclusion: We did not find any association between the prefrontal CT and CACNA1C risk A allele rs1006737 in BD Mexican patients treated with lithium or valproate. Our results suggest that mood stabilizers had the main effect in the CT of the right PFC.
Keywords: genetics, mood disorders, neuroimaging
Introduction
Bipolar disorder (BD) is a chronic condition associated with structural alterations in the prefrontal cortex (PFC),1–3 which is a region implicated in the regulation of mood and participates in working memory, attention and many other executive functions.4,5 Alterations in PFC morphometry are related to clinical manifestations,3,6-8 treatment2,9 and genetic variants in BD patients.10,11 Among these characteristics, the risk allele of rs1006737 polymorphism in the CACNA1C gene is of particular interest because it is associated with a positive effect in grey matter (GM) density.10,12,13
CACNA1C is a gene that encodes for the transmembrane α1C subunit of the L-type voltage-gated calcium channel (LTCC) nominated CaV1.2, which facilitate transient activation of inward calcium that regulates the transcription of calcium-dependent genes with neurotropic functions such as brain-derived neurotrophic factor (BDNF).10,14 A single nucleotide polymorphism (SNP) of CACNA1C has been associated with BD with genome-wide significance, the risk variant consists in the presence of the A allele of rs1006737.14–16 This variant was also associated with increased GM density in the prefrontal, anterior cingulate, temporal, insular, parietal and occipital cortexes of healthy subjects.10 BD patients who carry the risk allele had been reported with increased GM density in the right amygdala, right hypothalamus, bilateral caudate nucleus, insula, globous pallidus, and frontal pole compared to those without it.12,17 A recent analysis of 117 BD Brazilian patients associated the risk A allele with greater cortical thickness measures in PFC.18 However, these studies used heterogenic samples that included patients treated with different medications which are a known cause of brain morphometric changes.9
Among the treatments for BD, mood stabilizers are medications with antimanic, antidepressant and prophylactic properties.19 Lithium carbonate and valproate salts are two of the most prescribed medications of the group,20,21 both treatments alter the structure of the brain in different ways.3,9,22 Lithium has been reported to have a positive effect on GM density in different studies.22–25 Abramovic et al found that BD type I lithium-free patients showed smaller total brain, thinner cortex in the left superior frontal and precuneus regions, right precentral, superior and inferior parietal areas, and supramarginal occipital regions compared to patients treated with lithium.22 A latter work by Li et al found increased cortical thickness in the left rostral middle prefrontal cortex and right superior frontal cortex of euthymic BD patients treated with lithium compared to those treated with valproate.2 Some other studies have also reported cortical thinning associated with valproate use in the temporal and occipital cortexes of BD patients.26–28
Although both treatments and CACNA1C risk allele rs1006737 had been described to alter GM in the PFC individually, the effect of each one is not clear because most studies analyzed the genetic variant in patients with different pharmacological treatments. Since brain structure results from the interaction of genetics and environmental factors;29,30 it is important to study this phenomenon considering both characteristics. None of the previous studies about CT and CACNA1C risk allele rs1006737 have analyzed a possible interaction with mood stabilizers, nor included Mexican subjects. Hence, we aimed to evaluate the effect and interaction of lithium and valproate treatment and risk A allele of rs1006737 in the cortical thickness measures of the prefrontal cortex of Mexican patients with type I bipolar disorder.
Patients and Methods
Participants
We conducted a cross-sectional comparative study of 40 bipolar disorder type I (BDI) outpatients from the Affective Disorders Clinic of the National Institute of Psychiatry in Mexico City. Our sample included 20 BDI euthymic subjects on treatment with lithium paired by sex and age with 20 BDI euthymic subjects treated with valproate.
Eligible subjects had to be Mexicans with Mexican parents and grandparents, aged 18 to 65 years, right-handed, without MRI contraindicative conditions and with the ability to provide voluntary informed consent. All participants had BDI diagnosis according to DSM5 criteria31 with a reported diagnostic stability for at least 2 years. We included only patients who had been euthymic at least for 2 months and without hospitalizations in the past 6 months. Suitable subjects had to be on treatment with lithium or valproate without changes for at least 6 months before the study and had no other mood stabilizer, antidepressant or typical antipsychotic. Combinations with atypical antipsychotics and/or benzodiazepines were permitted.
The study was approved by the Institutional Review Board (IRB) committee of the National Institute of Psychiatry “Ramón de la Fuente Muñiz”. Informed consent was obtained from subjects who participated in the study and the research was conducted according to the Declaration of Helsinki standards.
MRI Data Acquisition
Magnetic resonance images were acquired using a 3.0 Tesla Phillips Ingenia scanner (Koninklijke Philips, Amsterdam, The Netherlands) at the Brain Images Department of the National Institute of Psychiatry “Ramón de la Fuente Muñíz” in Mexico City. We used a three-dimensional T1-weighted sequence with acquisition parameters of TR/TE =3.5/7.0 ms, FOV= 240 × 240 mm2, matrix size = 240 × 240, flip angle = 8°, slice number = 180, voxel size = 1 × 1 × 1 mm3.
MRI Data Analysis
Brain scans were analyzed using BrainVoyager 20.6 (Brain Innovation, Maastricht, The Netherlands), each scan went through an individual analysis before group analysis of cortical thickness.32 In the preprocessing steps, the anatomical data in DICOM format were transformed to NifTi format using MRIConvert 2.0.7 (Lewis Center for Neuroimaging, University of Oregon, USA) and later was loaded and converted to the BrainVoyager’s internal data format. The data were transformed into ACPC and Talairach space, in the following steps we used data in Talairach space. The brain was extracted using the intensity in-homogeneity correction tool that includes background cleaning, brain extraction, white matter detection, and bias field estimation within white matter voxels. We used the automatic cortex segmentation pipeline to obtain the segmented cortical boundaries and surface reconstructions for later use in the cortex-based alignment.33 In preparation for the advanced segmentation we resampled the anatomical data to 0.5 mm iso-voxels using sync interpolation, subcortical structures and cerebellum were removed using a mask and tissue contrast was enhanced using a sigma filter. Next, we used the advanced segmentation tools for the automatic segmentation of the white matter-grey matter border, the grey matter–cerebrospinal fluid (CSF) border and to polish the calculated borders.34
Once we concluded the segmentation process a cortical thickness analysis of each subject was performed, BrainVoyager (BV) uses the Laplace method for these calculations.34 In preparation to measure the cortical thickness of our groups, we performed a cortex-based alignment. This procedure consists of morphing a spherical representation of each hemisphere and subject,35 using as an input the reconstructed folded cortical representations obtained in the segmentation process. The spherical representations were later aligned as a group. To accomplish the objective of our study we performed a region of interest (ROI) alignment using the Brodmann areas (BA) atlas of each hemisphere provided by BV,36 among these BAs we selected the brain regions that represent the dorsolateral and orbitofrontal portions of the PFC. The selected areas were the BA9 (dorsolateral prefrontal cortex), BA10 (anterior prefrontal cortex), BA11 (orbitofrontal cortex) and BA46 (dorsolateral prefrontal cortex), as Figure 1 shows. We obtained cortical thickness measures of each subject at each BA and exported the data for further analysis.
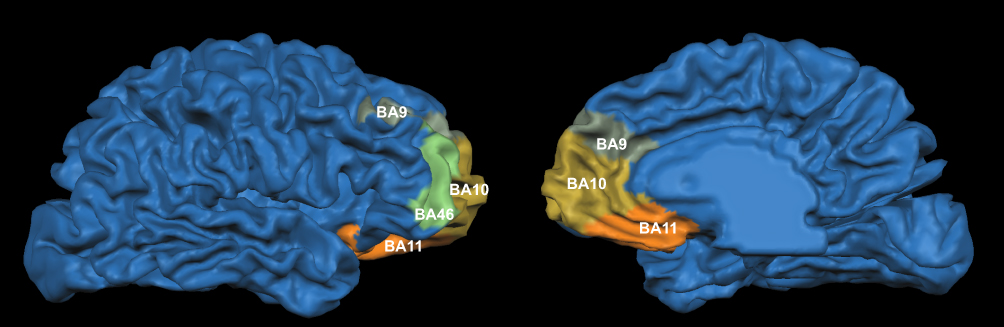 |
Figure 1 Regions of interest in the right prefrontal cortex. The colored zones show the anatomical localization of the selected Brodmann areas: dorsolateral prefrontal cortex (BA9), anterior prefrontal cortex (BA10), orbitofrontal cortex (BA11) and dorsolateral prefrontal cortex (BA46). Notes: Olive green: dorsolateral prefrontal cortex (BA9). Yellow: anterior prefrontal cortex (BA10). Orange: orbitofrontal cortex (BA11). Mint: dorsolateral prefrontal cortex (BA46).Abbreviations: BA, Brodmann area; BA9, Brodmann area number 9; BA10, Brodmann area number 10; BA11, Brodmann area number 11; BA46, Brodmann area number 46. |
Genotyping
DNA was extracted from whole blood using the Flexigene DNA kit (Qiagen, Minneapolis, MN, USA). Genotyping of polymorphism rs1006737 was performed with the fluorogenic 5 exonuclease method using the TaqMan C_2584015_10 assay (Applied Biosystems, Foster City, CA, USA). The final volume was 7 µL with the following reaction conditions: 100 ng DNA, 2.5 µL TaqMan Master Mix, 2.367 µL water for PCR, and 0.125 µL 20x probe. The amplification and allelic discrimination were performed on StepOne real-time PCR systems SDS v.2.1 software (Applied Biosystems, Foster City, CA, USA).
Statistical Analysis
Data were analyzed with the software STATA 13.0 (StataCorp. 2013. Stata Statistical Software: Release 13. College Station, TX: StataCorp LP) and GraphPad Prism version 8.0 for Mac OS (GraphPad Software, La Jolla California USA). The normal distribution of variables was assessed with the Skewness and Kurtosis test. Continuous variables with normal distribution were compared with Student’s t-test; in the case of non-normal distribution, the variables were compared with the Mann–Whitney U-test. The association between categorical variables was assessed using the χ2 test or the Fisher exact test as appropriate.
For the analysis of cortical thickness (CT) interaction with mood stabilizers and risk allele rs1006737 of the CACNA1C gene, we used a two-way multivariate analysis of covariance (MANCOVA) with age and sex as covariates. The dependent variables of the model were the CT measures of the selected ROIs (BA9, BA10, BA11, BA46) and the independent variables were the presence of risk A allele rs1006737 and lithium or valproate treatment. We evaluated each hemisphere separately since the analysis of BV is conducted likewise and used eta squared (η2) to report effect size for each factor and interaction. For the post hoc analysis, we used analysis of covariance (ANCOVA) adjusted by age and sex.
Results
Our sample consisted of 32 women and 8 men. Table 1 shows the characteristics of the sample. We identified 19 carriers of risk A allele (0.47). In the comparative analysis of the lithium vs valproate groups, we found no differences regarding the presence of risk allele, clinical and demographic features (Table 1).
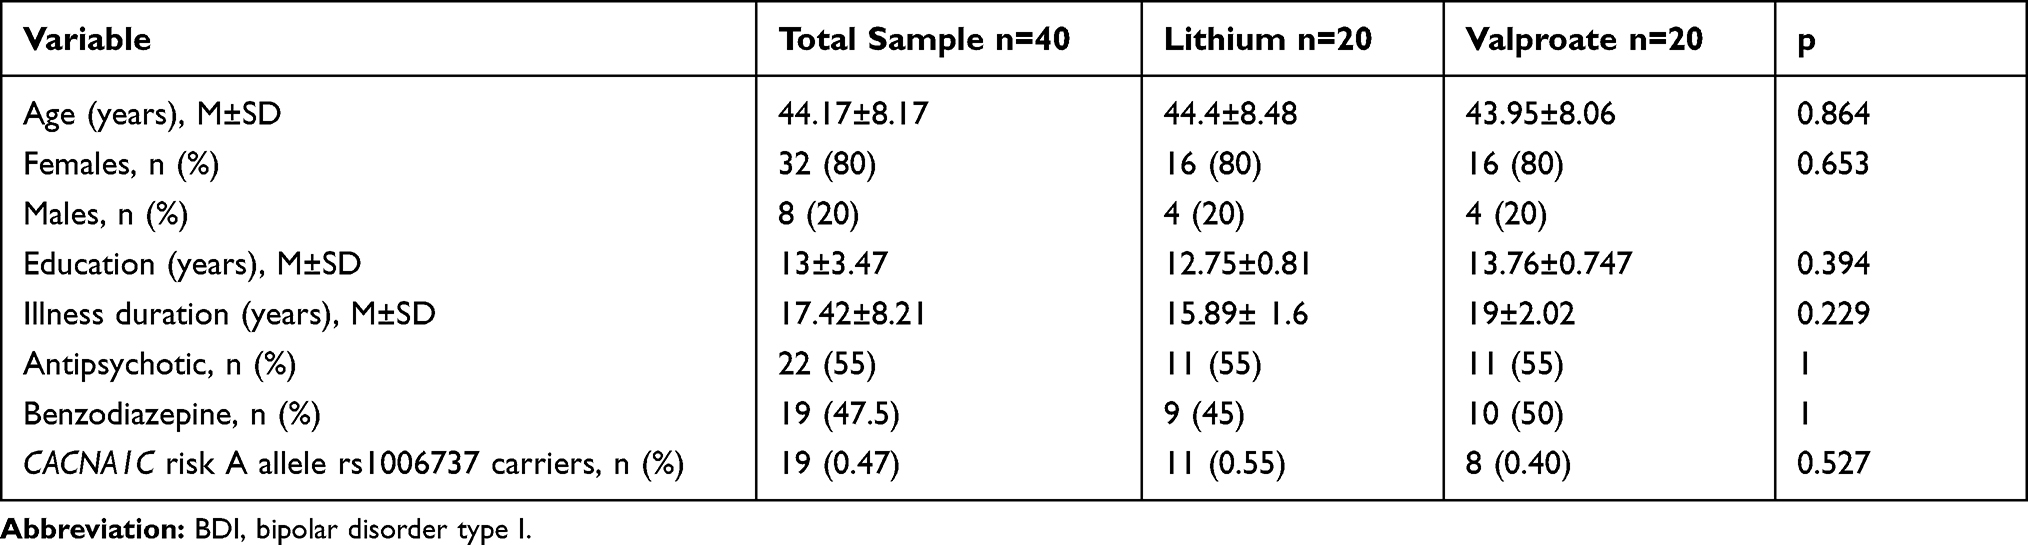 |
Table 1 Sociodemographic and Clinical Characteristics of BDI Patients Treated with Lithium or Valproate |
We analyzed the effect and interaction of CACNA1C risk allele rs1006737 and treatment in the CT measures of the selected ROIs, we performed a two-way MANCOVA of each hemisphere. We tested our variables for normality, linearity, and homogeneity of variance-covariance matrices and found no serious violations of the assumptions for the MANCOVA test with non-significant Box’s M test (p=0.09).
After adjusting for age and sex, right hemisphere model reported a main effect of mood stabilizers on CT measures (Table 2). There was no effect of risk allele rs1006737, age and sex; nor interaction between mood stabilizers and risk allele presence on CT measures (Table 2). Since the multivariate model showed no association of sex with CT measures and our subjects were paired by sex and age as part of the design of the study, we conducted no further analysis regarding sex influence on CT measures. The analysis of left hemisphere did not show differences between the independent variables or covariates and CT measures (Table 2).
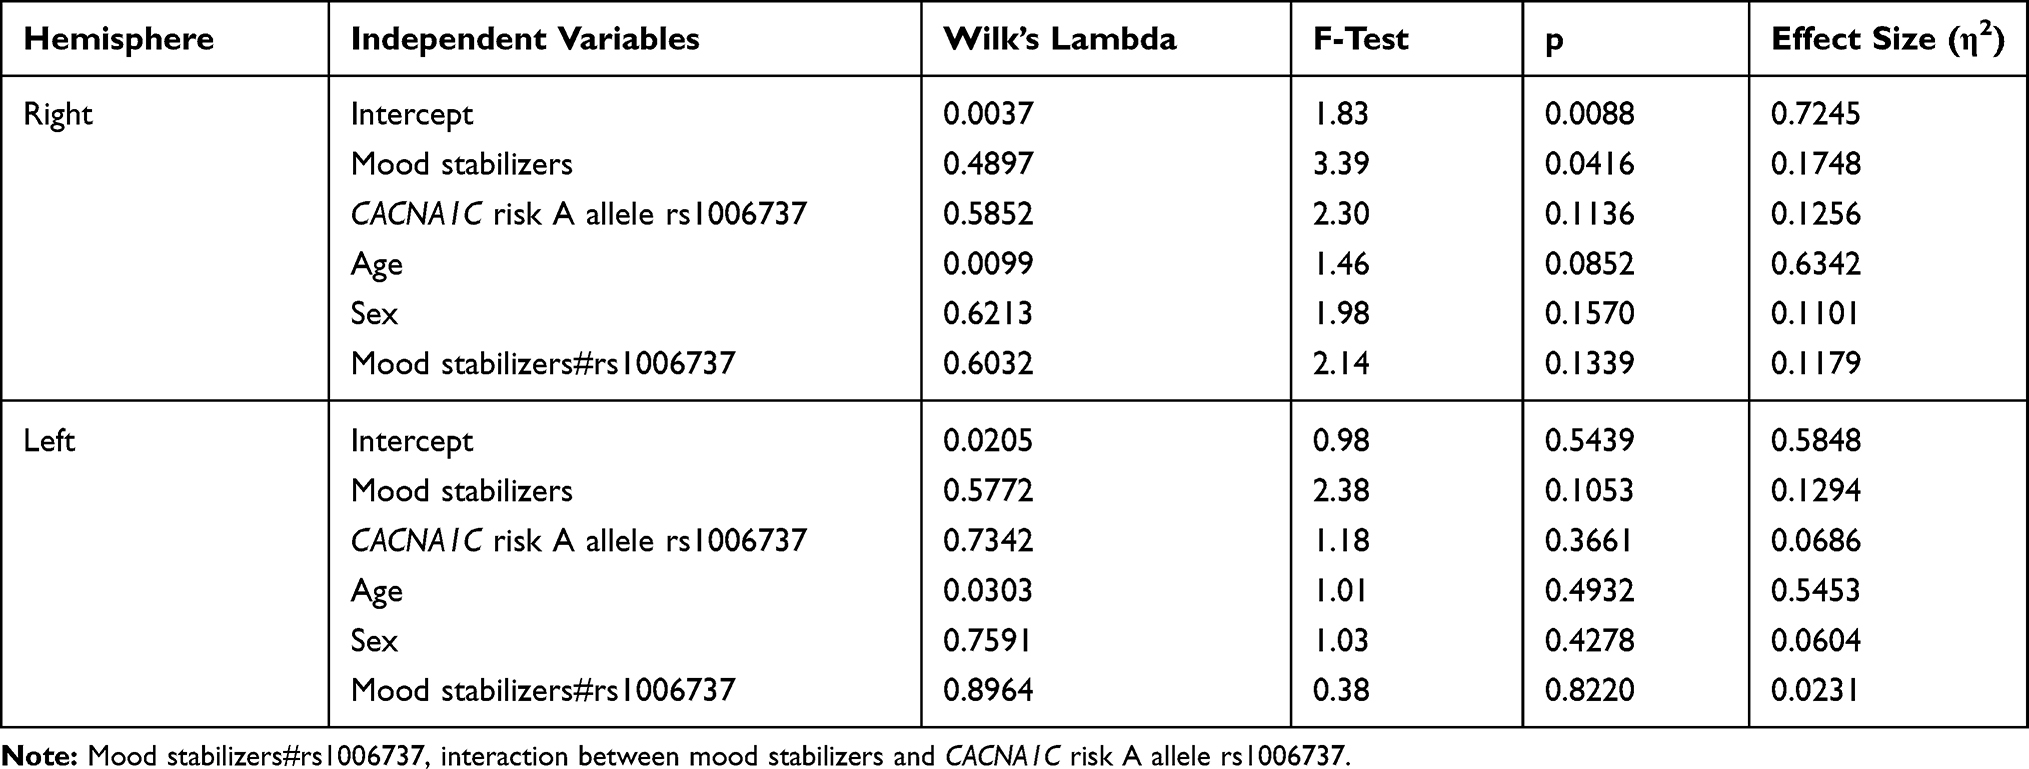 |
Table 2 Multivariate Analysis of the Effect of Mood Stabilizers, CACNA1C Risk A Allele rs1006737, Sex and Age on the Prefrontal Cortical Thickness |
Finally, we conducted an ANCOVA post hoc analysis of the right hemisphere CT measures using age and sex as covariates (Table 3). We identified significant differences in the CT of the orbitofrontal cortex showing a higher mean of CT in the group treated with lithium compared with valproate treated group (Figure 2). The dorsolateral prefrontal cortex (BA9 and BA46) and the anterior prefrontal cortex (BA10) reported no differences between the comparison groups (Table 3).
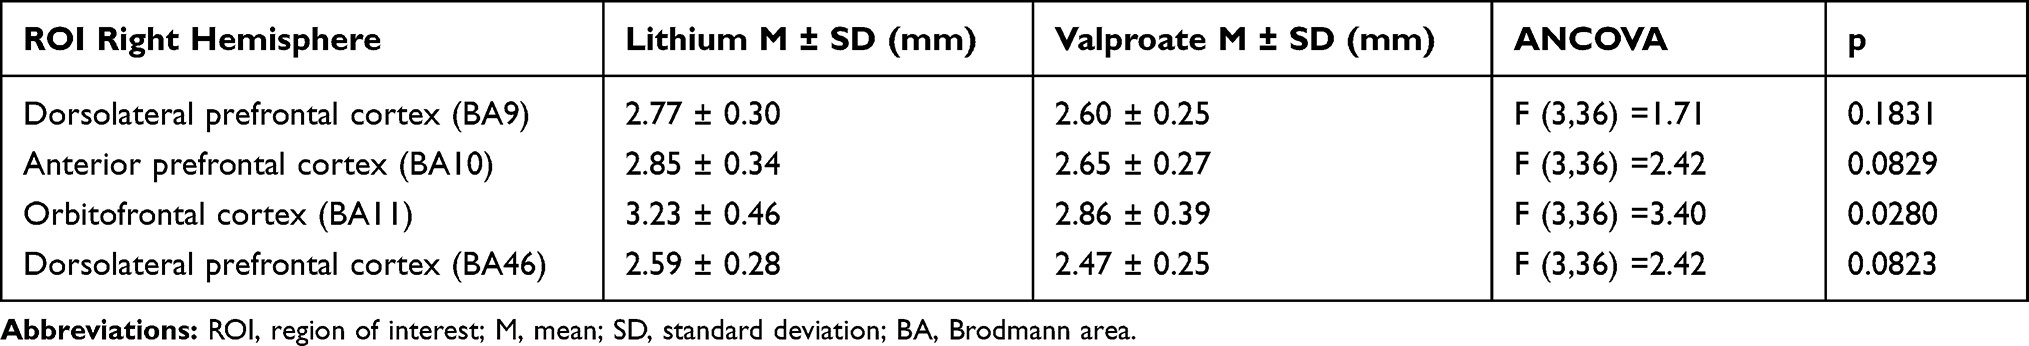 |
Table 3 Comparative Analysis of Cortical Thickness in BDI Subjects Treated with Lithium or Valproate |
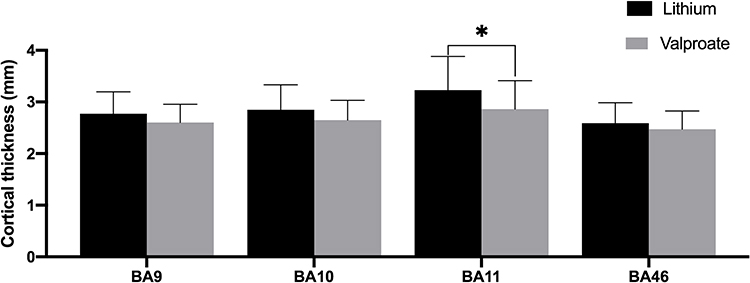 |
Figure 2 Cortical thickness of regions of interest. Comparative analysis of BDI patients treated with lithium or valproate. Abbreviations: BDI, bipolar disorder type I; BA9, Brodmann area number 9 (dorsolateral prefrontal cortex); BA10, Brodmann area number 10 (anterior prefrontal cortex); BA11, Brodmann area number 11 (orbitofrontal cortex); BA46, Brodmann area number 46 (dorsolateral prefrontal cortex); *p<0.05. |
Discussion
The present study used a multivariate analysis of covariance to determine the effect and interaction of lithium and valproate treatment with CACNA1C risk allele rs1006737 on cortical thickness measures from the prefrontal cortex of Mexican euthymic BDI patients. To the best of our knowledge, this is the first study to explore the gene variants and treatment interaction effects on this matter.
According to our analysis, the right prefrontal cortical thickness of our patients was related to mood stabilizers and was not significantly associated with the presence of the CACNA1C risk A allele rs1006737. These results are discordant to previous works, where the presence of this risk allele relates to increased GM density and cortical thickness12,18,37 even in healthy subjects.13 There are two characteristics of our study that might explain this discrepancy. First, most of the studies that previously associated risk allele rs1006737 with increased GM in the PFC measured whole-brain volumes or used voxel-based morphometry. We used a CT approach based on the Laplace method and employed specific ROIs of the prefrontal cortex that potentiated the precision of our measures.36 Second, this is the first study to report the effect of CACNA1C rs1006737 in the PFC structure of Mexican subjects. Since gene frequencies are different across populations, the effect of this SNP in our sample is different from the reported in other studies. More studies are needed to understand the effect of this genetic variant in bipolar disorder patients.
After the identification of the main effect of treatment in the multivariant analysis, the post hoc univariate analysis allowed us to identify cortical thickening on the right orbitofrontal cortex related to lithium. The orbitofrontal cortex is implicated in decision making and impulsivity,4 in BD patients orbitofrontal CT is related to executive functioning40 and cortical thinning of this area was associated with suicide attempts in young subjects.38 In light of the previously mentioned, the preservation of the orbitofrontal cortex may play a role in lithium effects on suicidal behavior.39
The findings that we present regarding a lithium-related cortical thickening are in agreement with previous works on the effects of lithium and valproate in GM.22,24,25,27 Valproate has been reported to have positive, negative and no effect on GM.2,25 The review by Hafeman found that 17 out of 22 studies of mood stabilizers (including valproate) reported no effect of treatment on brain volumes, whereas the remaining 5 studies showed increased or normalized volume.9 In a large sample of MRI scans, the Enigma Bipolar Disorder Working Group found reduced cortical thickness in the left and right lateral occipital gyrus and right paracentral gyrus associated with antiepileptic treatment.26 Our findings concur with the reduction of cortical thickness associated with valproate in previous papers.25,27
On the other hand, a recent meta-analysis which included 15 studies and 854 subjects reported a significantly larger global GM volume in BD patients treated with lithium compared to those without.25 Hafeman et al reported that 45% of the included studies in his review found lithium to either normalize or increase GM volume compared to non-lithium BD patients and healthy subjects.9
Specifically, in the PFC, previous studies had replicated these findings. Li et al reported increased CT in the prefrontal cortex of BD patients on lithium compared to the ones on valproate,2 and the Enigma Bipolar Disorder Working Group found an increase in CT of PFC regions associated with lithium treatment.26
Although there is still no clear explanation for the effect of this molecule in brain structure, the increase in GM and global brain volumes have been linked with some treatment characteristics.9 Two longitudinal studies have associated GM density to treatment response, Lyoo et al observed a lithium-induced GM increase related to improvement in depressive symptoms.23 The other longitudinal study focused on the PFC and found that GM density was related to treatment response to lithium in patients with bipolar depression.24 In our sample, we included only euthymic patients with no treatment changes in the past 6 months nor hospitalizations, which makes it highly possible that most of our subjects were at least partial responders to lithium. Another characteristic associated with lithium effect over GM is the duration of treatment. Sani et al reported that BD patients with long exposure to lithium (>24 months) had larger hippocampal volumes compared to subjects with a short exposure (<24 months).41 Lyoo et al reported that GM lithium-induced increase peaked at 10–12 weeks of treatment and was sustained until the end of the study (16 weeks) while GM density in the group treated with valproate and healthy subjects remain unchanged.23 Even when we did not include in our study time of treatment, our subjects had more than 24 weeks on lithium. Considering the information provided by Lyoo et al,23 we assume that all of our lithium subjects had already passed the peak of GM increase. Nonetheless, we consider that time of exposure to lithium could similarly influence the structure of PFC as reported in the hippocampus41 and further investigations are needed on the topic.
The strengths of our study reside in the careful selection of our patients, with strict selection criteria that allowed us to limit potential confounders like the effect of some medications and affective symptoms. Our paired population helped to deal with the effects of age and sex. Nevertheless, both factors were included in the multivariate analysis as covariates where we found neither was associated with CT. Finally, the technique for CT analysis that we used contributed to finding subtle changes in brain morphometry.
We acknowledge some limitations in our study such as the lack of a control group, a female majority in our subjects and a small sample size. However, it is important to mention that significative associations of a gene variant with brain structure or function can be found with modest sample sizes.42,43 The reason for this, relays on a principle of imaging genetics which states that “brain structure, chemistry and function is closer to gene function than trait differences in overt behavior.”43 Because of this close relationship, large effects of a single gene can be expected, and sample size can be modest without compromising statistical power.42–44 Despite the previously mentioned, we consider that larger studies are needed in the field, and the results that we present must be replicated in a bigger and more balanced sample before generalizing the findings to all patients.
Conclusion
Our results suggest that CACNA1C risk allele rs1006737 is not associated with prefrontal CT in BD Mexican patients treated with lithium or valproate, it seems that in our sample the mood stabilizers were the main agent influencing the structure of a region implicated in the regulation of mood and behavior. Among the analyzed ROIs, the right orbitofrontal cortex reported lithium-related CT increase which is consistent with previous reports. In BD patients, the CT of the orbitofrontal cortex is associated with executive functions40 and suicide attempts.38 Hence, the conservation of the analyzed region is crucial for patient’s clinical outcomes. The findings in our study contribute to a better understanding of the effect of CACNA1C risk allele rs1006737 and mood stabilizers over the structure of PFC.
Acknowledgments
This study was funded by CONACyT-FOSISS, project number 261459 and Cátedras CONACyT number 1683.
Disclosure
The authors report no conflicts of interest in this work.
References
1. Lopez-Larson MP, DelBello MP, Zimmerman ME, Schwiers ML, Strakowski SM. Regional prefrontal gray and white matter abnormalities in bipolar disorder. Biol Psychiatry. 2002;52(2):93–100. doi:10.1016/S0006-3223(02)01350-1
2. Li L, Ji E, Han X, et al. Cortical thickness and subcortical volumes alterations in euthymic bipolar I patients treated with different mood stabilizers. Brain Imaging Behav. 2018;13(5):1255–1264. doi:10.1007/s11682-018-9950-9
3. Strakowski SM, DelBello MP, Sax KW, et al. Brain magnetic resonance imaging of structural abnormalities in bipolar disorder. Arch Gen Psychiatry. 1999;56(3):254–260. doi:10.1001/archpsyc.56.3.254
4. Strakowski SM, Delbello MP, Adler CM. The functional neuroanatomy of bipolar disorder: a review of neuroimaging findings. Mol Psychiatry. 2005;10(1):105–116.
5. Mesulam M. Principles of Behavioral and Cognitive Neurology. Oxford: Oxford University Press; 2000.
6. Lisy ME, Jarvis KB, Delbello MP, et al. Progressive neurostructural changes in adolescent and adult patients with bipolar disorder. Bipolar Disord. 2014;94(4):396–405. doi:10.1111/j.1399-5618.2011.00927.x
7. Ekman CJ, Lind J, Rydén E, Ingvar M, Landén M. Manic episodes are associated with grey matter volume reduction - a voxel-based morphometry brain analysis. Acta Psychiatr Scand. 2010;122(6):507–515. doi:10.1111/j.1600-0447.2010.01586.x
8. Adler CM, DelBello MP, Jarvis K, Levine A, Adams J, Strakowski SM. Voxel-based study of structural changes in first-episode patients with bipolar disorder. Biol Psychiatry. 2007;61(6):776–781. doi:10.1016/j.biopsych.2006.05.042
9. Hafeman DM, Chang KD, Garrett AS, Sanders EM, Phillips ML. Effects of medication on neuroimaging findings in bipolar disorder: an updated review. Bipolar Disord. 2012;14(4):375–410. doi:10.1111/j.1399-5618.2012.01023.x
10. Wang F, Mcintosh AM, He Y, Gelernter J, Blumberg HP. The association of genetic variation in CACNA1C with structure and function of a frontotemporal system. Bipolar Disord. 2011;13(7–8):696–700. doi:10.1111/j.1399-5618.2011.00963.x
11. Paulus FM, Bedenbender J, Krach S, et al. Association of rs1006737 in CACNA1C with alterations in prefrontal activation and fronto-hippocampal connectivity. Hum Brain Mapp. 2014;35(4):1190–1200. doi:10.1002/hbm.22244
12. Lancaster TM, Foley S, Tansey KE, Linden DEJ, Caseras X. CACNA1C risk variant is associated with increased amygdala volume. Eur Arch Psychiatry Clin Neurosci. 2016;266(3):269–275. doi:10.1007/s00406-015-0609-x
13. Huang L, Mo Y, Sun X, et al. The impact of CACNA1C allelic variation on regional gray matter volume in Chinese population. Am J Med Genet Part B Neuropsychiatr Genet. 2016;171(3):396–401. doi:10.1002/ajmg.b.32418
14. Frazier TW, Youngstrom EA, Frankel BA, et al. Candidate gene associations with mood disorder, cognitive vulnerability, and fronto-limbic volumes. Brain Behav. 2014;4(3):418–430. doi:10.1002/brb3.226
15. Starnawska A, Demontis D, Pen A, et al. CACNA1C hypermethylation is associated with bipolar disorder. Transl Psychiatry. 2016;6(6):1–7. doi:10.1038/tp.2016.99
16. Gurung R, Prata DP. What is the impact of genome-wide supported risk variants for schizophrenia and bipolar disorder on brain structure and function? A systematic review. Psychol Med. 2015;45(12):2461–2480. doi:10.1017/S0033291715000537
17. Erk S, Meyer-Lindenberg A, Linden DEJ, et al. Replication of brain function effects of a genome-wide supported psychiatric risk variant in the CACNA1C gene and new multi-locus effects. Neuroimage. 2014;94:147–154. doi:10.1016/j.neuroimage.2014.03.007
18. Soeiro-De-Souza MG, Lafer B, Moreno RA, et al. The CACNA1C risk allele rs1006737 is associated with age-related prefrontal cortical thinning in bipolar i disorder. Transl Psychiatry. 2017;7(4):2–7. doi:10.1038/tp.2017.57
19. Young LT. What exactly is a mood stabilizer? J Psychiatry Neurosci. 2004;29(2):87–88.
20. Musetti L, Tundo A, Benedetti A, et al. Lithium, valproate, and carbamazepine prescribing patterns for long-term treatment of bipolar I and II disorders: a prospective study. Hum Psychopharmacol. 2018;33(6):1–8. doi:10.1002/hup.2676
21. Karanti A, Kardell M, Lundberg U, Landén M. Changes in mood stabilizer prescription patterns in bipolar disorder. J Affect Disord. 2016;195:50–56. doi:10.1016/j.jad.2016.01.043
22. Abramovic L, Boks MPM, Vreeker A, et al. The association of antipsychotic medication and lithium with brain measures in patients with bipolar disorder. Eur Neuropsychopharmacol. 2016;26(11):1741–1751. doi:10.1016/j.euroneuro.2016.09.371
23. Lyoo IK, Dager SR, Kim JE, et al. Lithium-induced gray matter volume increase as a neural correlate of treatment response in bipolar disorder: a longitudinal brain imaging study. Neuropsychopharmacology. 2010;35(8):1743–1750. doi:10.1038/npp.2010.41
24. Moore GJ, Cortese BM, Glitz DA, et al. A longitudinal study of the effects of lithium treatment on prefrontal and subgenual prefrontal gray matter volume in treatment-responsive bipolar disorder patients. J Clin Psychiatry. 2009;70(5):699–705. doi:10.4088/JCP.07m03745
25. Sun YR, Herrmann N, Scott CJM, Black SE, Khan MM, Lanctôt KL. Global grey matter volume in adult bipolar patients with and without lithium treatment: a meta-analysis. J Affect Disord. 2018;225:599–606. doi:10.1016/j.jad.2017.08.078
26. Hibar DP, Westlye LT, Doan NT, et al. Cortical abnormalities in bipolar disorder: an MRI analysis of 6503 individuals from the ENIGMA Bipolar Disorder Working Group. Mol Psychiatry. 2018;23(4):932–942. doi:10.1038/mp.2017.73
27. Foland-Ross LC, Penfold C, Yang Y, et al. Investigation of cortical thickness abnormalities in lithium-free adults with bipolar i disorder using cortical pattern matching. Am J Psychiatry. 2011;168(5):530–539. doi:10.1176/appi.ajp.2010.10060896
28. Lavagnino L, Cao B, Mwangi B, et al. Changes in the corpus callosum in women with late-stage bipolar disorder. Acta Psychiatr Scand. 2016;43(2):269–284.
29. Kircher T, Wöhr M, Nenadic I, et al. Neurobiology of the major psychoses: a translational perspective on brain structure and function—the FOR2107 consortium. Eur Arch Psychiatry Clin Neurosci. 2018.
30. Van Der Schot AC, Vonk R, Brouwer RM, et al. Genetic and environmental influences on focal brain density in bipolar disorder. Brain. 2010;133(10):3080–3092. doi:10.1093/brain/awq236
31. American Psychiatric Association. Diagnostic and Statistical Manual of Mental Disorders.
32. Goebel R. BrainVoyager - Past, present, future. Neuroimage. 2012;62(2):748–756. doi:10.1016/j.neuroimage.2012.01.083
33. Zoellner S, Benner J, Zeidler B, et al. Reduced cortical thickness in Heschl’s gyrus as an in vivo marker for human primary auditory cortex. Hum Brain Mapp. 2019;40(4):1139–1154. doi:10.1002/hbm.24434
34. Goebel R. BrainVoyager User’s Guide. 2007.
35. Goebel R, Jansma H. Eck J. Getting started guide version 2.13 for BVQX 2.8; 2015:1–113. Available from: https://download.brainvoyager.com/doc/BVQXGettingStartedGuide_v2.13.pdf
36. Geuze E, Westenberg HGM, Heinecke A, De KCS, Goebel R, Vermetten E. Thinner prefrontal cortex in veterans with posttraumatic stress disorder. Neuroimage. 2008;41:675–681.
37. Wolf C, Mohr H, Schneider-Axmann T, et al. CACNA1C genotype explains interindividual differences in amygdala volume among patients with schizophrenia. Eur Arch Psychiatry Clin Neurosci. 2014;264(2):93–102. doi:10.1007/s00406-013-0427-y
38. Huber RS, Subramaniam P, Kondo DG, Shi X, Renshaw PF, Yurgelun-Todd DA. Reduced lateral orbitofrontal cortex volume and suicide behavior in youth with bipolar disorder. Bipolar Disord. 2019;21(4):321–329. doi:10.1111/bdi.12729
39. Smith KA, Cipriani A. Lithium and suicide in mood disorders: updated meta-review of the scientific literature. Bipolar Disord. 2017;19(7):575–586. doi:10.1111/bdi.12543
40. Abé C, Rolstad S, Petrovic P, et al. Bipolar disorder type I and II show distinct relationships between cortical thickness and executive function. Acta Psychiatr Scand. 2018;138(4):325–335. doi:10.1111/acps.12922
41. Sani G, Simonetti A, Janiri D, et al. Association between duration of lithium exposure and hippocampus/amygdala volumes in type I bipolar disorder. J Affect Disord. 2018;232:341–348. doi:10.1016/j.jad.2018.02.042
42. de Geus E, Goldberg T, Boomsma DI, Posthuma D. Imaging the genetics of brain structure and function. Biol Psychol. 2008;79(1):1–8. doi:10.1016/j.biopsycho.2008.04.002
43. Mattay VS, Goldberg TE, Sambataro F, Weinberger DR. Neurobiology of cognitive aging: insights from imaging genetics. Biol Psychol. 2008;79(1):9–22. doi:10.1016/j.biopsycho.2008.03.015
44. Bigos KL, Hariri A. Neuroimaging: technologies at the interface of genes, brain and behavior. Neuroimaging Clin N Am. 2007;17(4):467–469. doi:10.1016/j.nic.2007.09.005
 © 2020 The Author(s). This work is published and licensed by Dove Medical Press Limited. The full terms of this license are available at https://www.dovepress.com/terms.php and incorporate the Creative Commons Attribution - Non Commercial (unported, v3.0) License.
By accessing the work you hereby accept the Terms. Non-commercial uses of the work are permitted without any further permission from Dove Medical Press Limited, provided the work is properly attributed. For permission for commercial use of this work, please see paragraphs 4.2 and 5 of our Terms.
© 2020 The Author(s). This work is published and licensed by Dove Medical Press Limited. The full terms of this license are available at https://www.dovepress.com/terms.php and incorporate the Creative Commons Attribution - Non Commercial (unported, v3.0) License.
By accessing the work you hereby accept the Terms. Non-commercial uses of the work are permitted without any further permission from Dove Medical Press Limited, provided the work is properly attributed. For permission for commercial use of this work, please see paragraphs 4.2 and 5 of our Terms.