")
Back to Journals » International Journal of Nephrology and Renovascular Disease » Volume 8
C-reactive protein levels in combination with abdominal CT scans is a useful tool to predict the macroscopic appearance in late-stage EPS patients prior to surgery
Authors Kitterer D, Segerer S, Steurer W, Dippon J, Geissler A, Ulmer C, Braun N, Alscher MD , Latus J
Received 18 March 2015
Accepted for publication 21 April 2015
Published 13 August 2015 Volume 2015:8 Pages 83—90
DOI https://doi.org/10.2147/IJNRD.S84910
Checked for plagiarism Yes
Review by Single anonymous peer review
Peer reviewer comments 6
Editor who approved publication: Professor Pravin Singhal
Daniel Kitterer,1 Stephan Segerer,2 Wolfgang Steurer,3 Juergen Dippon,4 Angela Geissler,5 Christoph Ulmer,3 Niko Braun,1 Mark Dominik Alscher,1 Joerg Latus1
1Department of Internal Medicine, Division of Nephrology, Robert-Bosch-Hospital, Stuttgart, Germany; 2Division of Nephrology, University Hospital, Zurich, Switzerland; 3Department of General, Visceral and Trauma Surgery, Robert-Bosch-Hospital, 4Department of Mathematics, University of Stuttgart, 5Department of Radiology and Nuclear Medicine, Robert-Bosch-Hospital, Stuttgart, Germany
Background: Diagnosis of encapsulating peritoneal sclerosis (EPS) is based on clinical symptoms, radiologic findings, and macroscopic or histological criteria. Two diagnostic scores for radiologic findings in computed tomography (CT) scans of patients with EPS have been established in the past (by Tarzi et al and Vlijm et al). The macroscopic appearance of EPS has previously been separated into three types. The use of CT scan as a tool to predict different macroscopic phenotypes, leading to specific surgical techniques and different medical treatment, has not yet been investigated.
Methods: We retrospectively analyzed 30 patients with late-stage EPS who underwent major surgery with peritonectomy and enterolysis. The preoperative CT scans were scored according to the two aforementioned established diagnostic CT scores. The macroscopic phenotype, surgical procedure, and laboratory values at the time of surgery were evaluated. CT findings in the different macroscopic phenotypes were analyzed.
Results: All patients had highly predictive CT scores for EPS. The macroscopic Type III had significantly higher CT scores compared with the other macroscopic phenotypes. Patients with macroscopic Type I had significantly higher C-reactive protein values compared to EPS Type III. Operation time was significantly longer, and repeated surgery and intraoperative complications were more frequent in EPS Type I compared with EPS Type III (P<0.05). Using the CT score and CRP level, the sensitivities for prediction of EPS I and III were 78% and 87% with corresponding specificities of 67% and 93%.
Conclusion: Abdominal CT scans might help to identify patients with a higher risk of complications and provide important information for the surgical intervention prior to surgery.
Keywords: encapsulating peritoneal sclerosis, peritoneal dialysis, macroscopic phenotype, peritonectomy and enterolysis, PEEL, intraoperative findings, medical therapy in EPS
Introduction
Encapsulating peritoneal sclerosis (EPS) is a rare but severe complication of long-term peritoneal dialysis (PD). In the late stages of EPS, patients present mostly with signs of bowel obstruction, abdominal distension with abdominal pain, and weight loss. The incidence of EPS ranges between 0.3% and 8.1%.1–6 Although therapy has improved over the years, EPS-related morbidity and mortality are still high (mortality ranges from 19% to 55%),2–4,6–8 especially in the 1st year after diagnosis.
More than 10 years ago, the International Society of Peritoneal Dialysis defined the criteria for the diagnosis of EPS. Over the following years, several working groups refined these criteria and added further aspects; clinical signs and symptoms, and radiological, macroscopic, and histological findings are the diagnostic pillars.9–14 Additionally, risk factors for the development of EPS have been described: time on PD, younger age at start of PD, smoking, glucose exposure, and frequency and severity of peritonitis.2,3,6,9,15,16
The earlier stages of EPS are difficult to detect because clinical symptoms are lacking, and histological and radiological findings are not specific. Changes in transporter status and ultrafiltration failure can be the first signs in the development of EPS.2 As previously reported, the time from the first onset of symptoms to the requirement for surgery is quite short.4,17,18 Evidence-based medical treatment options for patients with EPS are lacking, especially for those in the late stages of the disease.7,8,19 Corticosteroids are a widely discussed treatment option, particularly in patients with EPS with signs of systemic inflammation, associated with elevated C-reactive protein (CRP) values.13,19 A proportion of patients will develop clinical signs of bowel obstruction and require major surgery;20–26 outcome was improved by this treatment when carried out in experienced centers.20,22
We recently described different macroscopic phenotypes of patients with EPS.18 Type I represents the inflammatory type of the disease, whereas a resoluble, cobweb-like, interenteric sclerotic cover visible on top of the brown EPS membrane characterizes Type II. Type III is the classic type, with intestinal cocooning and a sclerotic capsular enclosing the whole intestine. Prior to surgery, computed tomography (CT) scans were routinely performed in all patients with EPS.27 Recently, Tarzi et al28 and Vlijm et al29 established two CT scoring systems for the diagnosis of EPS. To date, the use of CT scans as a tool to predict different macroscopic phenotypes, leading to specific surgical techniques and different medical treatment, has not yet been investigated.
Patients and methods
We included patients with EPS from our referral center that underwent peritonectomy and enterolysis (PEEL) between June 2005 and December 2013. All patients fulfilled all criteria for the diagnosis of EPS,14,28–31 and were in the late stages of the disease with a requirement for major surgery.
The study protocol was approved by a local ethics committee in Germany (#322/2009BO1, Eberhard Karls University Tübingen, Germany). All patients gave written informed consent before participating in the study.
CT scans
All patients with EPS underwent CT scans of the abdomen and pelvis within a few days prior to surgery. Two experienced observers blinded to the intraoperative findings analyzed the CT scans using the two established CT scoring systems;28,29 details of both scoring systems are tabulated in Tables 1 and 2. Using the CT scoring system of Tarzi et al28 (Table 1), two groups of patients were defined according the median CT scores of the study group: one group with CT scores of 10–22 (high CT score) and one group with CT scores of 2.5–9 (low CT score). Owing to the dichotomous items used in the EPS scoring system of Vlijm et al29 (Table 2), no groups could be defined for further statistical analysis.
 | Table 1 CT scan scoring system by Tarzi et al |
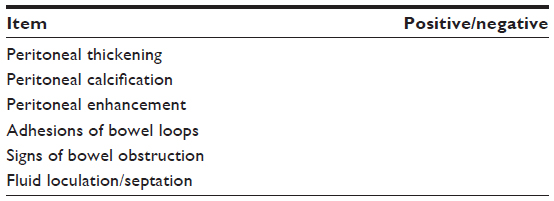 | Table 2 Cut-off values for a positive CT scan, using the CT scan scoring parameters of Vlijm et al |
Macroscopic phenotypes of EPS
Three different macroscopic phenotypes of EPS have been characterized.18 Type I represents peritoneum with a sticky fibrin coating on top of the EPS membranes that contain the brown and thick peritoneum with rare interenteric sclerotic membranes. Type II is characterized by a fragile, cobweb-like interenteric sclerotic cover on top of the brown EPS membrane. Type III is the classic type with intestinal cocooning, and a sclerotic capsule enclosing the whole intestine with a tendency to shrinkage, accompanied by interenteric sclerotic capsules.
Surgical procedure
PEEL is a surgical procedure that goes beyond simple adhesiolysis and decortication of the EPS membranes. PEEL is regularly performed as total enterolysis with adhesiolysis of the encapsulated intestine. During this procedure, decortication of the sclerotic membranes is performed. PEEL results in restitution of the intestinal passage and prevention of recurrent disease by decortication and resection of the peritoneum (deserosation), or, if full peritonectomy is not possible, partial deserosation of the peritoneal membrane. The primary aim is to avoid intestinal perforation or injury to the serosa during serosal suturing or bowel resection.
Statistical analysis
Continuous data are expressed as mean ± standard deviation. All continuous variables were tested for normality using the Kolmogorov–Smirnov test. The median with an interquartile range was used where the distribution was not normal. Comparisons between different groups were performed with the Mann–Whitney U test or Fisher’s exact test, as appropriate. Analysis was performed using GraphPad Prism statistical software package (San Diego, CA, USA). P<0.05 (two-tailed) was considered significant.
To predict EPS phenotypes based on the CT findings and the CRP value, a multiclass classification tree was constructed. To avoid an over-optimistic estimate of the misclassification rate, we judged its predictive ability by running a bootstrap method (R-package random Forest Survival, Regression and Classification). Similarly, the multiclass area under the curve (AUC) was estimated by cross-validation and with the help of the R-package receiver operating characteristic.
Results
Clinical information of the study group
In total, 30 patients with late-stage EPS with a requirement for major surgery were included in the study. Clinical data from the study population are summarized in Table 3. Mean age at time of diagnosis was 52±11.8 years. There was a male predominance (24 men and six women). PD duration at time of surgery was 73 months (range, 57.8–106.5) and time between cessation of PD and surgery was 10 (2–23) months. Time from onset of symptoms associated with EPS to surgery was 4.5 months (range, 1.0–11.3). At the time of surgery, 20 patients had already been switched to hemodialysis, eight patients were switched to hemodialysis at the time of surgery, and two patients had a functioning transplant. CRP levels were elevated in 28 out of 30 patients, with median CRP levels of 2.6 mg/dL (range, 1.3–9.6; normal range, 0.1–0.5). The American Society of Anesthesiologists physical status32–34 was high in all patients (3±0.5), but no differences could be detected between the three different groups (P>0.05).
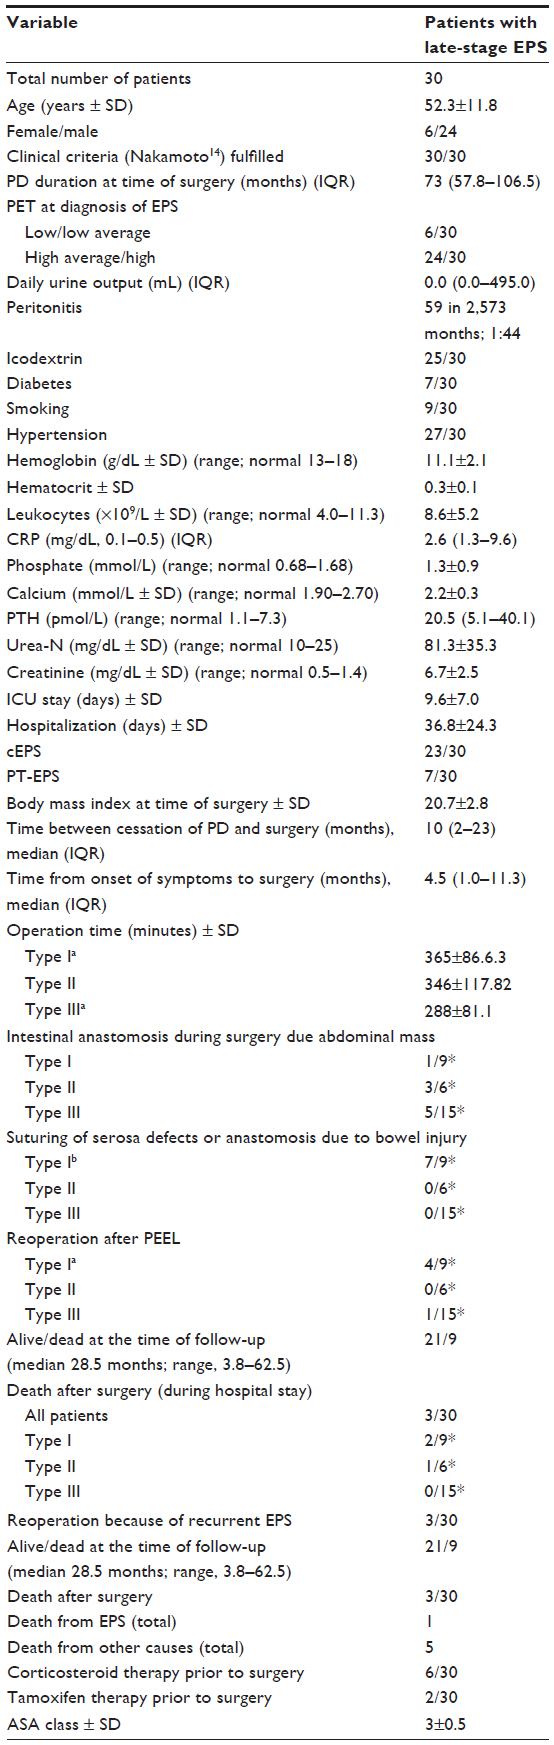 | Table 3 Clinical data of study population |
Regarding the surgical procedure, eleven patients required intestinal anastomosis due to bowel obstruction. Operation time was statistically significantly longer in EPS Type I than in EPS Type III (365±86.6 minutes vs 288±81.1 minutes) (P<0.05). The number of patients who needed reoperations (2±6 days after initial operation) was also higher in EPS Type I than in EPS Type III (P<0.05). Serosal defects with requirement for sutures or intestinal anastomosis (one patient) due to bowel injury (by the surgeon) was more frequently observed in patients with EPS Type I than in patients with EPS Types II and III (P<0.001).
Prior to surgery, six of 30 patients were treated with steroids, and only a small proportion of patients (two of 30 patients) received tamoxifen. One patient received immunosuppressive therapy after kidney transplantation. One patient was taking mycophenolate mofetil for treatment of systemic lupus erythematosus.
Radiological evaluation
CT scans prior to surgery were available for all 30 patients; 21 scans were performed at our hospital, while the remaining nine were performed by the referring physicians or in the transferring hospital. Twenty CT scans (67%) were performed using intravenous contrast medium (CM). The analysis of the two scoring systems is described in Tables 1 and 2. For the diagnosis of EPS, all patients had to have positive CT scores (with or without CM), using both of the established scoring systems.28,29 The details of the CT findings of our study population are summarized in Tables 4 and 5 and Figure 1. The median score was four (range, 3–5) on the Vlijm et al system,29 and eleven (range, 8–12) on the Tarzi et al system.28 In EPS Type I, only mild peritoneal calcification with extensive loculated ascites and adhesions of bowel loops was observed. CM enhancement of the peritoneum was a common finding in CM-enhanced CT scans in patients with Type III (Figure 1). Bowel wall thickening, dilatation, and tethering of the bowel, particularly in the pelvis minor, were present in all three groups of patients (Figure 1). Extensive calcification of the peritoneal membrane with extensive peritoneal thickening was a common finding in EPS Type III (Figure 1).
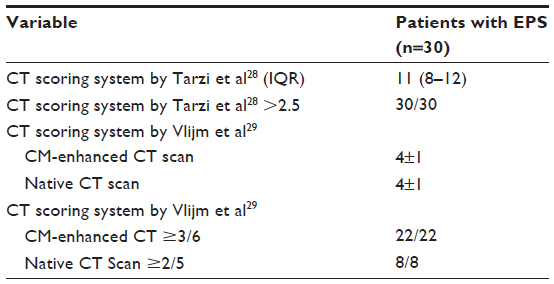 | Table 4 Results of the CT scoring system in our study population using both established CT scoring systems |
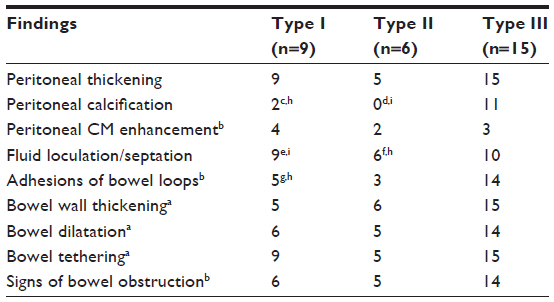 | Table 5 CT findings in different macroscopic phenotypes of EPS (n=30) |
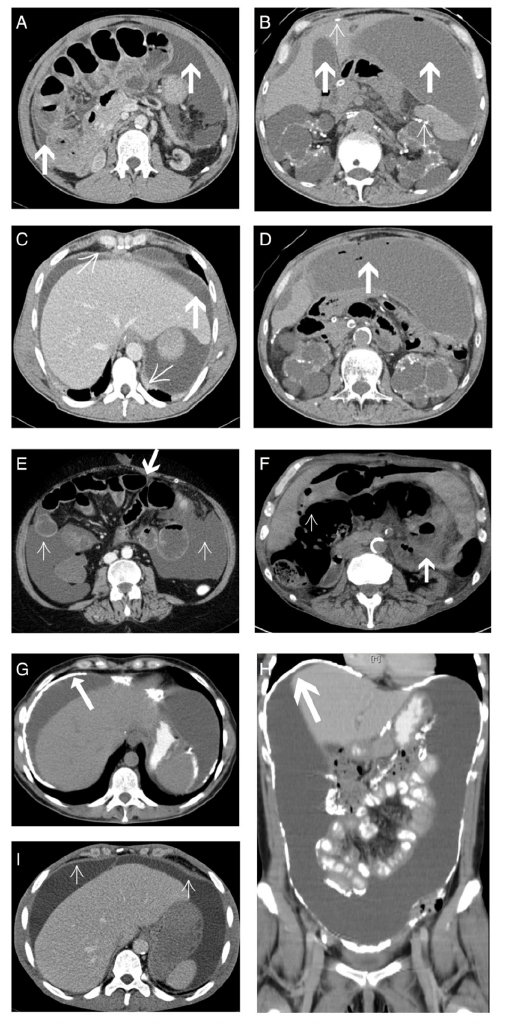 | Figure 1 Cross-sectional abdominal CT images of EPS Type I–III patients. |
Comparison of CT findings between the different macroscopic phenotypes
We compared the CT findings of the 30 patients with the intraoperative macroscopic phenotypes (Table 5). In all patients, bowel wall thickening, tethering of the bowel (especially in the pelvis), dilatation of bowel loops, and peritoneal thickening could be detected. In EPS Types I and II, loculated ascites was significantly more common than in EPS Type III using the Vlijm et al29 score (P<0.01 and P<0.05). Furthermore, pronounced areas of calcifications of the peritoneal membrane were more common in EPS Type III than in Types II and I (P<0.01 and P<0.05, respectively) (Figure 1 and Table 5).
Using the CT score established by Tarzi et al,28 patients with macroscopic Type I showed a median CT score of eight (range, 8–11), whereas patients with EPS Type II had a median score of six (range, 5–7) (P<0.05). Median CT scores of 12 could be detected in patients with EPS Type III (range, 11–15). Patients with EPS Type III had significantly higher CT scores than patients with EPS Types I and II (P<0.01 and P<0.001) (Figure 2). Additionally, all patients with EPS Type III had CT scores >10 using the scoring system of Tarzi et al,28 whereas none of the patients with Type II had CT scores >9. In EPS Type I, 40% of the patients were in the high CT score group. CRP levels were statistically significantly higher in these patients compared to Type III (P<0.01).
There were no significant differences in CRP levels between Types I and II or between Types II and III (P=0.9 and P=0.09).
Prediction of the macroscopic phenotype prior to surgery
Using the score from Vlijm et al,29 there was an overall error rate of 50% (multiclass AUC =0.62) in the prediction of the macroscopic phenotype. After the addition of CRP levels to the radiological findings, the overall error rate decreased to 43% (multiclass AUC =0.70).
Taking into account the Tarzi et al28 score, the overall error rate in the prediction of the macroscopic phenotype was 33% (multiclass AUC =0.66). Using radiological findings used in Tarzi et al28 score in combination with CRP values resulted in an overall error rate of 23% (multiclass AUC =0.81).
Therefore, the Tarzi et al28 score in combination with CRP levels was used for further analyses. The sensitivity of the prediction of EPS Type I was 0.78 (95% confidence interval [CI] =[0.4 0.97]) with a specificity 0.76 (95% CI =[0.53 0.92]). The positive predictive value was 0.58 (95% CI =[0.28 0.85]) and the negative predictive value was 0.89 (95% CI =[0.65 0.99]), with a misclassification rate of 0.23 (95% CI =[0.1 0.42]). The sensitivity of the prediction of EPS Type II was 0.5 (95% CI =[0.12 0.88]) and the specificity was 0.96 (95% CI =[0.79 1]). The positive predictive value was 0.75 (95% CI =[0.19 0.99]) and negative predictive value was 0.88 (95% CI =[0.7 0.98]), with a misclassification rate of 0.13 (95% CI =[0.04 0.31]).
The prediction of EPS Type III had a sensitivity of 0.87 (95% CI =[0.6 0.98]) and a specificity of 0.93 (95% CI =[0.68 1]). The positive predictive value was 0.93 (95% CI =[0.66 1]), and the negative predictive value was 0.88 (95% CI =[0.62 0.98]), with a misclassification rate of 0.1 (95% CI =[0.02 0.27]) (Figures 2 and 3).
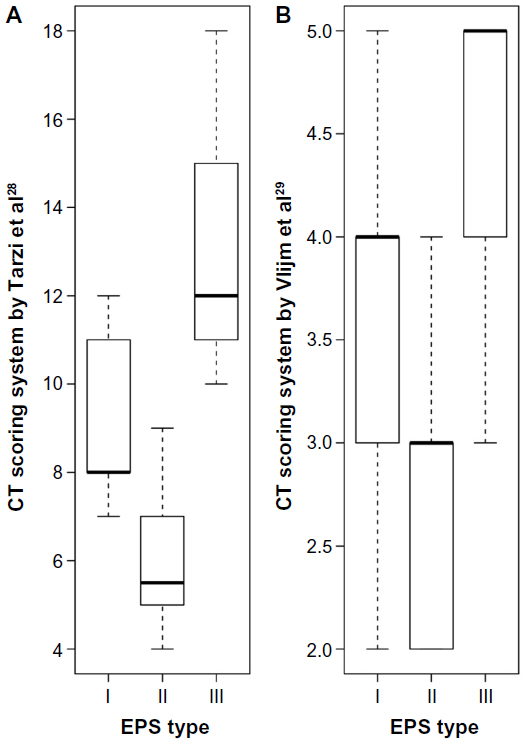 | Figure 2 CT score of patients with different macroscopic phenotypes (mean ± SD) and CRP levels (median with IQR) in patients with EPS Type I–III. |
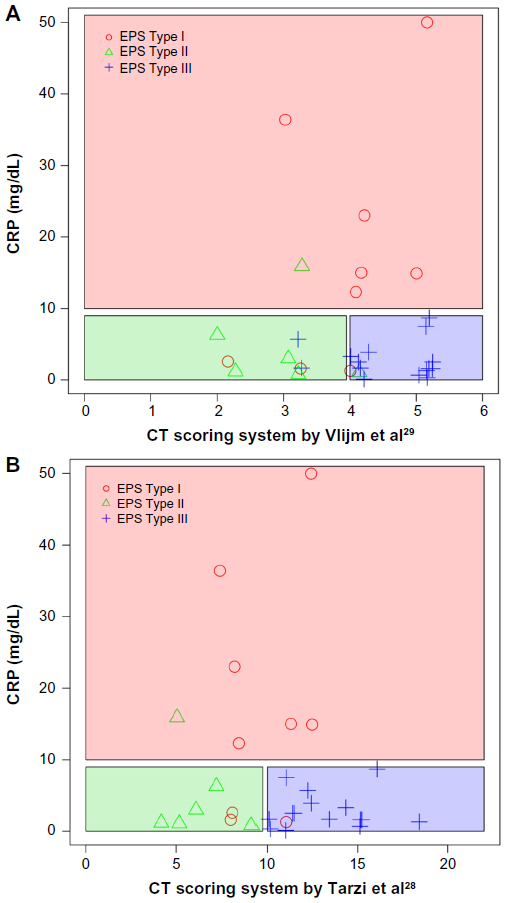 | Figure 3 Prediction of the macroscopic phenotype based on the CT scores |
Discussion
In this retrospective single-center study, we used CT parameters from two established CT scores to investigate the differences between CT findings prior to surgery and the macroscopic phenotype in a large cohort of well-defined patients with EPS.28,29,35 In patients with late-stage EPS with symptoms of bowel obstruction, major surgery using PEEL or using decortication and enterolysis of the peritoneum seems to be the only established treatment option.4,19
In the current study, statistically significant differences in the CT scores were found for the macroscopic phenotypes. In all patients with EPS, bowel wall thickening, tethering of the bowel (especially in the small pelvis of EPS patients), dilatation of bowel loops, and peritoneal thickening occur. Patients with the typical cocooning and sparse exudations of the sclerotic capsule (Type III EPS) had higher CT scores than patients with the inflammatory Type I (sticky fibrin coating on top of the peritoneum). Nearly half (40%) of patients in the Type I group had CT scores >9; in these patients, CRP levels were significantly higher than that in patients in the Type III group. Additionally, the areas of calcifications were almost exclusively detected in patients with EPS Type III. In Type I EPS, pronounced loculated ascites dominated. Therefore, the combination of CT score, CRP levels, and the presence of calcification might be a useful tool to differentiate between Types I and III EPS with a sensitivity between 78% and 87% and a specificity of 67% and 93%. Especially, the differentiation between EPS Type I and EPS Type III using simple tools (CT findings and CRP levels) has consequences in everyday clinical practice (eg, organization of the operation room plan due to different operation times depending on the macroscopic phenotype and selection of the surgeon).
In cases of requirement for major surgery, there were clear differences in the surgical techniques used for the inflammatory phenotype (Type I) and the classic phenotype (Type III), as shown by a shorter operation time for EPS Type III compared to EPS Type I.
In patients with EPS Type I, the surgical technique used is much more sophisticated because there is no separable sclerotic membrane covering the intestine, but rather a diffuse, thin, and fragile fibrin membrane, and this is reflected in the higher numbers of patients requiring suturing of serosal defects or anastomosis during surgery or reoperation in EPS Type I compared with EPS Type III. Therefore, CT scans prior to surgery should be integrated into the surgical planning process to distinguish between the different macroscopic phenotypes of EPS in order to optimize the surgical procedure.
The study has several limitations, mostly due to its retrospective character. No statistically significant differences could be detected between the groups of patients with high and low scores regarding outcome, but it should be noted that the study was not powered to find such a difference. Another limitation is the abundance of patients on hemodialysis in our cohort, and the fact that only seven patients had received a kidney transplant in the past (post-transplantation EPS). Therefore, there might be differences regarding the prediction of the macroscopic phenotype using the CT score in patients with post-transplantation EPS. As previously discussed regarding the CT score, the assessment of fluid loculation in patients still on PD or shortly after stopping PD might be challenging.
Different surgical procedures in late-stage patients with EPS have been described elsewhere.22,23,26,36 In our patient cohort, the operations were done by a single surgeon and were performed as previously described.22 Therefore, differences in operation time, intraoperative complications, and the number of particular features (eg, intestinal anastomosis) might be apparent using other surgical approaches.36,37 Furthermore, due to the retrospective study design, we could not definitively prove that using the CT score would have changed the surgical approach. A prospective study needs to address the clinical impact of the scoring system prior to surgery. To date, the different macroscopic phenotypes of EPS have been described only in 24 patients from our referral center. There is still discussion whether these macroscopic phenotypes might represent different stages of the disease.38 Nevertheless, regardless of whether the different phenotypes might represent different stages of the disease, there is growing evidence that patients should be treated individually, based on the different changes in the peritoneal membrane.19 It is noteworthy that the numbers of patients included in this study are low and conclusions should therefore be treated with some caution.
In conclusion, surgical treatment of the inflammatory EPS Type I was associated with more intraoperative complications and a longer operation time with different surgical techniques. The combination of CT score, CRP levels, the presence of calcification, and the absence of fluid locations might be a useful tool to differentiate Type I from Type III prior to surgery.
Acknowledgments
The study was supported by the Robert-Bosch Foundation. DK, JL, and NB were supported by the Robert-Bosch Foundation. There were no external funding sources for this study.
Disclosure
The authors report no conflicts of interest in this work.
References
Kawanishi H, Kawaguchi Y, Fukui H, et al. Encapsulating peritoneal sclerosis in Japan: a prospective, controlled, multicenter study. Am J Kidney Dis. 2004;44(4):729–737. | |
Brown MC, Simpson K, Kerssens JJ, Mactier RA. Encapsulating peritoneal sclerosis in the new millennium: a national cohort study. Clin J Am Soc Nephrol. 2009;4(7):1222–1229. | |
Johnson DW, Cho Y, Livingston BE, et al. Encapsulating peritoneal sclerosis: incidence, predictors, and outcomes. Kidney Int. 2010;77(10):904–912. | |
Summers AM, Clancy MJ, Syed F, et al. Single-center experience of encapsulating peritoneal sclerosis in patients on peritoneal dialysis for end-stage renal failure. Kidney Int. 2005;68(5):2381–2388. | |
Rigby RJ, Hawley CM. Sclerosing peritonitis: the experience in Australia. Nephrol Dial Transplant. 1998;13(1):154–159. | |
Korte MR, Sampimon DE, Lingsma HF, et al; Dutch Multicenter EPS Study. Risk factors associated with encapsulating peritoneal sclerosis in Dutch EPS study. Perit Dial Int. 2011;31(3):269–278. | |
Balasubramaniam G, Brown EA, Davenport A, et al. The Pan-Thames EPS study: treatment and outcomes of encapsulating peritoneal sclerosis. Nephrol Dial Transplant. 2009;24(10):3209–3215. | |
Latus J, Ulmer C, Fritz P, et al. Encapsulating peritoneal sclerosis: a rare, serious but potentially curable complication of peritoneal dialysis-experience of a referral centre in Germany. Nephrol Dial Transplant. 2013;28(4):1021–1030. | |
Kawaguchi Y, Kawanishi H, Mujais S, Topley N, Oreopoulos DG. Encapsulating peritoneal sclerosis: definition, etiology, diagnosis, and treatment. International Society for Peritoneal Dialysis Ad Hoc Committee on Ultrafiltration Management in Peritoneal Dialysis. Perit Dial Int. 2000;20(Suppl 4):S43–S55. | |
Kawaguchi Y, Saito A, Kawanishi H, et al. Recommendations on the management of encapsulating peritoneal sclerosis in Japan, 2005: diagnosis, predictive markers, treatment, and preventive measures. Perit Dial Int. 2005;25(Suppl 4):S83–S95. | |
Korte MR, Sampimon DE, Betjes MG, Krediet RT. Encapsulating peritoneal sclerosis: the state of affairs. Nat Rev Nephrol. 2011;7(9):528–538. | |
Braun N, Alscher MD, Kimmel M, Amann K, Buttner M. Encapsulating peritoneal sclerosis – an overview. Nephrol Ther. 2011; 7(3):162–171. | |
Habib SM, Betjes MG, Fieren MW, et al; Eps Registry. Management of encapsulating peritoneal sclerosis: a guideline on optimal and uniform treatment. Neth J Med. 2011;69(11):500–507. | |
Nakamoto H. Encapsulating peritoneal sclerosis – a clinician’s approach to diagnosis and medical treatment. Perit Dial Int. 2005;25(Suppl 4):S30–S38. | |
Oules R, Challah S, Brunner FP. Case-control study to determine the cause of sclerosing peritoneal disease. Nephrol Dial Transplant. 1988;3(1):66–69. | |
Nakao M, Yokoyama K, Yamamoto I, et al. Risk factors for encapsulating peritoneal sclerosis in long-term peritoneal dialysis: a retrospective observational study. Ther Apher Dial. 2014;18(1):68–73. | |
Kawanishi H, Harada Y, Noriyuki T, et al. Treatment options for encapsulating peritoneal sclerosis based on progressive stage. Adv Perit Dial. 2001;17:200–204. | |
Latus J, Ulmer C, Fritz P, et al. Phenotypes of encapsulating peritoneal sclerosis – macroscopic appearance, histologic findings, and outcome. Perit Dial Int. 2013;33(5):495–502. | |
Kawanishi H. Surgical and medical treatments of encapsulation peritoneal sclerosis. Contrib Nephrol. 2012;177:38–47. | |
Kawanishi H, Moriishi M, Tsuchiya S. Experience of 100 surgical cases of encapsulating peritoneal sclerosis: investigation of recurrent cases after surgery. Adv Perit Dial. 2006;22:60–64. | |
Kawanishi H, Moriishi M, Ide K, Dohi K. Recommendation of the surgical option for treatment of encapsulating peritoneal sclerosis. Perit Dial Int. 2008;28(Suppl 3):S205–S210. | |
Ulmer C, Braun N, Rieber F, et al. Efficacy and morbidity of surgical therapy in late-stage encapsulating peritoneal sclerosis. Surgery. 2013;153(2):219–224. | |
Kawanishi H, Shintaku S, Moriishi M, Dohi K, Tsuchiya S. Seventeen years’ experience of surgical options for encapsulating peritoneal sclerosis. Adv Perit Dial. 2011;27:53–58. | |
Kawanishi H, Watanabe H, Moriishi M, Tsuchiya S. Successful surgical management of encapsulating peritoneal sclerosis. Perit Dial Int. 2005;25(Suppl 4):S39–S47. | |
Gandhi VC, Humayun HM, Ing TS, et al. Sclerotic thickening of the peritoneal membrane in maintenance peritoneal dialysis patients. Arch Intern Med. 1980;140(9):1201–1203. | |
Celicout B, Levard H, Hay J, Msika S, Fingerhut A, Pelissier E. Sclerosing encapsulating peritonitis: early and late results of surgical management in 32 cases. French Associations for Surgical Research. Dig Surg. 1998;15(6):697–702. | |
Upponi S, Butler AJ, Watson CJ, Shaw AS. Encapsulating peritoneal sclerosis-correlation of radiological findings at CT with underlying pathogenesis. Clin Radiol. 2014;69(1):103–109. | |
Tarzi RM, Lim A, Moser S, et al. Assessing the validity of an abdominal CT scoring system in the diagnosis of encapsulating peritoneal sclerosis. Clin J Am Soc Nephrol. 2008;3(6):1702–1710. | |
Vlijm A, Stoker J, Bipat S, et al. Computed tomographic findings characteristic for encapsulating peritoneal sclerosis: a case-control study. Perit Dial Int. 2009;29(5):517–522. | |
Braun N, Fritz P, Ulmer C, et al. Histological criteria for encapsulating peritoneal sclerosis – a standardized approach. PLoS One. 2012; 7(11):e48647. | |
Honda K, Nitta K, Horita S, et al. Histologic criteria for diagnosing encapsulating peritoneal sclerosis in continuous ambulatory peritoneal dialysis patients. Adv Perit Dial. 2003;19:169–175. | |
Saklad M. Grading of patients for surgical procedures. Anesthesiology. 1941;1941(2):281–284. | |
American Society of Anesthesiologists. New classification of physical status. Anesthesiology. 1963;24:111. | |
Keats AS. The ASA classification of physical status – a recapitulation. Anesthesiology. 1978;49(4):233–236. | |
Goodlad C, Tarzi R, Gedroyc W, Lim A, Moser S, Brown EA. Screening for encapsulating peritoneal sclerosis in patients on peritoneal dialysis: role of CT scanning. Nephrol Dial Transplant. 2011;26(4):1374–1379. | |
Kawanishi H. Surgical treatment for encapsulating peritoneal sclerosis. Adv Perit Dial. 2002;18:139–143. | |
Kawanishi H, Ide K, Yamashita M, et al. Surgical techniques for prevention of recurrence after total enterolysis in encapsulating peritoneal sclerosis. Adv Perit Dial. 2008;24:51–55. | |
Watson CJ, Butler AJ, Bradley JA. Classification of encapsulating peritoneal sclerosis is important, but must encapsulate the entire spectrum of the disease. Perit Dial Int. 2013;33(5):479–481. |
 © 2015 The Author(s). This work is published and licensed by Dove Medical Press Limited. The full terms of this license are available at https://www.dovepress.com/terms.php and incorporate the Creative Commons Attribution - Non Commercial (unported, v3.0) License.
By accessing the work you hereby accept the Terms. Non-commercial uses of the work are permitted without any further permission from Dove Medical Press Limited, provided the work is properly attributed. For permission for commercial use of this work, please see paragraphs 4.2 and 5 of our Terms.
© 2015 The Author(s). This work is published and licensed by Dove Medical Press Limited. The full terms of this license are available at https://www.dovepress.com/terms.php and incorporate the Creative Commons Attribution - Non Commercial (unported, v3.0) License.
By accessing the work you hereby accept the Terms. Non-commercial uses of the work are permitted without any further permission from Dove Medical Press Limited, provided the work is properly attributed. For permission for commercial use of this work, please see paragraphs 4.2 and 5 of our Terms.