")
Back to Journals » Clinical Epidemiology » Volume 13
Burden of Respiratory Infection and Tuberculosis Among US States from 1990 to 2019
Authors Zhong W , Bragazzi NL , Kong JD, Safiri S , Behzadifar M , Liu J, Liu X , Wang W
Received 10 April 2021
Accepted for publication 5 June 2021
Published 29 June 2021 Volume 2021:13 Pages 503—514
DOI https://doi.org/10.2147/CLEP.S314802
Checked for plagiarism Yes
Review by Single anonymous peer review
Peer reviewer comments 2
Editor who approved publication: Professor Vera Ehrenstein
Wen Zhong,1 Nicola Luigi Bragazzi,2 Jude Dzevela Kong,2 Saeid Safiri,3,4 Masoud Behzadifar,5 Jun Liu,1 Xinyao Liu,6 Weijun Wang7
1Department of General Medicine, Xiangya Hospital, Central South University, Changsha, People’s Republic of China; 2Centre for Disease Modelling, York University, Toronto, Ontario, Canada; 3Tuberculosis and Lung Disease Research Center, School of Medicine, Tabriz University of Medical Sciences, Tabriz, Iran; 4Aging Research Institute, Tabriz University of Medical Sciences, Tabriz, Iran; 5Social Determinants of Health Research Center, Lorestan University of Medical Sciences, Khorramabad, Iran; 6Department of Cardiology, The Third Xiangya Hospital, Central South University, Changsha, People’s Republic of China; 7Union Hospital, Tongji Medical College, Huazhong University of Science and Technology, Wuhan, People’s Republic of China
Correspondence: Xinyao Liu
Department of Cardiology, The Third Xiangya Hospital, Central South University, 138 Tongzipo Road, Changsha, 410013, People’s Republic of China
Tel/Fax +86-0731-88618319
Email [email protected]
Weijun Wang
Union Hospital, Tongji Medical College, Huazhong University of Science and Technology, 1277 Jiefang Avenue, Wuhan, 430022, People’s Republic of China
Tel/Fax +86-135-45340998
Email [email protected]
Purpose: To estimate the incidence, death, disability-adjusted life years (DALYs) and attributable risk factors for respiratory infection and tuberculosis (RIT) in the US from 1990 to 2019.
Methods: Following the methodology framework and analytical strategies used in the Global Burden of Disease Study 2019, the incidence, death, DALYs and risk factors of RIT were examined by age, gender and states from 1990 to 2019 in the US. All estimates were calculated as counts, age-standardized rates per 100,000 people and percentage change, with 95% confidence intervals (CIs).
Results: In 2019, the age-standardized incidence, death and DALY rates per 100,000 people of RIT were 339,703 (95% CI 303,184 to 382,354), 13.6 (95% CI 12.2 to 14.4) and 384.9 (95% CI 330.6 to 458.6), respectively. Among RIT causes, upper respiratory infection accounted for the large majority of RIT age-standardized incidence rate, while lower respiratory infection constituted the highest proportion of RIT age-standardized death and DALY rates. The age-standardized incidence, death and DALY rates of RIT in 2019 and their temporal trends since 1990 varied widely across states and socio-demographic index. Among all attributable risk factors, smoking was the leading one for age-standardized RIT deaths in 2019, followed by low temperature and alcohol use (the attributable fractions were 17.7%, 15.3% and 6.9%, respectively).
Conclusion: Our results suggest that RIT remained a major cause of health burden in the US, with large disparities persisting between US states. Intervention efforts for RIT hotspots, high-risk populations and modifiable risk factors are necessary.
Keywords: mortality, disability-adjusted life years, trend, United States
Introduction
Respiratory infection and tuberculosis (RIT), including upper respiratory infection, lower respiratory infection, otitis media and tuberculosis, ranked 7th among causes of death in the US, and brought about 83,000 deaths in 2019.1 Among these causes, lower respiratory infection is a major public health concern worldwide, and the leading cause of mortality among infectious diseases in the US, accounting for 78.8% of total infectious disease deaths in 2014.2 In 2019, pneumonia combined with influenza ranked 9th in the leading causes of death, claiming 49,783 lives.3 On the other hand, tuberculosis remained a persistent low-level epidemic for years, which is still difficult to be eliminated in the US.4 Despite a decline in mortality from RIT due to improved preventive measures and more effective treatments, RIT remains a health challenge to society as a result of the existing huge health burden, antibiotics abuse and potential outbreak of unknown pathogen.2,4
The epidemiological pattern of infectious disease presented large disparities across regions owing to different environments, health policies, customs and socio-demographic indexes (SDI), etc.5–7 Accordingly, distribution of RIT at sub-national level also varied across the country, and cartography of RIT will be beneficial to the management of risk factors and health policy-making of each state. To the best of our knowledge, no study has been carried out so far to comprehensively measure the disparities in the US. In this article, we thus aim to report the burden of RIT and discuss its modifiable risk factors in the US based on the most recent Global Burden of Disease Study 2019.
Method
Overview
The GBD study, conducted by the Institute of Health Metrics and Evaluation (IHME), provides annual updates on the burden of diseases, injuries and risk factors at the global, regional and national levels. In the most up-to-date iteration, GBD 2019 analyzed 369 diseases and injuries, and 87 risk factors systematically; the general methods used in GBD 2019 have been published previously,1,8,9 and the code and the flowchart of tuberculosis and respiratory infection are available freely on the website: http://ghdx.healthdata.org/gbd-2019/code (Supplement Method). Here, we summarized the methods related to the estimation of RIT burden in the US. This study was approved by the University of Washington Institutional Review Board, and the informed consent was waived because no identifiable data were used.
Data Sources
RIT was defined using the International Classification of Diseases version 9 (ICD-9) and ICD-10. Diseases coded as H65-H71.93 in ICD-10 and 381–383.9 in ICD-9 were identified as otitis media, while diseases coded as J00-J06.9, J36-J36.0 in ICD-10, and 460–465.9, 475–475.9 in ICD-9 were identified as upper respiratory infection. Lower respiratory infection, including bronchitis, bronchiolitis and pneumonia, was coded as A48.1, A70, B96.0-B97.6, J09-J22.9, J85.1-J91.0, P23-P23.9, U04-U04.9 in ICD-10, and 079.82, 466–470.0, 480–484, 484.1–490.9, 510–513.9, 770.0, V12.61 in ICD-9. Tuberculosis was coded as A10-A19.9, B90-B90.9, K67.3, K93.0, M49.0, N74.0-N74.1, P37.0, U84.3 in ICD-10, and 010–019.9, 137–137.9, 320.4, 730.4–730.6 in ICD-9. The data sources used to produce estimates for the burden of RIT can be extracted by GBD 2019 Data Input Sources Tool (http://ghdx.healthdata.org/gbd-2019/data-input-sources). All estimated results about the burden of RIT were publicly available via an online query tool on the website of IHME (http://ghdx.healthdata.org/gbd-results-tool).
Estimation of Burden for RIT in the US
Considering the relatively short course of respiratory infectious diseases, incidence outstrips prevalence in depicting the epidemiological trends of RIT. The incidence of RIT was defined as the new or relapse cases diagnosed within a year, and the incidence stratified by state, year, gender and age group was estimated by DisMod-MR 2.1 model, a Bayesian meta-regression tool developed for the GBD study.8
To estimate the mortality of RIT, Cause of Death Ensemble Model (CODEm) was used. CODEm ensembles different models incorporated with various predictive covariates to analyze the cause of death, and several covariates were chosen to perform best with CODEm (Supplement Table S1).1 Moreover, disability-adjusted life years (DALYs), the sum of years of life lost (YLLs) and years lived with disability (YLDs), were estimated for the overall health loss of RIT. YLLs were calculated by multiplying RIT-related deaths in each age group by the standard life expectancy at that age, and YLDs represented the health loss associated with the severity level of RIT, from 0 (full health) to 1 (death).8
Socio-Demographic Index
SDI was used to measure the relationship between development of each state and RIT burden. SDI is a metric consisting of 3 components: total fertility rate under age 25 years, lag-distributed income per capita and average educational attainment in populations aged 15 years or older. SDI value ranges from 0 (least developed) to 1 (most developed).
Attributable Risk Factors for RIT
The GBD study had provided the comparative risk assessment framework to quantify the burden of diseases and injuries attributable to risk factors.9 In brief, we selected risky factors for which there is sufficient evidence of causation with RIT, accessible exposure data and potential for modification. In GBD 2019, 15 risk factors were identified to be related to RIT, including smoking, secondhand smoke, alcohol use, household air pollution from solid fuels, ambient particulate matter pollution, high temperature, low temperature, child wasting, child stunting, child underweight, low birth weight, non-exclusive breastfeeding, short gestation, no access to handwashing facility, high fasting plasma glucose. The deaths from RIT attributable to risk factors were calculated by multiplying the number of deaths for the outcome by the population attributable fraction (PAF) for the risk-outcome pair, as described before.9
Uncertainty Analysis
Uncertainty was propagated through all estimation by sampling 1000 draws at each calculation step, and 95% confidence intervals (CIs) were defined as the 2.5th and 97.5th percentiles of the 1000 draws.
Result
Total RIT Burden and Its Changes in the US
As shown in Table 1, in 2019, the total age-standardized incidence rate of RIT in the US was 339,703 (95% CI 303,184 to 382,354) per 100,000 people. Among RIT causes, upper respiratory infection accounted for the large majority of age-standardized incidence rate [331,560 (95% CI 294,985 to 373,553) per 100,000 people], while tuberculosis had the minimum age-standardized incidence rate [2.1 (95% CI 1.8 to 2.5) per 100,000 people]. Since 1990, this has remained almost unchanged in total age-standardized incidence rate of RIT, but a significant decrease was observed for tuberculosis (−72.1%).
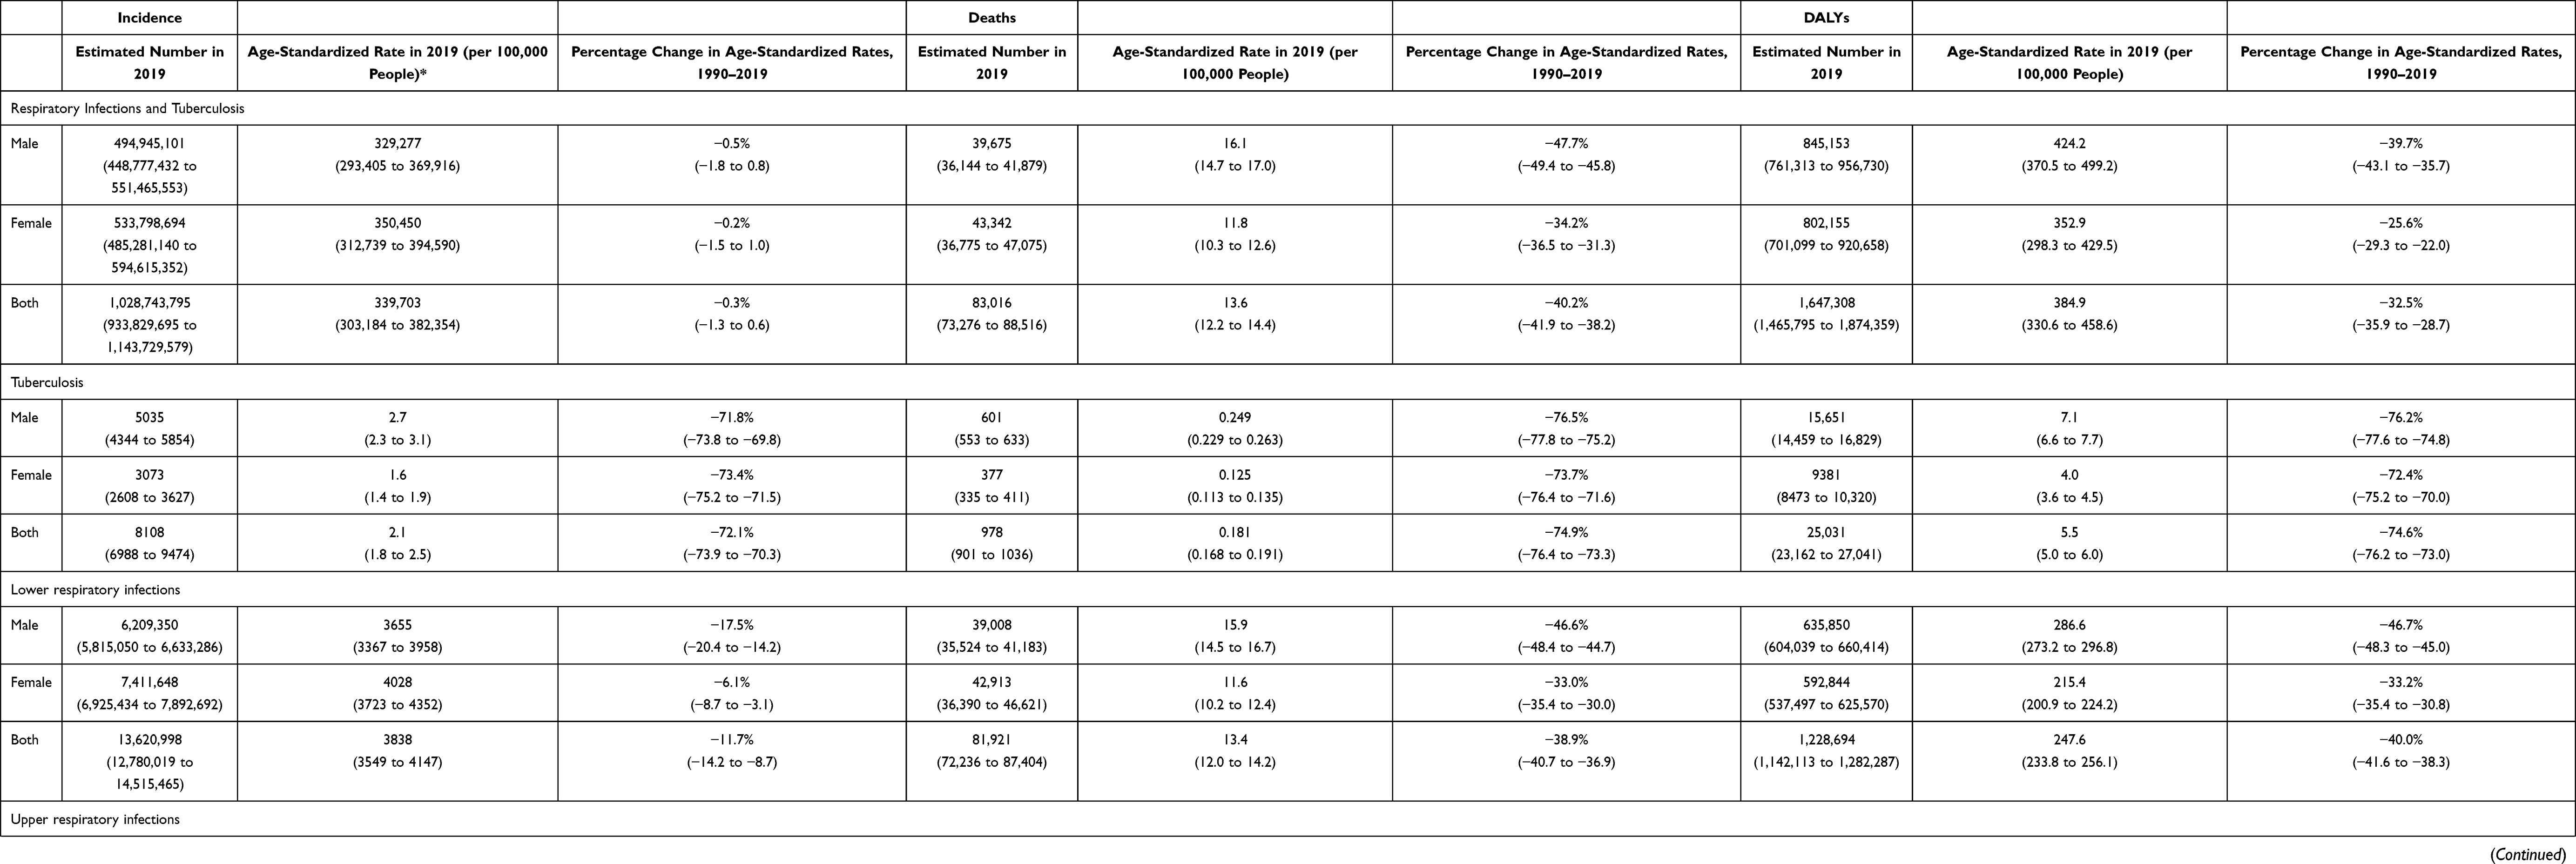 |
Table 1 Incident Cases, Deaths and DALYs for Selected Respiratory Infections and Tuberculosis and Percentage Change of Age-Standardized Rates by Sex in United States, 1990–2019 |
The total age-standardized death rate of RIT in 2019 was 13.6 (95% CI 12.2 to 14.4) per 100,000 people, and lower respiratory infection constituted the highest proportion of RIT age-standardized death rate, which was 13.4 (95% CI 12.0 to 14.2) per 100,000 people, followed by tuberculosis [978 (95% CI 901 to 1036) per 100,000 people]. From 1990 to 2019, the RIT age-standardized death rate decreased notably (−40.2%). Compared to about 70% decrease in age-standardized death rate for upper respiratory infection, tuberculosis and otitis media, the decrease tendency was not that remarkable for lower respiratory infection (−38.9%).
The age-standardized DALY rate in 2019 and its changes from 1990 to 2019 for RIT were 384.9 (95% CI 330.6 to 458.6) per 100,000 people and −32.5%, respectively. Also, among RIT causes, lower respiratory infection had the highest age-standardized DALY rate [247.6 (95% CI 233.8 to 256.1) per 100,000 people] in 2019, decreased by −40.0% during 1990–2019. Upper respiratory infection, tuberculosis and otitis media contributed 114.5 (95% CI 69.4 to 177.0), 5.5 (95% CI 5.0 to 6.0) and 17.4 (95% CI 10.0 to 28.5) per 100,000 people, decreased by −1.9%, −74.6% and −12.3%, respectively.
RIT Burden by Gender in the US
Gender discrepancy existed in the burden of RIT (Table 1). The total RIT age-standardized incidence rate in 2019 was 329,277 (95% CI 293,405 to 369,916) per 100,000 people for males, and a bit higher for females [350,450 (95% CI 312,739 to 394,590)], but it showed a converse result in tuberculosis, which was 2.7 (95% CI 2.3 to 3.1) per 100,000 people for males and 1.6 (95% CI 1.4 to 1.9) for females. And our results showed that there was a slight decrease in RIT age-standardized incidence change both for males and females (−0.5% and −0.2%, respectively). Despite a higher RIT age-standardized incidence rate in females, RIT age-standardized death rate was lower in females [11.8 (95% CI 10.3 to 12.6) per 100,000 people] than in males [16.1 (95% CI 14.7 to 17.0) per 100,000 people], and the same pattern was found for each individual RIT cause, especially tuberculosis (males 0.249 vs females 0.125 per 100,000 people).
Concerning changes in age-standardized death rate, the decrease was more notable in males than females (−47.7% vs −34.2%). The pattern of age-standardized DALY rate by gender for RIT was analogous to the death rate, which was 424.2 (95% CI 370.5 to 499.2) per 100,000 people for males and 352.9 (95% CI 298.3 to 429.5) for females, and its decrease was higher in males (−39.7%) than in females (−25.6%).
RIT Burden by Age Group
The incidence rate of RIT varied widely by age group in 2019 (Figure 1A). As for upper respiratory infection, the largest proportion of RIT incidence, the incidence rate peaked in the age groups 0–5 years, and decreased with increasing age. However, the incidence of lower respiratory infection showed a U-shaped distribution so that the lowest age-standardized incidence rate turned up in age groups 15–29 years, then rose with age increasing. Otitis media mostly occurred in the age groups under 15, and diminished in other age groups. Tuberculosis presented a very low age-standardized incidence rate in all age groups, and an upward trend along with ages.
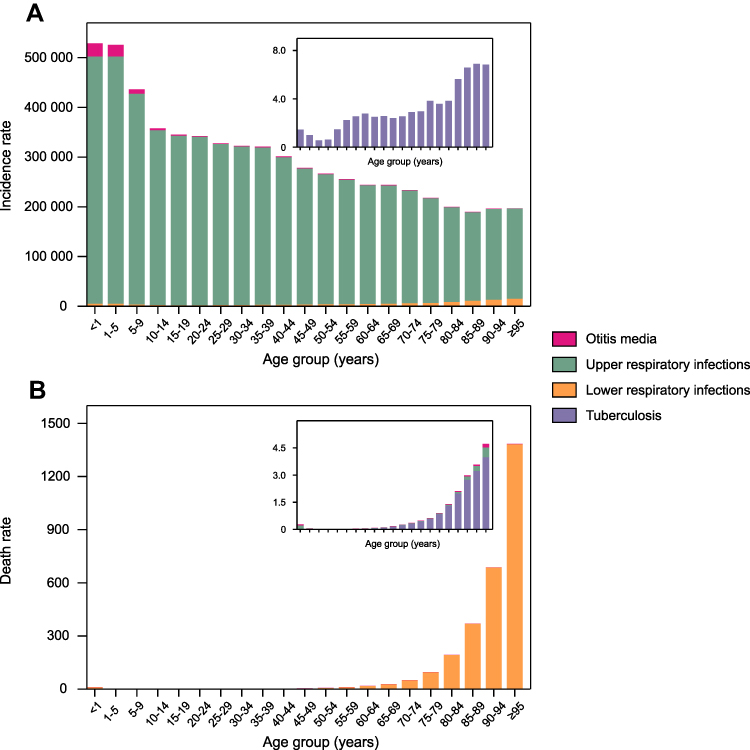 |
Figure 1 Age-standardized incidence (A) and death rate (B) of RIT by cause and age group, 2019. Abbreviation: RIT, respiratory infection and tuberculosis. |
On the mortality from RIT in 2019 (Figure 1B), it was indicated that the age-standardized death rate for RIT was bimodal, with the highest value among patients aged >95 years, and a lower one in children aged <1 year. The distribution of tuberculosis, upper respiratory infection and otitis media was also very similar.
RIT Burden by Regions in the US
From the cartography of RIT in the US, it was shown that RIT burden varied across the US states in 2019 (Figure 2 and Supplement Table S2). As shown in Figure 2A, the age-standardized incidence was highest in the East South Central [eg, Kentucky, 342,806 (95% CI 306,557 to 388,756) per 100,000 people; Tennessee, 341,642 (95% CI 303,873 to 385,227); and Alabama, 341,544 (95% CI 304,133 to 384,801), etc.], and these states also ranked ahead in lower respiratory infection and otitis media (Supplement Table S2). The age-standardized incidence was lower in the Pacific area [eg, Alaska 335,970 (95% CI 298,717 to 380,034)] and Mountain area [eg, Montana, 336,085 (95% CI 300,216 to 379,561)]. Concerning the change of RIT incidence (Figure 2C), this presented a downward tendency in most states, but the situation even deteriorated in some states of East South Central, for instance, Tennessee (0.2%), Mississippi (0.2%) and Alabama (0.1%).
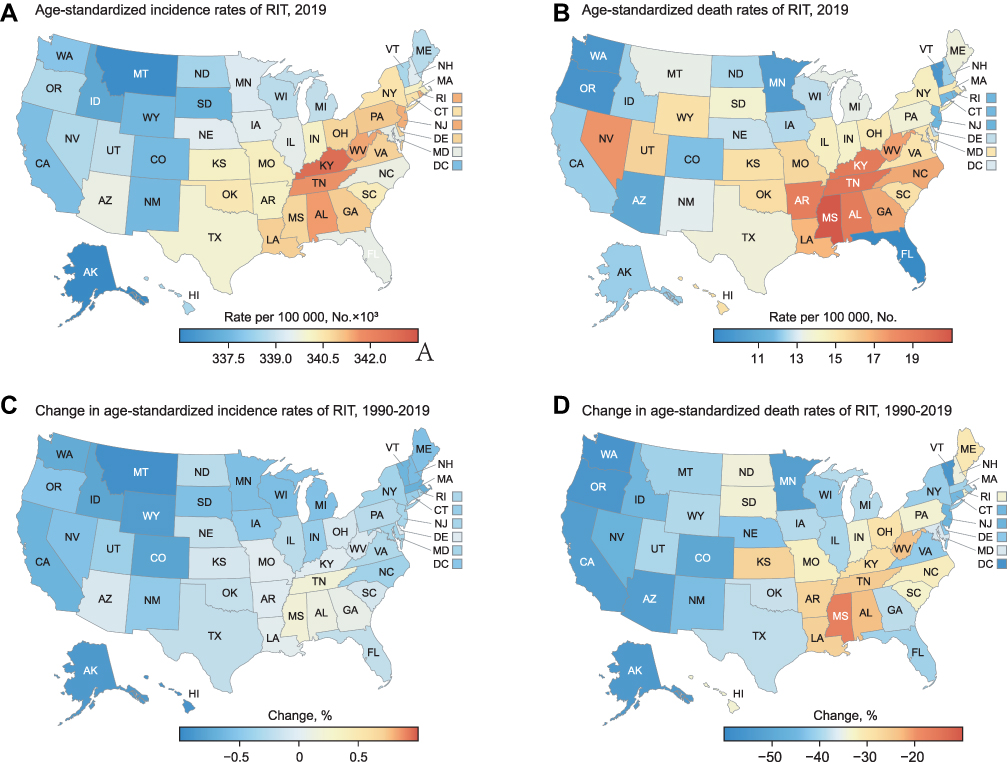 |
Figure 2 RIT burden for each state in the US. (A) Age-standardized incidence rate of RIT in 2019. (B) Age-standardized death rate of RIT in 2019. (C) Change in age-standardized incidence rates of RIT, 1990–2019. (D) Change in age-standardized death rates of RIT, 1990–2019. Abbreviation: RIT, respiratory infection and tuberculosis. |
As indicated in Figure 2B and Supplement Table S2, the mortality burden of RIT was also heavy in East South Central: for instance, the highest RIT age-standardized death rate was recorded in Mississippi [20.8 (95% CI 17.7 to 24.3) per 100,000 people], followed by Tennessee [19.5 (95% CI 16.3 to 22.9)] and Kentucky [19.1 (95% CI 16.0 to 22.2)]. Meanwhile, in Florida, Oregon and Washington, the RIT age-standardized death rate was relatively low, at 8.7 (95% CI 7.3 to 10.2), 9.3 (95% CI 7.7 to 10.9) and 9.5 (95% CI 7.8 to 11.2) per 100,000 people, respectively. Generally, there was an obvious drop in age-standardized death rate of RIT in the US, but its decrease rate varied greatly across the country, from −17.1% in Mississippi, to −56.7% in District of Columbia (Figure 2D).
Collectively, the age-standardized death rate of RIT was in inverse proportion to SDI level in 2019 (Figure 3A and B), with a higher age-standardized death rate in states of lower SDI level. However, there were some other states that had much higher age-standardized death rates than expected based on SDI, such as Tennessee, Maryland, Nevada. Similarly, states with lower SDI level tended to have minor improvement in age-standardized death rate change, suggesting that prior interventions should be implemented in these states.
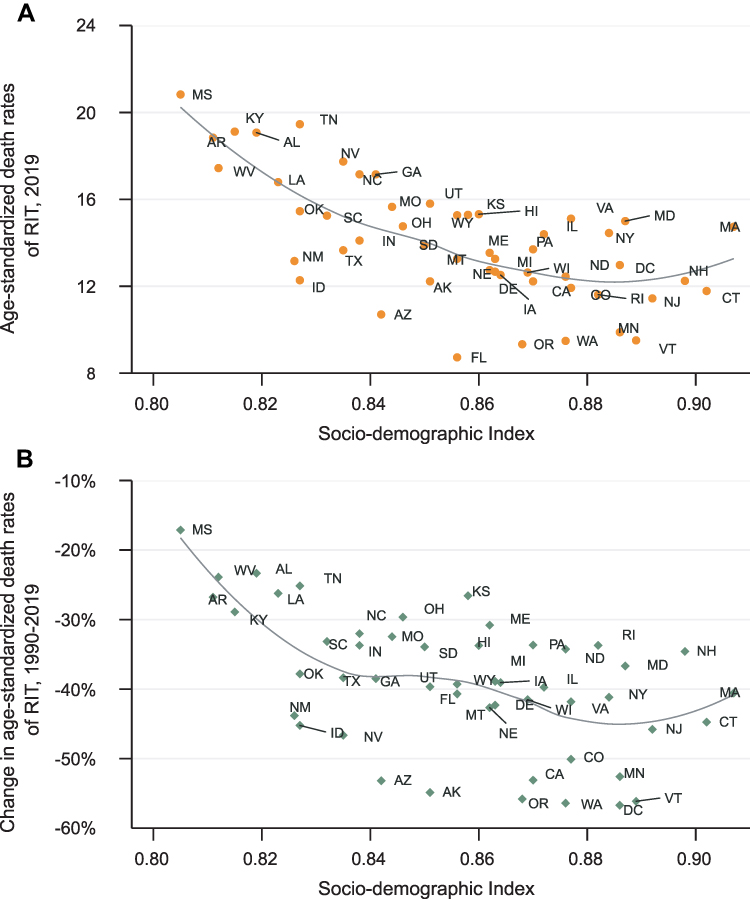 |
Figure 3 Age-standardized death rate of RIT across US states in 2019 (A) and its percentage change from 1990 to 2019 (B) by socio-demographic index. Abbreviation: RIT, Respiratory infection and tuberculosis. |
Risk Factors Attributable to RIT Mortality
In the US, age-standardized RIT deaths in 2019 were primarily attributable to smoking, followed by low temperature and alcohol use, and the attributable fractions were 17.7%, 15.3% and 6.9%, respectively (Supplement Table S3). However, the gender pattern of risk factors was quite different (Figure 4 and Supplement Table S3). Smoking and alcohol use accounted for 19.7% and 8.9% of RIT deaths in males, but much lower in female (15.3% and 4.8%, respectively). Also, death attributable to secondhand smoke in males was higher than in females (5.2% vs 4.4%).
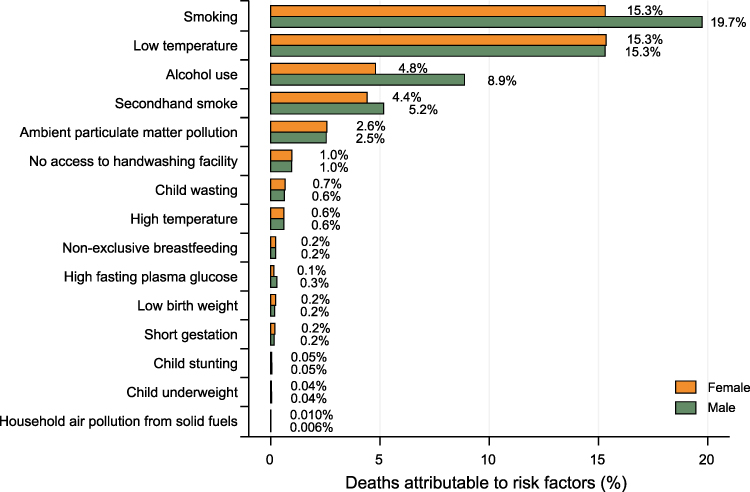 |
Figure 4 Percentage contributions of major risk factors to RIT age-standardized deaths by gender, 2019. Abbreviation: RIT, respiratory infection and tuberculosis. |
Discussion
In the present study, we thoroughly discussed the burden of RIT and its attributable risk factors in the US through evaluation by age, gender and state level. Our results indicated that although the age-standardized incidence of RIT remained almost unchanged from 1990 to 2019, there was a substantial improvement in age-standardized death (−40.2%) and DALY (−32.5%) rate in the US. Meanwhile, our work revealed that RIT burden varied widely among age groups, genders and states. This assessment could provide detailed information and evidence for the US health policy makers to focus on critical issues, reduce modifiable risk factors and improve health care quality of RIT.
Upper respiratory infection accounted for the majority proportion of RIT age-standardized incidence, and, due to common susceptibility and easy transmission of numerous pathogens like rhinovirus, coronavirus, etc., it is difficult to prevent upper respiratory infection,10 which resulted in unchanged RIT age-standardized incidence, whereas a notable decrease was observed in another three RIT causes, especially tuberculosis. According to CDC, the incidence of tuberculosis dropped from 10.3 to 2.7 per 100,000, and the decline was owing to the establishment of the Advisory Committee for the Elimination of Tuberculosis and the subsequent strategies such as widespread screening, adequate treatment and implementation of new technologies for diagnosis, treatment and prevention.4,11 But since 80% of existing tuberculosis cases were reactivation of latent tuberculosis acquired in the past and most from immigrants, tuberculosis still remained a persistent low-level epidemic.4 In addition, compared to upper respiratory infection and otitis media, tuberculosis also accounted for a relatively high age-standardized death rate of RIT.
Lower respiratory infection ranked the first in both mortality and morbidity of RIT causes. Despite improvements in prognosis with advances of health care and the increased access to antibiotics, lower respiratory infection still brought out heavy health burden in the US. In 2016, lower respiratory infection, as the 7th leading cause of death and 18th leading cause of DALYs, claimed about 95,992 lives, and cost $32.2 billion.5,12,13 This severe challenge was partly due to the spread of antibiotic resistance,5 the bottleneck of novel antimicrobials in recent years,14 clusters of vaccine refusal15 and the increasing number of immunocompromised and aging groups.2 It is crucial to improve the quality of health care and reduce related risk factors throughout the US to improve health outcomes of lower respiratory infection.
Our results indicated that most age-standardized death from RIT occurred in those aged >70 years, and elderly people were much more susceptible and vulnerable to respiratory infection. Many of the global initiatives about lower respiratory infection were focused on children younger than 5 years, but globally the mortality rates have remained consistently high in the elderly since 1990; meanwhile, aging of populations prompts urgency to protect the elderly.5 In addition, we found that the death rate from tuberculosis in the young and middle-aged should not be ignored because of a high incidence rate in these populations.
A distinct gender difference was found in that males had a lower RIT age-standardized incidence rate (except tuberculosis), but severer outcomes as a higher age-standardized death and DALY rate, which accorded with many previous studies concerning respiratory infection disease.16 For instance, the ratio of male to female was 1:1.27 in a US nationwide population-based acute respiratory infection study involving 9,763,710 outpatients,17 but the male-to-female ratio of tuberculosis was 1.88:1 in 1999.18 Moreover, the hazard ratio of mortality for males was 1.33 in active tuberculosis19 and 1.59 in COVID-19.20 The reasons for this disparity might be due to different hormone influence or inflammatory response; other important factors involved were environmental, behavioral and metabolic risk factors, which predominated in males.5,9,16 Smoking had been proven to be associated with increased risk and severity of acute respiratory infection and tuberculosis.21–23 It was estimated that 26.2% of males and 15.7% of females consumed tobacco products in 2019,24 and, in 2013, 27.1% of male and 23.6% of female non-smokers were exposed to secondhand smoke by the evidence of serum cotinine levels 0.05–10 ng/mL.25 Similarly, alcohol use including excessive and binge drinking was much heavier in males than in females, leading to a worse respiratory infection and tuberculosis outcome in males.26,27 There were many other confounding factors contributing different weight in the development of RIT. For instance, females have a smaller respiratory tract, and they may seek health care more frequently for mild diseases, such as upper respiratory infection, which might explain the higher prevalence of respiratory infections in females.16
Through analysis by subnation, some states in the East South Central area, like Alabama, Mississippi, Tennessee, Kentucky, were identified as the hotspots of RIT and had not only the highest age-standardized incidence and death rates, but also minimal improvement in RIT burden. Persistent hotspots suggested the need for greater resources and adaptive policy interventions in these states. The reasons behind RIT burden disparities within the US were complex, for instance, environmental, demographic, behavioral, socio-economic factors.7 Among these factors, the socio-economic factor was most substantial, and it was reported that the mortality rate of lower respiratory infection/tuberculosis was in inverse proportion to the SDI level of each region.5,7,28 Our results also spotlighted the role of SDI in RIT burden in the US. For instance, people living below the poverty level in the Louisville area were more likely to have had a respiratory infection (RR=1.65), and COVID-19 patients from low-income areas had a higher in-hospital death rate (HR=1.19), because of inadequate accessibility and affordability of health service, and poor housing conditions.29,30 In addition, according to CDC data about behavioral factors involved, differences in smoking and alcohol use in each state might be also associated with the RIT burden disparities.24,26
There were several limitations in our study. Firstly, although environmental, behavioral, metabolic factors were included into the RIT burden analysis, some important factors affecting RIT burden – like ethnicity and demographic, urban and rural, cultural and immigration background – could not be assessed through the GBD study. Secondly, since clinical characteristics and exposure of risk factors were not included in the GBD database, our results failed to reveal the distribution of RIT clinical characteristics and the predisposed factors in development of RIT. Thirdly, seasonal variations of upper/lower respiratory infection also could not be revealed by the annual reports of GBD. Fourthly, respiratory infection is very common in chronic diseases like COPD, heart failure and diabetes, and extra-pulmonary tuberculosis and pulmonary tuberculosis often coexisted in one patient; therefore, this may affect the precise quantitative assessment of RIT as a single contributor to health loss and death.
Conclusion
In summary, our study revealed that RIT remained a major cause of health burden in the US, but its burden had seen a substantial decline across the country. We found variations of RIT burden across states, ages and genders, and we identified smoking as the most important risk affecting RIT, suggesting adaptive health policy to be implemented toward high-risk populations, RIT hotspots and related risk factors.
Abbreviations
RIT, respiratory infection and tuberculosis; DALYs, disability-adjusted life years; CI, confidence intervals; SDI, socio-demographic index.
Data Sharing Statement
GBD Data are available on the website (http://ghdx.healthdata.org/gbd-2019/data-input-sources). All the data and the methodology of GBD are publicly available.
Ethics Approval and Informed Consent
This study was approved by the University of Washington Institutional Review Board, and the informed consent was waived because no identifiable data were used.
Acknowledgments
We thank all members of the Institute for Health Metrics and Evaluation (IHME), University of Washington, and all collaborators involved in GBD 2019 study.
Funding
The GBD (Global Burden of Disease) 2017 study was funded by the Bill and Melinda Gates Foundation. The present study was funded by the National Natural Science Foundation of China (No. 81974090).
Disclosure
The authors report no conflicts of interest in this work.
References
1. Ärnlöv J; Collaborators GBDD. Global age-sex-specific fertility, mortality, healthy life expectancy (HALE), and population estimates in 204 countries and territories, 1950–2019: a comprehensive demographic analysis for the Global Burden of Disease Study 2019. Lancet. 2020;396(10258):1160–1203.
2. El Bcheraoui C, Mokdad AH, Dwyer-Lindgren L, et al. Trends and patterns of differences in infectious disease mortality among US counties, 1980–2014. JAMA. 2018;319(12):1248–1260. doi:10.1001/jama.2018.2089
3. Kochanek KD, Xu J, Arias E. Mortality in the United States, 2019. NCHS Data Brief; 2019:395.
4. Schwartz NG, Price SF, Pratt RH, Langer AJ. Tuberculosis - United States, 2019. MMWR Morb Mortal Wkly Rep. 2020;69(11):286–289. doi:10.15585/mmwr.mm6911a3
5. Bassat Orellana Q, García-Basteiro AL; GBD 2016 Lower Respiratory Infections Collaborators. Estimates of the global, regional, and national morbidity, mortality, and aetiologies of lower respiratory infections in 195 countries, 1990–2016: a systematic analysis for the Global Burden of Disease Study 2016. Lancet Infect Dis. 2018;18(11):1191–1210. doi:10.1016/S1473-3099(18)30310-4
6. Kraemer MUG, Hay SI, Pigott DM, Smith DL, Wint GRW, Golding N. Progress and challenges in infectious disease cartography. Trends Parasitol. 2016;32(1):19–29. doi:10.1016/j.pt.2015.09.006
7. Mollalo A, Vahedi B, Bhattarai S, Hopkins LC, Banik S, Vahedi B. Predicting the hotspots of age-adjusted mortality rates of lower respiratory infection across the continental United States: integration of GIS, spatial statistics and machine learning algorithms. Int J Med Inform. 2020;142:104248. doi:10.1016/j.ijmedinf.2020.104248
8. Vos T, Lim SS, Abbafati C, et al. Global burden of 369 diseases and injuries in 204 countries and territories, 1990–2019: a systematic analysis for the Global Burden of Disease Study 2019. Lancet. 2020;396(10258):1204–1222.
9. Collaborators GBDRF. Global burden of 87 risk factors in 204 countries and territories, 1990–2019: a systematic analysis for the Global Burden of Disease Study 2019. Lancet. 2020;396(10258):1223–1249.
10. Unger SA, Bogaert D. The respiratory microbiome and respiratory infections. J Infect. 2017;74(Suppl 1):S84–S88. doi:10.1016/S0163-4453(17)30196-2
11. Dowdle WR. A strategic plan for the elimination of tuberculosis in the United States.. MMWR Suppl. 1989;38(3):1–25.
12. Mokdad AH, Ballestros K, Echko M, et al. The state of US health, 1990–2016: burden of diseases, injuries, and risk factors among US states. JAMA. 2018;319(14):1444–1472. doi:10.1001/jama.2018.0158
13. Dieleman JL, Cao J, Chapin A, et al. US health care spending by payer and health condition, 1996–2016. JAMA. 2020;323(9):863–884. doi:10.1001/jama.2020.0734
14. Ruopp M, Chiswell K, Thaden JT, Merchant K, Tsalik EL. Respiratory tract infection clinical trials from 2007 to 2012. A systematic review of ClinicalTrials.gov. Ann Am Thorac Soc. 2015;12(12):1852–1863. doi:10.1513/AnnalsATS.201505-291OC
15. Omer SB, Salmon DA, Orenstein WA, deHart MP, Halsey N. Vaccine refusal, mandatory immunization, and the risks of vaccine-preventable diseases. N Engl J Med. 2009;360(19):1981–1988. doi:10.1056/NEJMsa0806477
16. Falagas ME, Mourtzoukou EG, Vardakas KZ. Sex differences in the incidence and severity of respiratory tract infections. Respir Med. 2007;101(9):1845–1863. doi:10.1016/j.rmed.2007.04.011
17. Lin KJ, Dvorin E, Kesselheim AS. Prescribing systemic steroids for acute respiratory tract infections in United States outpatient settings: a nationwide population-based cohort study. PLoS Med. 2020;17(3):e1003058. doi:10.1371/journal.pmed.1003058
18. Khan K, Wang J, Hu W, Bierman A, Li Y, Gardam M. Tuberculosis infection in the United States: national trends over three decades. Am J Respir Crit Care Med. 2008;177(4):455–460. doi:10.1164/rccm.200706-950OC
19. Lee-Rodriguez C, Wada PY, Hung YY, Skarbinski J. Association of mortality and years of potential life lost with active tuberculosis in the United States. JAMA Netw Open. 2020;3(9):e2014481. doi:10.1001/jamanetworkopen.2020.14481
20. Takahashi T, Ellingson MK, Wong P, et al. Sex differences in immune responses that underlie COVID-19 disease outcomes. Nature. 2020;588(7837):315–320. doi:10.1038/s41586-020-2700-3
21. Lin HH, Ezzati M, Murray M. Tobacco smoke, indoor air pollution and tuberculosis: a systematic review and meta-analysis. PLoS Med. 2007;4(1):e20. doi:10.1371/journal.pmed.0040020
22. Arcavi L, Benowitz NL. Cigarette smoking and infection. Arch Intern Med. 2004;164(20):2206–2216. doi:10.1001/archinte.164.20.2206
23. Baskaran V, Murray RL, Hunter A, Lim WS, McKeever TM. Effect of tobacco smoking on the risk of developing community acquired pneumonia: a systematic review and meta-analysis. PLoS One. 2019;14(7):e0220204. doi:10.1371/journal.pone.0220204
24. Cornelius ME, Wang TW, Jamal A, Loretan CG, Neff LJ. Tobacco product use among adults - United States, 2019. MMWR Morb Mortal Wkly Rep. 2020;69(46):1736–1742. doi:10.15585/mmwr.mm6946a4
25. Tsai J, Homa DM, Gentzke AS, et al. Exposure to secondhand smoke among nonsmokers - United States, 1988–2014. MMWR Morb Mortal Wkly Rep. 2018;67(48):1342–1346. doi:10.15585/mmwr.mm6748a3
26. Kanny D, Naimi TS, Liu Y, Brewer RD. Trends in total binge drinks per adult who reported binge drinking - United States, 2011–2017. MMWR Morb Mortal Wkly Rep. 2020;69(2):30–34. doi:10.15585/mmwr.mm6902a2
27. Esser MB, Sherk A, Liu Y, et al. Deaths and years of potential life lost from excessive alcohol use - United States, 2011–2015. MMWR Morb Mortal Wkly Rep. 2020;69(30):981–987. doi:10.15585/mmwr.mm6930a1
28. Kyu HH, Maddison ER, Henry NJ, et al. The global burden of tuberculosis: results from the Global Burden of Disease Study 2015. Lancet Infect Dis. 2018;18(3):261–284. doi:10.1016/S1473-3099(17)30703-X
29. Ramirez JA, Wiemken TL, Peyrani P, et al. Adults hospitalized with pneumonia in the United States: incidence, epidemiology, and mortality. Clin Infect Dis. 2017;65(11):1806–1812. doi:10.1093/cid/cix647
30. Price-Haywood EG, Burton J, Fort D, Seoane L. Hospitalization and mortality among black patients and white patients with Covid-19. N Engl J Med. 2020;382(26):2534–2543. doi:10.1056/NEJMsa2011686
 © 2021 The Author(s). This work is published and licensed by Dove Medical Press Limited. The full terms of this license are available at https://www.dovepress.com/terms.php and incorporate the Creative Commons Attribution - Non Commercial (unported, v3.0) License.
By accessing the work you hereby accept the Terms. Non-commercial uses of the work are permitted without any further permission from Dove Medical Press Limited, provided the work is properly attributed. For permission for commercial use of this work, please see paragraphs 4.2 and 5 of our Terms.
© 2021 The Author(s). This work is published and licensed by Dove Medical Press Limited. The full terms of this license are available at https://www.dovepress.com/terms.php and incorporate the Creative Commons Attribution - Non Commercial (unported, v3.0) License.
By accessing the work you hereby accept the Terms. Non-commercial uses of the work are permitted without any further permission from Dove Medical Press Limited, provided the work is properly attributed. For permission for commercial use of this work, please see paragraphs 4.2 and 5 of our Terms.