")
Back to Journals » Clinical Ophthalmology » Volume 14
Burden of Illness in Geographic Atrophy: A Study of Vision-Related Quality of Life and Health Care Resource Use
Authors Patel PJ , Ziemssen F , Ng E, Muthutantri A, Silverman D , Tschosik EA, Cantrell RA
Received 7 August 2019
Accepted for publication 25 November 2019
Published 8 January 2020 Volume 2020:14 Pages 15—28
DOI https://doi.org/10.2147/OPTH.S226425
Checked for plagiarism Yes
Review by Single anonymous peer review
Peer reviewer comments 3
Editor who approved publication: Dr Scott Fraser
Praveen J Patel,1 Focke Ziemssen,2 Eugene Ng,3 Anushini Muthutantri,4 David Silverman,5 Elizabeth A Tschosik,6 Ronald A Cantrell6
1NIHR Biomedical Research Centre at Moorfields Eye Hospital NHS Foundation Trust, and University College London Institute of Ophthalmology, London, UK; 2University of Tuebingen, Tuebingen, Germany; 3Institute of Eye Surgery, UPMC Whitfield and Waterford Institute of Technology, Waterford, Ireland; 4IQVIA, London, UK; 5Roche Products Limited, Welwyn Garden City, Hertfordshire, UK; 6Genentech, Inc., A Member of the Roche Group, South San Francisco, CA, USA
Correspondence: David Silverman
Ophthalmology, Roche Products Limited, 6 Falcon Way, Shire Park, Welwyn Garden City AL7 1TW, UK
Tel +44 1707 36 6394
Email [email protected]
Purpose: To gain comprehensive information on the burden of illness due to geographic atrophy (GA).
Methods: This cross-sectional study with a retrospective chart review involved patients aged ≥70 years with physician-confirmed bilateral symptomatic GA due to age-related macular degeneration (GA group), as well as patients of similar age with no ophthalmic condition that in the opinion of the investigator affected visual function (non-GA group). Data relating to patients’ current disease status and sociodemographics were self-reported on patient questionnaires at study entry and extracted from patient charts. Historical data on health care resource utilization (HCRU) were also collected via patient questionnaires and retrospective chart review (GA group only). Overall vision-related functioning and quality of life (QoL) were compared between the GA and non-GA groups using the National Eye Institute Visual Function Questionnaire-25 (NEI-VFQ-25) composite and subscales, and change in vision over the past year was assessed using the Global Rating of Change Scale.
Results: Vision-related functioning and QoL were poorer in patients with vs without GA (n=137 vs 52), as demonstrated by significantly lower NEI-VFQ-25 composite score (mean, 53.1 vs 84.5 points, respectively; P<0.001), as well as lower subscale scores for near activities, distance activities, dependency, driving, social functioning, mental health, role difficulties, color vision, and peripheral vision. Substantially more patients with GA than without GA reported worsening in vision over the past year (82% vs 25%, respectively; odds ratio, 13.55; P<0.001). In the GA group, associated mean annual costs for direct ophthalmological resource use per patient amounted to €1772 (mostly for tests/procedures), and for indirect ophthalmological resource use, €410 (mostly for general practitioner visits).
Conclusion: Patients with GA experience a poorer level of vision-related function and QoL than their peers, especially in relation to driving. GA is also associated with notable HCRU/associated costs, mostly direct costs attributed to diagnostic tests/procedures.
Keywords: burden of illness, geographic atrophy, vision-related quality of life, health care resource utilization, visual function, health care costs
Introduction
Geographic atrophy (GA) is a progressive, advanced form of age-related macular degeneration (AMD), and is characterized by irreversible atrophy of the retinal pigment epithelium photoreceptors and choriocapillaris,1,2 and is therefore associated with significant, irreversible loss of vision.3 GA is estimated to affect ~5 million people worldwide,4 and to account for approximately one-quarter of cases of legal blindness in the United Kingdom,1,5 and 20% of cases in North America.2 GA has also been associated with more cases of legal blindness (severe sight loss/registered blind) in England and Wales than other forms of AMD.5 The incidence of GA increases exponentially with age, and as the population ages, the prevalence of the disease is expected to rise.4,6
GA comprises a spectrum of heterogeneous, phenotypically distinct forms, in which visual function is determined by the remaining area in relation to the fovea.7–9 Due to the frequent symmetry and bilaterality, GA can pose a significant burden for affected individuals.1,10 Even when distance visual acuity (VA) is unaffected, individuals with GA can experience difficulties reading and seeing in low-light conditions.10,11 Data from a UK electronic medical record (EMR) study suggest that at the time of diagnosis, a high proportion (71%) of individuals already have visual impairment that is below the commonly used driving standard threshold (ie, ≤70 letters or Snellen 6/12 [20/40]).12 These data illustrate the heavy burden placed on individuals with GA in terms of loss of mobility and independence. There are currently no approved interventions to prevent, reduce, or halt the progression of GA, and thus GA represents a significant unmet medical need.
Advanced AMD has been estimated to cause a 63% decrease in the average patient’s quality of life (QoL), which is comparable to the effect of end-stage prostate cancer or catastrophic stroke on QoL.13 However, there is sparse knowledge of the impact of GA on patients’ QoL, as well as on society and health care resources, particularly indirect costs.14,15 While it is accepted that GA has a negative impact on patients’ QoL, society, and the health care system,12,14 there is limited published evidence specific to GA to confirm this.16,17 This may be due in part to the fact that GA was only granted a code in the US-specific International Classification of Diseases, 10th Revision, Clinical Modification system in 2017, and in the International Classification of Diseases, 11th Revision system used in the rest of the world in December 2018.18,19
We, therefore, conducted a study to gain comprehensive information on the burden of illness due to GA, including vision-related functioning and QoL, as well as economic implications. The primary objective was to compare the overall vision-related functioning and QoL in the GA group with that in a non-GA group of similar age using the National Eye Institute Visual Function Questionnaire-25 (NEI-VFQ-25), which has been validated for use in patients with GA.20 Secondary objectives were (1) to assess the change in vision over the past year using the Global Rating of Change Scale (GA and non-GA groups), and (2) to assess health care resource utilization (HCRU) up to 24 months before the study visit and any associated costs (GA group only).
Materials and Methods
Study Design and Patients
Within this study conducted in the United Kingdom, Germany, Ireland, and Canada, patients with physician-confirmed diagnosis of GA secondary to AMD were recruited and interviewed prospectively. The study also included a cohort of patients who were of similar age but did not have GA (non-GA group).
Before data collection, eligible patients were invited to participate in the study during their routine visit by the treating physician or research nurse. Patients included gave written informed consent for their data to be used in this study (including questionnaires). Patient data were anonymized at study entry, with patient identification documentation maintained at each site (only accessible to the patient’s clinical team at the hospital). The study was approved by the institutional review board or ethics committee at each participating site (Table S1), and conducted according to the provisions of the Declaration of Helsinki,21 the Guidelines for Good Pharmacoepidemiology Practices Guidelines published by the International Society of Pharmacoepidemiology,22 and the laws and regulations of the country in which the research was conducted.
Patients eligible for enrollment were aged ≥70 years. Patients eligible for inclusion in the GA group had physician-confirmed bilateral symptomatic GA due to AMD; those eligible for inclusion in the non-GA group had no ophthalmic condition that in the opinion of the investigator affected visual function (eg, early/intermediate AMD, dry eye, choroidal nevus, epiretinal membrane, history of cataract surgery). Key exclusion criteria for both groups included participation in an interventional study during the past 12 months, and history of choroidal neovascularization, diabetic macular edema, and/or retinal vein occlusion. The full list of inclusion/exclusion criteria can be found in Table S2.
All patients were interviewed during the study inclusion visit to provide data related to their vision-related functioning and QoL, and additional clinical and patient-reported outcome measure data were also collected to provide a snapshot of the patient’s current disease status and burden of illness. Patients in the GA group were also asked about historical clinical data and HCRU; information on medical and non-medical resource utilization were also sourced from a retrospective chart review of patient data up to a maximum period of 24 months. The list of variables captured for each group are provided in Tables S3–S4.
Assessments and Outcomes
The primary outcome was assessed using vision-related functioning and QoL information collected via the NEI-VFQ-25 (Table S3).23 In this study, an additional six appendix items were included for the near activities and distance activities subscales, as previously used in an analysis of the lampalizumab Mahalo study.20 Other pre-specified outcome measures were change of vision in the past year, as assessed using the Global Rating of Change Scale in both the GA and non-GA groups,24 and, for the GA group only, HCRU, and any associated costs.
Relevant patient sociodemographic and clinical data, extracted from patient charts and self-reported on patient questionnaires conducted at study entry (Table S3), were recorded onto electronic case report forms. This included the recording of VA data as measured in the better- and worse-seeing eye of patients with GA, and in the non-GA group, during a standard-of-care visit ±14 days from date of study inclusion. In cases where both eyes had the same VA, the right eye was designated as the better-seeing eye and the left eye as the worse-seeing eye. GA lesion size estimated ±14 days from date of study inclusion by the physician was also recorded.
Resource use data extracted from the medical records of the GA group for up to 24 months before study inclusion and self-reported on patient questionnaires were categorized as direct ophthalmologic (eg, visits to eye clinic for GA or other ophthalmic conditions, specialists/nurses seen, tests/procedures, and treatments) and indirect (eg, general practitioner [GP]/hospital visits due to falls and other occurrences, anxiety-/depression-related costs; Table S4).
Statistical Methods
The target sample size was 140 patients with GA and 50 patients with non-GA conditions to allow the detection of a difference in NEI-VFQ-25 score of 13 points, with 80% power at the 5% level of significance. Anonymized data were analyzed for all patients meeting the inclusion/exclusion criteria, including those who withdrew from the study after completion of patient recruitment, using SAS® 9.4 software (SAS Institute, Cary, NC, USA) via SAS Enterprise Guide version 6.2.
The NEI-VFQ-25 composite score was compared between the GA and non-GA groups using a Wilcoxon rank-sum test with a significance level of P≤0.05. A parametric multivariate analysis, using an analysis of covariance model adjusted for age and sex, was also conducted. The interaction between group and covariate was tested, and as a result, living status was removed from the analysis of covariance model due to lack of statistical significance. The 95% CI was calculated for differences between groups for continuous variables. For the NEI-VFQ-25 subscales, comparisons between groups were made using the Wilcoxon rank-sum test, except for general health and general vision, which were assessed using a multivariate logistic model and a multinomial logistic model, respectively. The Global Rating of Change Scale between-group comparisons were performed using a multivariate logistic model, controlled for baseline covariates (age, sex), with group as a fixed effect. The patient-reported outcome and HCRU variables are shown in Tables S3 and S4.
Differences in sociodemographic characteristics between patient groups were assessed using Pearson chi-square test or Fisher’s exact test for categorical variables and Student’s t-test or Wilcoxon rank-sum test for continuous variables. All tests were two sided and a P-value of ≤0.05 was considered significant. Where relevant, 95% CIs were also calculated. Any missing and invalid observations were excluded from the denominators when calculating proportions.
HCRU was determined by the proportion of patients using a specific resource and the number of times a resource was used per patient. Costs related to health care services were calculated by multiplying the number of times patients used each health care service by the country-specific unit cost. For each patient, HCRU and costs were adjusted if the patient had <24 months of history (based on the date of first visit to the clinic). Adjustments were not made for costs of vision-related equipment, certain procedures (cataract surgery, Humphrey visual field test, laser capsulotomy, vitrectomy, retinal laser therapy, laser iridectomy, and trabeculectomy), or inpatient admissions, because these were typically one-off costs. Patients with <3 months of history were excluded from HCRU and cost analyses. The currency used to estimate costs was euros. The reference year for the unit cost was 2017, and the following 2017 average currency exchange rates were used: 1 British pound sterling = 1.1413 euros and 1 Canadian dollar = 0.6826 euros.
Results
During the data collection period (February 27, 2017 to November 14, 2017), 229 patients were enrolled in the study across 17 sites, and 189 were eligible for analyses. Of these, 137 (72.5%) patients were enrolled in the GA group and 52 (27.5%) patients into the non-GA group (Figure 1).
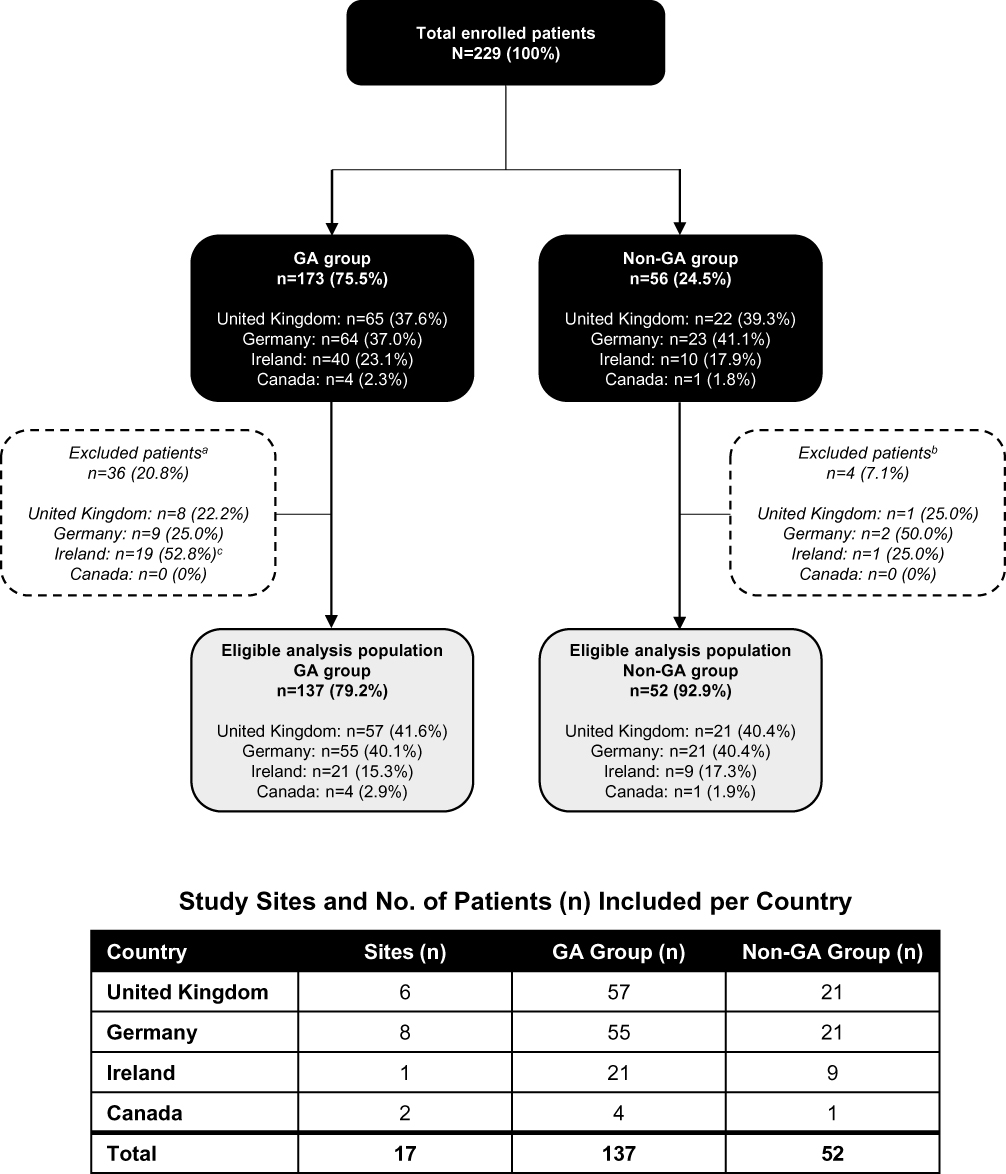 |
Figure 1 Flow diagram showing the study population enrolled in a cross-sectional study across 17 sites in the United Kingdom, Germany, Ireland, and Canada. Notes: aReasons for exclusion from analysis, GA group: non-bilateral physician-confirmed GA; age ≤70 years at study inclusion; no informed consent; history of CNV, DME, and/or RVO; protocol deviation. bReasons for exclusion from analysis, non-GA group: ophthalmic condition affecting visual function; no informed consent; history of CNV, DME, and/or RVO. cA site in Ireland leveraged electronic medical records to actively recall patients slightly earlier than their scheduled visit during the initial recruitment phase. Inclusion of these patients would have affected health care resource utilization results, so the protocol had to be clarified mid study, and a decision was made to exclude these patients from the analysis due to protocol deviation following this protocol change. Subsequent patients that were contributed by this site were recruited according to updated protocols (recruitment only during routine visits). Abbreviations: CNV, choroidal neovascularization; DME, diabetic macular edema; GA, geographic atrophy; RVO, retinal vein occlusion. |
Sociodemographic Characteristics: GA and Non-GA Groups
The sociodemographic characteristics of patients in the GA and non-GA groups are outlined in Table 1. Most patients in the GA and non-GA groups had similar sociodemographic characteristics (98% were Caucasian, 95% retired, and 64% female). However, the groups also showed some relevant differences. Patients with GA were slightly older than those with non-GA conditions (mean, 81.8 vs 78.3 years, respectively; P<0.001). The majority of patients were either married/in a domestic partnership or widowed, with a higher proportion of patients with GA being widowed than patients without GA (41.6% vs 25.0%, respectively). A higher proportion of patients with GA lived home alone than patients without GA (46.7% vs 25.0%, respectively). Only 2 patients (both with GA) lived in a nursing and/or residential home. Of patients with GA, 6.6% were current smokers, whereas there were no current smokers among the non-GA group.
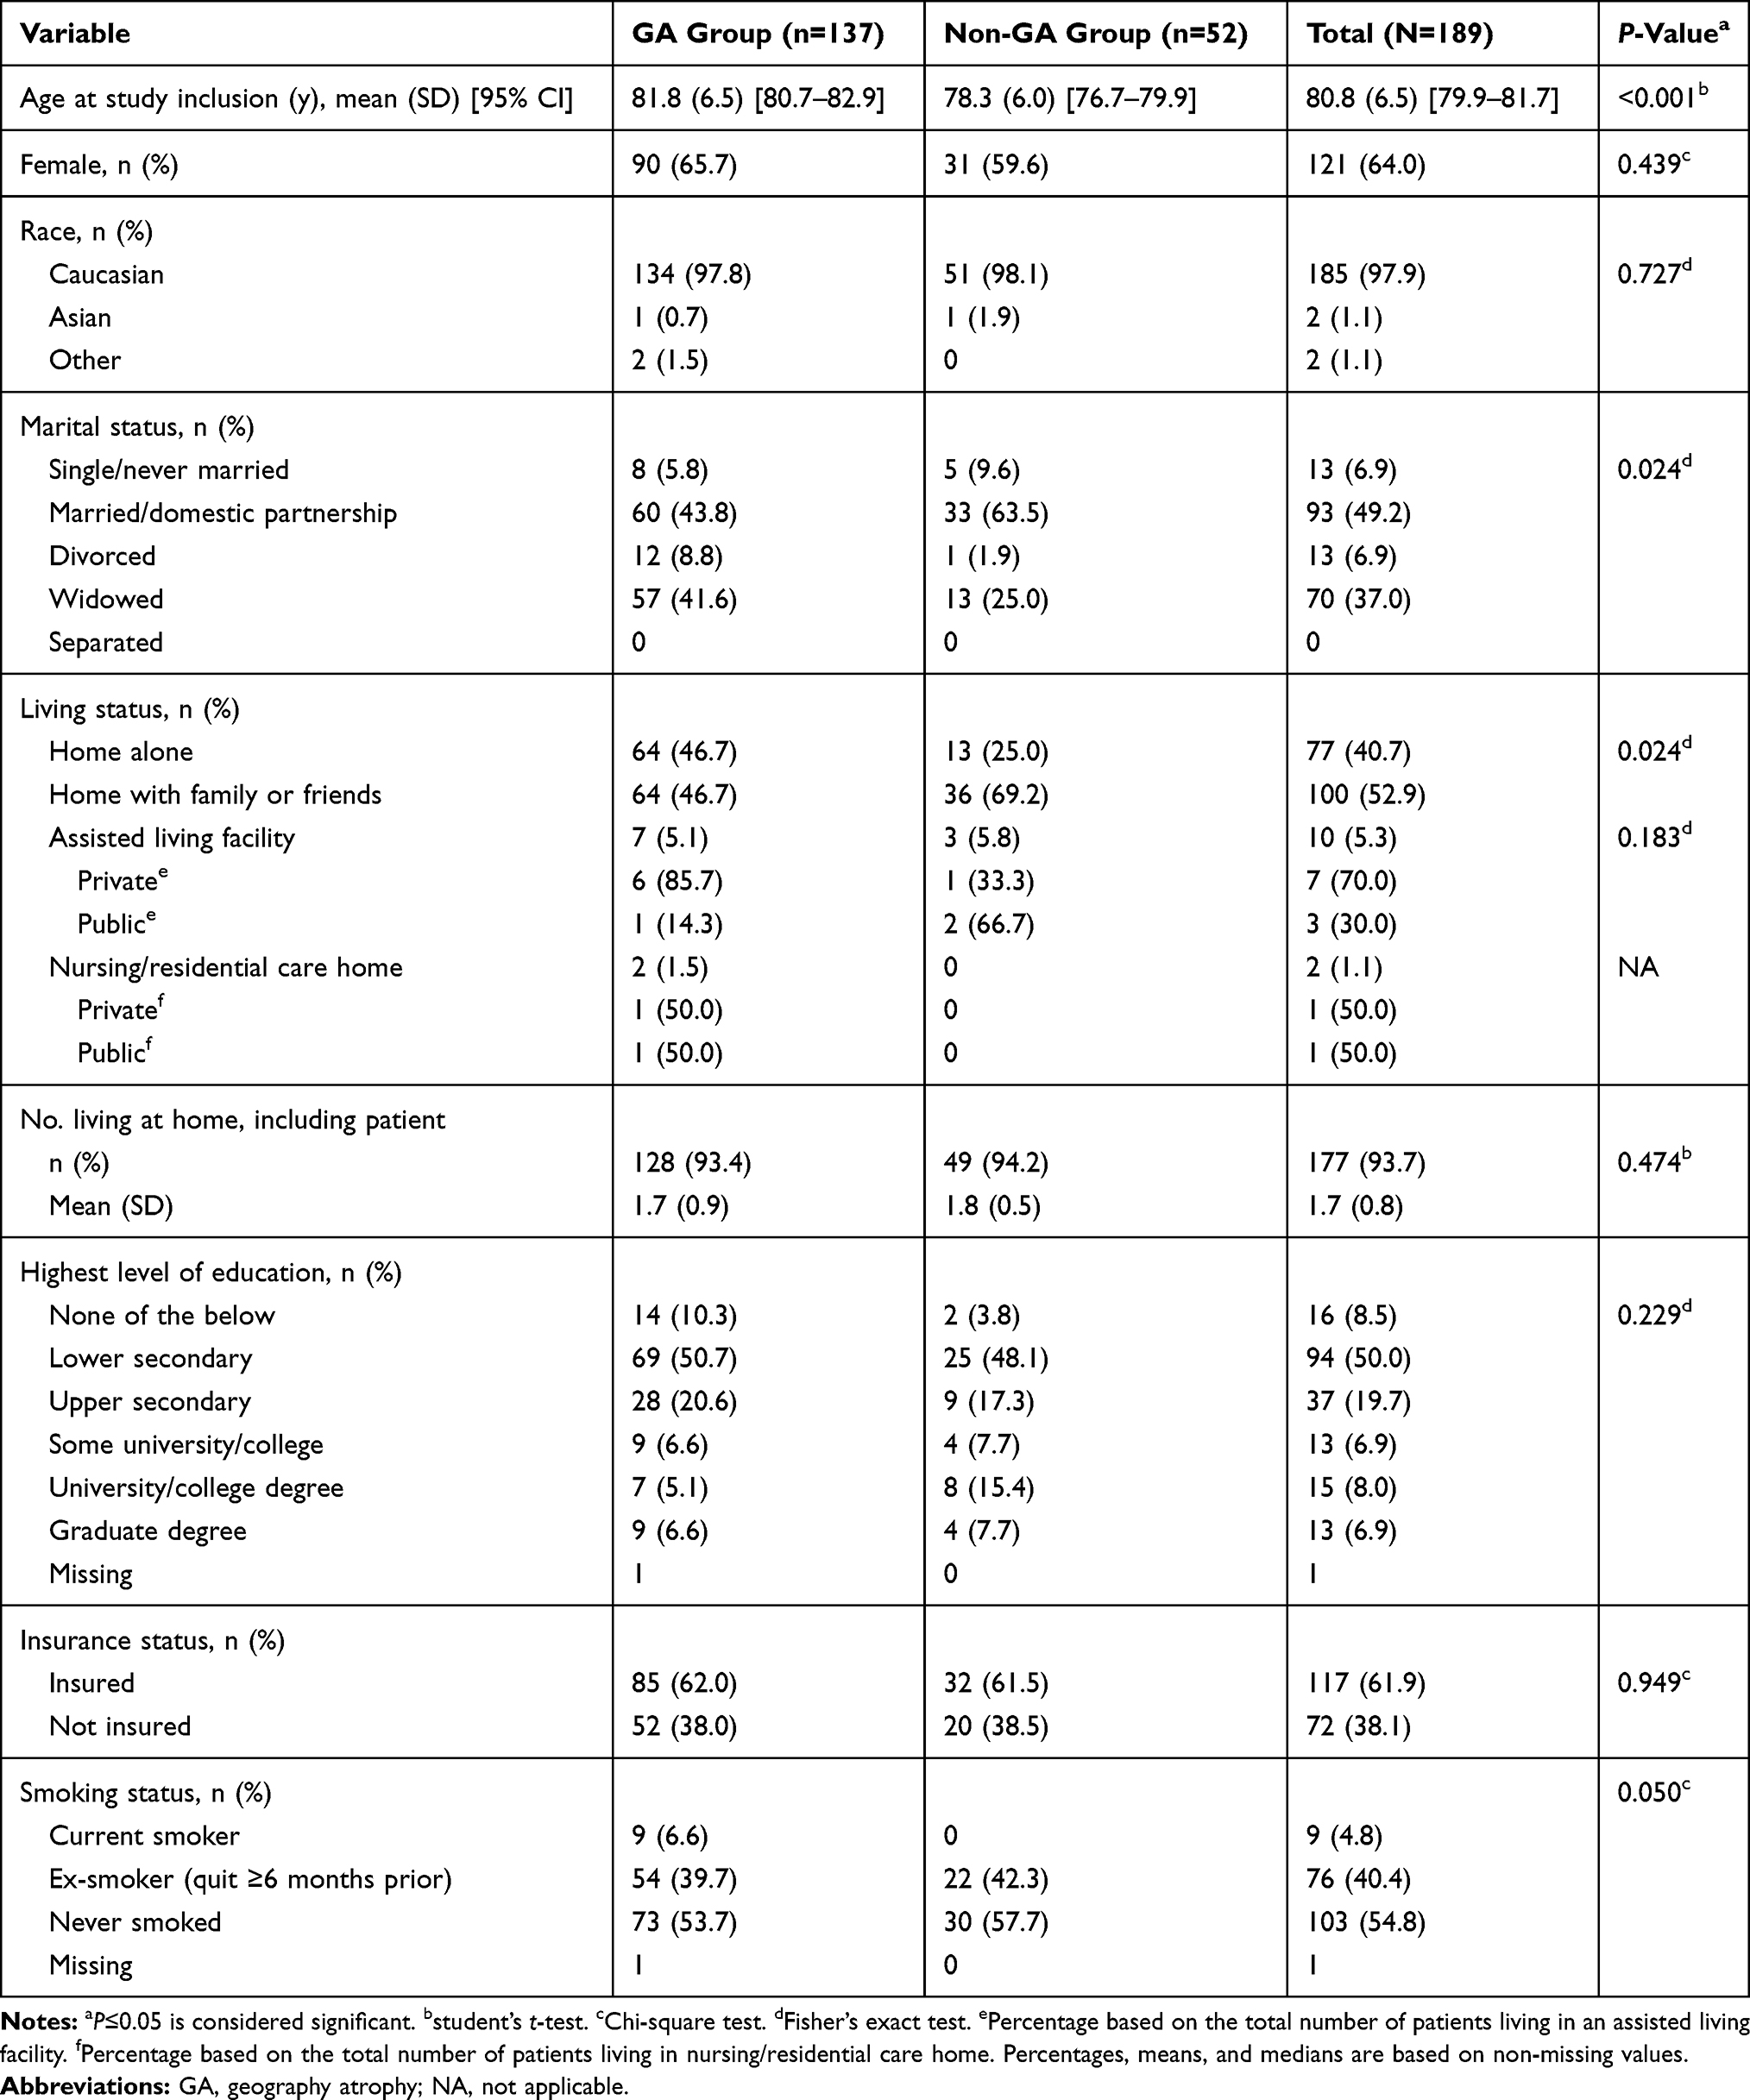 |
Table 1 Sociodemographic Characteristics of the GA and Non-GA Groups in a Cross-Sectional Study Conducted in 17 Sites in the United Kingdom, Germany, Ireland, and Canada |
Differences in Vision-Related Functioning and QoL Between the GA and Non-GA Groups
Patients with GA had poorer vision-related functioning and QoL than those without GA. Patients in the GA group had a significantly lower mean (SD) NEI-VFQ-25 composite score than those in the non-GA group (53.1 [19.05] vs 84.5 [6.55] points, respectively; P<0.001; Figure 2). The lower QoL observed in the GA group remained after adjusting the NEI-VFQ-25 composite score for age and sex (adjusted difference between groups, −28.82; P<0.001).
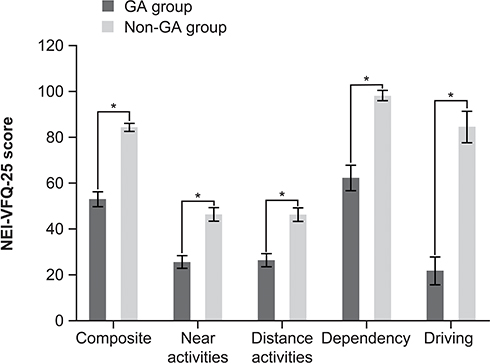 |
Figure 2 Mean (95% CI) NEI-VFQ-25 scores for the GA and non-GA groups in a cross-sectional study conducted in 17 sites in the United Kingdom, Germany, Ireland, and Canada.a Notes: aComposite and subscale scores range from 0–100, with higher scores indicating better vision-related functioning. Additional subscales are provided in Table S5. *P<0.001 by Wilcoxon rank-sum test. Abbreviations: GA, geographic atrophy; NEI-VFQ-25, National Eye Institute Visual Function Questionnaire-25. |
Patients with GA also had significantly lower NEI-VFQ-25 subscale scores for near activities, distance activities, dependency, driving, social functioning, mental health, role difficulties, color vision, and peripheral vision than those with non-GA conditions (Figure 2; Table S5). As expected, the GA group had a greater risk of worse general vision than the non-GA group (odds ratio [OR], 36.18; Wald 95% CI, 14.80–88.47; P<0.001), based on a multinomial analysis. Nearly 60% of patients with GA had poor or very poor vision, whereas all patients in the non-GA group had fair, good, or excellent general vision (Table S5). General health was similar between groups (Table S5), with no differences found between groups on multivariate analysis (OR, 0.87; Wald 95% CI, 0.43–1.79; P=0.712).
GA Diagnosis and Lesion Size
At the time of study inclusion, the mean (SD) disease duration since diagnosis for the majority (89.1% [n=98]) of patients who were initially affected with GA in both eyes was 2.3 (2.6) years.
A variety of tests were conducted at GA diagnosis; the most common ones (used in the 98 patients initially diagnosed with bilateral GA) were distance VA (86.7%), dilated eye examination (82.7%), optical coherence tomography (OCT; 81.6%), intraocular pressure (IOP; 67.3%), and fundus autofluorescence (FAF; 44.9%). GA lesion size was estimated in 97 (72.4%) patients with GA within a mean (SD) 0.6 (2.6) days from study entry; to estimate lesion size, physicians reviewed OCT in 35.1% and 34.0% of patients in the better- and worse-seeing eye, respectively, and FAF in 37.1% of patients in both the better- and worse-seeing eyes.
There was a broad distribution of estimated GA lesion sizes at study inclusion, with most patients having a lesion size of up to 4.0 disc area (DA). For worse-seeing eyes, 20.8% were <1 DA, 55.2% were 1–4 DA, 13.5% were >4–7 DA, and 10.4% were >7 DA. A similar distribution was estimated in the better-seeing eyes. As expected, more patients had foveal involvement in their worse-seeing eye than in their better-seeing eye (86.0% vs 77.6%, respectively).
Disease Characteristics of the Non-GA Group
Patients in the non-GA group had visited the sites for a variety of reasons, and these reflected the type of examinations conducted in patients without current eye conditions, including ophthalmological checkup, diabetic eye screening, diabetic retinopathy, IOP measurement, optic disc, and suspected glaucoma. Most patients (96.2%) had their VA measured in both eyes, and 26.9% of patients had a history of cataract surgery.
VA in the GA and Non-GA Groups
As expected, patients with GA had poorer VA than those without GA at study inclusion: 0.6 logarithm of the minimum angle of resolution (logMAR) unit (Snellen equivalent, ~20/80) in the better-seeing eye and 1.0 logMAR unit (Snellen equivalent, ~20/200) in the worse-seeing eye in patients with GA vs 0.1 logMAR unit (Snellen equivalent, ~20/25) and 0.2 logMAR unit (Snellen equivalent, ~20/32) in the non-GA group (Table 2). The majority of patients in the non-GA group had normal/near-normal vision in their worse-seeing eye, whereas three-quarters of patients in the GA group had moderately low vision or were blind in their worse-seeing eye.
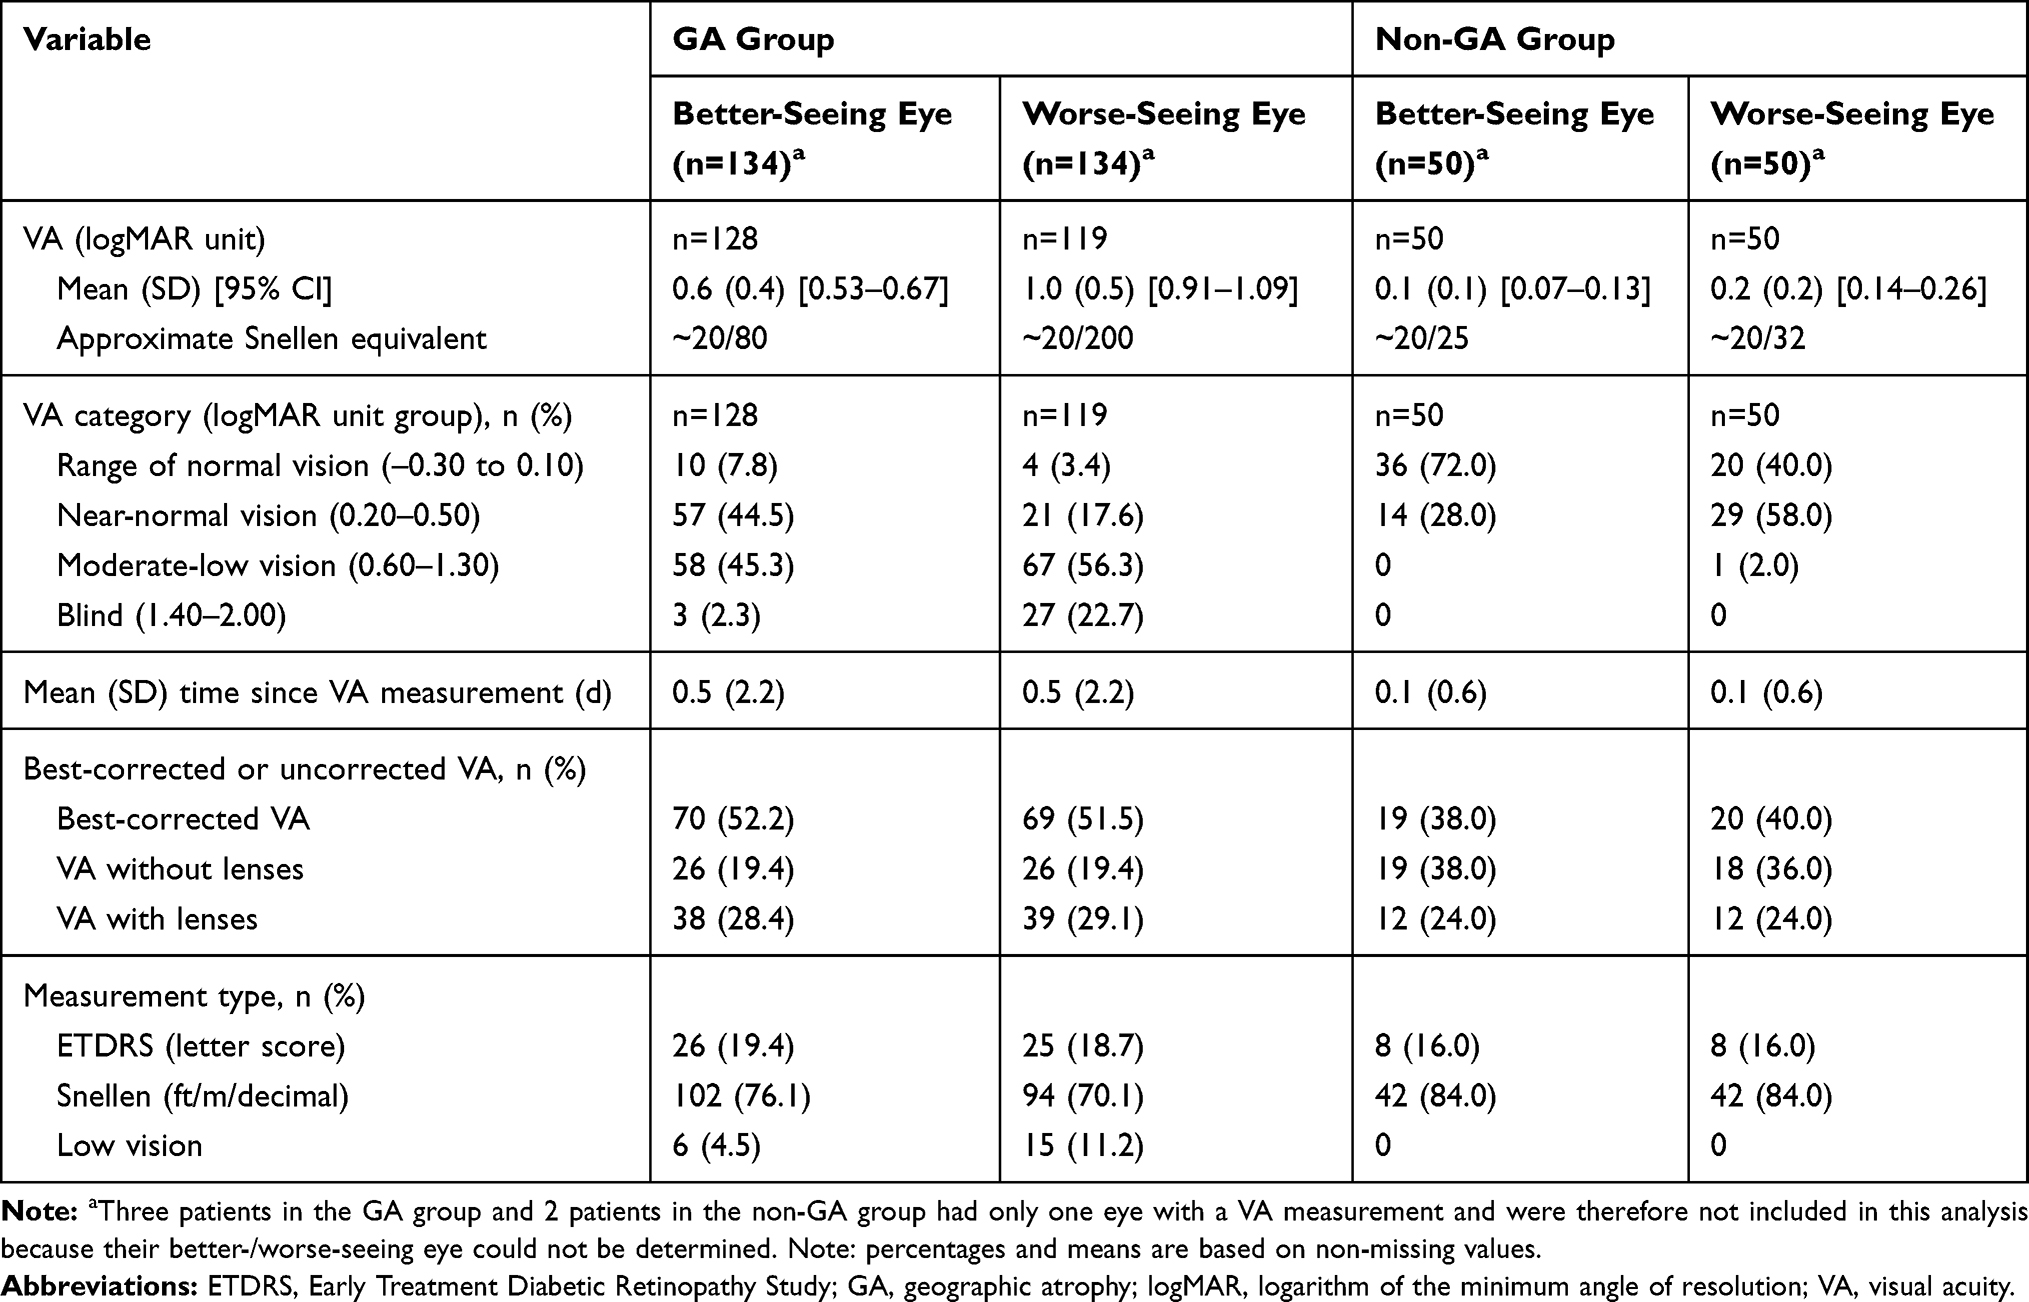 |
Table 2 VA of the GA and Non-GA Groups in a Cross-Sectional Study Conducted in 17 Sites in the United Kingdom, Germany, Ireland, and Canada |
Deterioration in Vision Over the Past Year in the GA and Non-GA Groups
Eighty-two percent of patients with GA vs 25% of patients without GA reported a worsening of vision over the past year, as assessed by the Global Rating of Change Scale (worse rating scores of −7 to −2). The mean (SD) scores for the respective groups were −3.4 (2.31) and −0.5 (2.31). The GA group was more likely to rate their vision as worsening in the past year (OR, 13.55; Wald 95% CI, 5.93–30.96; P<0.001), based on a multivariate analysis.
Driving and Transport in the GA and Non-GA Groups
Eighteen percent of patients with GA were either registered as legally blind according to legislation in the relevant country, or were going through the assessment process for registration (Table 3). Over half of patients with GA had a driving license (55.5%). However, half (52.0%) of these patients did not feel confident driving during the day and most (88.0%) did not feel confident driving at night. Most patients with GA reported regularly traveling with a partner or friend. Based on the NEI-VFQ-25 questionnaire, fewer patients in the GA group were currently driving than those in the non-GA group (27.6% vs 69.2%, respectively), and among the patients who did not drive, 73.9% had given up driving in the GA group compared with only 25.0% in the non-GA group. Eyesight was reported as the most common reason for giving up driving in the GA group (80.9%). The majority of patients in both groups (70.1% and 61.5% in the GA and non-GA groups, respectively) had a previous history of cataract, which were mostly bilateral. In the GA group, 67% of right eyes and 66% of left eyes with cataract had undergone lens replacement surgery with intraocular lens insertion. In the non-GA group, 48% and 46% of eyes with cataract had undergone lens replacement surgery with the natural lens replaced with an intraocular lens insertion.
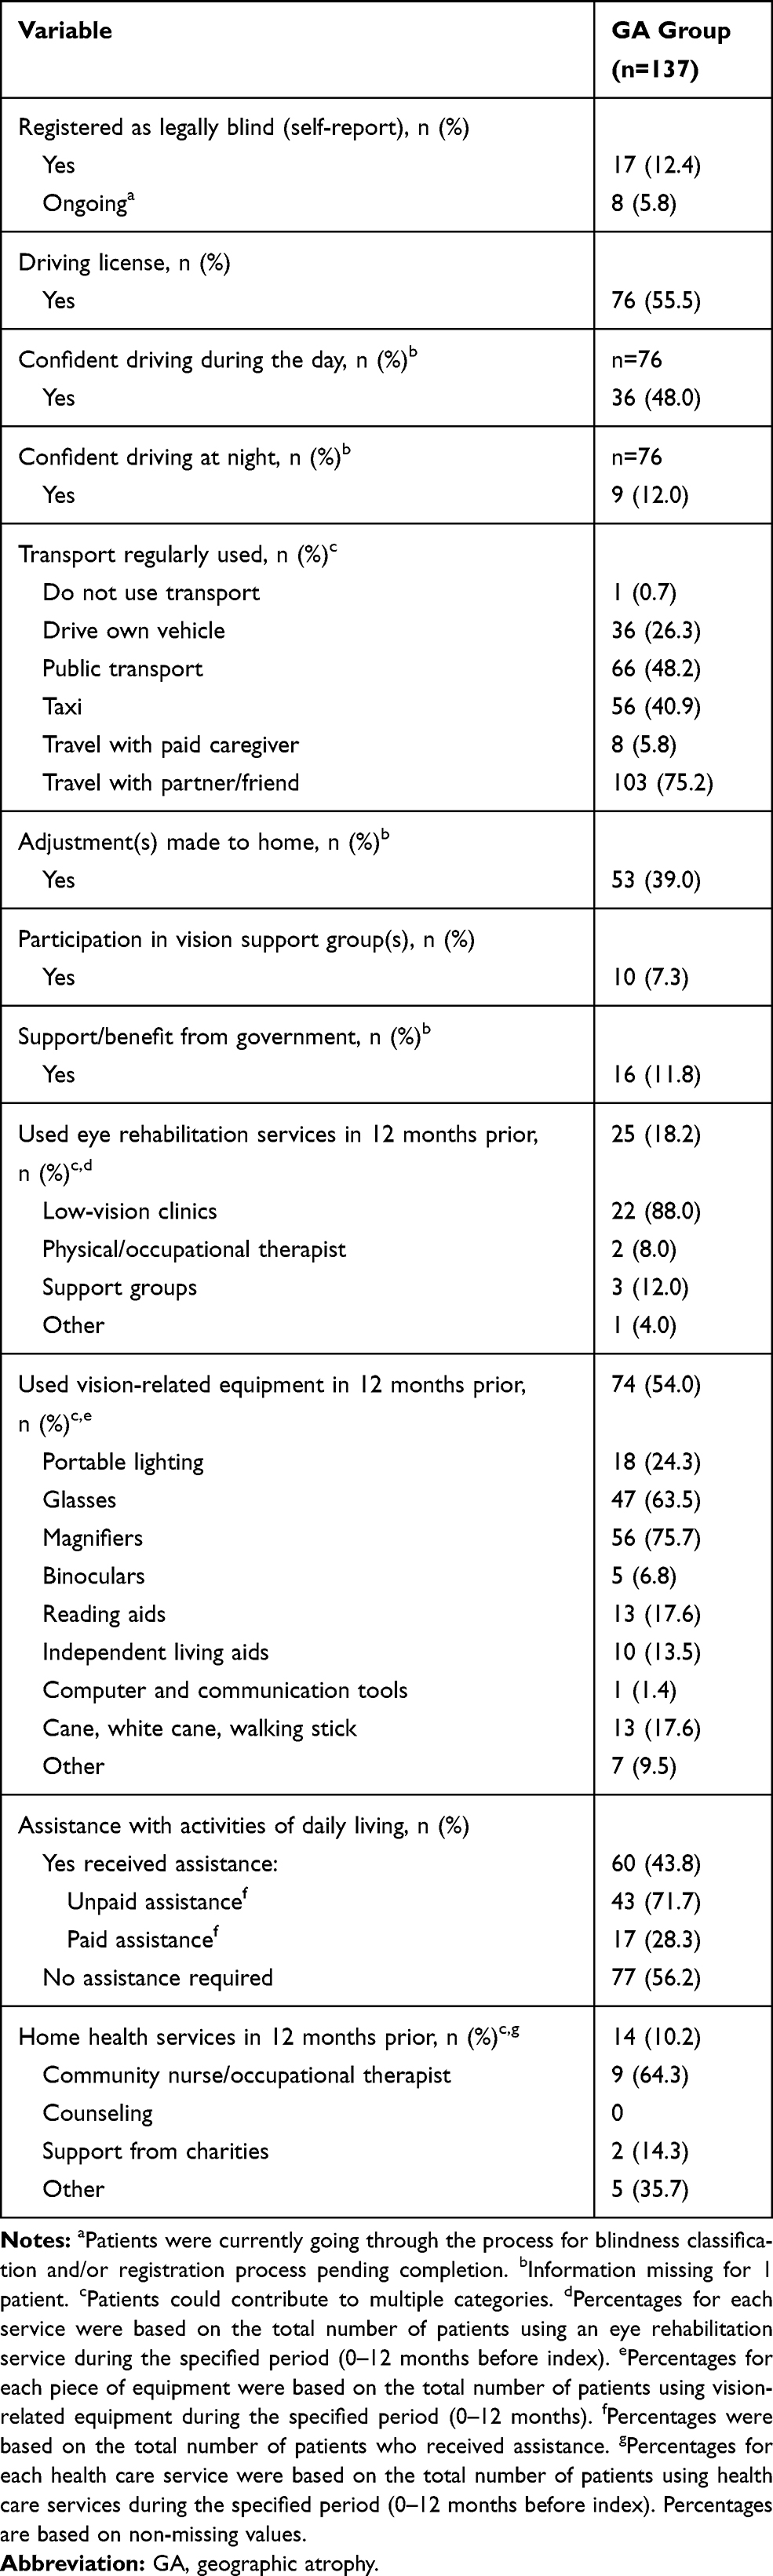 |
Table 3 Vision-Specific Characteristics of the GA Group in a Cross-Sectional Study Conducted in 17 Sites in the United Kingdom, Germany, Ireland, and Canada |
Aid and Support Services in the GA Group
Just under half of the patients with GA required assistance with daily activities, most of which was unpaid (Table 3). Over one-third of patients with GA required adjustments made to their home due to GA. Few (<12%) patients with GA received support or benefits from the government, or in the past 12 months had received home health care services or participated in vision-related support groups. Eighteen percent of patients had used eye rehabilitation services in the past 12 months, mostly low-vision clinics. Just over half of the patients had used vision-related equipment, including magnifiers, glasses, and portable lighting.
Medical and Non-medical Resource Utilization and Costs (GA Group)
In the 24 months before study inclusion, 85.4% of patients with GA had an ophthalmology-related visit, 81.5% had at least one test or procedure (averaging 8.2–9.6 tests/procedures per year), and 10% accessed home health care services. Forty-six (36.8%) patients had information recorded on drugs and treatments for any ocular condition, of which 24 patients had at least one drug or treatment, including corticosteroids, antibiotics, and vitamins. The associated mean annual costs for direct ophthalmological resource per patient amounted to €1772, comprising €188 for ophthalmology-related visits, €1071 for tests/procedures, €116 for drugs or other treatments, €319 for home health care services, €63 for vision-related equipment, and €14 for eye rehabilitation services (Table S6).
Analysis of indirect ophthalmological resource use by patients with GA found that in the 24 months before study inclusion, 47.8% of patients visited their GP more than three times, and 12.8% of patients for whom information was available had visited the emergency department. Few patients had inpatient (4.1%) or outpatient (4.4%) admissions, with falls cited as the main cause for admission. The associated mean annual costs for indirect ophthalmological resource use per patient were €234, comprising €177 for GP visits, €12 for emergency department visits, €39 for inpatient admissions, and €7 for outpatient admissions (Table S6). Mean annual costs associated with depression (diagnosed in 6.7%) and anxiety (in 4.9%) were minimal (up to €2 per patient) and have been excluded from the analysis.
Discussion
This study highlights the poor vision-related QoL in patients with GA compared with patients without GA, including the impact on driving, and thus autonomy. The study also captured information on HCRU and associated costs in patients with GA and showed that diagnostic tests/procedures were the main drivers of direct ophthalmic costs, and GP visits were the main driver for indirect ophthalmic costs.
The NEI-VFQ-25 questionnaire has been shown to be a responsive and sensitive measure that correlates with best-corrected VA, reading speed, and contrast sensitivity in patients with GA or neovascular AMD.20,25,26 Use of this questionnaire in our study suggests that patients with GA suffer from poorer vision-related function and QoL than their peers without GA, irrespective of age or sex. Patients with GA had significantly lower scores (representing poorer functioning) in most of the NEI-VFQ-25 subscales, with near activities, distance activities, and driving being most impacted. The poor recorded VA, the high prevalence of foveal involvement, and the low number of patients who were still driving support previously reported visual function and NEI-VFQ-25 data in patients with GA.9,11,12,20 Within the Mahalo phase 2 trial of intravitreal lampalizumab for the treatment of GA secondary to AMD,27 patients exhibited low scores for the driving, near activities, distance activities, and general vision subscales, although these scores, as well as the composite score, were higher than in our study, respectively (driving, 30.9 vs 21.8; near activities, 48.4 vs 25.6; distance activities, 56.1 vs 26.4; general vision, 50.0 vs 45.9; composite score, 61.7 vs 53.1).20 The poorer function seen in patients in our study is despite the greater GA severity in the Mahalo population; patients recruited into Mahalo had to have a GA lesion size of ~1–7 DA at baseline, whereas 21% of worse-seeing eyes in our study had GA lesions of <1 DA.27 These differences may be in part due to differences in general health between patient populations seen in routine clinical practice and those recruited into clinical trials, which tend to exclude patients with comorbidities such as malignancies.27 The NEI-VFQ-25 scores reported herein were also lower (ie, poorer) than previously reported in patients with neovascular AMD in two ranibizumab clinical trials (MARINA and ANCHOR) at baseline, as well as in a cross-sectional, non-interventional study in patients undergoing anti–vascular endothelial growth factor therapy.25,28
In line with our NEI-VFQ-25 findings, patients with GA were found to have poorer VA at study entry than those without GA, with the majority of patients in the GA group having moderately low vision or blindness in one or both eyes. One in 5 of the patients with GA were either registered as blind or undergoing the registration process, which supports previous findings from a UK EMR study in which 7.1% were eligible for blindness registration in the United Kingdom at diagnosis, with a further 16% being eligible as vision impairment increased over time (median time to outcome, 6.2 years).12 However, it should be noted that the definition of legal blindness varies between countries in the present analysis (Snellen score of <3/60 in England, ≤6/60 in Canada and Ireland, or ≤20/1000 in Germany), and also varies depending on the impairment in visual fields.29–32 Although longitudinal data on VA were not collected, >80% of patients with GA in our study reported worsening vision (based on the Global Rating of Change Scale) over the past year, contrary to the perception that GA is a slow-progressing disease that patients adapt to over time. Worsening vision as well as the fear of deterioration can place a significant psychological burden on patients with GA, resulting in increased road traffic insecurity, isolation, fears about the future, and a profound loss for the daily activities that are no longer possible.33
In the current study, although half of the patients with GA held a driving license (and thus were either currently driving or had driven at some point in the past), just over half of these patients did not feel confident driving during the day, and the majority did not feel confident driving at night. Based on the relevant NEI-VFQ-25 subscale, just over one-quarter of patients in the GA group were currently driving compared with just under 70% of the younger non-GA group. Most of the patients with GA who had stopped driving had done so due to their eyesight. These findings, together with the poor driving score (21.8), highlight the burden that GA places on patients in terms of limited mobility, loss of confidence, and lack of independence, and are in line with recent qualitative and ethnographic research on the psychological, emotional and physical impact of a diagnosis of GA.10,34 It should also be noted that currently there are no requirements for regular health checks to prove driving suitability in the United Kingdom, Ireland, and Germany; rather, the responsibility is placed with the individual to notify authorities of any changes to their eyesight that could affect their driving.
Interestingly, although just under half of the patients with GA reported that they required assistance with daily activities and/or used vision-related equipment, only a few patients had received governmental support or benefits, or in the past 12 months had received home health care services or participated in vision-related support groups. This suggests that the considerable burden of social care is cushioned by family or other unpaid support, and that problems associated with visual impairment are not an integral part of the assessment for social care requirements.
Despite the converging recruiting paths, patients with GA tended to be older than those in the non-GA group, which reflects the increasing GA incidence with advancing age.35 The patients with GA also had a broad distribution of lesion sizes, mostly estimated by FAF, OCT, or color fundus photography. At GA diagnosis, a wide variety of tests had been performed reflecting variations in diagnostic assessments across the health care communities included in this study; the most common diagnostic tests were distance VA, dilated eye examination, OCT, and IOP. Therefore, although FAF is reported to be the principal modality for assessing GA lesion size and progression36 and is recognized by the US Food and Drug Administration and the European Medicines Agency for clinical trials, the examination was used in less than half of the patients at diagnosis. This small proportion is likely to be even lower outside tertiary centers and could be related to the lack of therapeutic options. Surprisingly, distance VA was reported as being measured at diagnosis in only 87% of participants; this may reflect a phenomenon in clinical care whereby due to poor assumed function, less time is invested in the exact determination of VA in patients with GA.
The annualized average total cost (direct and indirect ophthalmic HCRU) was €2006 per patient with GA, which is similar to direct vision-related medical and non–vision-related medical costs (including fall-related and other injuries, depression/anxiety) reported for patients with neovascular AMD in a UK cohort study in 2005, before approval of the anti–vascular endothelial growth factor agents (£1553 [€1773] and £431 [€492], respectively).37 Similar to the UK cohort study, direct HCRU in our study accounted for the majority of the mean annual total costs (88%; €1772), with diagnostics tests and procedures being the main driver (€1071 per patient). The direct costs in patients with GA were, however, substantially lower than those reported for 2009 in patients with neovascular AMD in the United States ($8642 [€7641] per capita for drugs, supplements, low-vision aids and services, diagnostic/provider/facility use, and ophthalmic-related conditions [depression and trauma]).38 This difference is most likely due to the lack of an available treatment in the patients with GA, in line with the increased demand for health care services observed in patients with neovascular AMD and receiving treatment compared with non–neovascular AMD controls, especially within Europe.39 In our study, 24/46 patients with available information on drugs and treatment were receiving ocular therapies, with an associated cost of €116, whereas in the United States, neovascular AMD study drug costs amounted to $3552 (€3141).38 The direct ophthalmic costs in patients with GA are higher than those for other ophthalmic conditions, including in those where medications are frequently administered or surgery performed. Direct eye care costs of up to $3260 (€2882) per patient were reported over 2 years for patients with exfoliation glaucoma syndrome in the United States, or €969 per year per patient in European patients with stage 4 glaucoma.40,41 Clegg et al also reviewed the annual direct costs of managing a cohort of 1000 patients with dry eye syndrome in European countries, and reported costs of $536,000 (€474 per patient) for Germany and $1,100,000 (€973 per patient) for the United Kingdom, with prescription drugs and specialist visits attributing to the majority of these costs.42 In our study, GP visits were the main driver of indirect costs, with a mean annual cost per patient of €177. Approximately half of the patients had visited their GP more than three times in the past 24 months; this number may have been influenced by the impact of poor VA on patient mobility, as well as the presence of comorbidities.
There are limited data on HCRU in patients with GA, with few existing studies specifically reporting on patients with GA being limited to direct ophthalmic costs. A retrospective analysis of EMR data from the United Kingdom found that patients with GA in at least one eye had a median number of visits ranging from three in those with bilateral GA to 14 in those with GA and choroidal neovascularization over the first 2 years following diagnosis. Direct monitoring costs ranged from around £368 (€420) in those with bilateral GA (substantially lower than the mean annual cost per patient of €1259 for visits and procedures in our study) to around £1718 (€1961) in those with GA plus choroidal neovascularization.15 Similar to our findings, in an Italian observational trial in patients with any type of AMD (conducted between September 1998 and December 1999), hospital costs and diagnostics were the main drivers of costs.43 However, the total mean cost per patient per year of €148 for the small subgroup of patients with GA (78/476 patients) was substantially lower than the costs reported herein, possibly reflecting changes in management of patients with GA since the Italian study was conducted.
Study Limitations
Since only a few sites per country were included in the study, geographical representation may be limited, although effort was made to increase geographical representation by including centers from different geographic areas within each country. Nevertheless, the limited geographical representation is an important shortcoming of our study and may have affected our findings. All data entry was completed by designated trained personnel at the sites, and data validation checks undertaken to ensure data were accurate, complete, and verifiable from the source documents. However, as with all studies employing retrospective data extraction, not all data may have been captured or been available during the chart review. For example, physicians were asked to estimate the GA area and place it into a relevant size category, rather than providing specific measurements. Additionally, VA could be measured via Snellen or Early Treatment Diabetic Retinopathy Study chart measurements, and then was converted into logMAR. Because the gap between Snellen and Early Treatment Diabetic Retinopathy Study chart measurements is more pronounced with decreasing VA,44 this may have impacted the accuracy of the VA estimates, especially in those with low vision. Furthermore, in cases where both eyes had the same VA, the right eye was designated as the better-seeing eye and the left-eye as the worse-seeing eye, and thus the right eye may not necessarily be the dominant eye. However, this should have limited or no impact on the results, as in these cases, the VA was identical in both eyes. The higher proportion of widowed persons in the GA vs non-GA groups may also have contributed to the differences in vision-related QoL findings between the two groups, especially in relation to dependency, social functioning, and mental health. Caution should be applied when interpreting data based on the analysis of covariance, because parametric assumptions (ie, equal cohort variance and distributions consistent with a normally distributed population) were not met; however, both the non-parametric and parametric analyses were comparable.
Due to the nature of the disease, patients with GA usually present when they become symptomatic, and are seen relatively infrequently, usually when there is a need to rule out other conditions such as neovascular AMD. Patients included in this study were recruited during routine visits to the eye clinic and thus may have more severe GA symptoms (eg, increased visual impairment) than the average GA population, or may have a tendency to seek medical attention more often than their peers. A selection bias into the study thus cannot be ruled out, although the low attendance rate at low-vision clinics would suggest otherwise. In addition, the broad eligibility criteria for the non-GA group may have resulted in a heterogeneous non-GA group, which may also bias the direct comparison to the GA group. It is not possible to attribute VA loss and impact on driving, especially at night, entirely to GA because most patients with GA had cataract comorbidities (70% vs 62% in the non-GA group, respectively), mostly in both eyes. Furthermore, HCRU and associated costs may have been due to ophthalmic conditions other than GA.
Conclusions
With published evidence on the burden of GA limited, this study bridges the current knowledge gap. Analyses of comprehensive vision-related functioning, QoL, and economic data from multiple countries comparing patients with GA with a non-GA group highlight the poor level of vision-related function and QoL experienced by patients with GA in relation to patients without GA. In particular, GA was found to severely impact patients’ ability and confidence to drive, and consequently their independence. The annualized average total cost (direct and indirect ophthalmic HCRU) was €2006 per patient with GA, with direct health care costs accounting for most of these costs. The direct costs were lower than have been previously reported for neovascular AMD, possibly due to the lack of available treatment for GA. Diagnostic tests and procedures were identified as the major driver of direct health care costs and GP visits as the main driver of indirect costs. Findings from this study provide important information on the impact of GA on patients’ lives, as well as the costs associated with diagnosing and monitoring the disease, and associated GP consultations.
Abbreviations
AMD, age-related macular degeneration; DA, disc area; EMR, electronic medical record; FAF, fundus autofluorescence; GA, geographic atrophy; GP, general practitioner; HCRU, health care resource utilization; IOP, intraocular pressure; logMAR, logarithm of the minimum angle of resolution; NEI-VFQ-25, National Eye Institute Visual Function Questionnaire-25; OCT, optical coherence tomography; OR, odds ratio; QoL, quality of life; VA, visual acuity.
Ethics Approval and Informed Consent
Patients gave written informed consent for their data to be used in this study (including questionnaires). No identifiable information was collected in this study. The study was approved by the institutional review board or ethics committee at each participating site, and conducted according to the provisions of the Declaration of Helsinki,21 the Guidelines for Good Pharmacoepidemiology Practices Guidelines published by the International Society of Pharmacoepidemiology,22 and the laws and regulations of the country in which the research was conducted. The ethics committees involved are listed in Table S1.
Data Sharing
Qualified researchers may request access to individual patient-level data through the clinical study data request platform (www.clinicalstudydatarequest.com). Further details on Roche’s criteria for eligible studies are available here (https://clinicalstudydatarequest.com/Study-Sponsors/Study-Sponsors-Roche.aspx). For further details on Roche’s Global Policy on the Sharing of Clinical Information and how to request access to related clinical study documents, see here (https://www.roche.com/research_and_development/who_we_are_how_we_work/clinical_trials/our_commitment_to_data_sharing.htm).
Acknowledgments
Group contribution: the authors would like to thank the study team for their contributions for this publication. Investigators: United Kingdom: Praveen J. Patel (principal investigator [PI], Moorfields Hospital); Ben Burton (James Paget University Hospitals NHS Foundation Trust); Winfried Amoaku (Nottingham University Hospitals NHS Trust); Simon Taylor (Royal Surrey County Hospital); Quersh Mohamed (Gloucestershire Hospitals NHS Foundation Trust); Nishal Patel (East Kent Hospitals NHS Foundation Trust); Ireland: Eugene Ng (Institute of Eye Surgery, UPMC Whitfield); Germany: Focke Ziemssen (PI, Universitäts-Augenklinik Tübingen); Antonia Joussen (Charité – Universitätsmedizin Berlin); Norbert Pfeiffer (Universitäts-Klinikum Augenklinik Universitätsmedizin der Johannes Gutenberg-Universität Mainz); Daniel Pauleikhoff (St. Franziskus-Hospital GmbH, Münster); Nicolas Feltgen (Klinik für Augenheilkunde, Göttingen); Thomas Ach (Universitätsklinikum Würzburg Augenklinik und Poliklinik); Rainer Guthoff (Universitätsklinikum Düsseldorf, Klinik für Augenheilkunde); Lothar Krause, Klaus Rosbach (Städtisches Klinikum Dessau); Canada: Laurent Lalonde (Institut De L’Oeil Des Laurentides), Alejandro Oliver (Ophthalmology Timmins).
Roche Country Team: United Kingdom: Helen Langham; Ireland: Myra O’Dwyer, Lucy Loughnan; Germany: Alfons Wiggenhauser, Theresia Amigo-Manneck; Canada: Patricia DeMarco, Fernando Lasso De La Vega; Spain: Isabel Galnares; Italy: Nicoletta Porciani, Laura Bianchino; IQVIA Country Team: United Kingdom: Shoshannah Kalson-Ray; Germany: Alexandra Spiess, Maria Buehler; Canada: Johanna Mancini, Kelly Barrow; Roche/Genentech, Inc. Global Team: Ronald A. Cantrell, Nidia Castro, Christopher Brittain, David Silverman, Margarita Donica, Sophie Clavelin, Yamina Rajput; Global Team: IQVIA: Laura Garcia Alvarez, Anushini Muthutantri.
Author Contributions
All authors made substantial contributions to conception and design, acquisition of data, or analysis and interpretation of data; took part in drafting the article or revising it critically for important intellectual content; gave final approval of the version to be published; and agree to be accountable for all aspects of the work.
Disclosure
PJP is a consultant for and recipient of fees from Bayer, Novartis, Oxford Bioelectronics, and Roche/Genentech, Inc. FZ is a consultant for Alimera, Allergan, Bayer, Biogen, Boehringer-Ingelheim, MSD, Novartis, NovoNordisk, and Roche; receives research support from Allergan, Bayer, Biogen, Clearside, Novartis, and Roche (investigator of this study); and receives financial support from Novartis. EN is a consultant for Alcon, Alimera, Bayer, Novartis, and SIFI; receives financial support from Alcon, Alimera, Bayer, and Novartis; has research contracts with Alcon, Bayer, IQVIA, Medisoft, Novartis, Santen, Roche, and SIFI; and holds a patent with Novartis. AM is an employee of IQVIA, the company contracted to conduct the study by Genentech, Inc., a member of the Roche group. DS is an employee of Roche Products Limited. ET is an employee of Genentech, Inc., a member of the Roche Group. RAC is an employee of Genentech, Inc., a member of the Roche Group. The authors report no other conflicts of interest in this work.
References
1. Boyer DS, Schmidt-Erfurth U, van Lookeren Campagne M, Henry EC, Brittain C. The pathophysiology of geographic atrophy secondary to age-related macular degeneration and the complement pathway as a therapeutic target. Retina. 2017;37(5):819–835. doi:10.1097/IAE.0000000000001392
2. Holz FG, Strauss EC, Schmitz-Valckenberg S, van Lookeren Campagne M. Geographic atrophy: clinical features and potential therapeutic approaches. Ophthalmology. 2014;121(5):1079–1091. doi:10.1016/j.ophtha.2013.11.023
3. Lindblad AS, Lloyd PC, Clemons TE, et al.; Age-Related Eye Disease Study Research Group. Change in area of geographic atrophy in the Age-Related Eye Disease Study: AREDS report number 26. Arch Ophthalmol. 2009;127(9):1168–1174.
4. Wong WL, Su X, Li X, et al. Global prevalence of age-related macular degeneration and disease burden projection for 2020 and 2040: a systematic review and meta-analysis. Lancet Glob Health. 2014;2(2):e106–e116. doi:10.1016/S2214-109X(13)70145-1
5. Rees A, Zekite A, Bunce C, Patel PJ. How many people in England and Wales are registered partially sighted or blind because of age-related macular degeneration? Eye. 2014;28:832–837. doi:10.1038/eye.2014.103
6. Rudnicka AR, Jarrar Z, Wormald R, Cook DG, Fletcher A, Owen CG. Age and gender variations in age-related macular degeneration prevalence in populations of European ancestry: a meta-analysis. Ophthalmology. 2012;119(3):571–580. doi:10.1016/j.ophtha.2011.09.027
7. Bindewald A, Schmitz-Valckenberg S, Jorzik JJ, et al. Classification of abnormal fundus autofluorescence patterns in the junctional zone of geographic atrophy in patients with age related macular degeneration. Br J Ophthalmol. 2005;89(7):874–878. doi:10.1136/bjo.2004.057794
8. Ly A, Nivison-Smith L, Assaad N, Kalloniatis M. Fundus autofluorescence in age-related macular degeneration. Optom Vis Sci. 2017;94(2):246–259. doi:10.1097/OPX.0000000000000997
9. Sunness JS, Gonzalez-Baron J, Applegate CA, et al. Enlargement of atrophy and visual acuity loss in the geographic atrophy form of age-related macular degeneration. Ophthalmology. 1999;106(9):1768–1779. doi:10.1016/S0161-6420(99)90340-8
10. Taylor DJ, Jones L, Binns AM, Crabb DP. ‘You’ve got dry macular degeneration, end of story’: a qualitative study into the experience of living with non-neovascular age-related macular degeneration [published online May 22, 2019]. Eye (Lond). doi:10.1038/s41433-019-0445-8
11. Sunness JS, Rubin GS, Applegate CA, et al. Visual function abnormalities and prognosis in eyes with age-related geographic atrophy of the macula and good visual acuity. Ophthalmology. 1997;104(10):1677–1691. doi:10.1016/S0161-6420(97)30079-7
12. Chakravarthy U, Bailey CC, Johnston RL, et al. Characterizing disease burden and progression of geographic atrophy secondary to age-related macular degeneration. Ophthalmology. 2018;125(6):842–849. doi:10.1016/j.ophtha.2017.11.036
13. Brown MM, Brown GC, Sharma S, et al. The burden of age-related macular degeneration: a value-based analysis. Curr Opin Ophthalmol. 2006;17(3):257–266.
14. Orr S. Disease burden associated with geographic atrophy secondary to age-related macular degeneration. Invest Ophthalmol Vis Sci. 2016;57(12):21.
15. Chakravarthy U, Bailey C, Johnston RL, et al. Direct ophthalmic healthcare resource use among geographic atrophy patients in a large cohort from the United Kingdom.
16. Roh M, Selivanova A, Shin HJ, Miller JW, Jackson ML. Visual acuity and contrast sensitivity are two important factors affecting vision-related quality of life in advanced age-related macular degeneration. PLoS One. 2018;13(5):e0196481. doi:10.1371/journal.pone.0196481
17. Stevenson MR, Hart PM, Montgomery AM, McCulloch DW, Chakravarthy U. Reduced vision in older adults with age related macular degeneration interferes with ability to care for self and impairs role as carer. Br J Ophthalmol. 2004;88(9):1125–1130. doi:10.1136/bjo.2003.032383
18. Centers for Disease Control and Prevention. International Classification of Diseases, Tenth Revision, Clinical Modification (ICD-10-CM): FY 2017 version. 2017. Available from: https://www.cdc.gov/nchs/icd/icd10cm.htm.
19. World Health Organization. ICD-11 for mortality and morbidity statistics. 2018. Available from: https://icd.who.int/browse11/l-m/en#/http://id.who.int/icd/entity/574366657.
20. Sivaprasad S, Tschosik E, Kapre A, et al. Reliability and construct validity of the NEI VFQ-25 in a subset of patients with geographic atrophy from the phase 2 Mahalo study. Am J Ophthalmol. 2018;190:1–8. doi:10.1016/j.ajo.2018.03.006
21. World Medical Association. WMA Declaration of Helsinki – ethical principles for medical research involving human subjects. 2018. Available from: https://www.wma.net/policies-post/wma-declaration-of-helsinki-ethical-principles-for-medical-research-involving-human-subjects/.
22. International Society for Pharmacoepidemiology. Guidelines for Good Pharmacoepidemiology Practices (GPP). 2015. Available from: https://www.pharmacoepi.org/resources/policies/guidelines-08027/.
23. Mangione CM, Lee PP, Gutierrez PR, Spritzer K, Berry S, Hays RD; National Eye Institute Visual Function Questionnaire Field Test Investigators. Development of the 25-item National Eye Institute Visual Function Qquestionnaire. Arch Ophthalmol. 2001;119(7):1050–1058. doi:10.1001/archopht.119.7.1050
24. Jaeschke R, Singer J, Guyatt GH; Measurement of health status. Ascertaining the minimal clinically important difference. Control Clin Trials. 1989;10(4):407–415. doi:10.1016/0197-2456(89)90005-6
25. Suñer IJ, Kokame GT, Yu E, Ward J, Dolan C, Bressler NM. Responsiveness of NEI VFQ-25 to changes in visual acuity in neovascular AMD: validation studies from two phase 3 clinical trials. Invest Ophthalmol Vis Sci. 2009;50(8):3629–3635. doi:10.1167/iovs.08-3225
26. Orr P, Rentz AM, Margolis MK, et al. Validation of the National Eye Institute Visual Function Qquestionnaire-25 (NEI VFQ-25) in age-related macular degeneration. Invest Ophthalmol Vis Sci. 2011;52(6):3354–3359. doi:10.1167/iovs.10-5645
27. Yaspan BL, Williams DF, Holz FG, et al.; MAHALO Study Investigators. Targeting factor D of the alternative complement pathway reduces geographic atrophy progression secondary to age-related macular degeneration. Sci Transl Med. 2017;9(395):f1443. doi:10.1126/scitranslmed.aaf1443
28. Spooner KL, Mhlanga CT, Hong TH, Broadhead GK, Chang AA. The burden of neovascular age-related macular degeneration: a patient’s perspective. Clin Ophthalmol. 2018;12:2483–2491. doi:10.2147/OPTH.S185052
29. Department of Health. Certification of vision impairment. Explanatory notes for consultant ophthalmologists and hospital eye clinic staff in England. 2017. Available from: https://assets.publishing.service.gov.uk/government/uploads/system/uploads/attachment_data/file/637590/CVI_guidance.pdf.
30. Green D, Ducorroy G, McElnea E, et al. The cost of blindness in the Republic of Ireland 2010–2020. J Ophthalmol. 2016;2016:4691276. doi:10.1155/2016/4691276
31. CNIB Foundation. What is blindness? 2018. Available from: https://www.cnib.ca/en/sight-loss-info/blindness/what-blindness?region=gta.
32. Finger RP, Fimmers R, Holz FG, Scholl HP. Prevalence and causes of registered blindness in the largest federal state of Germany. Br J Ophthalmol. 2011;95(8):1061–1067. doi:10.1136/bjo.2010.194712
33. McCloud C, Khadka J, Gilhotra JS, Pesudovs K. Divergence in the lived experience of people with macular degeneration. Optom Vis Sci. 2014;91(8):966–974. doi:10.1097/OPX.0000000000000320
34. Sivaprasad S, Tschosik EA, Guymer RH, et al. Living with geographic atrophy: an ethnographic study. Ophthalmol Ther. 2019;8(1):115–124. doi:10.1007/s40123-019-0160-3
35. Rudnicka AR, Kapetanakis VV, Jarrar Z, et al. Incidence of late-stage age-related macular degeneration in American whites: systematic review and meta-analysis. Am J Ophthalmol. 2015;160(1):85–93.e3. doi:10.1016/j.ajo.2015.04.003
36. Fleckenstein M, Mitchell P, Freund KB, et al. The progression of geographic atrophy secondary to age-related macular degeneration. Ophthalmology. 2018;125(3):369–390. doi:10.1016/j.ophtha.2017.08.038
37. Lotery A, Xu X, Zlatava G, Loftus J. Burden of illness, visual impairment and health resource utilisation of patients with neovascular age-related macular degeneration: results from the UK cohort of a five-country cross-sectional study. Br J Ophthalmol. 2007;91(10):1303–1307. doi:10.1136/bjo.2007.116939
38. Brown MM, Brown GC, Lieske HB, Tran I, Turpcu A, Colman S. Societal costs associated with neovascular age-related macular degeneration in the United States. Retina. 2016;36(2):285–298. doi:10.1097/IAE.0000000000000717
39. Jaffe DH, Chan W, Bezlyak V, Skelly A. The economic and humanistic burden of patients in receipt of current available therapies for nAMD. J Comp Eff Res. 2018;7(11):1125–1132. doi:10.2217/cer-2018-0058
40. Rathi S, Andrews C, Greenfield DS, Stein JD. A comparison of resource use and costs of caring for patients with exfoliation syndrome glaucoma versus primary open-angle glaucoma. Am J Ophthalmol. 2019;200:100–109. doi:10.1016/j.ajo.2018.12.024
41. Traverso CE, Walt JG, Kelly SP, et al. Direct costs of glaucoma and severity of the disease: a multinational long term study of resource utilisation in Europe. Br J Ophthalmol. 2005;89(10):1245–1249. doi:10.1136/bjo.2005.067355
42. Clegg JP, Guest JF, Lehman A, Smith AF. The annual cost of dry eye syndrome in France, Germany, Italy, Spain, Sweden and the United Kingdom among patients managed by ophthalmologists. Ophthalmic Epidemiol. 2006;13(4):263–274. doi:10.1080/09286580600801044
43. Garattini L, Castelnuovo E, Lanzetta P, Viscarra C, Ricci E, Parazzini F; CARMA Study Group. Direct medical costs of age-related macular degeneration in Italian hospital ophthalmology departments. A multicenter, prospective 1-year study. Eur J Health Econ. 2004;5(1):22–27. doi:10.1007/s10198-003-0198-x
44. Kaiser PK. Prospective evaluation of visual acuity assessment: a comparison of snellen versus ETDRS charts in clinical practice (an AOS thesis). Trans Am Ophthalmol Soc. 2009;107:311–324.
 © 2020 The Author(s). This work is published and licensed by Dove Medical Press Limited. The full terms of this license are available at https://www.dovepress.com/terms.php and incorporate the Creative Commons Attribution - Non Commercial (unported, v3.0) License.
By accessing the work you hereby accept the Terms. Non-commercial uses of the work are permitted without any further permission from Dove Medical Press Limited, provided the work is properly attributed. For permission for commercial use of this work, please see paragraphs 4.2 and 5 of our Terms.
© 2020 The Author(s). This work is published and licensed by Dove Medical Press Limited. The full terms of this license are available at https://www.dovepress.com/terms.php and incorporate the Creative Commons Attribution - Non Commercial (unported, v3.0) License.
By accessing the work you hereby accept the Terms. Non-commercial uses of the work are permitted without any further permission from Dove Medical Press Limited, provided the work is properly attributed. For permission for commercial use of this work, please see paragraphs 4.2 and 5 of our Terms.