")
Back to Journals » ClinicoEconomics and Outcomes Research » Volume 13
Budgetary Impact of Bendamustine Ready-to-Dilute Products in Chronic Lymphocytic Leukemia and Non-Hodgkin Lymphoma to a United States Infusion Facility
Authors James E, Trautman H, Thompson S, Ribalov R, Choudhry A
Received 6 January 2021
Accepted for publication 5 March 2021
Published 22 March 2021 Volume 2021:13 Pages 201—211
DOI https://doi.org/10.2147/CEOR.S297284
Checked for plagiarism Yes
Review by Single anonymous peer review
Peer reviewer comments 2
Editor who approved publication: Dr Samer Hamidi
Elizabeth James,1 Holly Trautman,1 Stephen Thompson,2 Rinat Ribalov,3 Azhar Choudhry4
1Aventine Consulting LLC, Marblehead, MA, USA; 2Global Health Economics and Outcomes Research, Teva Branded Pharmaceutical Products R&D, Inc, Parsippany, NJ, USA; 3Global Health Economics and Outcomes Research, Teva Pharmaceutical Industries Ltd, Petah Tikva, Israel; 4Medical Affairs, Teva Branded Pharmaceutical Products R&D, Inc, Parsippany, NJ, USA
Correspondence: Elizabeth James Tel +1 425 290 2148
Email [email protected]
Background: Bendamustine hydrochloride (BND HCl) is indicated for first-line treatment of chronic lymphocytic leukemia (CLL) and rituximab-refractory indolent non-Hodgkin lymphoma (iNHL). There are two ready-to-dilute (RTD) formulations of BND HCl on the US market: a large-volume, long-duration infusion (BND-L) and a small-volume, short-duration infusion (BND-S). It is estimated that the shorter duration infusion could result in cost savings to infusion facilities.
Objective: Estimate the one-year budget impact between BND-S and BND-L for use in the treatment of CLL and iNHL when all current BND-L utilization is replaced with BND-S, from the US infusion facility perspective.
Methods: An illustrative budget impact model estimated the change in costs associated with a projected increase from 50% to 100% market share for BND-S. The model included CLL and iNHL patient populations. Budgetary costs reflected facility expenditures on drug acquisition and administration based on recommended dosing for BND-S and BND-L. The base-case model assumptions and inputs were derived from scientific literature and publicly available resources. The total budget impact was calculated annually, along with the differences in per patient cost; one-way sensitivity analyses were conducted.
Results: Per-patient savings with BND-S use after the utilization shift were estimated at $2812.24 for CLL and $4769.01 for iNHL. Across both indications, the total annual incremental savings after the utilization shift were estimated at $452,209 for 250 CLL and iNHL patients in a 10,000-patient infusion facility, resulting in cost savings of $150.74 per BND HCI patient per month and $1808.84 per BND HCI patient per year. The model was sensitive to changes in proportion of patients receiving BND HCI infusions for CLL and iNHL, patient body surface area, and BND-S wholesale acquisition cost.
Conclusion: This analysis estimated over $450,000 in annual savings for a 10,000-patient chemotherapy infusion facility following a utilization shift from 50% use of each RTD product to 100% use of BND-S in CLL and iNHL patients, driven by lower acquisition costs for BND-S and lower administration labor costs associated with rapid infusion.
Keywords: chronic lymphocytic leukemia, indolent non-Hodgkin lymphoma, budget impact, bendamustine, infusion
Introduction
Chronic lymphocytic leukemia (CLL) is a heterogeneous form of cancer, originating from abnormal antigen-experienced B lymphocytes that accumulate in the blood, bone marrow, spleen, and lymph nodes.1,2 Although CLL is primarily a disease of the elderly, with a median age at diagnosis between 67 and 72 years, about 10% of patients with CLL are less than 50 years of age.3,4 Despite being the most common leukemia in adults in the United States (US), CLL is a relatively rare with an estimated 21,040 new cases of CLL and an estimated 4060 CLL-related deaths expected in 2020.4 Survival rates for patients with CLL vary widely, based on the stage of the disease; the five-year survival for patients with CLL is 86.1%.5
NHLs are a heterogeneous group of lymphoid cell malignancies with a broad range of morphologic, immunologic, and clinical attributes as consequences of their varying differentiated immune cell origin.6,7 Although NHLs can be derived from either the T-cell or B cell lineage, the vast majority are B cell in origin, including follicular NHL, diffuse large B-cell lymphoma, and CLL. NHLs as a group are currently the seventh most common cancer in both men and women in the US, with an estimated 77,240 new cases and an estimated 19,940 deaths predicted to occur in 2020.4 Survival rates vary broadly by cell type and stage of disease.4 The current five-year survival rate for NHL is 75.1%.5 Indolent NHL (iNHL) represents approximately 40% of all NHL cases.8
Observation, rather than treatment, may be appropriate for some patients with CLL.9 However, for CLL patients with active, symptomatic disease, treatment options include alkylator-based therapies, purine analog-based therapies, B-cell lymphoma-2 inhibitors, kinase inhibitors that target B cell receptor signaling, and/or monoclonal antibodies.1,9 Treatment approaches are based on patient age, performance status or fitness, and comorbidities, all of which affect the tolerability of treatment regimens. The choice of treatment also depends on the clinical stage of the disease, patient symptoms, genetic profile, and disease/treatment status (first- versus second-line, response versus nonresponse to the last treatment).1,9,10 For iNHL patients without symptoms or advanced disease, observation may also be an option.9 Once therapy is initiated, patients with NHL may be treated with radiation, single-agent or combination chemotherapy, immunotherapy, chemoimmunotherapy, and/or radioimmunotherapies, depending on the specific type and stage of disease.4,9 Similar to CLL, treatment selection for patients with iNHL should be individualized based on patient age, extent of disease, comorbidities, therapy goals, and patient preference. The selection of treatment for second-line therapy and beyond for iNHL also depends on the efficacy of prior treatments received.11
Bendamustine hydrochloride (BND HCl) is an alkylating drug indicated for first-line treatment of patients with CLL (efficacy relative to first-line therapies other than chlorambucil has not been established) and iNHL that has progressed during or within six months of treatment with rituximab or a rituximab-containing regimen.12–14 There are three BND HCl products currently on the market in the US, two of which are ready-to-dilute (RTD) formulations: BND large-volume, long-duration infusion (Belrapzo™; Eagle Pharmaceuticals, Inc., Woodcliff Lake, NJ; BND-L)13 and BND small-volume, short-duration infusion (Bendeka®; Teva Pharmaceuticals USA, Inc., Parsippany, NJ; BND-S).14
With the exception of infusion rate, infusion volume, and diluents, the active ingredients and FDA-approved labeling for the two RTD formulations are identical.13,14 The active ingredient in both products is bendamustine hydrochloride, and they are FDA-approved for CLL and iNHL that has progressed during or within six months of rituximab treatment or therapy with a rituximab-containing regimen. BND-S treatments for both CLL and NHL are infused over 10 minutes. BND-L treatments for CLL are infused over 30 minutes; treatments for NHL are infused over 60 minutes. BND-S may be diluted with 50 mL of 0.9% Sodium Chloride Injection, United States Pharmacopoeia (USP), 2.5% Dextrose/0.45% Sodium Chloride Injection, USP, or 5% Dextrose Injection, USP. BND-L may be diluted with 500 mL of 0.9% Sodium Chloride Injection, USP, or 2.5% Dextrose/0.45% Sodium Chloride Injection, USP.
BND-S received regulatory approval by the Food and Drug Administration (FDA) via the 505(b2) pathway.15 BND-S was evaluated in a Phase I, open-label, crossover, randomized clinical study that compared it to a reference formulation of BND HCI in 81 patients with cancer who had progressed or relapsed on standard therapy or for whom no curative or standard therapy was appropriate.16,17 BND-S was administered as a low-volume (50-mL admixture) BND formulation infused over a period of 10 minutes, whereas the reference product was administered as a standard-volume (500-mL admixture) BND formulation infused over a period of 60 minutes. BND-S was bioequivalent to the reference formulation for the pharmacokinetic parameters of BND area under the curve assessments using the reference scaled average bioequivalence approach for each of the population sets analyzed. Furthermore, no clinically significant differences in the adverse event (AE) profile were noted among patients receiving BND HCI administered as a 500-mL admixture over standard infusion time periods and those receiving BND-S administered as a 50-mL admixture over a short-duration infusion, despite the higher maximum observed plasma concentration (Cmax) values observed with BND-S.14,15 BND-S and the reference formulation had similar safety profiles within one hour and 24 hours after infusion.16 There were no differences between the formulations in infusion-related AEs and no reports of extravasation or irritation after either formulation.13
The differences between the products according to the FDA-approved labeling provide the opportunity for a reduction in infusion time and volume administered for patients treated with BND-S. In addition, providers have an additional diluent choice with BND-S that may provide clinical benefit for some patients, and clinics may experience more available staff time and increased patient turnover with shorter infusion times. As such, institutions may choose utilization of one product over another based on pharmacoeconomic considerations. An illustrative budgetary impact model was developed to estimate the one-year projected cost differential between BND-S and BND-L for use in the treatment of CLL and iNHL when all current BND-L utilization is replaced with BND-S.
Methods
Model Framework
An economic model estimated the current costs of BND-S and BND-L for use in the treatment of CLL and iNHL and projected the estimated cost difference between the current and future utilization of these BND HCl infusion products from the US facility perspective. The model was constructed in Microsoft Excel® and developed to the extent possible, according to the current Budget Impact Analysis Principles of Good Practice published by the International Society of Pharmacoeconomics and Outcomes Research (ISPOR).18 The base-case model assumptions and inputs were derived from pertinent scientific literature, product labeling, and publicly available resources (where available); no patient-level identifiable data were used.
The model contained three main input components: patient population, marketplace dynamics, and budgetary costs. The patient population component defined the total number of patients eligible for treatment with BND-S or BND-L infusions based on national health system statistics and CLL and iNHL incidence data. The marketplace dynamics component included the current and future BND product utilization projections. All products were considered according to their FDA-approved indications. Finally, the budgetary costs component reflected facility expenditures (versus billed charges) for drug acquisition and administration based on recommended dosing within BND-S and BND-L US FDA-approved labeling and did not include health plan or payer reimbursement. The model used a one-year time horizon to reflect the short-term nature of the budgetary cycle; therefore, costs were not discounted.
Acquisition and administration costs were combined with population and product market share information to estimate the budget impact on infusion facilities associated with a shift in utilization from BND-S to BND-L over one year. Model outcomes included the annual budget impact, calculated as the net difference in costs between the current and projected (future) scenarios, presented in the aggregate along with differences in per BND patient per month (PBPPM) and per BND patient per year (PBPPY) costs.
Eligible Population
The analysis began by estimating the patient population who may be eligible for BND-S or BND-L treatment. The input values and their sources used in the base-case analysis for determining the size of this population are summarized in Table 1 and described below.
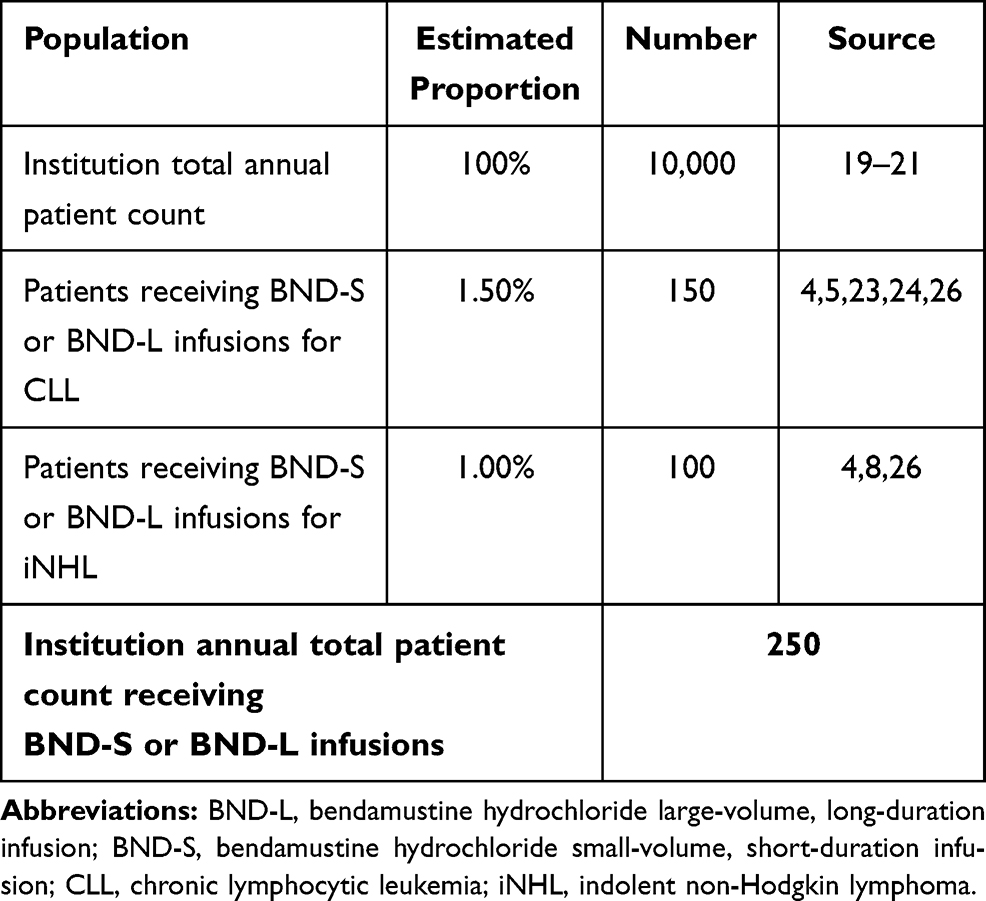 |
Table 1 Population Estimates |
Few publicly available data quantify the average number of patients receiving chemotherapy at an infusion center. One recent study reported that the median number of chemotherapy infusion patients per day within their sample (>250 infusion centers of all facility types) was 34, which corresponds to 8500 patient encounters per year, using a 250-day work year.19 The University of Michigan Comprehensive Cancer Center saw 9429 unique chemotherapy infusion patients from August 2012 through February 2013, corresponding to an estimated 19,000 unique patients receiving one or more infusion in one year.20 Data from the same center in 2014 reported approximately 21,000 unique patients received infusions throughout the year.21 These larger numbers suggest that this particular facility serves substantially more patients than the average facility. Using these publicly available data as a guide, the model used a default value of 10,000 to represent the number of unique patients receiving one or more chemotherapy treatments at a typical infusion center.
The American Cancer Society (ACS) estimated that 1,806,590 new cancer cases will be diagnosed in the US in 2020.4 The model assumed approximately 80% of these new cancer cases, including CLL and NHL, are treated with first-line chemotherapy (with or without immunotherapy) per national guidelines (versus other treatment modalities). This estimate includes the 2020 estimated 21,040 new cases of CLL (1.5% of chemotherapy- or immunotherapy-treated new cancer cases) and 77,240 new cases of NHL (5.3% of chemotherapy- or immunotherapy-treated new cancer cases).
Based on ACS estimates, the annual incidence of CLL was calculated to be approximately 0.0064% using 2019 US census population data.22 The most recent Surveillance, Epidemiology, and End Results (SEER) estimates for 2010–2016 report a five-year relative survival of 86.1% for patients with CLL, with 434,982 prevalent cases.5 Real-world SEER data have identified that the majority of patients may remain untreated within the first two years of diagnosis,23 and following first-line treatment, approximately two-thirds of patients receive second-line treatment within two years.24 However, no real-word data exist to support a specific proportion of patients with prevalent CLL eligible for and opting into relapsed therapy treatment overall, nor specifically with bendamustine. National Comprehensive Cancer Network guidelines (NCCN Guidelines®) recommend therapy including BND as a Category 2A option for first-line treatment and a Category 2B option for relapsed or refractory patients without the del(17p)/TP53 mutation (which represents a very small proportion of patients),25 based on patient comorbidity status.26 Using these treatment patterns as a guide, the model conservatively assumed a patient count equal to the annual incidence of CLL among all cancers may be used as a proxy for the number of untreated patients who will receive first-line treatment in any given year, taking into account that 80% of patients with new cancer diagnoses overall opt into treatment. Real-world data suggest up to 50% of treated patients receive first-line BND.23,27–29 Given the high survival rate and CLL prevalence without supportive real-word data for relapsed treatment patterns annually, a patient count that is half the annual incidence may be used as a best-estimate and conservative proxy for the number of relapsed patients who will receive treatment in a given year. Therefore, the base-case population for patients with CLL who may receive BND-S or BND-L was calculated as 1.5%.
iNHL comprises approximately 40% of all NHL cases.8 SEER estimates for 2010–2016 report a five-year relative survival of 89.0% for patients with follicular lymphoma, with 719,831 prevalent cases or approximately 10-fold the annual incidence.5 NCCN Guidelines recommend therapy including BND as second-line and subsequent treatment in patients with iNHL.9 Real-world data evaluating treatment patterns in follicular lymphoma estimated 5–42% of patients receive second-line and beyond therapy,30–32 with a range of 6–26% receiving BND as part of this therapy.30–33 The model assumed these patients progressed during or within six months of treatment with rituximab or a rituximab-based regimen, per the BND US prescribing information (USPI), and may also be receiving BND treatment beyond second-line, increasing the patient count potentially receiving BND in a given year. Using the second-line follicular lymphoma treatment patterns as a low-estimate proxy for those of iNHL, the model assumed 50% of patients with iNHL receive second-line or beyond at any given time, and 30% of those patients receive BND. With the relatively high five-year survival rate and associated prevalence, the model assumed prevalent cases opting into second-line and beyond therapy in a given year is three-fold the annual incidence patient count. Therefore, the base-case population for patients with iNHL who may receive BND-S or BND-L was set at 1.0%.
Market Share
Marketplace dynamics are critical to budget impact models in terms of existing product utilization and the effect of newer treatments on this utilization, including rate of adoption. It was assumed that current utilization is evenly split among BND-S and BND-L and projects BND-S will achieve 100% of this market in the future (see Table 2). The number of treated patients for each product and indication was calculated based on default population inputs. It was assumed that patients undergoing treatment would not switch their current treatment regimen during the year. Based on these assumptions, a total of 125 patients of the 250 included in the model were transferred to BND-S treatment from BND-L.
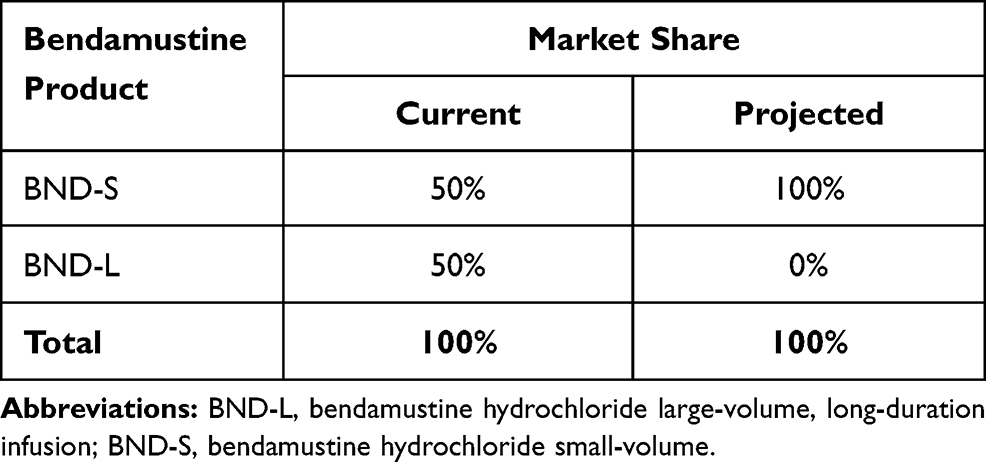 |
Table 2 Market Share Input Parameters |
Costs
To estimate budgetary costs, the model included both acquisition and administration costs. Budgetary costs reflect facility expenditures (vs billed charges) and do not include payer reimbursement. As shown in Table 3, product dosing was based on the FDA-recommended regimen per indication, according to the USPIs for BND-S and BND-L, dosed according to body surface area (BSA).13,14 The treatment of CLL is 100 mg/m2 on days one and two of a 28-day cycle, up to six cycles. As such, CLL was assumed to require 12 doses within one calendar year. The treatment of iNHL that has progressed during or within six months of treatment with rituximab or a rituximab-containing regimen is 120 mg/m2 administered intravenously (IV) on days one and two of a 21-day cycle, up to eight cycles. As such, the model assumed a total of 16 doses per patient with iNHL within one calendar year. A patient BSA of 1.80 m2 was used for calculating base-case dosing, based on two large observational studies estimating average BSA of patients receiving chemotherapy in the United Kingdom (UK).34,35 For conservatively estimated effective cost calculations, default per patient annual dose counts were assumed to be the USPI dosing maximum of 12 for CLL and 8 for iNHL.
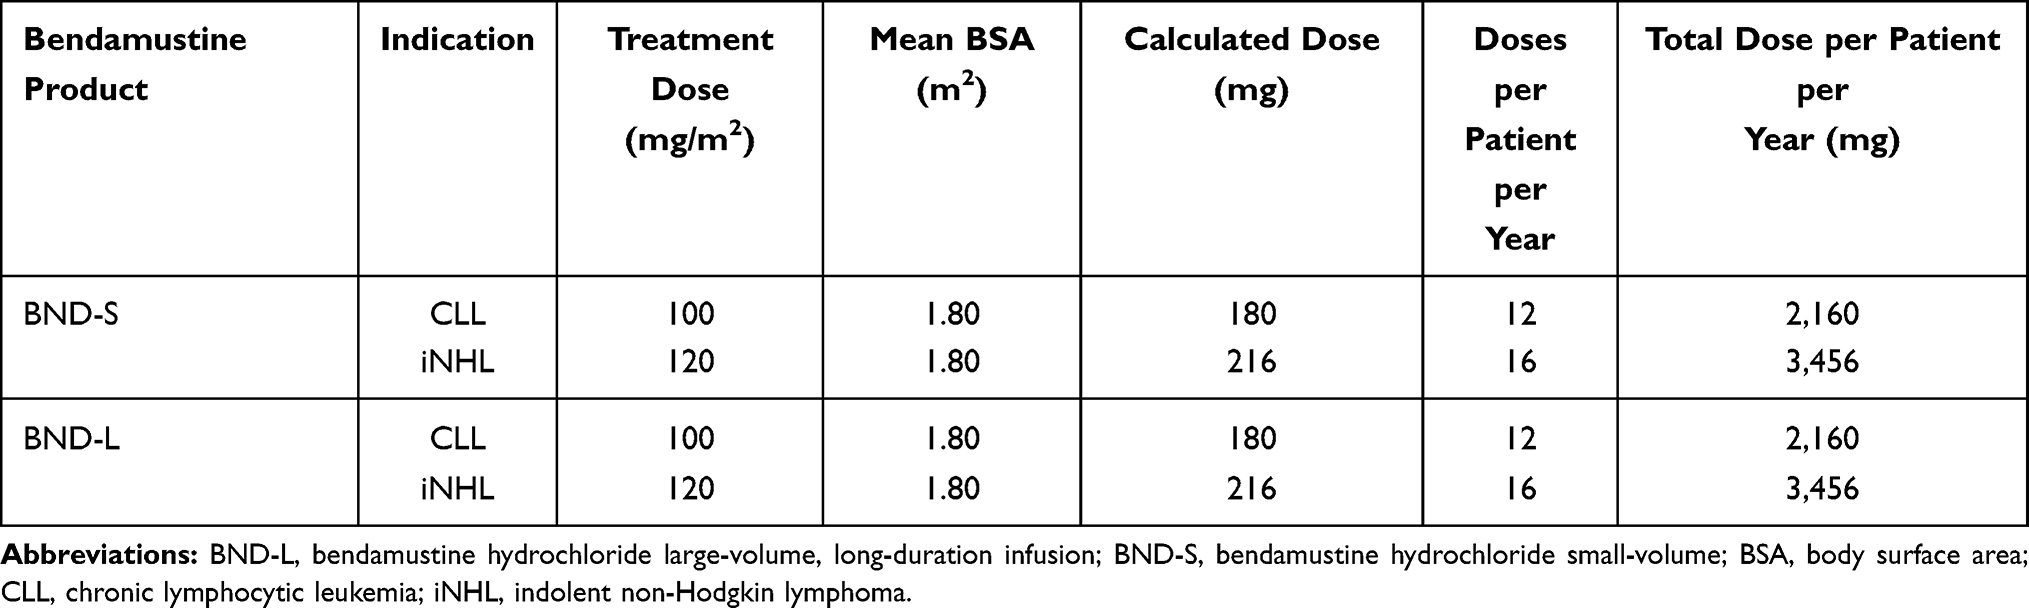 |
Table 3 Bendamustine Product Dosing |
Acquisition Costs
Annual drug costs were calculated by total milligrams administered per patient (see Supplemental Table 1); rounding of doses to account for number of product vials was not necessary, as BND-S and BND-L are supplied in multi-use vials. Because products have equivalent BSA-based dosing, efficacy, and safety, costs for FDA-recommended IV admixture supplies (other than diluent) and management of AEs were not included in the model. In addition, the cost of other chemotherapy was not included, as it was expected to be the same regardless of BND product prescribed. The model assumed that patients completed the full course of treatment according to the number of doses previously listed in Table 3 and did not include dose delays or modifications resulting from AEs.
BND-S may be diluted with 50 mL of 0.9% Sodium Chloride Injection, United States Pharmacopoeia (USP), 2.5% Dextrose/0.45% Sodium Chloride Injection, USP, or 5% Dextrose Injection, USP. BND-L may be diluted with 500 mL of 0.9% Sodium Chloride Injection, USP, or 2.5% Dextrose/0.45% Sodium Chloride Injection, USP. Within a given facility, prescriber selection of diluent may vary by patient. As such, an assumed distribution was assigned per facility in the base-case analysis across FDA-approved diluents per product (see Supplemental Table 2). This diluent distribution per facility included patients receiving BND-S and BND-L for both FDA-approved indications.
Costs for drug products and diluents were based on current wholesale acquisition costs (WACs) from Red Book Online® October 2020.36 Diluent acquisition costs in the model represented the 25th percentile of products available on Red Book Online, recognizing that there are negotiated rates and many identical products on the market, accounting for lower acquisition costs. Red Book Online did not include a WAC for 2.5% Dextrose/0.45% Sodium Chloride Injection, USP, 500 mL; as such, the WAC for this diluent is for a 1000-mL product. The model assumed the remaining unused diluent in each product’s preparation is wasted. Any applicable differences from WAC based on contracted rate negotiations and/or manufacturer rebates were not included in the base-case analysis. The net difference in effective WACs per patient per year is included in Table 4.
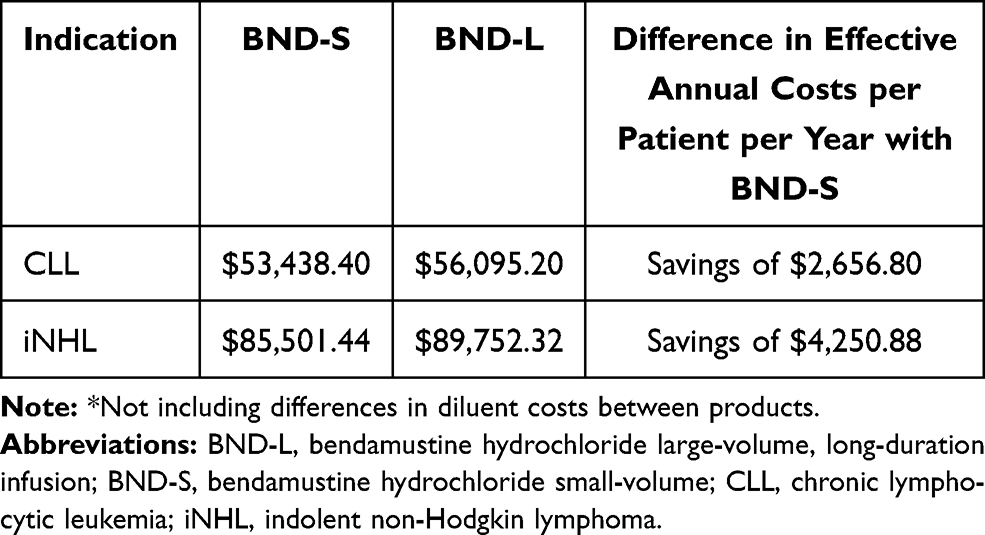 |
Table 4 Incremental Acquisition Costs for Bendamustine Products* |
Administration Costs
Both BND-S and BND-L were assumed to be administered by a health care provider in the facility setting; administration time was based on product USPIs.13,14 BND-S is administered IV over 10 minutes, whereas BND-L is administered IV over 30 minutes in CLL and over 60 minutes in iNHL. The base-case hourly wage for facility chemotherapy infusion nurses was $38.86, based on the 2019 US Department of Labor Bureau of Labor Statistics (BLS) mean hourly wage for registered nurses employed in specialty hospitals.37 The drug administration labor costs by product and indication are shown in Supplemental Table 3. The net difference in administration costs per patient per year is included in Table 5.
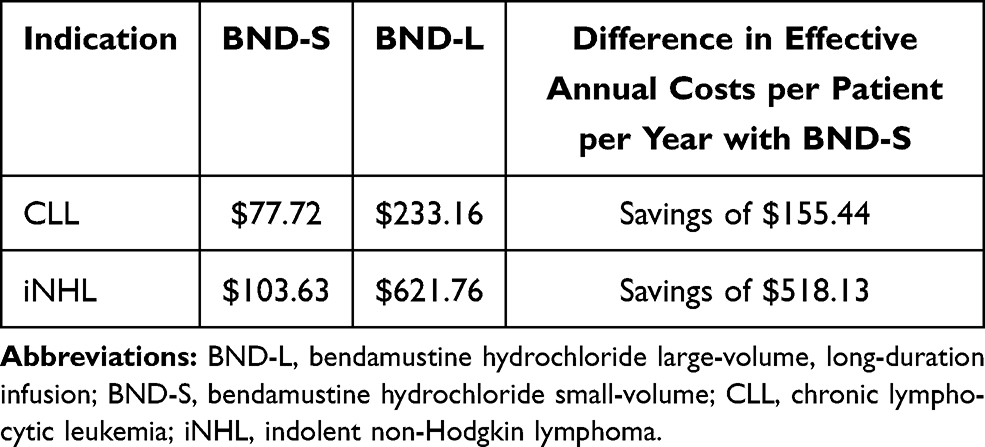 |
Table 5 Incremental Administration Labor Costs for Bendamustine Products |
Sensitivity Analyses
In order to explore uncertainty associated with the base-case scenario, a series of one-way (univariate) sensitivity analyses were conducted to test the impact of changing key model inputs on the results. These inputs included treated populations, patient BSA, market share, acquisition costs, and administration costs. Parameters were varied individually with equal increase and decrease for each parameter, with proportion values not to exceed 100%, in an attempt to reflect each parameter’s true uncertainty, in accordance with the most recent ISPOR guidelines.18 Scenarios were displayed in the form of a tornado diagram.
Scenario Analyses
Two scenario analyses were performed. With the substantial uncertainty around and known variation in facility size within the US, the budget impact was calculated for a “small” and “large” facility, using a 50% reduction and 50% increase in patient count, respectively. Variation also exists among facilities with respect to their drug contract pricing and supply. For example, a given clinic may stock only one of the bendamustine products. As such, a scenario analysis was performed in which 100% of utilization was switched from BDN-L to BND-S.
Results
The base-case analysis results represent one-year facility costs. Total per-patient savings with BND-S use after the utilization shift were estimated at $2812.24 for CLL and $4769.01 for iNHL (Table 6). The total annual infusion facility incremental savings after the utilization shift were estimated at $452,209, resulting in cost savings of $150.74 PBPPM and $1808.84 PBPPY (see Table 7).
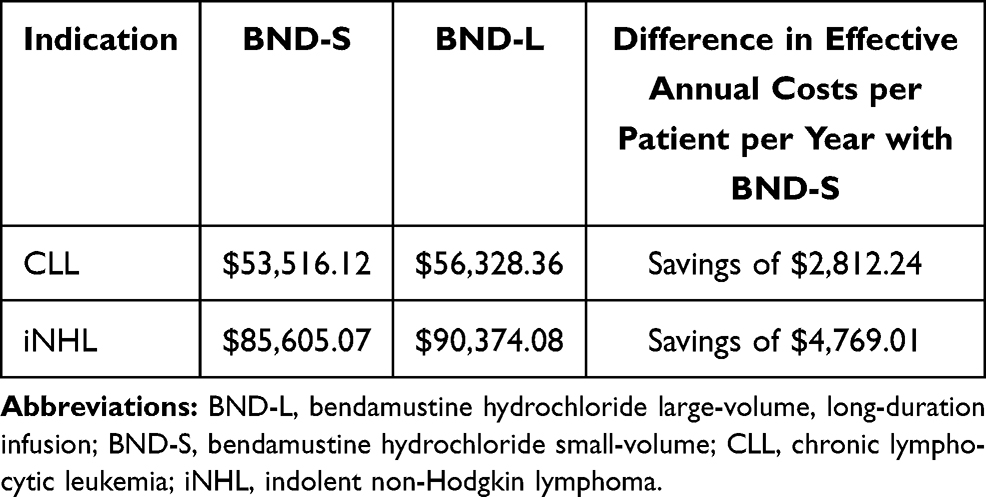 |
Table 6 Incremental Annual per-Patient Savings with BND-S |
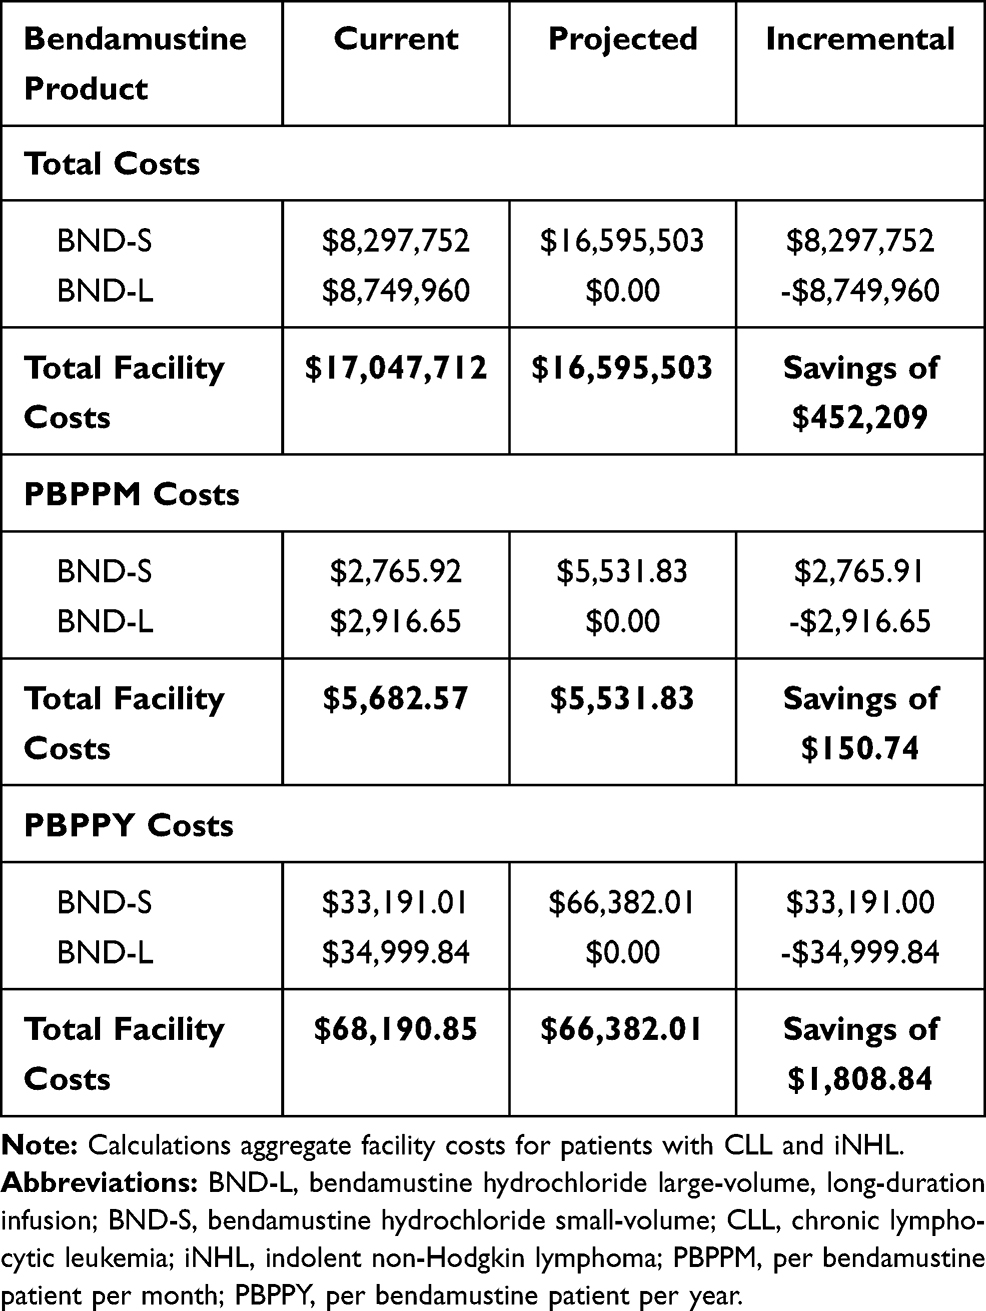 |
Table 7 Annual Facility Costs |
The sensitivity analyses for this budget impact analysis demonstrated that the model was most sensitive to changes in the proportion of patients receiving BND infusions for iNHL, mean patient BSA, BND-S WAC, and the proportion of patients receiving BND infusions for CLL (see Figure 1 and Supplemental Table 4). When the proportion of patients receiving BND infusions for iNHL was varied by 20%, total annual facility costs either increased to $18,308,318 or decreased to $14,882,689 (representing a change of ±$1,712,815); PBPPM and PBPPY increased to $5,650.72 and $67,808.58, respectively, or decreased to $5,392.28 and $64,707.34, respectively. When the mean patient BSA (across both indications) was varied by 10%, total annual facility costs either increased to $18,252,094 or decreased to $14,938,913 (±$1,656,591); PBPPM and PBPPY either increased to $6,084.03 and $73,008.37, respectively, or decreased to $4,979.64 and $59,755.65, respectively. When the BND-S WAC was varied by 10%, total annual facility costs ranged from $14,941,591 to $18,249,415 (±$1,653,912); PBPPM and PBPPY ranged from $4,980.53 to $6,083.14 and from $59,766.37 to $72,997.66, respectively. Finally, when the proportion of patients receiving BND infusions for CLL was varied by 20%, total annual facility costs ranged from $14,989,217 to $18,201,789 (±$1,606,286); PBPPM and PBPPY ranged from $5,417.20 to $5,677.73 and $65,006.39 to $68,132,81, respectively.
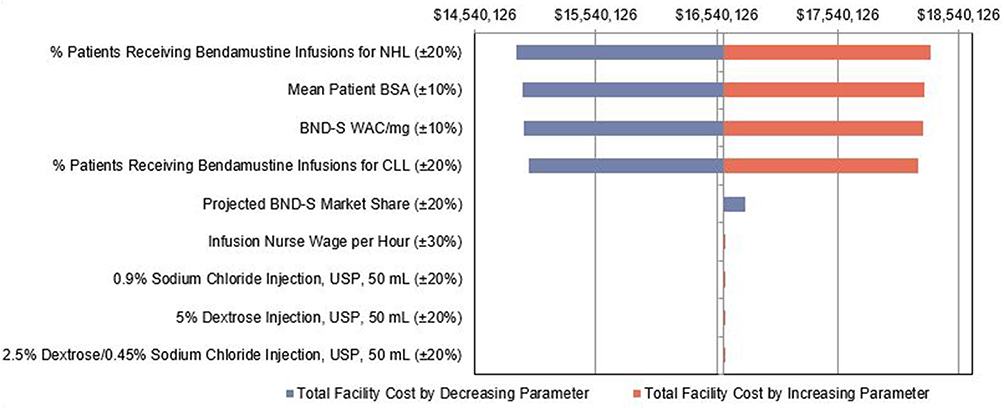 |
Figure 1 Univariate sensitivity analyses for projected annual facility costs. Abbreviations: BND-S, bendamustine small-volume, short-duration infusion; BSA, body surface area (m2); CLL, chronic lymphocytic leukemia; iNHL, indolent non-Hodgkin lymphoma; USP, United States Pharmacopoeia; WAC, wholesale acquisition cost. |
The scenario analysis evaluating the budget impact to a 50% smaller or 50% larger facility revealed the following results. A 5,000-patient chemotherapy facility has estimated total annual incremental savings of $226,104, and a 15,000-patient chemotherapy facility has estimated total annual incremental savings of $678,313. PBPPM and PBPPY values for these scenarios are the same as for the 10,000-patient chemotherapy facility. For a facility in which 100% of current bendamustine utilization was with BND-L and the illustrative switch was to 100% BND-S, total annual incremental facility savings were estimated at $904,417, with PBPPM and PBPPY incremental savings of $301.48 and $3,617.67, respectively.
Discussion
This budget impact model estimated the current costs of BND-S and BND-L for use in CLL and iNHL and projected the cost difference between the current and future utilization of these RTD BND products from the US facility perspective. The objective of this illustrative model was to communicate to healthcare decision-makers at US infusion facilities the one-year projected cost differential when BND-L utilization is replaced with BND-S. Under base-case values, the model estimated an annual savings of more than $450,000 for 250 CLL and iNHL patients in a 10,000-patient chemotherapy infusion facility. These savings were driven by lower acquisition costs for BND-S and lower administration labor costs associated with its rapid infusion. Greater utilization of BND-S also has the potential to provide additional available infusion chair time per day, which may allow facilities to treat additional patients per day.
Potential advantages of the shorter BND-S infusion time and decreased admixture volume include reductions in chair time for the patient and nursing time for drug administration, as well as reductions in the amount of sodium chloride administered to the patient.14 With identical preparation instructions, no difference in preparation or administration supply costs are expected between products. To quantify the impact on costs associated with differences between the products in nursing time for drug administration within this analysis, data from the US Department of Labor BLS were used for the mean hourly wage of registered nurse employed in specialty hospitals.37 Because the rate for specialty hospitals ($38.86 per hour) is good proxy for the infusion nurse wage at facilities that provide chemotherapy infusion services, it was used as the model’s default hourly wage. Multiplying the wage by the FDA-recommended infusion times for each of the RTD BND products resulted in drug administration labor cost savings with the use of BND-S of $155 per patient with CLL and $518 per patient with iNHL. This method of micro-costing is supported by previous work, including from the US hospital perspective for IV infused treatments for use in rheumatoid arthritis.38 Our analysis (conservatively using hourly wage alone without benefits) also found that labor costs represented a very small proportion of overall costs (<1%). The interaction of clinic staff and distribution and duration of daily nursing tasks is a complex interplay at the facility level and was therefore not included in this analysis, which was from the broader facility perspective. However, depending on a facility’s care and staffing model, in addition to more available chair time per day, the calculated labor cost savings in the analysis may be an illustrative savings that creates nursing time for additional patient care or other required clinic tasks. If nurses are paid hourly and shift times can be reduced, this may amount to a realized payroll savings.
Beyond the administration labor costs, other relevant inputs for a facility-based model included drug and admixture supply acquisition costs. While the FDA-recommended dosing for CLL and iNHL is the same for both RTD BND products, the acquisition cost of BND-L is greater than BND-S. This drug acquisition cost differential resulted in savings with the use of BND-S of $2,657 per patient with CLL and $4,251 per patient with iNHL. In addition, the acquisition cost for diluents was also projected to be greater for BND-L, due to the larger volume of diluent required for its administration. While the diluent pricing overall is marginal when compared to drug cost, the added costs further increase the savings associated with the use of BND-S.
When drug acquisition costs are comparable, facilities retain savings associated with infusion labor cost differences once payers reimburse drug costs. Estimated labor cost savings will be affected by number of sequential infusions in one day and infusion time reimbursement rates to facilities.
In addition to the clear economic advantage identified in this analysis for BND-S relative to BND-L, there are several other factors associated with BND-S use which may confer additional advantages. BND-S offers a sodium-free method of administration for patients with certain medical conditions requiring restricted sodium intake14 as it is the only RTD BND product that is approved for dilution with 5% Dextrose Injection, USP (both RTD BND products are approved for dilution with 0.9% Sodium Chloride Injection, USP, or 2.5% Dextrose/0.45% Sodium Chloride Injection, USP).13,14 BND-S admixtures using 0.9% Sodium Chloride or 2.5% Dextrose/0.45% Sodium Chloride are also stable at room temperature for twice as long as BND-L (six versus three hours, respectively).13,14 One study found a preference for BND-S formulation compared with a prior BND formulation among US oncology nurses and pharmacists given the product’s attributes that address safety, cost savings, productivity improvements, and improved workflow efficiency; domains most meaningful to the respondents.39
Limitations
Base-case model values were derived from pertinent scientific literature and publicly available cost resources in order to closely approximate a real-world budget impact. However, there are limitations in the model development and applications. The model did not take into consideration the resulting economic impact of clinical outcomes, including the risk of developing AEs and the costs associated with treating them; however, since the products are both BND at the same dose, differences in clinical outcomes would not be expected. Publicly available utilization data for bendamustine use in CLL and NHL varied among studies and geographies, and second-line use of treatments for each disease state among the respective prevalent populations in a given calendar year were not identified. Treatment patterns in CLL may have shifted since the introduction of newer agents; as such, the proportion of patients receiving bendamustine may be overestimated. There is a paucity of data on treatment patterns in the iNHL patient subset; as such, these patient proportions were estimated from FL utilization data as the most relevant proxy with publicly available treatment pattern data. While an overestimation of bendamustine use in CLL and NHL would inflate the overall savings estimated in this model, the proportional difference in savings between the formulations would not change. A similar impact on results would be expected if bendamustine utilization differed from what is included in the model based on USPIs. Mean BSA was derived from UK-based studies, which may be different for US patients. Also, current and future projected utilization are not a reflection of known facility utilization and market forecasting; rather these were assumptions used for a budget holder to consider if shifting all utilization to a single product. Finally, the gains in patient satisfaction afforded by a shorter infusion time were not included in the current model, but should be considered.
Conclusions
This budget impact model estimated an annual savings of more than $450,000 for 250 CLL and iNHL patients in a 10,000-patient chemotherapy infusion facility following a utilization shift from 50% use of each BND product to 100% use of BND-S, driven by lower acquisition costs for BND-S and lower administration labor costs associated with its rapid infusion. Any savings achieved with the use of BND-S would increase with patient volume and provide additional available infusion chair time per day. However, results may vary substantially based on facility-based drug acquisition cost contracting with drug suppliers. With existing lower acquisition and administration labor costs, faster infusion times, smaller diluent volume requirements, more diluent choices, and longer stability at room temperature, BND-S offers both economic and clinical advantages over BND-L.
Acknowledgments
Sponsorship for this study and article processing charges were funded by Teva Pharmaceuticals USA, Inc., Parsippany, NJ, USA, the manufacturer of Bendeka®. Editorial assistance in the preparation of this manuscript was provided by Jason Allaire, PhD, of Generativity Solutions Group, Cary, NC, USA. Support for this assistance was funded by Teva Pharmaceuticals USA, Inc., Parsippany, NJ, USA. This data was presented at Annual Meeting of the International Society for Pharmacoeconomics and Outcomes Research (virtual) May 18-20, 2020.
Author Contributions
All authors made a significant contribution to the work reported, whether that is in the conception, study design, execution, acquisition of data, analysis and interpretation, or in all these areas; took part in drafting, revising or critically reviewing the article; gave final approval of the version to be published; have agreed on the journal to which the article has been submitted; and agree to be accountable for all aspects of the work.
Disclosure
Dr Elizabeth James, Dr Holly Trautman received consulting fees from Teva Pharmaceuticals. Mrs Rinat Ribalov is an employee of Teva Pharmaceuticals and reports personal fees for services and generativity from Aventine to conduct the study. Stephen Thompson and Azhar Choudhry are employees of Teva Branded Pharmaceutical Products R&D, Inc. The authors report no other conflicts of interest in this work.
References
1. Hallek M. Chronic lymphocytic leukemia: 2015 update on diagnosis, risk stratification, and treatment. Am J Hematol. 2015;90(5):446–460. doi:10.1002/ajh.23979
2. Chiorazzi N, Rai KR, Ferrarini M. Chronic lymphocytic leukemia. N Engl J Med. 2005;352(8):804–815.
3. Eichhorst B, Dreyling M, Robak T, Montserrat E, Hallek M; ESMO Guidelines Working Group. Chronic lymphocytic leukemia: ESMO Clinical Practice Guidelines for diagnosis, treatment and follow-up. Ann Oncol. 2011;22(Suppl 6):vi50–4.
4. American Cancer Society. Cancer facts & figures 2020 Available from: https://www.cancer.org/content/dam/cancer-org/research/cancer-facts-and-statistics/annual-cancer-facts-and-figures/2020/cancer-facts-and-figures-2020.pdf.
5. Howlader N, Noone AM, Krapcho M, et al., eds. Surveillance, Epidemiology, and End Results (SEER) Cancer Statistics Review, 1975-2017. Bethesda, MD: National Cancer Institute. Available from: https://seer.cancer.gov/csr/1975_2017/.
6. Chiu BC, Hou N. Epidemiology and etiology of non-hodgkin lymphoma. Cancer Treat Res. 2015;165:1–25.
7. Armitage JO, Gascoyne RD, Lunning MA, Cavalli F. Non-Hodgkin lymphoma. Lancet. 2017.
8. Leukemia and Lymphoma Society Treatment for indolent NHL subtypes Available from: https://www.lls.org/lymphoma/non-hodgkin-lymphoma/treatment/treatment-for-indolent-nhl-subtypes.
9. National Comprehensive Cancer Network. NCCN Clinical Practice Guidelines in Oncology (NCCN Guidelines®). B-cell Lymphomas. Version 4.2020. 2020.
10. Scarfo L, Ferreri AJ, Ghia P. Chronic lymphocytic leukaemia. Crit Rev Oncol Hematol. 2016;104:169–182.
11. Dreyling M, Ghielmini M, Rule S, et al. Newly diagnosed and relapsed follicular lymphoma: ESMO Clinical Practice Guidelines for diagnosis, treatment and follow-up. Ann Oncol. 2016;27(suppl 5):v83–v90.
12. Teva Pharmaceuticals USA, Inc. Treanda® (Bendamustine Hydrochloride Injection and Bendamustine Hydrochloride for Injection) Prescribing Information. North Wales, PA.
13. Eagle Pharmaceuticals, Inc. Belrapzo™ (bendamustine hydrochloride injection), for intravenous use, prescribing information. Woodcliff Lake, NJ 2020 Available from: https://belrapzo.com/.
14. Teva Pharmaceuticals USA, Inc. Bendeka® (Bendamustine Hydrochloride Injection), for Intravenous Use, Prescribing Information. North Wales, PA; 2019.
15. Food and Drug Administration. Guidance for Industry: Applications Covered by Section 505(b)(2). Draft Guidance October 1999 Available from: https://www.fda.gov/media/72419/download.
16. Cheung EM, Edenfield WJ, Mattar B, et al. Safety and pharmacokinetics of bendamustine rapid-infusion formulation. J Clin Pharmacol. 2017;57(11):1400–1408.
17. Edenfield WJ, Mattar B, Anthony SP, Mutch P, Chanas B, Smith M, editors. Phase 1, open-label, randomized, bioequivalence study of 2 bendamustine hydrochloride formulations; a ready-to-dilute low-volume, rapid infusion solution and a lyophilized powder formulation. Blood. 2015;126(23):4857.
18. Sullivan SD, Mauskopf JA, Augustovski F, et al. Budget impact analysis-principles of good practice: report of the ISPOR 2012 budget impact analysis good Practice II Task Force. Value Health. 2014;17(1):5–14.
19. Yu S Infusion center insights: how do your chemo nurse staffing numbers compare? July 24, 2019. Published in Advisory Board: Oncology Rounds. Available from: https://www.advisory.com/research/oncology-roundtable/oncology-rounds/2016/03/infusion-center-insights-staffing.
20. Bach S, editor. Scheduling and Patient Flow in an Outpatient Chemotherapy Infusion Center. Montreal, Canada: Institute of Industrial & Systems Engineers (ISERC);2014 June2. Presentation.
21. Richardson D, Rouhana M, editors. Improving outpatient flow in a chemotherapy infusion center.
22. United States Census Bureau. 2019 American Community Survey (ACS) annual estimates of the resident population (Table DP05) Available from: https://data.census.gov/cedsci.
23. Seymour EK, Ruterbusch JJ, Beebe-Dimmer JL, Schiffer CA. Real-world testing and treatment patterns in chronic lymphocytic leukemia: a SEER patterns of care analysis. Cancer. 2019;125(1):135–143.
24. Ammann EM, Shanafelt TD, Larson MC, et al. Time to second-line treatment and subsequent relative survival in older patients with relapsed chronic lymphocytic leukemia/small lymphocytic lymphoma. Clin Lymphoma Myeloma Leuk. 2017;17(12):e11–e25.
25. Campo E, Cymbalista F, Ghia P, et al. TP53 aberrations in chronic lymphocytic leukemia: an overview of the clinical implications of improved diagnostics. Haematologica. 2018;103(12):1956–1968.
26. National Comprehensive Cancer Network. NCCN Clinical Practice Guidelines in Oncology (NCCN Guidelines®). Chronic Lymphocytic Leukemia/Small Lymphocytic Leukemia. Version 2.2021. December 3, 2020.
27. Emond B, Sundaram M, Romdhani H, Lefebvre P, Wang S, Mato A. Comparison of time to next treatment, health care resource utilization, and costs in patients with chronic lymphocytic leukemia initiated on front-line ibrutinib or chemoimmunotherapy. Clin Lymphoma Myeloma Leuk. 2019;19(12):763–75.e2.
28. Kabadi SM, Goyal RK, Nagar SP, Kaye JA, Davis KL. Treatment patterns, adverse events, and economic burden in a privately insured population of patients with chronic lymphocytic leukemia in the United States. Cancer Med. 2019;8(8):3803–3810.
29. Huang SJ, Gerrie AS, Young S, et al. Comparison of real-world treatment patterns in chronic lymphocytic leukemia management before and after availability of ibrutinib in the province of British Columbia, Canada. Leuk Res. 2020;91:106335.
30. Batlevi CL, Sha F, Alperovich A, et al. Follicular lymphoma in the modern era: survival, treatment outcomes, and identification of high-risk subgroups. Blood Cancer J. 2020;10(7):74.
31. Morrison VA, Shou Y, Bell JA, et al. Treatment patterns and survival outcomes in patients with follicular lymphoma: a 2007 to 2015 Humedica database study. Clin Lymphoma Myeloma Leuk. 2019.
32. Ren J, Asche CV, Shou Y, Galaznik A. Economic burden and treatment patterns for patients with diffuse large B-cell lymphoma and follicular lymphoma in the USA. J Comp Eff Res. 2019.
33. Fowler NH, Chen G, Lim S, Manson S, Ma Q, Li FY. Treatment patterns and health care costs in commercially insured patients with follicular lymphoma. J Health Econ Outcomes Res. 2020;7(2):148–157.
34. Sacco JJ, Botten J, Macbeth F, Bagust A, Clark P. The average body surface area of adult cancer patients in the UK: a multicentre retrospective study. PLoS One. 2010;5(1):e8933.
35. Wallington M, editor Variations in body surface area of patients receiving chemotherapy treatment in England.
36. Dhongde S. Multidimensional economic deprivation during the coronavirus pandemic: early evidence from the United States. PLoS One. 2020;15(12):e0244130.
37. United States Department of Labor - Bureau of Labor Statistics. Occupational employment and wages, 2019: 29–1141. Available from: https://www.bls.gov/oes/current/oes291141.htm.
38. Schmier J, Ogden K, Nickman N, et al. Costs of providing infusion therapy for rheumatoid arthritis in a Hospital-based Infusion Center Setting. Clin Ther. 2017;39(8):1600–1617.
39. Gabriel S, Welstead J, Shockley S, Barr P. An in-depth interview study of oncology nurses and infusion pharmacists of bendamustine product attributes that drive relative product preferences. J Clin Oncol. 2017;35(suppl;abstract e19007).
 © 2021 The Author(s). This work is published and licensed by Dove Medical Press Limited. The full terms of this license are available at https://www.dovepress.com/terms.php and incorporate the Creative Commons Attribution - Non Commercial (unported, v3.0) License.
By accessing the work you hereby accept the Terms. Non-commercial uses of the work are permitted without any further permission from Dove Medical Press Limited, provided the work is properly attributed. For permission for commercial use of this work, please see paragraphs 4.2 and 5 of our Terms.
© 2021 The Author(s). This work is published and licensed by Dove Medical Press Limited. The full terms of this license are available at https://www.dovepress.com/terms.php and incorporate the Creative Commons Attribution - Non Commercial (unported, v3.0) License.
By accessing the work you hereby accept the Terms. Non-commercial uses of the work are permitted without any further permission from Dove Medical Press Limited, provided the work is properly attributed. For permission for commercial use of this work, please see paragraphs 4.2 and 5 of our Terms.