")
Back to Journals » ClinicoEconomics and Outcomes Research » Volume 9
Budget impact of somatostatin analogs as treatment for metastatic gastroenteropancreatic neuroendocrine tumors in US hospitals
Authors Ortendahl JD, Pulgar SJ, Mirakhur B, Cox D, Bentley TGK, Phan AT
Received 2 May 2017
Accepted for publication 20 July 2017
Published 16 August 2017 Volume 2017:9 Pages 495—503
DOI https://doi.org/10.2147/CEOR.S140866
Checked for plagiarism Yes
Review by Single anonymous peer review
Peer reviewer comments 2
Editor who approved publication: Professor Giorgio Colombo
Jesse D Ortendahl,1 Sonia J Pulgar,2 Beloo Mirakhur,3 David Cox,3 Tanya GK Bentley,1 Alexandria T Phan4
1Health Economics, Partnership for Health, LLC, Beverly Hills, CA, USA; 2Health Economics and Outcomes Research, Ipsen Biopharmaceuticals, Basking Ridge, NJ, USA; 3Medical Affairs, Oncology, Ipsen Biopharmaceuticals, Basking Ridge, NJ, USA; 4GI Medical Oncology, University of New Mexico Comprehensive Cancer Center, Albuquerque, NM, USA
Objective: With the introduction of new therapies, hospitals have to plan spending limited resources in a cost-effective manner. To assist in identifying the optimal treatment for patients with locally advanced or metastatic gastroenteropancreatic neuroendocrine tumors, budget impact modeling was used to estimate the financial implications of adoption and diffusion of somatostatin analogs (SSAs).
Patients and methods: A hypothetical cohort of 500 gastroenteropancreatic neuroendocrine tumor patients was assessed in an economic model, with the proportion with metastatic disease treated with an SSA estimated using published data. Drug acquisition, preparation, and administration costs were based on national pricing databases and published literature. Octreotide dosing was based on published estimates of real-world data, whereas for lanreotide, real-world dosing was unavailable and we therefore used the highest indicated dosing. Alternative scenarios reflecting the proportion of patients receiving lanreotide or octreotide were considered to estimate the incremental budget impact to the hospital.
Results: In the base case, 313 of the initial 500 gastroenteropancreatic neuroendocrine tumor patients were treated with an SSA. The model-predicted per-patient cost was US$83,473 for lanreotide and US$89,673 for octreotide. With a hypothetical increase in lanreotide utilization from 5% to 30% of this population, the annual model-projected hospital costs decreased by US$488,615. When varying the inputs in one-way sensitivity analyses, the results were most sensitive to changes in dosing assumptions.
Conclusion: Results suggest that factors beyond drug acquisition cost can influence the budget impact to a hospital. When considering preparation and administration time, and real-world dosing, use of lanreotide has the potential to reduce health care expenditures associated with metastatic gastroenteropancreatic neuroendocrine tumor treatments.
Keywords: health economics, oncology, model, costs, real-world evidence, lanreotide
Introduction
Gastroenteropancreatic neuroendocrine tumors (GEP-NETs) are rare neoplasms that originate from the secretory cells of the neuroendocrine system.1,2 Recent analyses have suggested that the incidence of neuroendocrine tumors (NETs) is increasing and that the prevalence of NETs in the USA may exceed 100,000.3,4 While there is no single treatment algorithm that is used universally, surgical procedures are typically performed for curative purposes. In patients for whom surgery is not possible, palliative options, including somatostatin analogs (SSAs), are used to reduce tumor burden in locally advanced and metastatic gastrointestinal neuroendocrine tumors and pancreatic neuroendocrine tumors.5 Lanreotide depot (Somatuline Depot), an SSA, is currently approved in the USA to improve progression-free survival (PFS) for adult patients with unresectable, well or moderately differentiated, locally advanced or metastatic GEP-NETs. Another SSA used in this patient population is octreotide long-acting release (Sandostatin LAR), which is US Food and Drug Administration approved to treat severe diarrhea/flushing episodes associated with metastatic carcinoid tumors. These agents were assessed in two double-blind, placebo-controlled trials: the PROMID study for octreotide LAR6 and the CLARINET trial for lanreotide depot.7 CLARINET was an international study across 14 countries that enrolled 204 patients with tumors originating from the midgut, as well as those with tumors originating in the pancreas and hindgut. PROMID was conducted in Germany and included 85 patients with NETs originating in the midgut and those with unknown tumor origin but suspected to be from the midgut. Both SSAs were assessed at their maximum recommended doses in the USA, 120 mg lanreotide and 30 mg octreotide injections, each administered once every 4 weeks. Both trials found statistically significant differences in the hazard ratio for progression or death for the SSAs compared to placebo. At the conclusion of the CLARINET trial, median PFS for patients treated with placebo was 18.0 months, while the median PFS for patients receiving lanreotide was not reached at 96 weeks. During the CLARINET open-label extension study, the median PFS for lanreotide was reached and estimated to be 32.8 months. The extension study also found fewer adverse events than during the core study for lanreotide patients, suggesting favorable long-term safety and tolerability.8 Those who survived through the conclusion of the PROMID study were further monitored, although treatment was left to the discretion of the local investigators and crossover was allowed. During this follow-up period, the overall survival was similar in patients receiving octreotide LAR (84.7 months) or placebo (83.7 months).9 Both lanreotide depot and octreotide LAR are included in the National Comprehensive Cancer Network treatment consensus guidelines and the National Comprehensive Cancer Network compendium.10,11 Therefore, a comparison of these two agents as treatments for GEP-NET patients is necessary despite differences in indications.
Increasing health care costs are well documented, and efforts to control costs are underway.12–14 In all disease areas, and especially in oncology, clinical decision makers face competing demands for limited resources and must determine methods for choosing optimal treatments for their patients. One consideration in this choice of pharmacologic interventions is evaluation of product acquisition and overall treatment costs. The focus on the cost of care goes beyond the costs incurred by health care payers, as a shift in payment landscape has led to changes where now providers and hospital systems also take on risk and are incentivized to control expenditures. Although the bottom line impact on a hospital system includes both the resources utilized and the corresponding reimbursement, these are often considered independently. In most scenarios, hospitals aim to decrease costs regardless of reimbursement environment, with the objective of increasing the efficiency and decreasing the overall costs to ensure optimal and successful delivery of care to patients.
Budget impact modeling is one method used to evaluate the cost of health care delivery. In such analyses, relevant costs for treating a given disease are incorporated into a mathematical model, and outcomes are assessed when varying allocation of patients across treatments.15,16 Budget impact models may consider factors that would impact the financial implications of treatment choice and predict health expenditures for a given disease over a finite period without considering explicit assumptions regarding the efficacy or safety beyond the financial impact of these important clinical outcomes. Results are beneficial in understanding how different factors impact overall costs and provide one piece of information to aid in allocating resources effectively and efficiently.
In treating metastatic GEP-NET (mGEP-NET) patients, the financial impact of treatment choice is unclear. There is significant variation in real-world dosing of SSAs, the injection method and success rate differ between treatments, and there are differences in preparation and administration time required for each therapy. This analysis of the overall costs of different SSAs will help institutional and hospital decision makers better identify potential sources of cost savings and efficiency.
Patients and methods
Overview
An economic model was developed to estimate the budget impact of treating patients with mGEP-NETs using SSAs. The model compared two scenarios, the first scenario reflective of a hypothetical baseline utilization of lanreotide or octreotide and then an alternative scenario based on a hypothetical shift in utilization. Model inputs consisted of population data, relevant costs, and treatment utilization. The model assessed patients over a 1-year period, and outcomes included annual costs to a hospital system and the average cost per treated patient. The model schematic is shown in Figure 1.
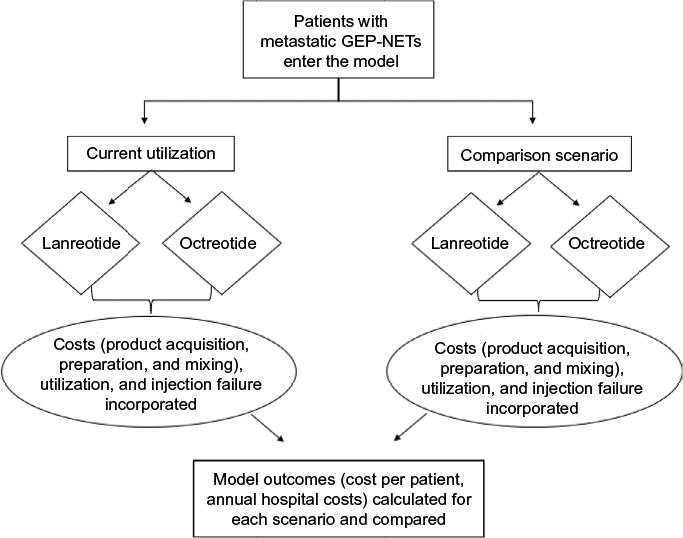 | Figure 1 Model schematic. Notes: The model schematic shows the flow of patients through the model for the two scenarios. In each scenario, those eligible for somatostatin analogs are treated with either lanreotide or octreotide. For each treatment, patients accrue costs based on the product acquisition and administration costs, which take into account dosing and the impact of failed injections. Total costs are estimated for each scenario, and compared to assess the costs of shifting utilization. Abbreviation: GEP-NETs, gastroenteropancreatic neuroendocrine tumors. |
Model inputs
The model included the following categories of inputs: population and epidemiologic estimates, product acquisition and preparation/mixing costs, and product utilization. Inputs were based on published literature and pricing databases to the extent possible, and supplemented with market share data and expert opinion.
To estimate the financial impact for a hospital system or oncology department, we identified the expected number of patients eligible for treatment with an SSA at such facilities. To do so, we made an initial assumption that the facility would treat 500 GEP-NET patients annually. Of these, the patients included in the model were limited to those with metastatic disease and eligible for treatment with an SSA. A previously published US analysis found 80% of GEP-NET patients to be metastatic, a proportion similar to more recent estimates from outside the USA.17–20 Of these patients, it was assumed that 78% would be eligible for treatment with an SSA, based on a previously conducted US-based survey of physicians.21
Costs considered in the model included those related to product acquisition as well as preparation and mixing (Table 1). Product acquisition costs were calculated based on wholesale acquisition costs as of January 2017.22 Lanreotide depot is available in single-use, prefilled syringes of 60, 90, and 120 mg, and octreotide LAR is sold as single-use kits of 10, 20, and 30 mg that require reconstitution.22–24 Multiple sources suggest that many patients receive above-indication dosing of octreotide, and this was incorporated as a base case assumption in the model.20,25–30 Because the maximum package size is 30 mg, we assumed that patients receiving above maximum doses were administered a single injection of two 20 mg kits (for a 40 mg injection) or a single injection using two 30 mg kits (for a 60 mg injection). To incorporate the time cost of preparing, mixing, and administering each product, we used publicly available wage rates and multiplied them by a published observational study of time spent preparing each product. It was assumed that a nurse practitioner would be preparing and administering injections, and we therefore used a wage rate from May 2014 for such a nurse in a specialty hospital.31 Time estimates were 329 seconds per injection for octreotide and 66 seconds for lanreotide, with differences due to additional efforts for octreotide because it requires reconstitution.32
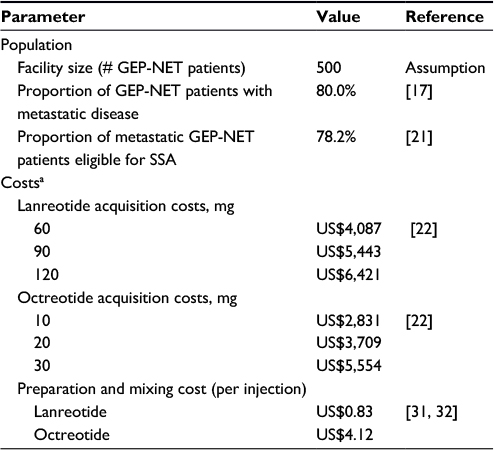 | Table 1 Model population and cost parameters Note: aAcquisition costs based on WAC as of 01/24/2017. Abbreviations: GEP-NET, gastroenteropancreatic neuroendocrine tumor; SSA, somatostatin analog; WAC, wholesale acquisition costs. |
To estimate the total costs for the hospital system, the costs per treated patient were multiplied by the number of patients receiving each dose for both products across the two scenarios. In the first scenario, 5% of patients received lanreotide and 95% of patients received octreotide, based on an unpublished claims analysis of US patients from 2008 to 2010. An alternative scenario assumed a hypothetical shift in utilization, leading to 30% of patients receiving lanreotide and 70% receiving octreotide. In both scenarios, the same amount of each product and frequency of injection was used. For lanreotide, currently, there are no studies in the USA reporting utilization beyond the maximum indicated dose of 120 mg every 4 weeks; therefore, it was assumed all patients were treated in this manner. For octreotide, while the maximum indicated dose is 30 mg every 4 weeks, multiple sources report a significant portion of patients receiving either higher doses or more frequent injections.20,25–30 Based on a previously published assessment of seven National Comprehensive Cancer Network treatment centers, it was assumed that 64% of patients received the maximum dose of 30 mg every 4 weeks, while 36% of patients received octreotide either more frequently or at a higher dose.30 Specifically, 18% were treated with octreotide at either 40 or 60 mg every 4 weeks and 18% received injections once every 3 weeks or once every 2 weeks.30 Product utilization parameters are shown in Table 2.
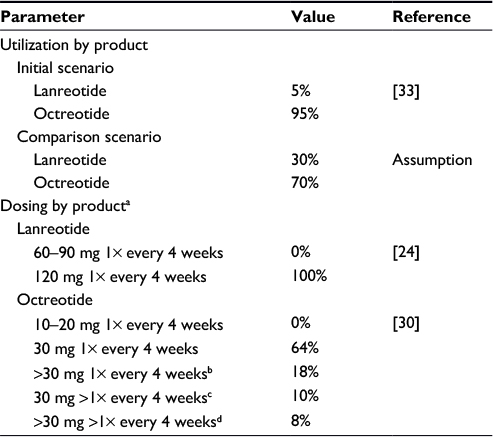 | Table 2 Product utilization parameters Notes: aDosing equivalent across scenarios. bAmong patients receiving >30 mg injections, 14% received 40 mg delivered as two 20 mg injections and 4% received 60 mg administered as two 30 mg injections. cAmong patients receiving octreotide more frequently than once every 4 weeks, 3% received injections once every 3 weeks and 7% received injections every 2 weeks. dAmong patients receiving >30 mg more frequently than once every 4 weeks, 6% received 40 mg every 3 weeks and 2% received 60 mg every 3 weeks. |
Analyses
In the base case, we assessed the costs of treating patients with either SSA treatment. These results were presented in terms of the total cost per treated patient, and divided between those related to product acquisition and those related to preparation and mixing. We also calculated the financial implications of a shift in utilization of products between the initial scenario and the alternative scenario, to show the incremental cost of an increase in lanreotide utilization. In sensitivity analyses, key parameters were varied to assess the impact on model outcomes. Additionally, a scenario analysis was conducted to explore the impact of injection failure. In the base case, it was assumed there was no financial impact of injection failure. However, in this scenario, we assumed that 25% of octreotide injections did not reach the intramuscular level, based on findings from a quality improvement study conducted at MD Anderson with trained health care providers,33 and in those cases, we assumed a repeat injection was needed.
Results
Base case
In the base case analysis, the model predicted that each patient treated with lanreotide would accrue an annual cost of US$83,473, compared to US$89,673 for octreotide. The current practice patterns, which indicate a mix of 5% of patients receiving lanreotide and 95% of patients receiving octreotide, would result in annual costs of US$27,970,455 for a hospital with 500 GEP-NET patients. With a shift in utilization leading to 30% of patients receiving lanreotide and 70% receiving octreotide, this cost decreased to US$27,481,840, resulting in cost savings of US$488,615. While the magnitude of cost savings will depend on the proportion of patients shifting treatment, there was a linear relationship between increasing lanreotide utilization and reducing costs. Cost savings for lanreotide were driven both by the difference in product acquisition costs between products at commonly used doses as well as the reduction in preparation and mixing costs with lanreotide. Base case results are presented in Table 3.
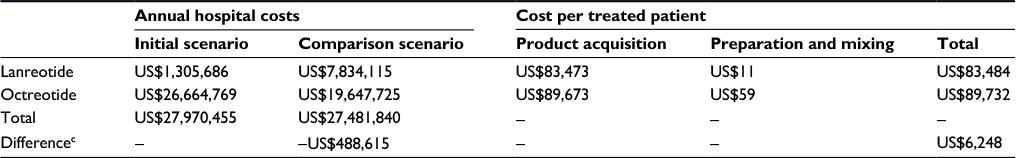 | Table 3 Base case resultsa,b Notes: aCurrent utilization defined as market share today, and comparison scenario defined as a hypothetical change in market share. bCosts include medications, administration, and mixing. cDifference reflects the change in total costs between the baseline and the comparator year. A negative number denotes a cost savings in comparator year. |
Sensitivity analyses
In one-way sensitivity analyses examining uncertainty in each parameter individually, we found that the results were most sensitive to assumptions related to proportion of patients receiving above-indication dosing of octreotide and the acquisition costs of the two products. When it was assumed that all patients on octreotide received a single 30 mg injection once every 4 weeks, the model predicted that a shift in utilization would result in an increase in costs of US$878,489. If the proportion of octreotide patients with above-indicated dosing increased from the base case value of 36%–50%, the decrease in costs with additional lanreotide treatment was US$1,030,874. When the proportion of octreotide patients receiving above-indicated dosing was 23%, the two scenarios were roughly equivalent. When varying the acquisition costs of lanreotide ±20%, the budgetary impact with a shift in utilization ranged from a savings of US$1,794,133 to a cost increase of US$816,903, respectively. A similar change in octreotide pricing led to incremental costs between the current and comparator scenarios of an increase in costs of US$913,868 to a savings of US$1,891,098. Other parameters, such as the preparation and mixing costs, had a minimal impact on the results. The model inputs with the largest impact on model results are shown in the tornado diagram (Figure 2).
 | Figure 2 Sensitivity analysis results: tornado diagram. Notes: The sensitivity analysis tornado diagram indicates the impact of parameter uncertainty on the model outcomes. Each horizontal bar shows the range of differences in costs of the comparator scenario compared with the status quo scenario when varying a given parameter by ±20%. As depicted, the parameter with the greatest impact on model results was product acquisition costs, followed by the proportion of patients getting above-indicated dosing of octreotide. |
Scenario analysis
When considering the possibility of intramuscular injection failure, as is possible with octreotide but not lanreotide which is administered via deep subcutaneous injection, we found that at 25% failure and assuming a repeat injection upon failure, the cost saving with a shift in utilization was US$2,242,876. If the failure rate was half of the published value, or 12.5%, the savings with increased lanreotide utilization was US$1,365,746 for the hospital, or US$17,465 per treated patient.33
Discussion
In this model-based analysis, we found that increasing utilization of lanreotide would result in cost savings to the hospital system. While the base case result of US$488,615 in savings was based on a specific shift from 5% to 30% utilization of lanreotide within a hospital with 500 GEP-NET patients, the more general finding was that any shift toward higher lanreotide use would reduce expenditures. When comparing agents at the highest indicated dose, lanreotide is more expensive than octreotide. However, these results demonstrate the financial impact of real-world utilization that would be expected in clinical practice. These insights are especially relevant, given the increases in GEP-NET prevalence due to higher diagnoses rates and relatively long survival.
One area in which further research could be beneficial would be the implications of failed intramuscular injections. A key difference between the two products is that lanreotide is injected subcutaneously, whereas octreotide requires gluteal intramuscular injection. A previous analysis has shown, within a controlled study setting, that quality improvement initiatives can improve the success rate of intramuscular injections from 52% to 75%.33 However, even after such a training program, a quarter of intramuscular injections did not result in successful delivery of medication. The finding that intramuscular injections frequently do not reach the muscular level has also been reported across other disease areas, especially in obese patients.34–37 This issue is of increasing importance as obesity rates in the USA rise. The real-world impact of these failed doses is not completely understood, but it is hypothesized that they could lead to either more frequent or higher dose injections, repeat injections at a later time point, or a decrease in efficacy if the failed injection was not identified; all of these consequences have the potential to pose an incremental budget impact. In sensitivity analyses, we assessed the impact of the failed injections resulting in repeated injections, either at each instance or in 50% of cases. In both of these scenarios, the cost implications were significant and resulted in higher cost savings with lanreotide use.
Another factor that was found in the model to be influential was the dosing of each product in the real world. Currently, there is a lack of evidence from the USA of lanreotide being used above indication in mGEP-NET patients, though further investigation would help confirm this assumption. Outside the USA, there is some limited evidence of lanreotide being used more frequently than every 4 weeks; however, the implications are unclear, given that the treatment practices can differ greatly between settings. A survey of 110 Italian oncologists reported that lanreotide was primarily used at a maximum of 120 mg; however, 43% recalled using it more frequently than once every 4 weeks. However, the same survey found that 63% used octreotide more frequently than once every 4 weeks.38 A retrospective study of 118 Italian patients reported that 18% of patients received high-frequency SSA, with 15 of these patients treated with octreotide and six receiving lanreotide, but the proportions among the original 118 patients were not reported.39 An observational study of 273 patients across eight European countries who received lanreotide reported that 98% received doses between 60 and 120 mg and 93% received injections every 4 weeks. The dosing for the small proportion not following US-indicated dosing was not described.40 Additionally, a case study from Belgium reported on a single patient who received lanreotide every 2 weeks.41 For octreotide, many studies report patients receiving either more frequent or higher dose injections.20,21,25–30 Whether this is to compensate for failed injections or to maintain the desired level of efficacy in treatment-experienced patients is unclear; however, to gain a full understanding of the economic implications of product use, this could be explored and analyzed further. Additionally, a recent Phase III trial of a new SSA considered octreotide 60 mg every 4 weeks, or twice the indicated dose, suggesting those researchers felt that 60 mg of octreotide was an appropriate dose to consider in practice.42 It is also important to note that there is no data to suggest that lanreotide depot 120 mg is equivalent to 30 mg of octreotide LAR. Octreotide LAR is approved in some countries at a higher dose (40 mg).43
As an additional differentiating factor between treatments, the efforts required to prepare and administer octreotide exceed those for lanreotide. While lanreotide is packaged as individual, prefilled syringes, octreotide preparation involves reconstituting the product, waiting for it to be ready, and administering within a set amount of time. This increase in the amount of active provider time necessary to treat a single patient has been incorporated into the analysis based on insights from a controlled setting,32 but no time and motion study has been conducted in the real-world setting to identify the true time demands in clinical practice. The time costs may be underestimated, as preparation of octreotide also requires up to an hour of waiting between being mixed and being injected, whereas it is recommended that lanreotide should be left at room temperature for 30 minutes, neither of which are included in preparation time estimates used.23,24 In the current context of care delivery, there is a nursing shortage and competing demands for those responsible for providing care. While it is unclear as to the extent clinical practice is prioritizing therapies that reduce provider time, it would be a method of increasing hospital throughput and/or reducing the burden on nurses.
This analysis should be considered as one source of information among other similar studies. A cost-minimization study presented at North American Neuroendocrine Tumor Society (NANETS) 2014 compared lanreotide and octreotide in patients with mGEP-NETs.44 Typically, in cost-effectiveness analyses, clinical data will be based on head-to-head clinical trials or indirect treatment comparisons will be conducted, to ensure a fair comparison is being made. In that analysis, the authors used results from the ELECT study,45 which only investigated the efficacy of lanreotide, to reflect symptom control for both agents, while the PROMID study,6,9 which only investigated octreotide, was used for the antitumor efficacy of both products. In that analysis, the two products were assumed to have equivalent efficacy without the rigor of a head-to-head study or a formal treatment comparison using published data, and it essentially was a cost-minimization analysis when comparing products at indicated doses. With these assumptions, this prior analysis found that use of lanreotide increased costs over a 3-year period and for the lifetime of patients. Another key difference between that study and the model described in this manuscript is the assumptions around utilization, including real-world dosing of SSAs. While the NANETS presentation assumed all patients received indicated doses of octreotide, we incorporated real-world utilization data to better reflect the expenditures expected in the USA.
Although we followed best practices in budget impact modeling and carefully selected the data to include, results should be considered in light of the limitations. Due to a lack of published data on real-world lanreotide utilization, we assumed that all patients receive the maximum indicated dose. While it is possible that some patients may receive above-indicated doses of lanreotide, there have not been published data indicating real-world use of >120 mg in the USA. As mentioned previously, there is uncertainty on the downstream economic implications of intramuscular injection failure. In the base case analysis, we did not consider the possibility of unsuccessful octreotide injections; however, this was explored in scenario analyses and found to influence costs. As was the case with the previous analysis from NANETS comparing the cost-effectiveness of these two products, the lack of head-to-head trials comparing efficacy measures prevented consideration of clinical benefits differing between treatments. Additionally, differences in patient populations between the PROMID6,9 and CLARINET8 trials prohibited indirect comparisons. The lack of data on comparative effectiveness prevented consideration of differential costs based on treatment response, or costs that could be accrued following SSA discontinuation. Without evidence of clinical superiority, the choice of treatments becomes primarily based on costs. We conducted the analysis from the hospital perspective, such that indirect costs borne by the patient, such as time, transportation, and productivity losses, were not considered. We did not consider the differences between subgroups of mGEP-NET patients, for example, by functional status or the site of tumor origin; however, this would be an area for further investigation in the future. If such research indicates that there are patients who can be identified a priori as being more likely to benefit from a specific therapy, this method of practicing personalized medicine should be undertaken. We only considered the branded versions of these therapies, and if biologic equivalents become available and widely used, the financial impact should be reassessed. Additionally, varying the acquisition costs of each product was found to have a large impact on model results. As pricing negotiations can shift the drug costs to hospitals, the results of sensitivity analyses should be considered in cases where facilities face lower costs, and negotiations related to drug pricing would be a method of reducing overall treatment costs. Both products can also be used for other indications, for example, acromegaly; however, this study only examined the cost consequences of treatment choice for GEP-NET patients.
Conclusion
In oncology treatment, there is increasing concern over the cost of providing care while striving to get the most cost-effective and disease controlling regimen to the patient. Because of this impetus to consider the value of products and allocate the resources efficiently, different groups including American Society of Clinical Oncology have been developing tools to help compare products and assess new technologies. These types of budget impact analyses can help provide insights into the full cost of treatment choice, beyond a simple comparison of acquisition costs at the indicated dosing. There is a lack of published evidence on the expected resource utilization in the real world with mGEP-NET treatments. The finding that increased utilization of lanreotide can reduce costs could be beneficial to payers, hospital systems, clinicians, and others concerned about the cost of care for mGEP-NET patients.
Acknowledgment
This study was funded by Ipsen Biopharmaceuticals. No assistance in the preparation of this article is to be declared.
Authors’ contributions
JDO, TGKB, SJP, and DC were involved in the conception and design of the study. JDO, TGKB, SJP, and ATP were involved in analysis and interpretation of the data. JDO, TGKB, SJP, BM, DC, and ATP were involved in drafting the paper, revising it critically for intellectual content, and providing final approval. All authors contributed toward data analysis, drafting and revising the paper and agree to be accountable for all aspects of the work. Authorship order was determined based on the level of contributions, with the exception of ATP who was selected as the last author to reflect the overarching clinical contributions to the work.
Disclosure
JDO and TGKB are employees of Partnership for Health Analytic Research, LLC and were paid by Ipsen Biopharmaceuticals to conduct this study. SJP, BM, and DC are employees of Ipsen Biopharmaceuticals. ATP serves as a consultant for Ipsen Biopharmaceuticals. Since completion of this work, ATP’s affiliation has changed to Morehouse College and Georgia Institute of Technology. The authors report no other conflicts of interests in this work.
References
Pearse AG. The cytochemistry and ultrastructure of polypeptide hormone-producing cells of the APUD series and the embryologic, physiologic and pathologic implications of the concept. J Histochem Cytochem. 1969;17(5):303–313. | ||
Moertel CG. Karnofsky memorial lecture. An odyssey in the land of small tumors. J Clin Oncol. 1987;5(10):1502–1522. | ||
Yao JC, Hassan M, Phan A, et al. One hundred years after “carcinoid”: epidemiology of and prognostic factors for neuroendocrine tumors in 35,825 cases in the United States. J Clin Oncol. 2008;26(18):3063–3072. | ||
Halfdanarson TR, Rabe KG, Rubin J, Petersen GM. Pancreatic neuroendocrine tumors (PNETs): incidence, prognosis and recent trend toward improved survival. Ann Oncol. 2008;19(10):1727–1733. | ||
Berardi R, Rinaldi S, Torniai M, et al. Gastrointestinal neuroendocrine tumors: searching the optimal treatment strategy. A literature review. Crit Rev Oncol Hematol. 2016;98:264–274. | ||
Rinke A, Müller HH, Schade-Brittinger C, et al. Placebo-controlled, double-blind, prospective, randomized study on the effect of octreotide LAR in the control of tumor growth in patients with metastatic neuroendocrine midgut tumors: a report from the PROMID Study Group. J Clin Oncol. 2009;27(28):4656–4663. | ||
Caplin ME, Pavel M, Ćwikła JB, et al. Lanreotide in metastatic enteropancreatic neuroendocrine tumors. N Engl J Med. 2014;371(3):224–233. | ||
Caplin ME, Pavel M, Ćwikła JB, et al. Anti-tumour effects of lanreotide for pancreatic and intestinal neuroendocrine tumours: the CLARINET open-label extension study. Endocr Relat Cancer. 2016;23(3):191–199. | ||
Rinke A, Wittenberg M, Schade-Brittinger C, et al. Placebo-controlled, double-blind, prospective, randomized study on the effect of octreotide LAR in the control of tumor growth in patients with metastatic neuroendocrine midgut tumors (PROMID): results of long-term survival. Neuroendocrinology. 2017;104(1):26–32. | ||
National Comprehensive Cancer Network, Inc. NCCN Clinical Practice Guidelines in Oncology (NCCN Guidelines®): Neuroendocrine Tumors Version 1.2015. November 2014. | ||
NCCN Guidelines® & Clinical Resources. NCCN Drugs & Biologics Compendium®. Available from: https://www.nccn.org/professionals/drug_compendium/content/contents.asp. Accessed April 24, 2015. | ||
Financial Burden of Cancer Care|Cancer Trends Progress Report. Available from: http://progressreport.cancer.gov/after/economic_burden#field_most_recent_estimates. Accessed May 3, 2016. | ||
Epstein AM, Jha AK, Orav EJ, et al. Analysis of early accountable care organizations defines patient, structural, cost, and quality-of-care characteristics. Health Aff (Millwood). 2014;33(1):95–102. | ||
Peppercorn J. The financial burden of cancer care: do patients in the US know what to expect?. Expert Rev Pharmacoecon Outcomes Res. 2014;14(6):835–842. | ||
Mauskopf JA, Sullivan SD, Annemans L, et al. Principles of good practice for budget impact analysis: report of the ISPOR task force on good research practices budget impact analysis. Value Health. 2007;10(5):336–347. | ||
Sullivan SD, Mauskopf JA, Augustovski F, et al. Budget impact analysis-principles of good practice: report of the ISPOR 2012 budget impact analysis good practice II task force. Value Health. 2014;17(1):5–14. | ||
Modlin IM, Oberg K, Chung DC, et al. Gastroenteropancreatic neuroendocrine tumours. Lancet Oncol. 2008;9(1):61–72. | ||
Ferone D, Forsythe A, Bakker B, Pedersini R, Goren A. Real world data on patients with neuroendocrine tumors treated with octreotide LAR. Poster presented at: European Cancer Congress 2013 (ESMO); September 27 – October 1 2013; Amsterdam, Netherlands. | ||
Hallet J, Law CH, Cukier M, Saskin R, Liu N, Singh S. Exploring the rising incidence of neuroendocrine tumors: a population-based analysis of epidemiology, metastatic presentation, and outcomes. Cancer. 2015;121(4)589–597. | ||
Pokuri VK, Fong MK, Iyer R. Octreotide and lanreotide in gastroenteropancreatic neuroendocrine tumors. Curr Oncol Rep. 2016;18(1):7. | ||
Strosberg J, Casciano R, Stern L, et al. United States-based practice patterns and resource utilization in advanced neuroendocrine tumor treatment. World J Gastroenterol. 2013;19(15):2348–2354. | ||
Wolters Kluwer. Price Rx. Available from: https://pricerx.medispan.com/. Published 2016. Accessed April 25, 2017. | ||
Novartis Pharmaceuticals Corporation. Sandostatin LAR [Prescribing Information]. December 2014. Available from: http://www.pharma.us.novartis.com/product/pi/pdf/sandostatin_lar.pdf. Accessed April 20, 2017. | ||
SOMATULINE® DEPOT (lanreotide) injection [prescribing Information]. Ipsen Biopharmaceuticals, Inc; 2014. | ||
Strosberg JR, Benson AB, Huynh L, et al. Clinical benefits of above-standard dose of octreotide LAR in patients with neuroendocrine tumors for control of carcinoid syndrome symptoms: a multicenter retrospective chart review study. The Oncologist. 2014;19(9):930–936. | ||
Xu Y, Shih YT, Leary C, Shen C, Yao JC. Dosing patterns of octreotide LAR among elderly patients with neuroendocrine tumors: Analysis of the SEER-Medicare database. J Clin Oncol. 2012;30(Suppl):e14550. | ||
Shen C, Xu Y, Yao JC, Shih YT. Octreotide LAR use among elderly patients with carcinoid syndrome and survival outcomes: a population-based analysis. J Clin Oncol. 2012;30(Suppl 4):322. | ||
Kulke MH, Horsch D, Caplin M, et al. 37LBA Telotristat etiprate is effective in treating patients with carcinoid syndrome that is inadequately controlled by somatostatin analog therapy (the phase 3 TELESTAR clinical trial). Eur J Cancer. 2015;51(Suppl 3):S728. | ||
Maxine D. Fisher, Sonia Pulgar, et al. Treatment patterns and outcomes in metastatic neuroendocrine tumors: results from a retrospective community oncology database. Presented at: North American Neuroendocrine Tumor Society Symposium; 15–17 October, 2015; Austin, TX, USA. | ||
Jonathan R Strosberg, Sarah Bobiak, Carrie C Zornosa, et al. Dosing patterns for octreotide LAR in neuroendocrine tumor (NET) patients: NCCN NET outcomes database. J Clin Oncol. 2013;31(Suppl 15):4142. | ||
U.S. Bureau of Labor Statistics. Occupation Employment Statistics. Available from: http://www.bls.gov/oes/current/oes291171.htm. Published March 2016. Accessed March 28, 2016. | ||
Adelman DT, Burgess A, Davies PR. Evaluation of long-acting somatostatin analog injection devices by nurses: a quantitative study. Med Devices (Auckl). 2012;5:103–109. | ||
Boyd AE, DeFord LL, Mares JE, et al. Improving the success rate of gluteal intramuscular injections. Pancreas. 2013;42(5):878–882. | ||
Zaybak A, Güneş ÜY, Tamsel S, Khorshid L, Eser I. Does obesity prevent the needle from reaching muscle in intramuscular injections?. J Adv Nurs. 2007;58(6):552–556. | ||
Cockshott WP, Thompson GT, Howlett LJ, Seeley ET. Intramuscular or intralipomatous injections?. N Engl J Med. 1982;307(6):356–358. | ||
Nisbet AC. Intramuscular gluteal injections in the increasingly obese population: retrospective study. BMJ. 2006;332(7542):637–638. | ||
Chan VO, Colville J, Persaud T, Buckley O, Hamilton S, Torreggiani WC. Intramuscular injections into the buttocks: are they truly intramuscular?. Eur J Radiol. 2006;58(3):480–484. | ||
Fazio N, Spada F. Real-word analysis on the use of somatostatin analogs (SSAs) in patients with neuroendocrine neoplasms (NENs): results of a survey conducted by the Italian Society of Medical Oncology (AIOM). Ann Oncol. 2016;27(suppl 4):iv114. | ||
Modica R, Ramundo V, Marciello F, et al. High-dose treatment with somatostatin analogues in neuroendocrine tumours. Endocr Abstr. 2015;37:EP1132. | ||
Ruszniewski P, Valle JW, Lombard-Bohas C, et al. Patient-reported outcomes with lanreotide Autogel/Depot for carcinoid syndrome: an international observational study. Dig Liver Dis. 2016;48(5):552–558. | ||
Van Fraeyenhove F, Meireson N, Terriere L, et al. High-dose lanreotide in the treatment of poorly differentiated pancreatic neuroendocrine carcinoma: a case report. Case Rep Oncol. 2014;7(1):155–163. | ||
Strosberg J, El-Haddad G, Wolin E, et al. Phase 3 trial of 177Lu-Dotatate for midgut neuroendocrine tumors. N Engl J Med. 2017;376:125–135. | ||
Novartis Pharmaceuticals Corporate Fact Sheet. January 2016. Available from: https://www.novartis.com/sites/www.novartis.com/files/2a_Pharmaceuticals_EN.pdf. Accessed May 4, 2016. | ||
Rajeev Ayyagari, Maureen Neary, Shang Li, et al. Economic evaluation of octreotide LAR versus lanreotide depot in the treatment of metastatic gastrointestinal neuroendocrine tumors. Presented at: North American Neuroendocrine Tumor Society Symposium; 10–11 October, 2014; Nashville, TN, USA. | ||
Vinik Aaron, Wolin Edward M, Adury Helene, Gomez-Panzani Edda L. ELECT: A phase 3 study of efficacy and safety of lanreotide autogel/depot (LAN) treatment for carcinoid syndrome in patients with neuroendocrine tumors (NETs) [abstract]. J Clin Oncol. 2014. Available from: http://meetinglibrary.asco.org/content/123139-143. Accessed July 22, 2016. |
 © 2017 The Author(s). This work is published and licensed by Dove Medical Press Limited. The full terms of this license are available at https://www.dovepress.com/terms.php and incorporate the Creative Commons Attribution - Non Commercial (unported, v3.0) License.
By accessing the work you hereby accept the Terms. Non-commercial uses of the work are permitted without any further permission from Dove Medical Press Limited, provided the work is properly attributed. For permission for commercial use of this work, please see paragraphs 4.2 and 5 of our Terms.
© 2017 The Author(s). This work is published and licensed by Dove Medical Press Limited. The full terms of this license are available at https://www.dovepress.com/terms.php and incorporate the Creative Commons Attribution - Non Commercial (unported, v3.0) License.
By accessing the work you hereby accept the Terms. Non-commercial uses of the work are permitted without any further permission from Dove Medical Press Limited, provided the work is properly attributed. For permission for commercial use of this work, please see paragraphs 4.2 and 5 of our Terms.