")
Back to Journals » ClinicoEconomics and Outcomes Research » Volume 11
Budget Impact Of Including Avelumab As A Second-Line Treatment For Locally Advanced Or Metastatic Urothelial Cancer In The United States: Commercial And Medicare Payer Perspectives
Authors Kongnakorn T, Bharmal M, Kearney M, Phatak H, Benedict A, Bhanegaonkar A, Galsky M
Received 9 May 2019
Accepted for publication 11 October 2019
Published 8 November 2019 Volume 2019:11 Pages 659—672
DOI https://doi.org/10.2147/CEOR.S215069
Checked for plagiarism Yes
Review by Single anonymous peer review
Peer reviewer comments 3
Editor who approved publication: Professor Giorgio Colombo
Thitima Kongnakorn,1 Murtuza Bharmal,2 Mairead Kearney,3 Hemant Phatak,4 Agnes Benedict,5 Abhijeet Bhanegaonkar,4 Matthew Galsky6
1Evidence Synthesis, Modeling and Communication, Evidera, London, UK; 2Global Evidence and Value Development, EMD Serono, Inc. (A business of Merck KGaA, Darmstadt, Germany), Rockland, MA, USA; 3Global Evidence and Value Development, Merck KGaA, Darmstadt, Germany; 4US Health Economics and Outcomes Research, EMD Serono, Inc. (A business of Merck KGaA, Darmstadt, Germany), Rockland, MA, USA; 5Evidence Synthesis, Modeling and Communication, Evidera, Budapest, Hungary; 6Tisch Cancer Institute, Icahn School of Medicine at Mount Sinai, New York, NY, USA
Correspondence: Murtuza Bharmal
Global Evidence and Value Development, EMD Serono, Inc. (A business of Merck KGaA, Darmstadt, Germany), Rockland, MA, USA
Email [email protected]
Objective: To estimate the budget impact of introducing avelumab as a second-line (2L) treatment option for patients with locally advanced or metastatic urothelial cancer (mUC) from the perspective of a US third-party payer (commercial and Medicare).
Methods: A budget impact model (BIM) with a three-year time horizon was developed for avelumab. Efficacy and safety data were sourced from published literature and US package inserts. The analysis was conducted in collaboration with a specialist oncologist who validated clinical assumptions. Costs were based on the number of eligible patients, time-to-treatment failure, overall survival, adverse events (AEs), and projected market shares of various treatments.
Results: In a hypothetical commercial health plan of 30,000,000 members, 884 patients were estimated to be eligible for 2L treatment over a three-year time period. Without avelumab, the total cost for treating patients with mUC was estimated to be US$70,268,035. The introduction of avelumab increased total costs by $73,438 (0.10% increase). In a hypothetical Medicare health plan of 30,000,000 beneficiaries, a total of 4,705 patients were estimated to be eligible for 2L treatment. Without avelumab, the total cost for treating patients with mUC was estimated to be $292,923,098 from a Medicare perspective; however, with avelumab, there was an increase of $719,324 (0.25% increase) in total costs. Results of the sensitivity analyses demonstrated a cost-neutral impact across all tested scenarios from both perspectives.
Conclusion: The BIM estimated that avelumab would have a cost-neutral impact within a US commercial and a Medicare health plan. Overall, avelumab can be an affordable and valuable treatment option for patients with locally advanced or mUC in the 2L setting. These findings demonstrate a consistently favorable budget impact in both populations. Further studies should be conducted to more comprehensively assess the clinical and economic implications of adding avelumab to the treatment armamentarium of 2L mUC.
Keywords: urothelial carcinoma, budget impact model, cost analysis, economic analysis, immuno-oncology, chemotherapy
Introduction
Bladder cancer is the sixth most common cancer in the United States (US), attributing to an estimated 16,870 deaths in 2017 and 79,030 new cases in 2017.1–3 Urothelial cancer (UC) accounts for 90% of bladder cancer in the US.4 Men are more often affected by UC than women, and the peak incidence is in the seventh decade of life.4 Patients with distant metastatic bladder cancer have a poor prognosis, and their 5-year survival is estimated at 5.2%.1 For patients who develop metastatic disease, the most common sites of metastases are lymph nodes, lung, and bone.
The standard of care treatment for metastatic UC (mUC) in the second-line (2L) setting consists of immuno-oncology (IO) agents.5 IO agents are a class of monoclonal antibodies known as checkpoint inhibitors, which target inhibitory pathways of specific proteins such as programmed cell death 1 (PD-1)/programmed cell death-ligand 1 (PD-L1) or cytotoxic T-lymphocyte–associated antigen 4 (CTLA4); these have shown encouraging clinical activity in both newly diagnosed and heavily pretreated UC patients.6
IO agents have demonstrated improved outcomes and superior safety profiles relative to chemotherapy (CT) in mUC patients, and these improvements are likely to have contributed to a shift in the treatment paradigm in both first-line (1L) and 2L setting.7 IO agents are recommended for patients who have progressed on cisplatin-based CT or who are cisplatin-ineligible.5 Patients are deemed ineligible for cisplatin based on one of the following criteria: Eastern Cooperative Oncology Group performance status ≥2, creatinine clearance (CrCl) <60 mL/min, Common Terminology Criteria for Adverse Events grade ≥2 hearing loss, or ≥2 neuropathy, and these criteria are reflected in real-world US treatment patterns where cisplatin-treated metastatic bladder cancer patients were found to be younger and had fewer comorbidities than non-cisplatin-treated patients.8,9 In the US, the most commonly used CT agents in 2L are gemcitabine, carboplatin, and paclitaxel.10 One phase III study, which assessed locally advanced or mUC patients who had progressed on platinum-based treatment and were subsequently treated with CT, found an objective response rate of 22%, a median overall survival (OS) of 10.6 months (95% CI, 8.4–12.2), and a grade III-IV adverse event (AE) in 43% of the patients.11 Even though combination CT regimens have slightly higher response rates, they also pose an increased risk of toxicity; therefore, combination regimens are not frequently offered.12
Since May 2016, the US Food and Drug Administration (FDA) has approved five IO agents that target PD-1 or PD-L1 in previously treated mUC patients, nivolumab, pembrolizumab, atezolizumab, durvalumab, and avelumab. Avelumab, a fully human monoclonal antibody directed against the PD-L1 molecule, received accelerated approval in the US in May 2017 for the treatment of locally advanced or mUC patients who had experienced disease progression during or following platinum-containing CT. Approval was based on outcomes from the JAVELIN Solid Tumor trial (NCT01772004).13 Although the therapy gained approval, an additional step assessing the costs of the therapy should be undertaken to determine whether the use of the therapy would be economically viable in a setting with limited healthcare resources.
A budget impact model (BIM) is a health technology assessment tool used to support decision-making for drug reimbursement and formulary inclusion. The primary objective of this analysis was to evaluate the budget impact of introducing avelumab in the 2L setting for the treatment of patients with locally advanced or mUC who had experienced progression during or following treatment with platinum-containing CT. Both US commercial and Medicare payer perspectives were considered.
Methods
Model Structure, Perspective, And Time Horizon
A BIM was designed in Microsoft® Excel® (v16.0, 32-bit) and allocated eligible locally advanced or mUC patients to various available treatment options. Two scenarios were considered in the model. The BIM compared a scenario with the projected uptake of avelumab among other treatment options (world with avelumab: new scenario) to a scenario without avelumab but with other treatment options (world without avelumab: current scenario) (Figure 1). The BIM included information on the number of eligible patients for the treatment of locally advanced or mUC, the current and anticipated treatment distributions (i.e., market shares) for any of the interventions compared, relevant drug/administration costs, and healthcare resource utilization (HRU) costs. The costs were calculated based on the number of eligible patients, time-to-treatment failure (TTF), OS (as a proxy for treatment duration in third-line [3L]), AEs, and market share of various treatments. The annual cost estimates for these two scenarios were calculated by multiplying the number of eligible patients allocated to each treatment option by the average costs associated with each treatment (i.e., drug and administration costs, AE and disease management costs). The budget impact was calculated as the difference between the costs for the current scenario, in a world without avelumab, and the new scenario, in a world with avelumab. The model was evaluated for two types of payers including commercial and Medicare, and the base cases were presented for both perspectives separately. The BIM was set to a three-year time horizon and budget estimates were conducted within that time horizon (Figure 1). Since the aim of the BIM was to compare annual cash flows, no discounting was applied.
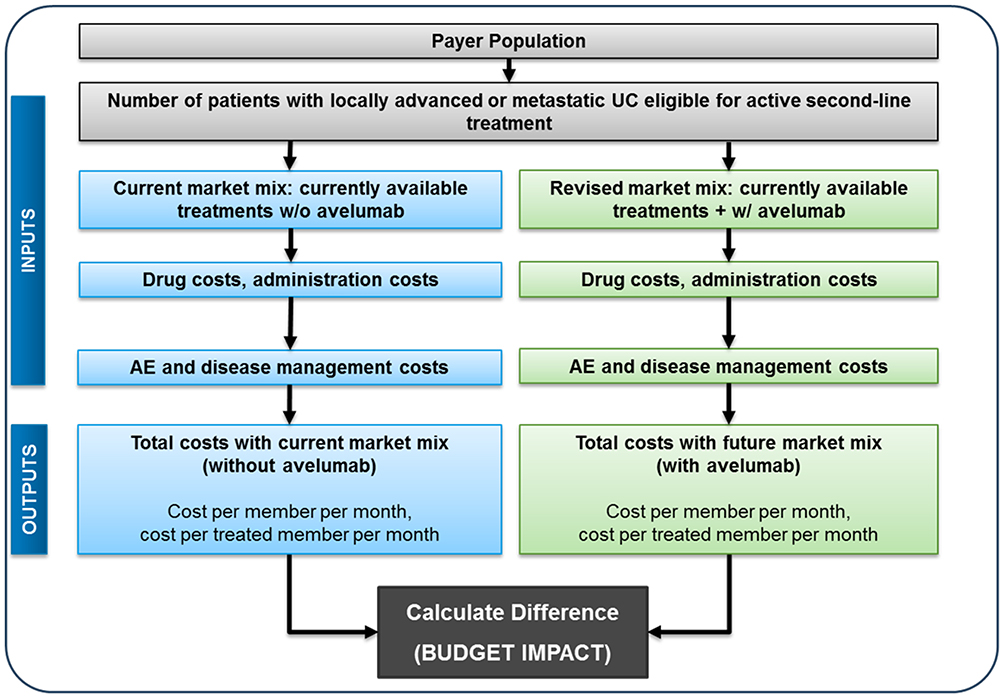 |
Figure 1 Model structure. Abbreviations: w/o, without; w/, with; AE, adverse event; UC, urothelial cancer. |
Model Input Variables
Target Population
The patient populations targeted in these BIMs were as close as possible to those covered by the approved US indication for avelumab. This was informed by the mUC population of the JAVELIN Solid Tumors trial (NCT01772004),13 i.e. patients with histologically or cytologically documented locally advanced or metastatic transitional cell carcinoma of the urothelium (including renal pelvis, ureters, urinary bladder, or urethra), who had progressed after treatment with at least one platinum-containing regimen. Therefore, the patient population evaluated in the analysis were eligible to receive 2L treatment. The total number of eligible patients was derived from published epidemiological data and validated by a practicing oncologist.14–17 For both the commercial and Medicare perspectives, age and gender-specific incidence rates were used (for age groups <65 years and ≥65 years, respectively) as the distribution of patient’s ages in each plan differs. The number of patients with UC in a given year was derived by applying the age and gender distribution of the health plan, and incidence data by age and gender were obtained from the US-based Surveillance, Epidemiology, and End Results (SEER) dataset considering the total plan population.16,17 As age-specific incidence data from the SEER dataset are for bladder cancer, rather than UC, it was assumed that 90% of bladder cancer was UC (originating from the bladder) and this proportion represents 90% of all UC originating from the urinary tract.18,19
Treatments And Market Share
To assess the budget impact of avelumab as a 2L therapy, two sets of market share projections were used for the model, and these were based on internal market research data and validated by a specialist oncologist (Table 1). One set of projections was based on the current market without avelumab (current scenario), and the second set was based on the projected uptake of avelumab (new scenario). The treatments included in the current market were the following IO agents: atezolizumab, durvalumab, nivolumab, and pembrolizumab. The remaining market shares consisted of CT: 45.0% in year 1, 59.0% in year 2 and 68.0% in year 3. In the new scenario, 3.0% of the IO market was assumed to come from avelumab across all 3 years, with uptake in the total market mix of all 2L treatments as 1.7% in year 1, 1.2% in year 2 and 1.0% in year 3. The CT was considered to be a “basket” of agents consisting of carboplatin (45.9%), gemcitabine (25.6%), docetaxel (12.4%), paclitaxel (45.1%), and pemetrexed (16.9%), based on the frequency of use observed in a real-world observational study.10 The sum of CT use was greater than 100% due to the combination of CT agents. For the purposes of this model, it was assumed that physicians would select either IO agents or CT regimens as 2L treatments to treat locally advanced or mUC patients. As a result, it was assumed that the introduction of avelumab would only alter the treatment mix of the IO agents and not the shares of CT. Additionally, it was assumed that IO agents would gain prominence in the 1L setting as the use of IO agents would shift from 2L to 1L. As such, it was also assumed that patients in the 2L setting would be treated with an increasing share of CT, hence the decreasing market shares of IO agents including avelumab over the three-year horizon of the analysis. Market share inputs were varied in the sensitivity analysis to test the robustness of different assumptions (Table 7).
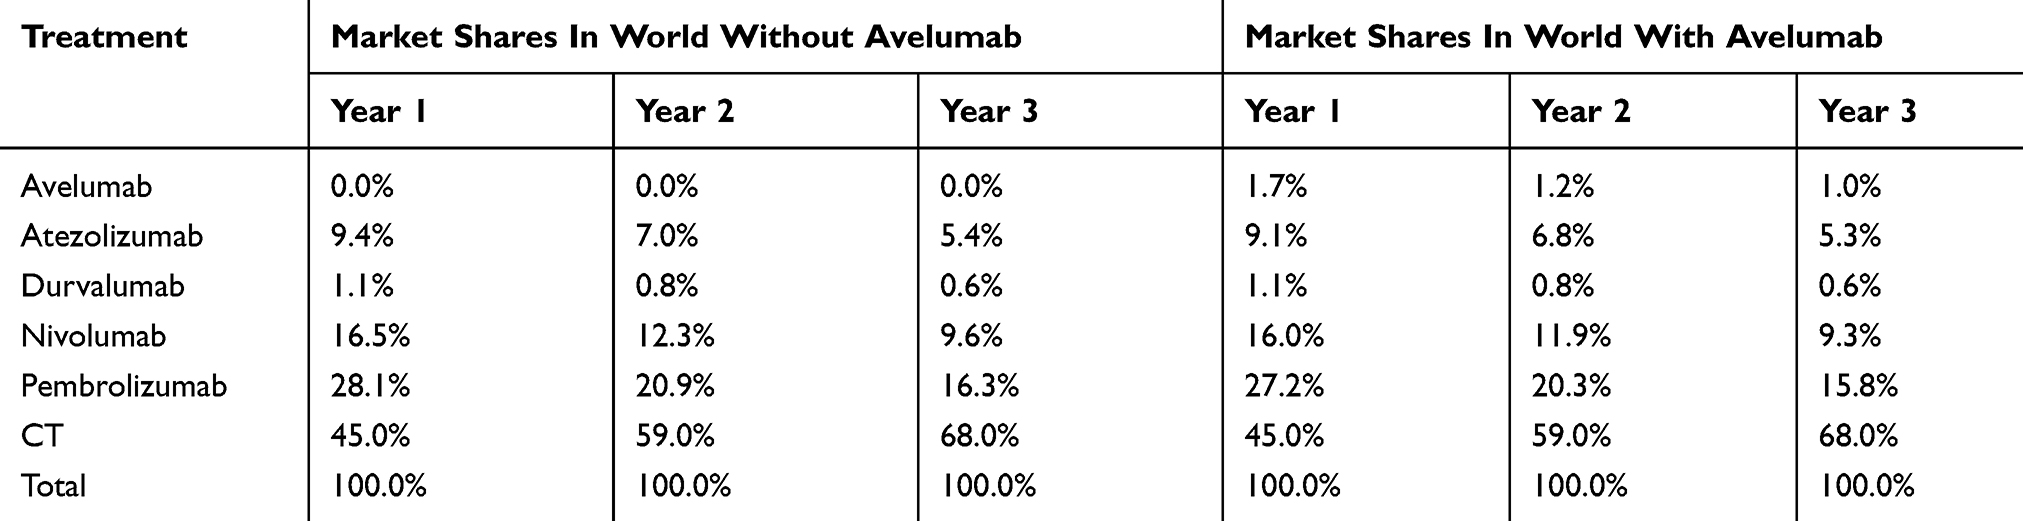 |
Table 1 Market Share With And Without Uptake Of Avelumab As 2L Therapy |
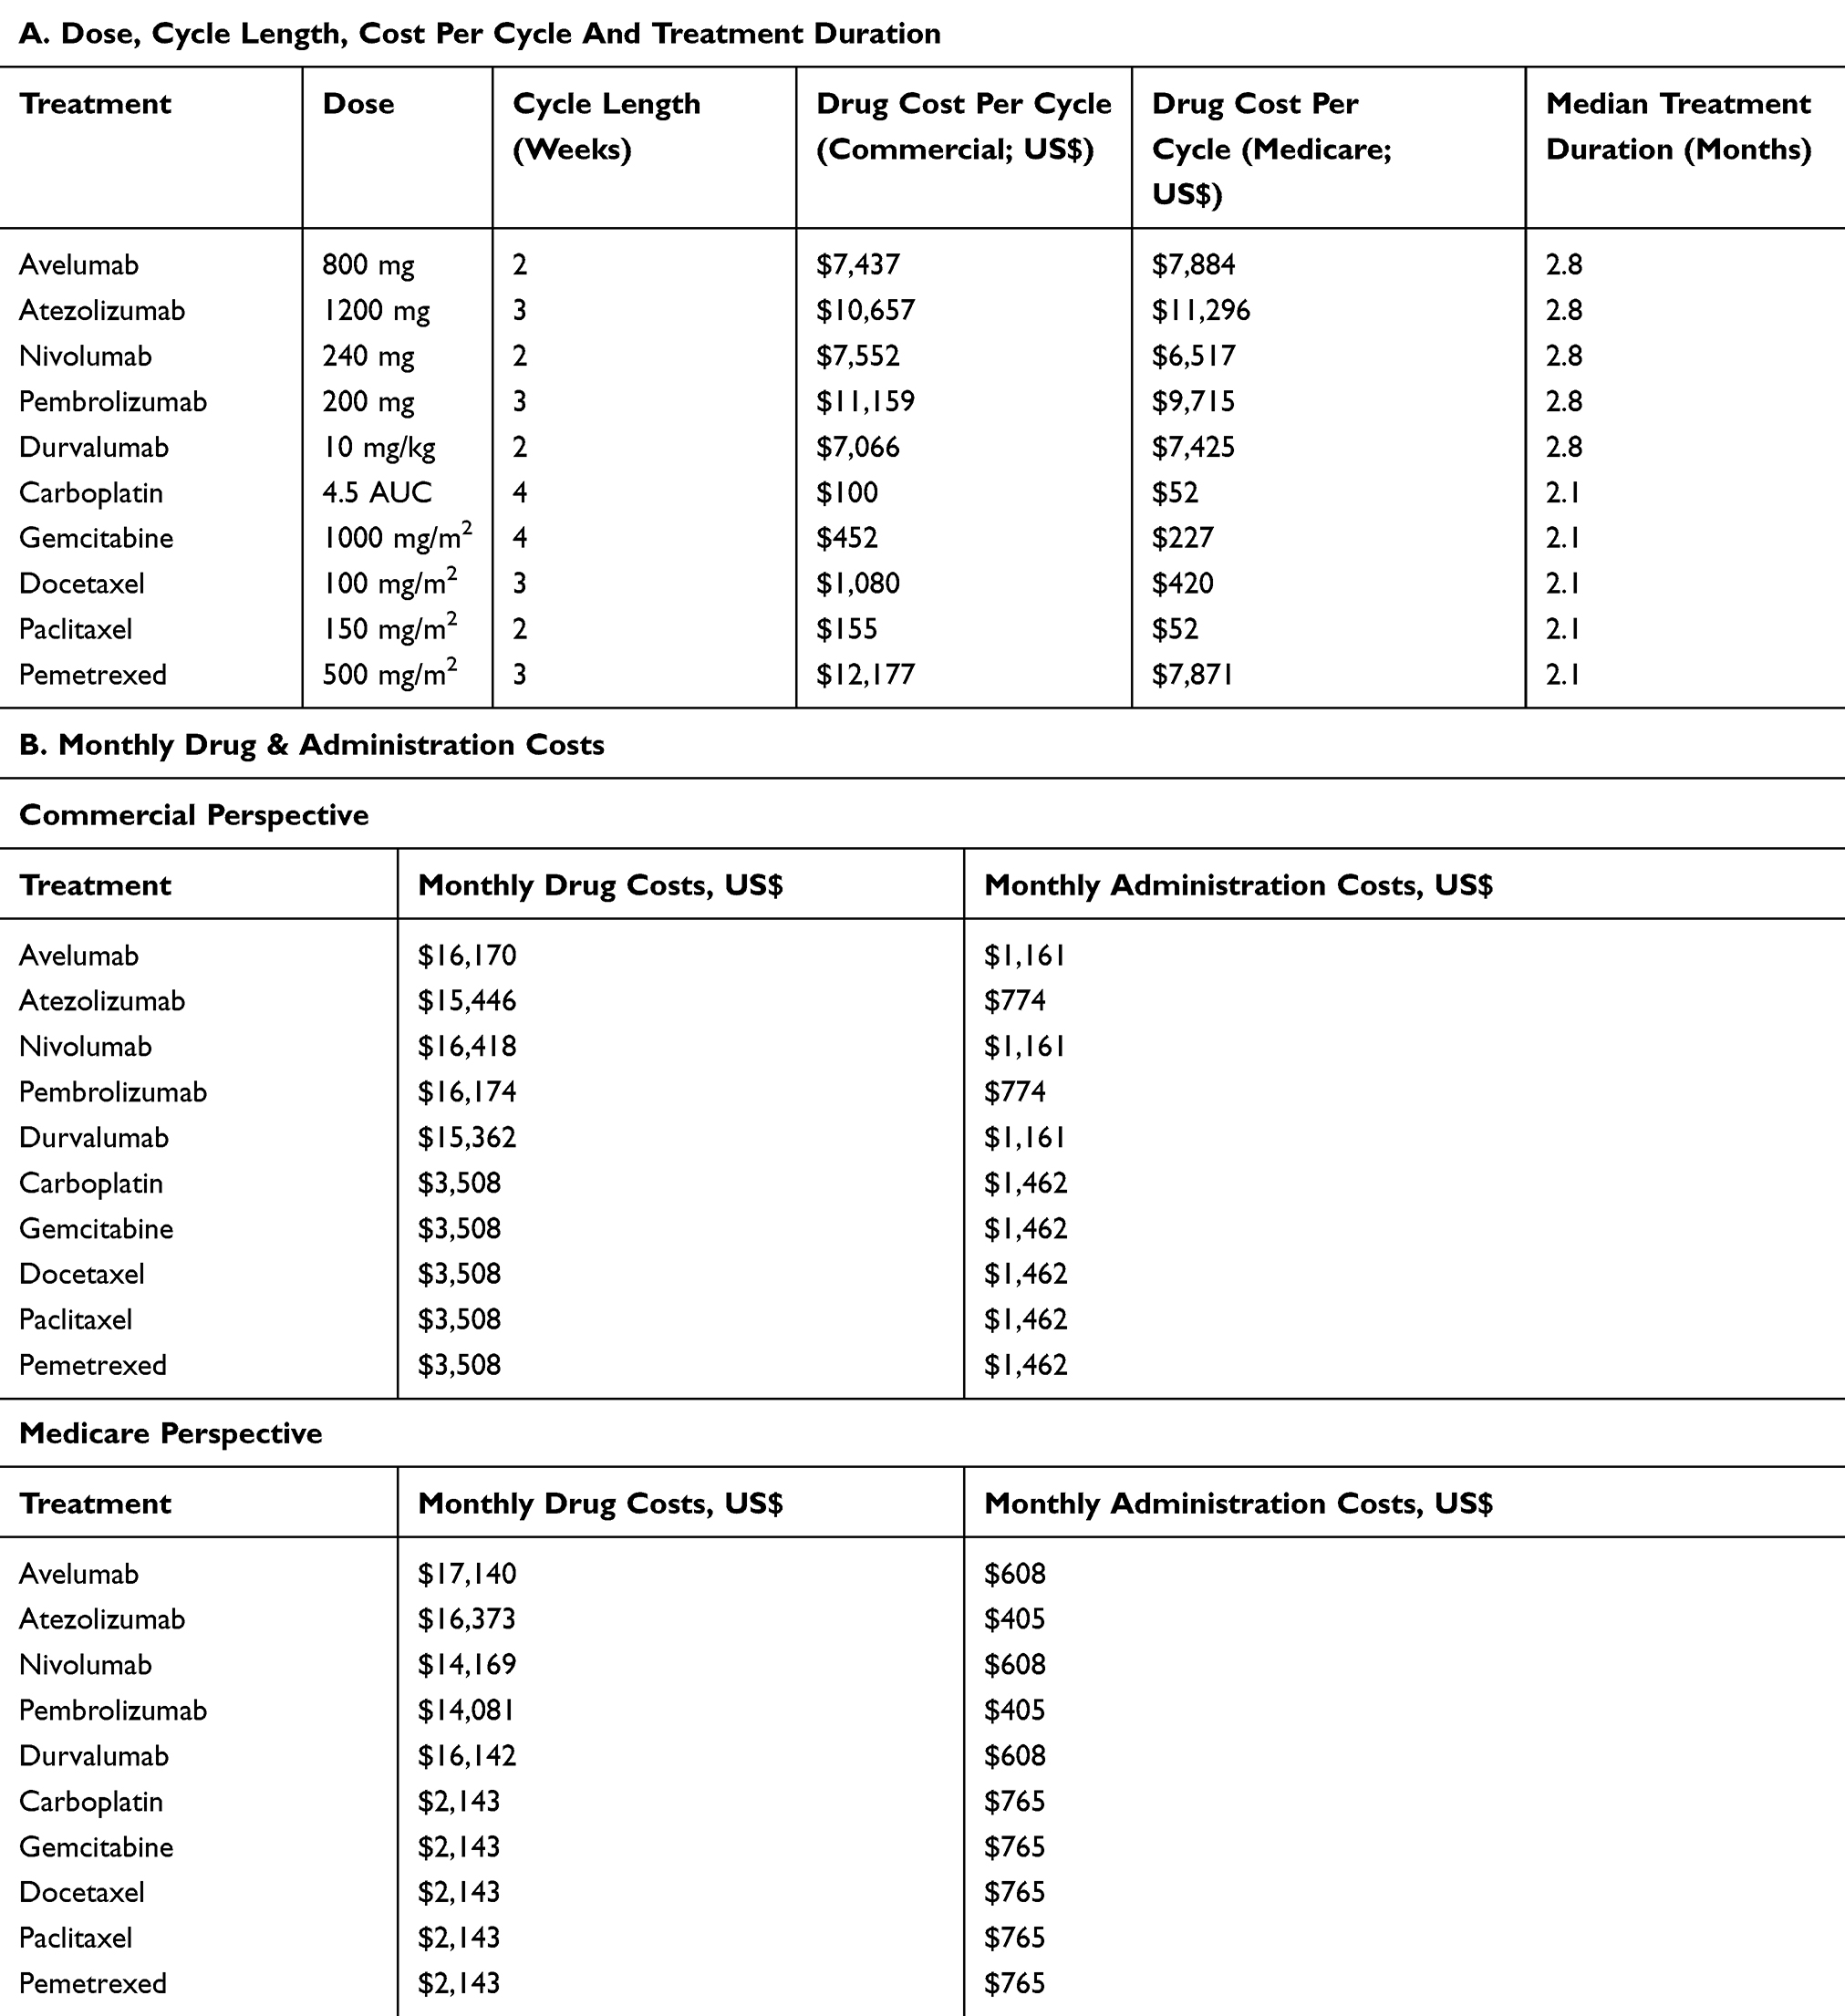 |
Table 2 Dosing, Duration, Drug And Administration Costs |
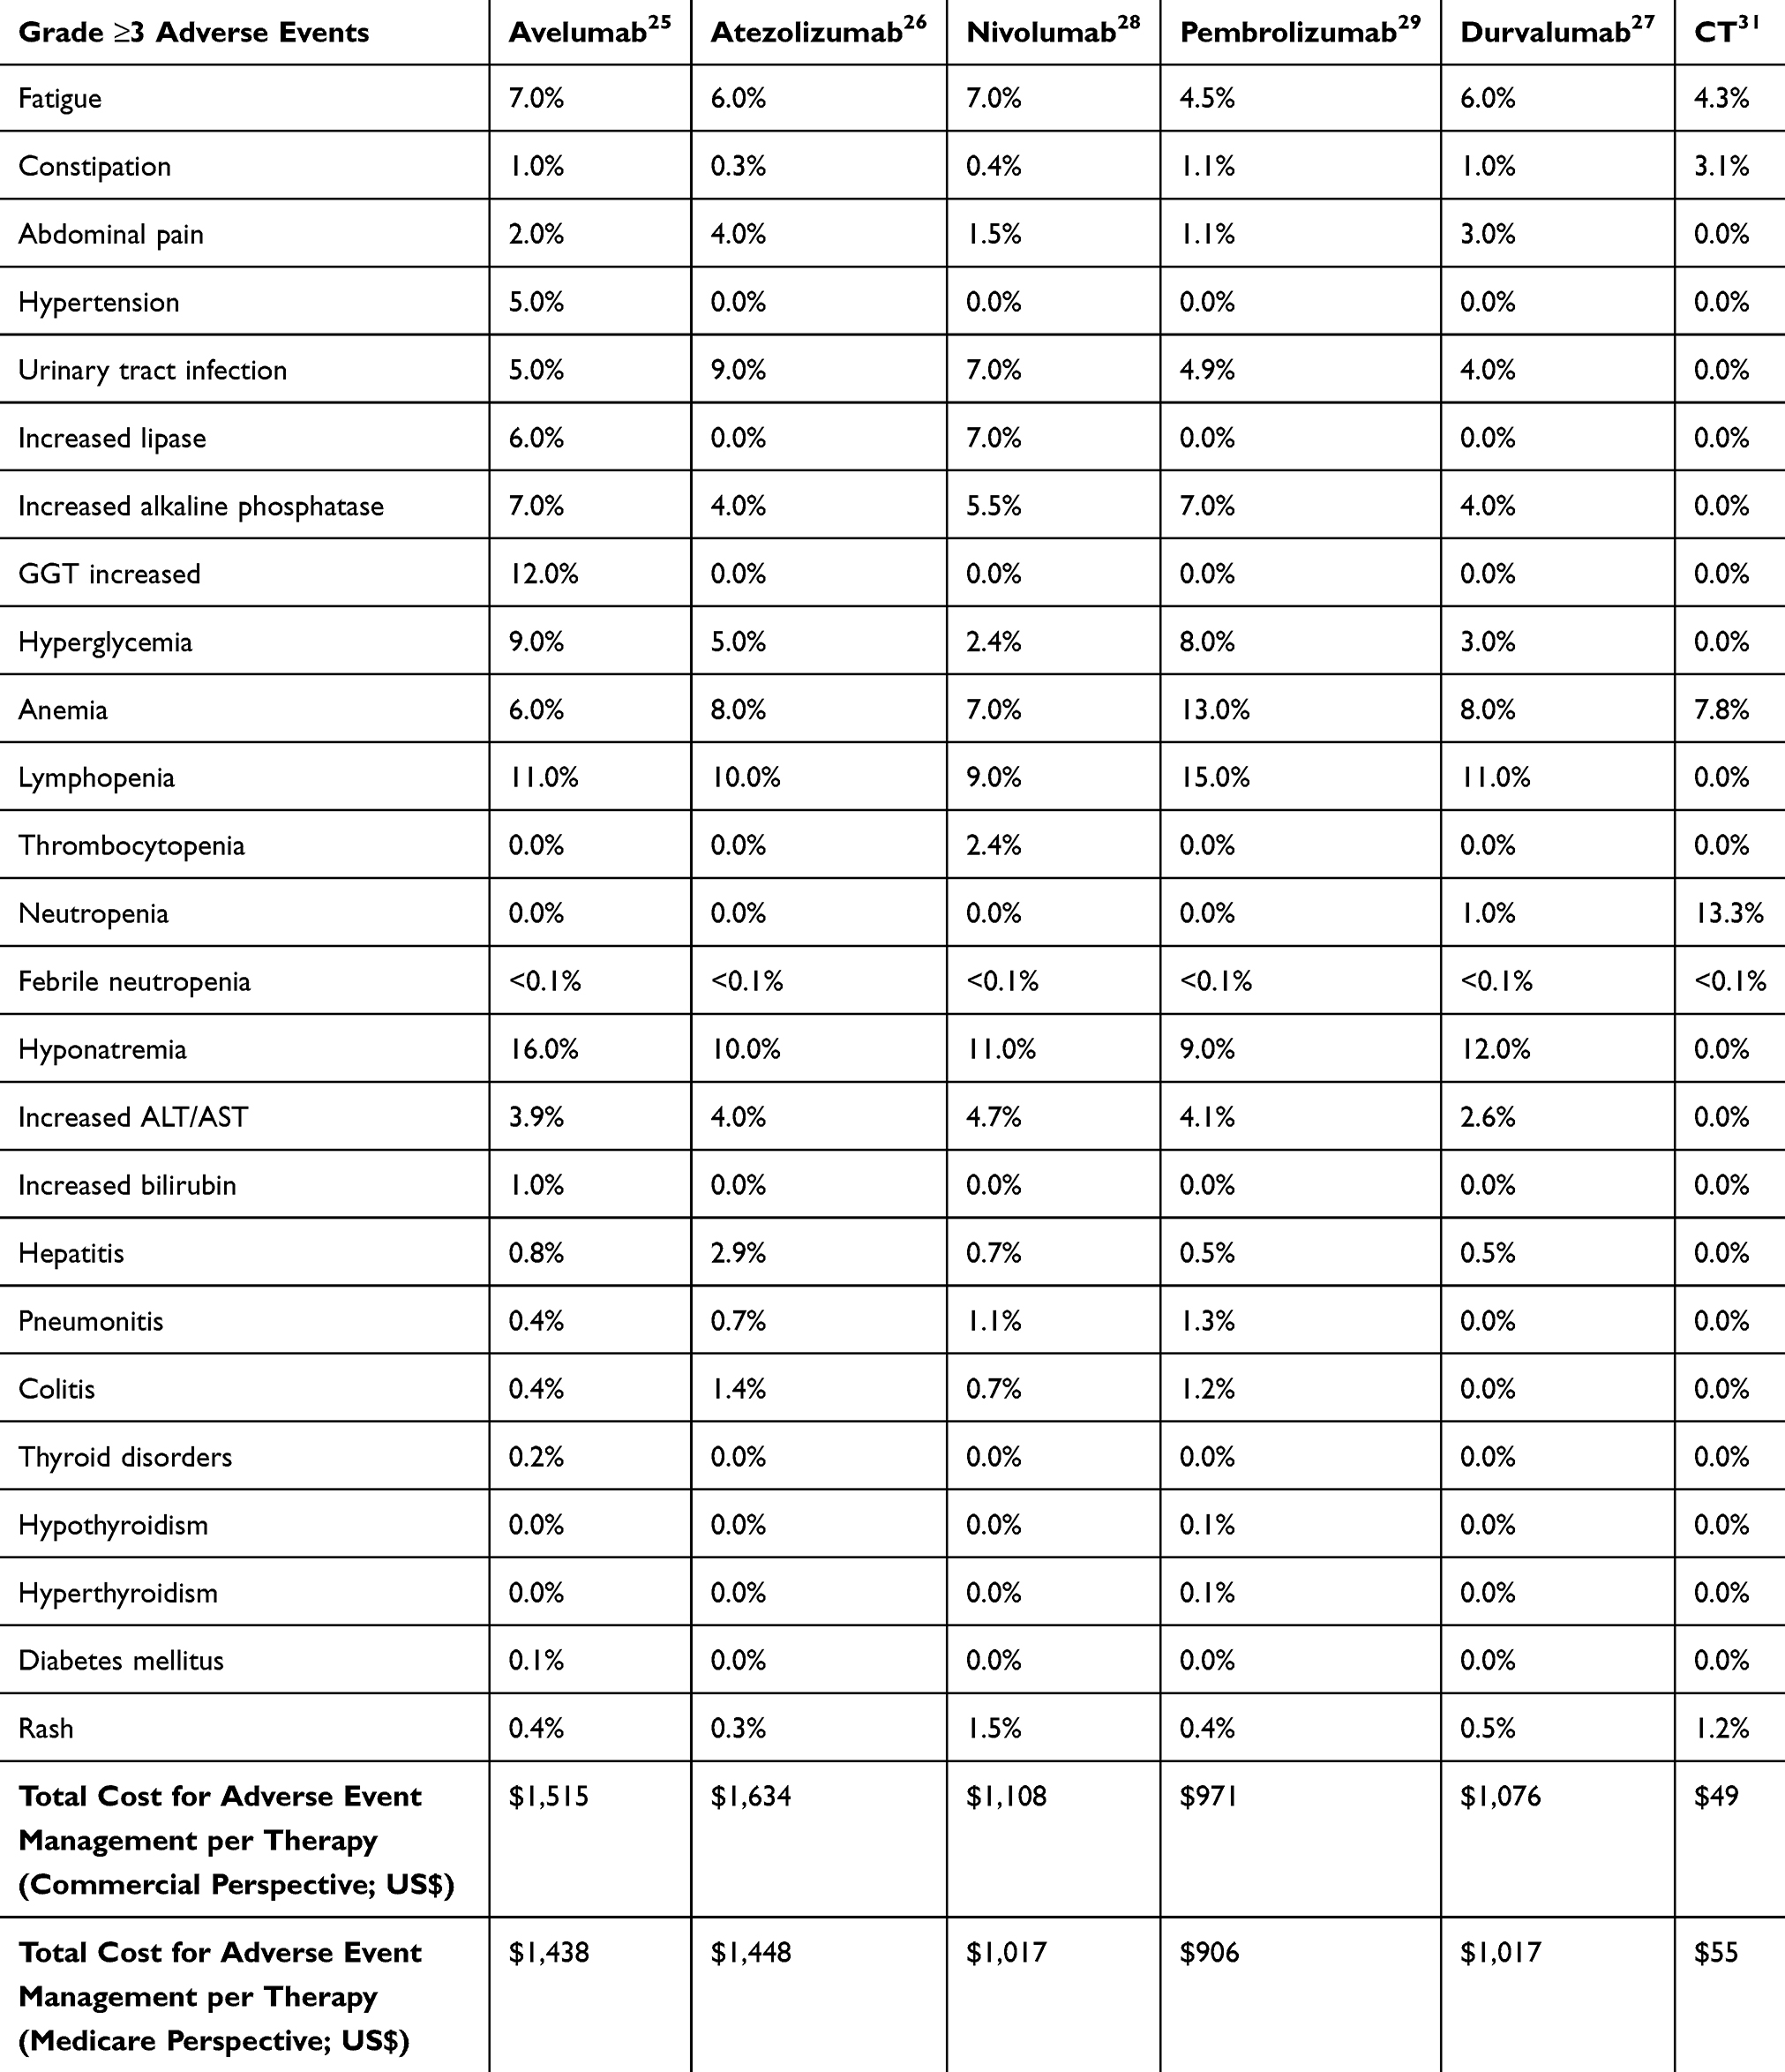 |
Table 3 Percentage Of Patients Experiencing Grade ≥3 Adverse Events And Total Adverse Event Costs |
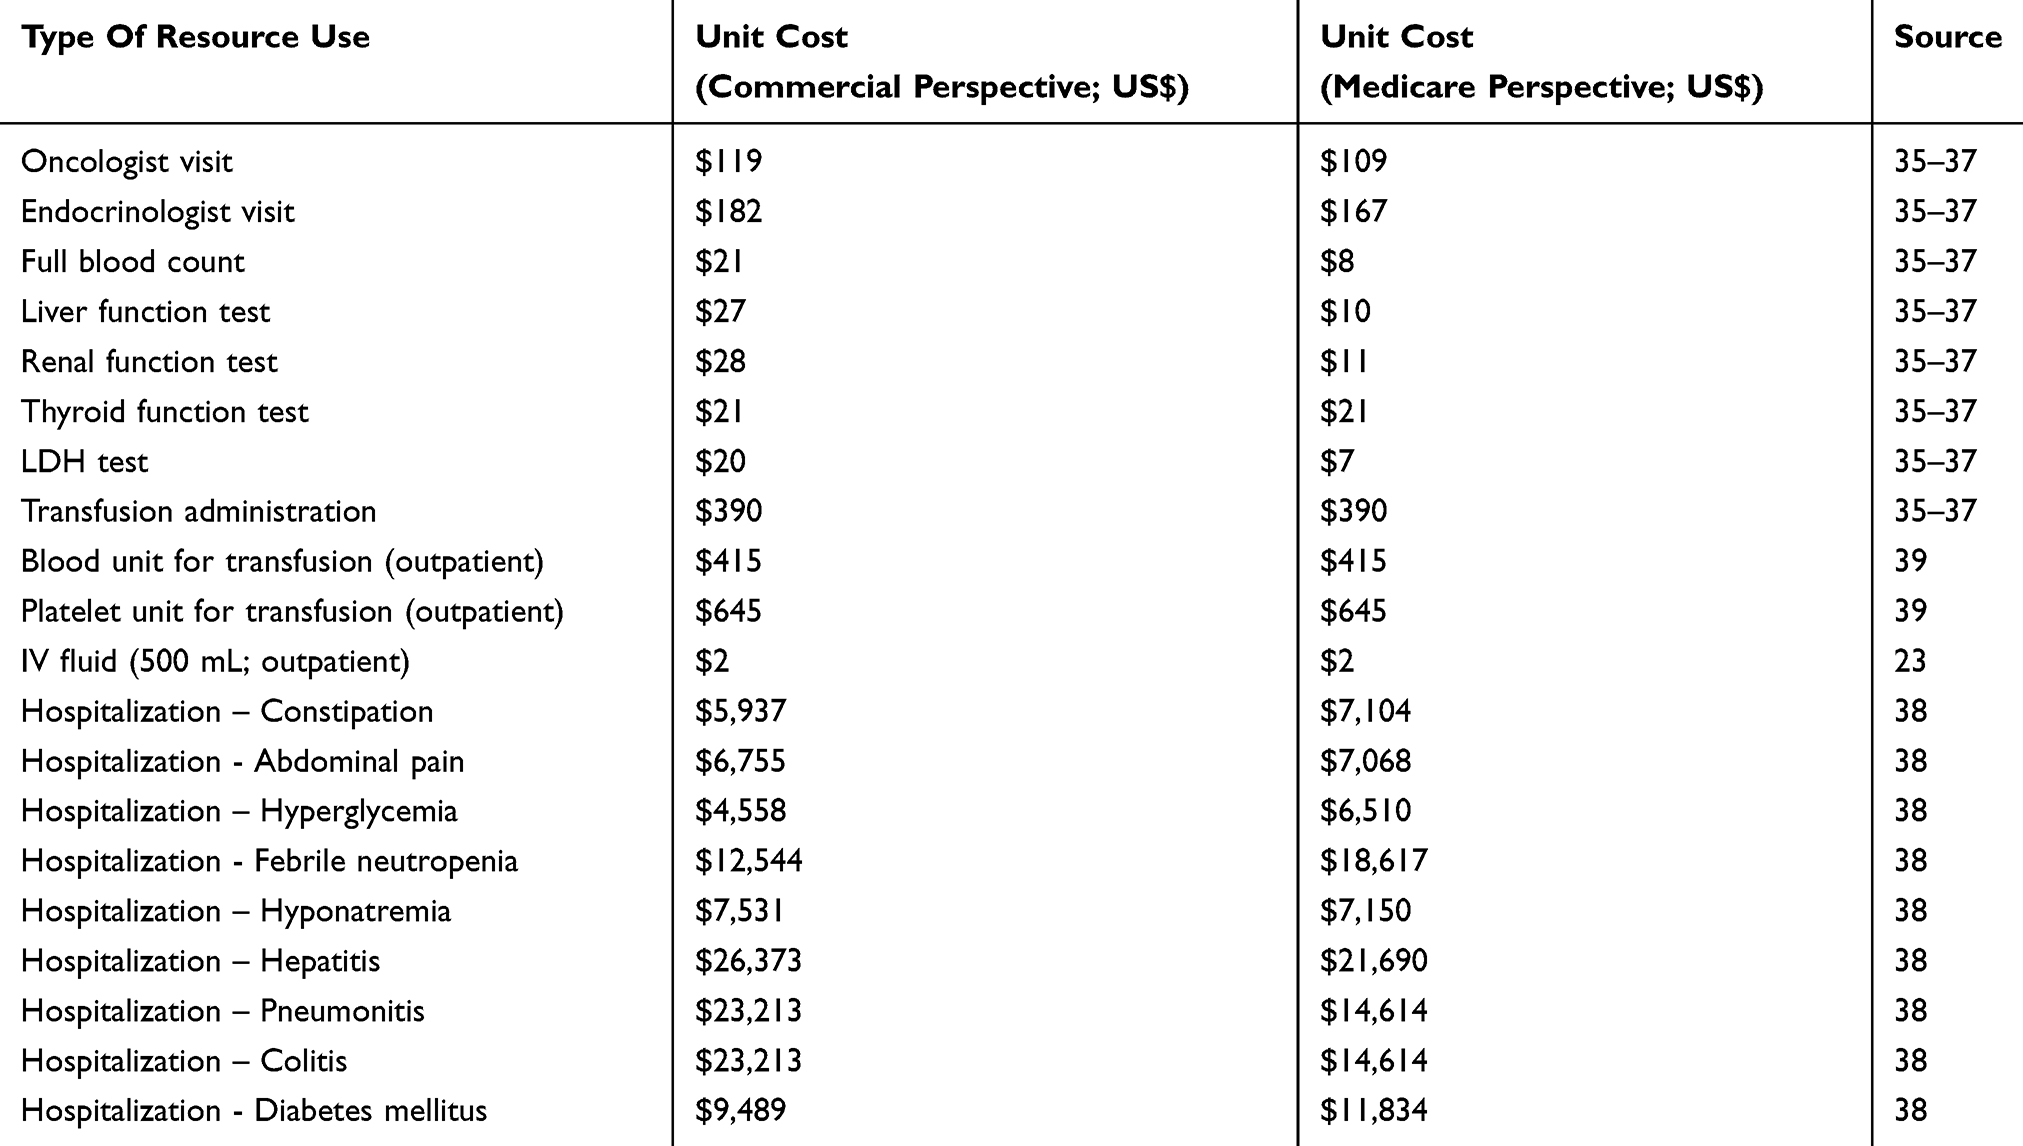 |
Table 4 Healthcare Resource Costs Of Adverse Event Management |
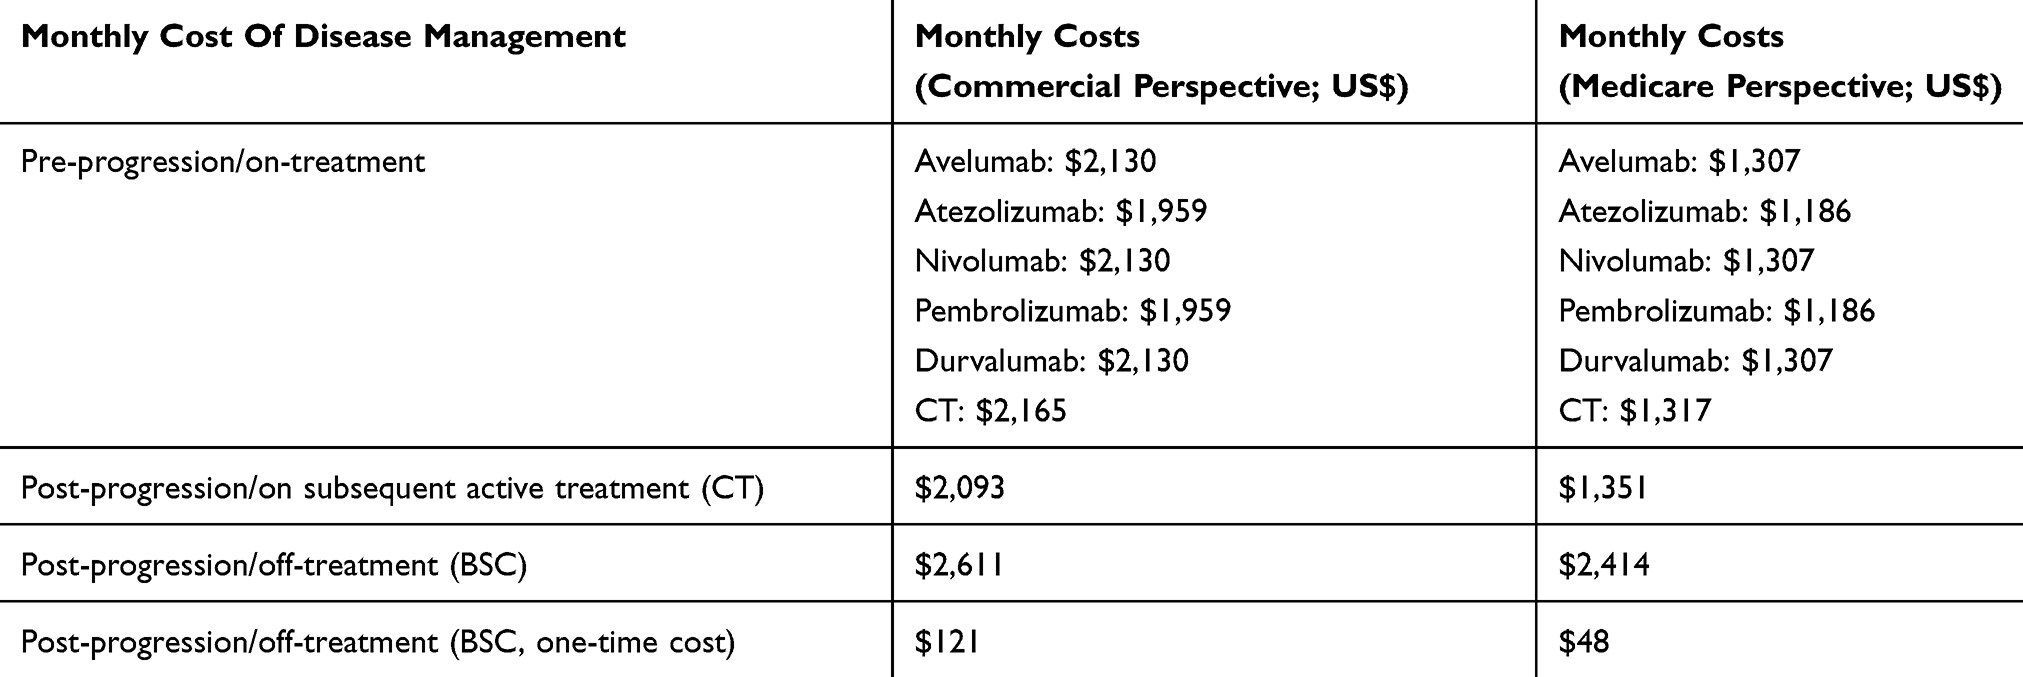 |
Table 5 Disease Management Costs |
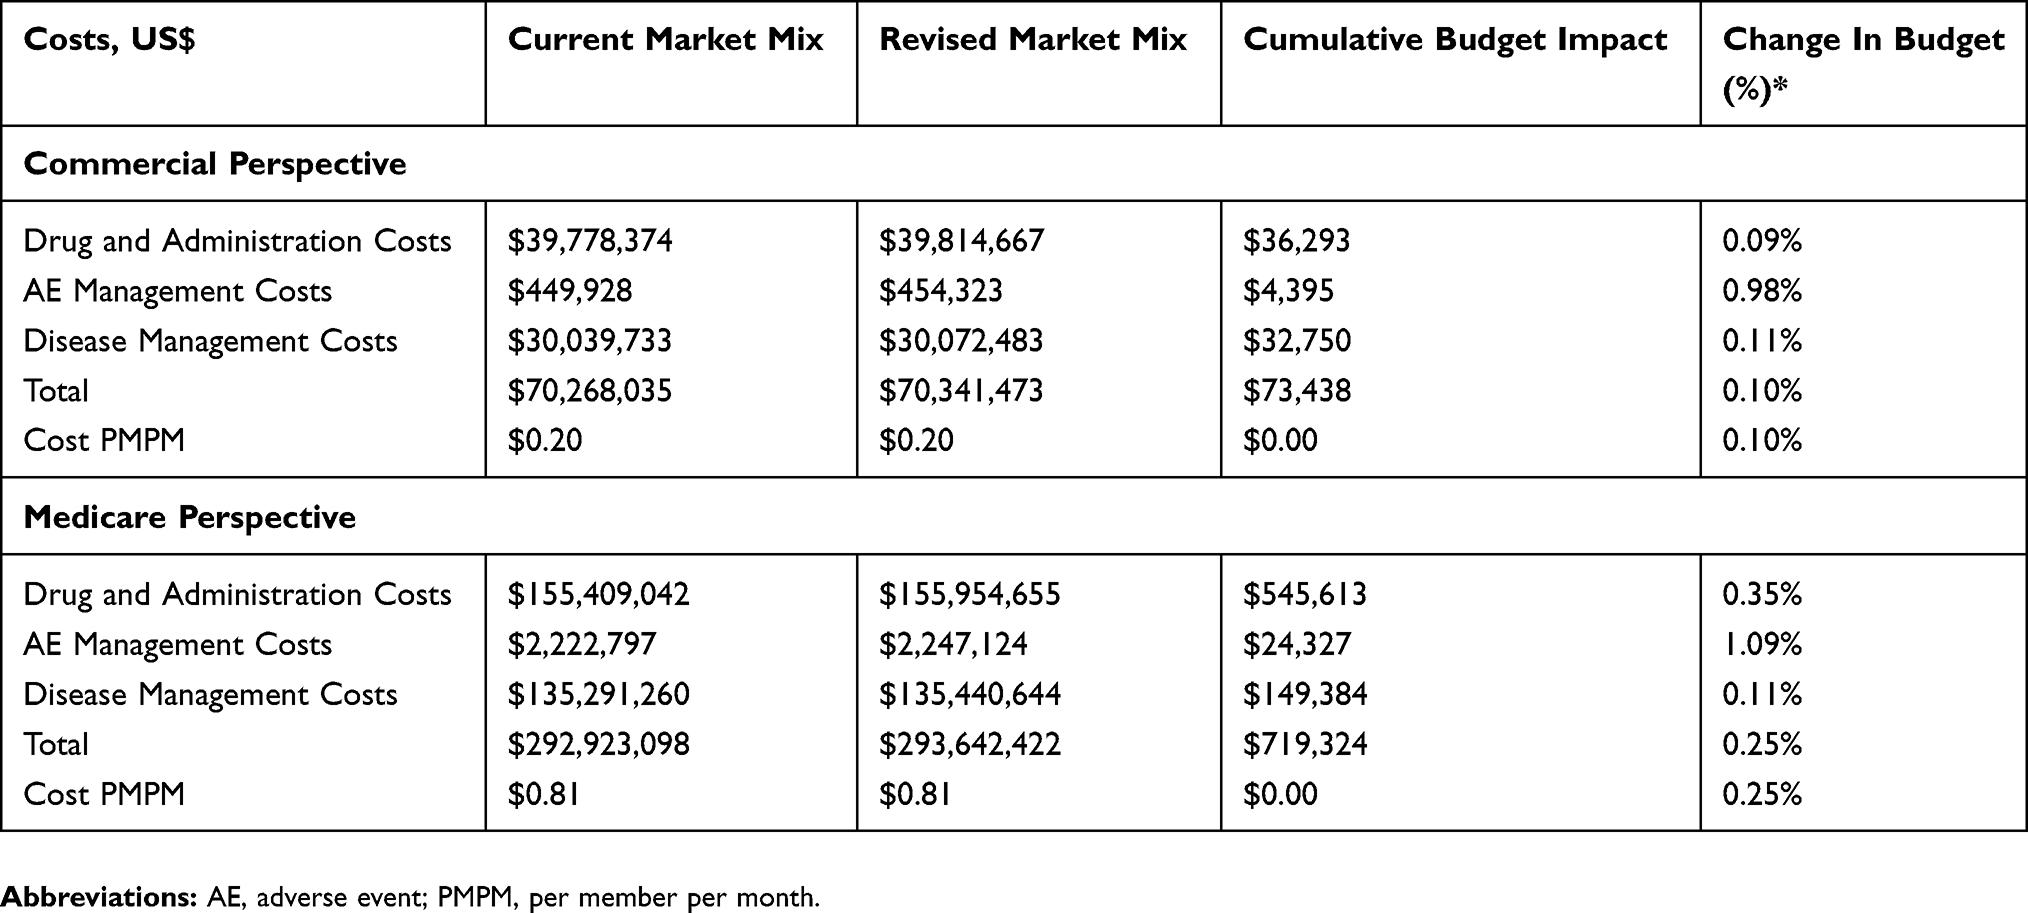 |
Table 6 Budget Impact Over 3-Year Time Horizon |
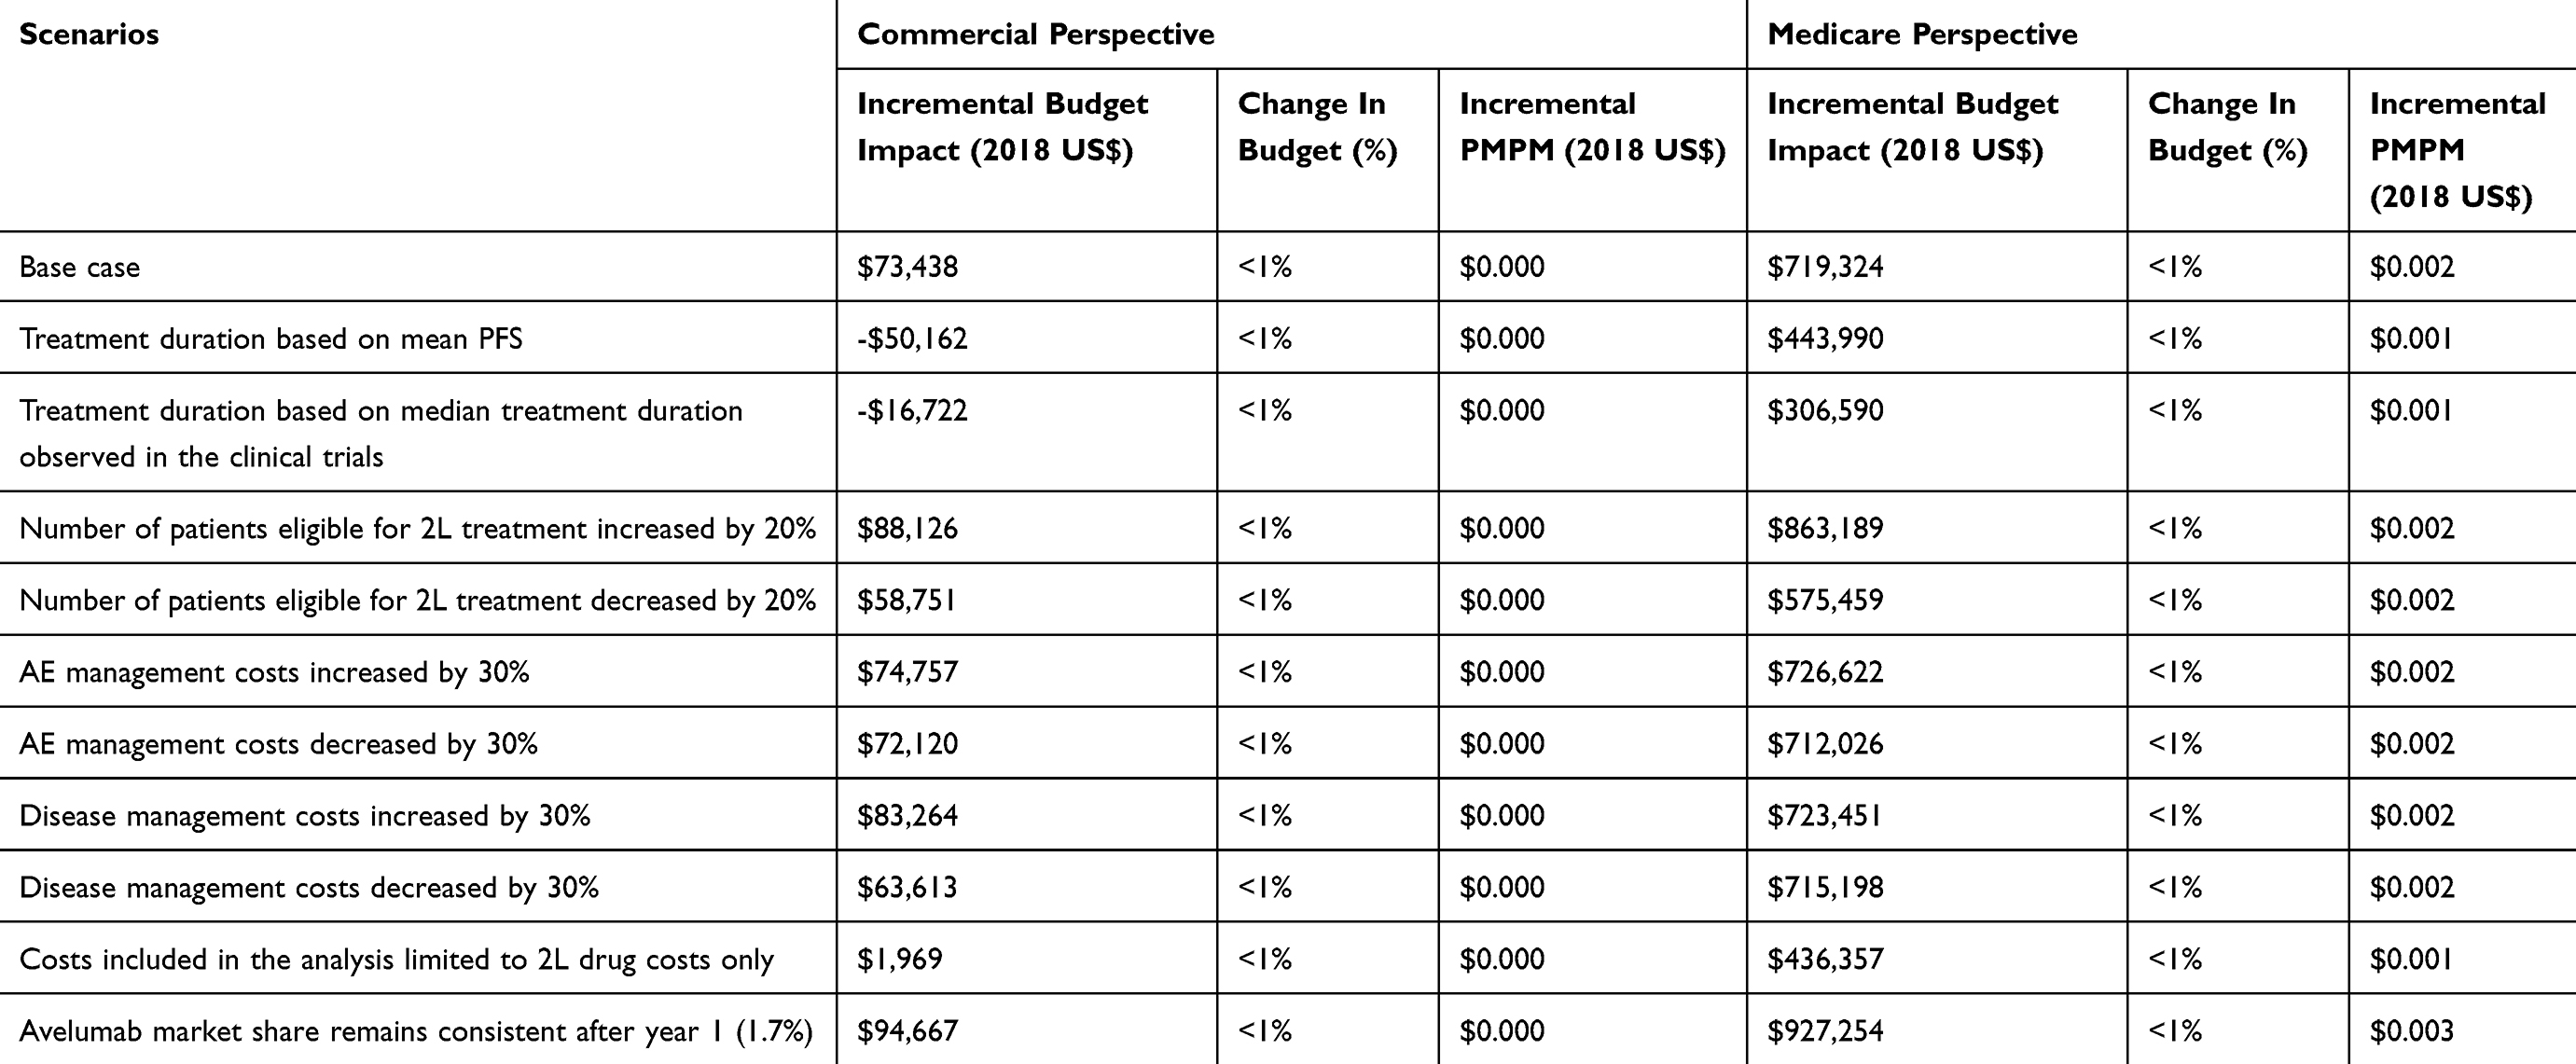 |
Table 7 Results Of Sensitivity Analyses – Budget Impact Over 3-Year Time Horizon |
Cost Estimation
The treatment costs used in the model included drug and administration costs, AE (grade ≥3) and related HRU, and disease management costs. The International Society of Pharmacoeconomics and Outcomes Research (ISPOR) and formulary submission BIM guidelines from the Academy of Managed Care Pharmacy (AMCP) established that no discounting of costs is required when the time horizon of 3 years is considered and as such, discounting was not applied.20,21 All cost inputs were set to 2018 values using the medical component of the Consumer Price Index (CPI) from the Bureau of Labor Statistics.22
The total medication cost per month was calculated by multiplying the average drug cost per administration with the frequency of corresponding medication administrations per month derived from dosing schedules. Drug costs were based on average wholesale price (AWP) from the 2018 online edition of the Red Book for the commercial perspective and on the average sales price (ASP) from the Centers for Medicare and Medicaid Services for the Medicare perspective.23,24 Dosing of avelumab and other IOs was based on flat dosing as included in the recent package inserts using whole vials to meet the required dose.25–29 Dosages for CT were based on average body surface area (1.89 m2) observed in patients in the mUC cohort in the Javelin Solid Tumor trial (NCT01772004), with the exception of carboplatin treatment, which was based on the area under the plasma drug concentration–time curve.13 The cost of CT regimens was taken as a weighted average of the “basket” of CT as described in a real-world study of treatment patterns in mUC patients in the US.10 Median TTF was extracted for 2L CT and IO agents from a real-world evidence study using the US Oncology Network electronic health records database and used as a proxy for treatment duration.30 Treatment durations and drug and administration costs are displayed in Table 2. Additionally, 21% of 2L patients were assumed to progress to 3L therapy based on real-world US data.30 The 3L CT mix (carboplatin 19%, gemcitabine 19%, docetaxel 19%, paclitaxel 20% and pemetrexed 52%) was based on US real-world data.10 This sum is greater than 100% due to combination therapy. The 3L treatment duration in these patients was assumed to last from the end of 2L treatment up until 3 months before death (derived using OS from clinical trials).11,13,31–33
The risk and incidence of AEs related to each treatment were obtained from package inserts of the IO agents for CT (Table 3).25–29,31 The grade ≥3 AEs occurring in more than 5% of the patients were likely to have significant cost implications, whereas all grade ≥3 immune-related AEs were considered without restrictions on the frequency of occurrences. Micro-costing of AEs was based on HRU estimates provided by two oncologists in conjunction with published literature.34 HRU unit costs were extracted from the Healthcare BlueBook database for the commercial perspective, and for the Medicare perspective, were extracted from the Centers for Medicare and Medicaid Services.35–37 The Healthcare Cost and Utilization Project (HCUP) database was used to obtain hospitalization costs related to AEs for both perspectives.38 The HRU costs (related to AEs) are listed in Table 4.
Management costs were accrued separately for each phase of the disease course (Table 5). The phases were: pre-progression (on treatment), post-progression (on subsequent 3L active treatment) and post-progression/off-treatment (best supportive care). The frequencies of HRU in each treatment group (individual IO agents and CT) were estimated by two expert oncologists. Unit cost inputs for the commercial perspective were obtained from the Healthcare BlueBook and for the Medicare perspective from the Centers for Medicare and Medicaid Services.35–37 Best supportive care costs were included in the last three months of life after 3L treatment.
Results
Commercial Perspective
In the base-case scenario using a hypothetical cohort of 30,000,000 members in a commercial health plan, a total of 884 patients were estimated to be eligible for 2L treatment over a three-year time horizon. Prior to the introduction of avelumab, the total cost for treating patients with locally advanced or mUC over a three-year time period was estimated to be US$70,268,035. The budget impact of introducing avelumab was estimated to be approximately cost-neutral with a $73,438 incremental total cost increase (or 0.10% change in budget) over the three-year time period (Figure 2, Table 6). The incremental cost per member per month (PMPM) of avelumab was approximately zero ($0.00) during the three-year time period. The total PMPM costs prior to and after the introduction of avelumab were approximately the same ($0.20).
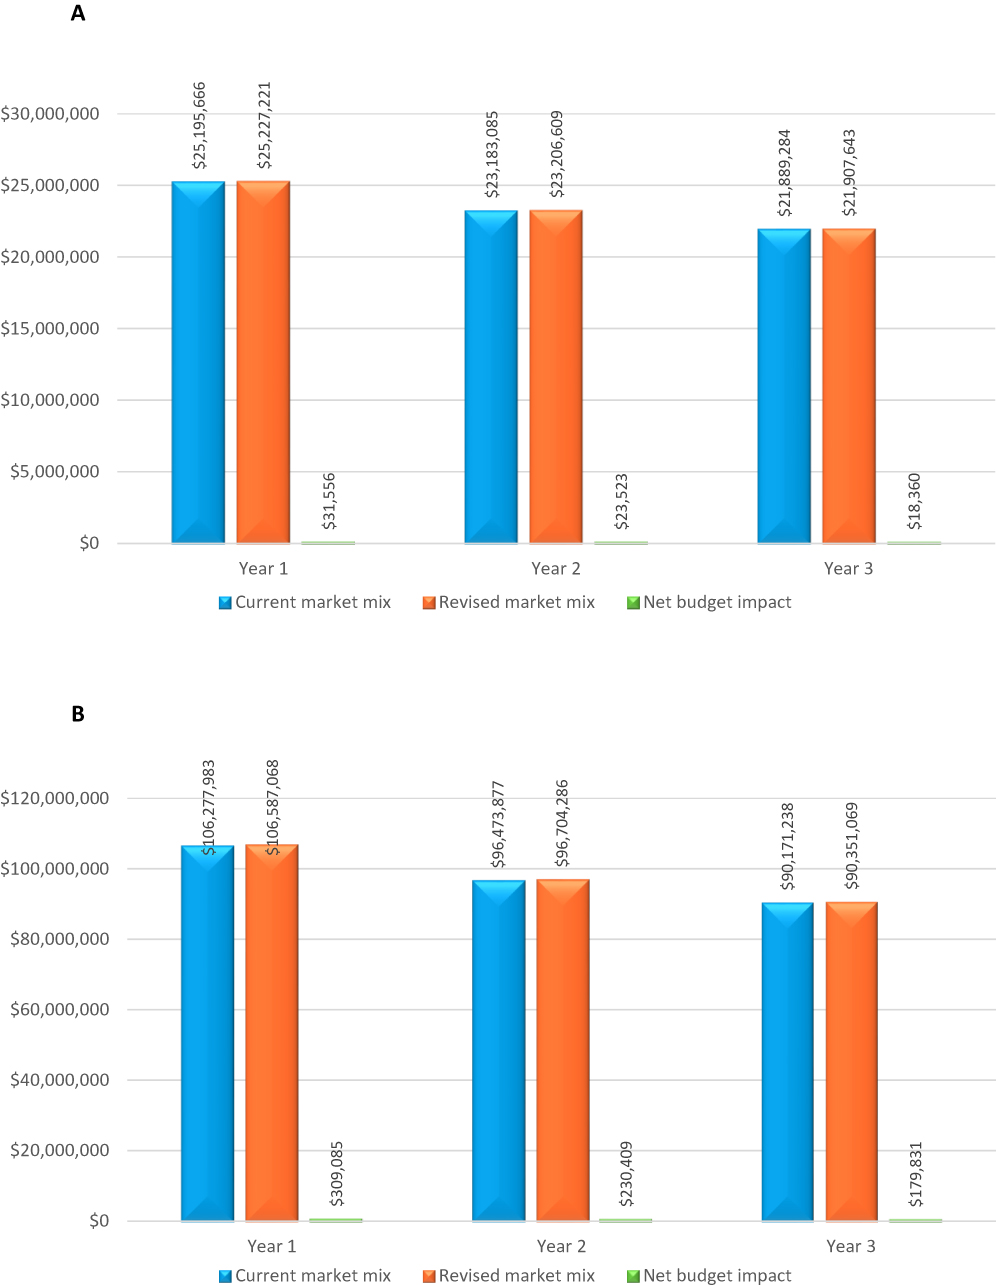 |
Figure 2 Budget impact of avelumab in the treatment of locally advanced or mUC (A) Commercial perspective and (B) Medicare perspective (US$). Abbreviation: UC, urothelial carcinoma. |
Medicare Perspective
As demonstrated in the base case scenario using a hypothetical cohort of 30,000,000 Medicare beneficiaries, there was an estimated total of 4,705 patients eligible for 2L treatment over a three-year time period. Prior to the introduction of avelumab, the total cost of treating patients with locally advanced or mUC over 3 years was estimated to be $292,923,098 from a Medicare perspective. The budget impact of introducing avelumab was estimated to be approximately cost-neutral with a marginal increase of $719,324 (0.25% change in budget) in incremental total costs over the three-year time period (Figure 2, Table 6). The incremental PMPM cost was approximately zero ($0.00) over 3 years. The total direct PMPM healthcare costs prior to and after the introduction of avelumab were estimated to be approximately the same ($0.81).
Sensitivity Analyses
As model inputs are subject to uncertainty, deterministic one-way sensitivity analyses were performed to examine the effect of uncertainty around key parameters on the model outputs for both the commercial and Medicare perspectives. The results of the sensitivity analyses (Table 7) show that the scenario with the highest impact was when the avelumab market share remained consistent after year 1. However, all scenarios in both the commercial and the Medicare perspective continued to be approximately cost-neutral as the change in budget never exceeded 1%. This is also reflected in the incremental PMPM cost consistently remaining at a cost-neutral value across scenarios ($0.00).
Discussion
This BIM compared the costs of hypothetical health plan populations with locally advanced or mUC patients receiving 2L treatment and estimated the budget impact of adding avelumab as a 2L treatment option from US commercial and Medicare payer perspectives. In the 2L setting for patients with locally advanced or mUC, use of systemic CT may be limited to certain patients due to advanced age and treatment ineligibility demonstrating an important need for alternative treatment options.11,40 Related to this and the availability of multiple IO therapies, IOs have been adapted quickly and are widely used. This analysis specifically examines the budget impact of adding one IO agent to a treatment landscape with other IO agents and CT for patients with locally advanced or mUC disease treated in routine clinical practice in the US.10,30
In the Javelin Solid Tumor trial (NCT01772004), avelumab demonstrated an overall response rate of 17.3% in patients with ≥6 months follow-up (median 13.6 months) and responses were deemed durable; the disease control rate was 44.6% during this follow-up period.13 A 64.1% of responders had an ongoing response (25/39) with a median duration of response of 20.1 months.34 The Javelin Solid Tumor trial led to FDA approval and also supported the inclusion of avelumab as a standard treatment in NCCN guidelines for 2L treatment of locally advanced or mUC.19
The effectiveness of avelumab was also supported in a real-world observational study conducted among locally advanced or mUC patients in a large US community oncology setting (US Oncology Network) which found that the majority of patients in the 2L setting were treated with IO agents.30 The proportion of patients in 2L treated with IO agents from the real-world study was closely aligned with the market shares in year 1 of the model, 56.8% vs 55.0%, respectively; however, in the model it was assumed that the use of IO agents would shift from 2L to 1L hence the increasing shared of CT in the 2L setting in year 2 and 3. Patients who received 2L therapy with IO agents as compared to CT had comparable baseline characteristics, and a significantly prolonged TTF across all lines of treatment in the study.30
Additional comparative evidence between IO agents and CT regimens were documented in a systematic literature review which assessed the clinical outcomes and safety associated with pharmacological interventions in locally advanced or mUC patients who progressed during or after 1L platinum-based CT. In the review, IO agents were shown to improve response rates, durability of response, and had acceptable tolerability compared to CT regimens.7 From an economic viewpoint, patients with mUC are generally elderly, with a high level of comorbidities, and incur substantial HRU and costs, driven primarily by hospitalizations.41–45
Budget impact models are used to assist health plan budget decision-makers to evaluate the financial impact of adopting new therapies.20 The current BIM results show the projected financial implications of adding avelumab to the 2L treatment paradigm and demonstrate a relatively negligible financial impact on health plans from the perspective of both commercial and Medicare payers.
Limitations
The validity of the results is only as plausible as the inputs and assumptions made within the model. The eligible population size used in the model and its estimates were derived through age-specific epidemiology data for hypothetical cohorts of 30,000,000 beneficiaries (commercial and Medicare). The budget impact estimates may not be generalizable to health plans with different patient populations or cost structures and would need to be adjusted based on the plan structure and/or beneficiary population. The clinical inputs including OS and incidence of AEs were based on results from the clinical trials of 2L treatments; therefore, the assumption was that these outcomes were applicable for 2L treatments in real-world practice in the US. Additionally, the model assumed that the introduction of avelumab only altered the treatment mix of the IO agents’ market shares and not the shares of CT. The selection of comparator IO agents was based on internal market research data that was validated by a specialist oncologist; these are, however, best estimates and are subject to a degree of uncertainty. The analysis did not consider clinical outcomes such as response levels explicitly. Differences in response levels across the treatments were assumed to be implicitly captured through their clinical inputs (i.e., TTF and OS). Moreover, only costs of subsequent treatments were considered, neglecting any possible further impact on clinical outcomes. Lastly, given there were data gaps in disease management costs and some of the AE management costs, a micro-costing approach was applied, taking unit cost of healthcare resources to frequency of use for each resource obtained from oncologists’ opinion. Generally, any inputs or assumptions informed by expert opinion are subject to some degree of uncertainty.
Conclusions
While providing an additional treatment option for locally advanced and mUC patients, this BIM suggests that, based on projected market shares, the adoption of avelumab in the 2L setting would result in a cost-neutral budget impact for both commercial and Medicare health plans in the US. Specifically, the estimated incremental budget impact of avelumab use in a commercial health plan was small, $0.00 PMPM over a 3-year time horizon. The incremental budget impact in a hypothetical Medicare health plan was also $0.00 PMPM over a 3-year time horizon. Avelumab, a novel IO agent, shown to be clinically effective and safe, can provide both commercial and Medicare healthcare decision-makers in the US with an affordable 2L treatment option for locally advanced or mUC patients.
Abbreviations
1L, first-line; 2L, second-line; 3L, third-line; AE, adverse event; AMCP, Academy of Managed Care Pharmacy; ASP, average sales price; AWP, average wholesale price; BIM, budget impact model; CT, chemotherapy; CrCl, creatine clearance; CTLA4, cytotoxic T-lymphocyte-associated protein 4; FDA, Food and Drug Administration; HCUP, Healthcare Utilization Project; HRU, healthcare resource utilization; IO, immuno-oncology; ISPOR, International Society for Pharmacoeconomics and Outcomes Research; mUC, metastatic urothelial cancer; NCCN, National Cancer Comprehensive Network; ORR, overall response rate; PD-1, programmed cell death protein 1; PD-L1, programmed death-ligand 1; PMPM, per member per month; SEER, Surveillance, Epidemiology, and End Results Program; TTF, time-to-treatment failure; US, United States, UC, urothelial cancer.
Acknowledgments
We would like to acknowledge Dimitrios Tomaras and Nazia Merritt from Purple Squirrel Economics (PSE) for their assistance in preparing and drafting the manuscript. Parts of this research were previously published in two poster presentations at the Academy of Managed Care Pharmacy (AMCP) Nexus 2017 conference, October 16–19, Texas (C15/C16 https://www.jmcp.org/doi/pdf/10.18553/jmcp.2017.23.10-a.s1).
Author Contributions
T. Kongnakorn, M. Bharmal, and M. Kearney made substantial contributions to conception and design, data acquisition, and data analysis and interpretation. H. Phatak, A. Benedict, A. Bhanegaonkar, and M. Galsky contributed to data acquisition, analysis, and interpretation. All authors contributed to drafting and revising the article, agree to be accountable for its contents, and approve of the final version to be published.
Disclosure
T. Kongnakorn and A. Benedict are employees of Evidera. T. Kongnakorn reports grants from Merck Healthcare KGaA, Darmstadt, Germany, outside the submitted work. M. Kearney is an employee of Merck Healthcare KGaA, Darmstadt, Germany. M. Bharmal, A. Bhanegaonkar and H. Phatak are employees of EMD Serono, Rockland, MA (a business of Merck KGaA). M. Galsky is an employee of Icahn School of Medicine at Mount Sinai, New York, NY, and reports a consulting/advisory role with Genentech, Bristol-Myers Squibb, Merck, AstraZeneca, EMD Serono, Pfizer, and Astellas and received research funding from Merck, Pfizer, AstraZeneca, Bristol-Myers Squibb, Roche/Genentech, and Seattle Genetics, outside the submitted work. The authors report no other conflicts of interest in this work.
References
1. National Cancer Institute. Cancer stat facts: bladder cancer. Surveillance, epidemiology, and end results program. https://seer.cancer.gov/statfacts/html/urinb.html. Publication date unknown.
2. Siegel R, Miller K, Jemal ACancer statistics, 2017. CA Cancer J Clin. 2017;67(1):7–30.
3. American Cancer Society. Bladder Cancer. American Cancer Society. Available from: https://www.cancer.org/content/cancer/en/cancer/bladder-cancer/. Published 2017.
4. Daneshmand S Epidemiology and Risk Factors of Urothelial (transitional cell) Carcinoma of the Bladder. UptoDate. Available from: http://www.uptodate.com/contents/epidemiology-and-risk-factors-of-urothelial-transitional-cell-carcinoma-of-the-bladder. Published 2017.
5. Bukhari N, Al-Shamsi HO, Azam F. Update on the treatment of metastatic urothelial carcinoma. ScientificWorldJournal 2018;2018:5682078.
6. Sridhar S. Evolving treatment of advanced urothelial cancer. J Oncol Pract. 2017;13(5):309–315.
7. Bharmal M, Guenther S, Rosen G, et al. Second-line therapy in patients with locally advanced or metastatic urothelial cancer: a systematic literature review. Value Health. 2017;20(9): A414.
8. Galsky MD, Hahn NM, Rosenberg J, et al. Treatment of patients with metastatic urothelial cancer “unfit” for cisplatin-based chemotherapy. J Clin Oncol. 2011;29:2432–2438.
9. Galsky MD, Pal SK, Lin SW, et al. Real-world effectiveness of chemotherapy in elderly patients with metastatic bladder cancer in the United States. Bladder Cancer. 2018;4(2):227–238.
10. Simeone J, Nordstrom B, Patel K, et al. Treatment patterns and overall survival in metastatic urothelial carcinoma in a real-world US setting. Cancer Epidemiol. 2019;60:121–127. Epub ahead of print. doi:10.1016/j.canep.2019.03.013
11. Powles T, Duran I, van der Heijden MS, et al. Atezolizumab versus chemotherapy in patients with platinum-treated locally advanced or metastatic urothelial carcinoma (IMvigor211): a multicenter, open-label, phase 3 randomised controlled trial. Lancet. 2018;391(10122):748–757.
12. Oing C, Rink M, Oechsle K, et al. Second line chemotherapy for advanced and metastatic urothelial carcinoma: vinflunine and beyond—a comprehensive review of the current literature. J Urol. 2016;195(2):254–263.
13. Patel M, Ellerton J, Infante JR, et al. Avelumab in metastatic urothelial carcinoma after platinum failure (JAVELIN Solid Tumor): pooled results from two expansion cohorts of an open-label, phase 1 trial. Lancet. 2018;19(1):51–64.
14. Bharmal M, Guenther S, Kearney M, et al. Epidemiology of locally advanced or metastatic urothelial cancer in the US, Europe, and Japan. Value Health. 2017;20(9):A419.
15. America’s Health Insurance Plans (AHIP). Medicare advantage demographics report, 2013. America’s Health Insurance Plans (AHIP). Available from: https://www.ahip.org/wp-content/uploads/2016/02/MADemo_Report_2-3-16.pdf. Published 2016.
16. Noone AM, Howlader N, Krapcho M, et al. SEER Cancer Statistics Review, 1975–2015. Bethesda, MD: National Cancer Institute, https://seer.cancer.gov/csr/1975_2015/. based on November 2017 SEER data submission, posted to the SEER web site, April 2018.
17. United States Census Bureau Health insurance coverage status and type of coverage by selected characteristics. United States Census Bureau. Available from: https://www.census.gov. Published 2018.
18. Bellmunt J, Orsola A, Leow JJ, et al.Bladder cancer: ESMO Practice Guidelines for diagnosis, treatment and follow-up. Ann Oncol. 2014;25 Suppl 3(3):iii40–8.
19. National Comprehensive Cancer Network®. NCCN clinical practice guidelines in oncology (NCCN Guidelines®), bladder cancer, version 2.2018. Oncolife Medical Center. Available from: http://oncolife.com.ua/doc/nccn/Bladder_Cancer.pdf#page=26. Published 2018.
20. Sullivan SD, Mauskopf JA, Augustovski F, et al.Budget impact analysis-principles of good practice: report of the ISPOR 2012 Budget Impact Analysis Good Practice II Task Force. Value Health. 2014;17(1):5–14.
21. Pannier A, Dunn JD AMCP format for formulary submissions, version 4.0. J Manag Care Spec Pharm. 2016;22(5):448.
22. United States Department of Labor. Medical consumer price index. Bureau of Labor Statistics. Available from: https://www.bls.gov. Published 2018.
23. IBM Watson Health. IBM Micromedex RED BOOK®. Truven Health Analytics Inc. Available from: http://truvenhealth.com/products/micromedex/product-suites/clinical-knowledge/red-book. Published 2018.
24. Centers for Medicare & Medicaid Services (CMS). ASP Drug Pricing Files. CMS.gov. 2018a. Available from: https://www.cms.gov/Medicare/Medicare-Fee-for-Service-Part-B-Drugs/McrPartBDrugAvgSalesPrice/2018ASPFiles.html. Published July 2018.
25. Avelumab [package insert]. Rockland, MA: EMD Serono Inc; 2018.
26. Atezolizumab [package insert]. South San Francisco, CA: Genentech Inc; 2018.
27. Durvalumab [package insert]. Wilmington, DE: AstraZeneca; 2018.
28. Nivolumab [package insert]. Princeton, NJ: Bristol-Myers Squibb; 2018.
29. Pembrolizumab [package insert]. Frederick, MD: Merck Sharpe & Dohme Corp; 2018.
30. Doshi GK, Bhanegaonkar A, Bharmal M, et al.SPEAR-bladder (study informing treatment pathway decision in bladder cancer): first-through Third-Line Time to Treatment Failure in the US. J Clin Oncol. 2018;36(S15):4544.
31. Bellmunt J, de Wit R, Vaughn DJ, et al.Pembrolizumab as second-line therapy for advanced urothelial carcinoma. N Engl J Med. 2017;376(11):1015–1026.
32. Powles T, O’Donnell PH, Massard C, et al.Efficacy and safety of durvalumab in locally advanced or metastatic urothelial carcinoma. JAMA Oncol. 2017;3(9):e172411.
33. Sharma P, Baron A, Necchi A, et al.Nivolumab monotherapy in patients with advanced platinum-resistant urothelial carcinoma: efficacy and safety update and association between biomarkers and overall survival in CheckMate 275. Cancer Res. 2018;78(13 Suppl): Abstract nr CT178.
34. Apolo AB, Ellerton J, Infante JR, et al. Avelumab Treatment of Metastatic Urothelial Carcinoma (mUC) in the phase 1b JAVELIN Solid Tumor study: updated analysis with ≥ 12 months of follow-up in all patients.
35. Healthcare Bluebook. Search for a procedure, test or service. Healthcare Bluebook. Available from: https://www.healthcarebluebook.com/. Publication date unknown.
36. Centers for Medicare & Medicaid Services (CMS). (2018b). Clinical diagnostic laboratory fee schedule. CMS.gov. Available from: https://www.cms.gov/Medicare/Medicare-Fee-for-Service-Payment/ClinicalLabFeeSched/index.html. Published 2018.
37. Centers for Medicare & Medicaid Services (CMS). (2018c). Physician fee schedule look-up tool. CMS.gov. https://www.cms.gov/Medicare/Medicare-Fee-for-Service-Payment/ClinicalLabFeeSched/index.html. Published 2018.
38. US Department of Health & Human Services. Healthcare cost and utilization project. Agency for Healthcare Research and Quality. Available from: https://hcupnet.ahrq.gov/#setup. Published 2015.
39. Toner RW, Pizzi L, Leas B, et al.Costs to hospitals of acquiring and processing blood in the US: a Survey of hospital-based blood banks and transfusion services. Appl Health Econ Health Policy. 2011;9(1):29–37.
40. Dietrich B, Srinivas S Urothelial carcinoma: the evolving landscape of immunotherapy for patients with advanced disease. Res Rep Urol 2018;10:7–16.
41. Kearney M, Esposito D, Russo L, et al.Locally advanced or metastatic urothelial carcinoma in the United States: economic burden and healthcare utilization. Value Health. 2018;21(S1): S45.
42. Flannery K, Cao X, He J, et al.Real-world treatment costs and resource utilization among patients with metastatic bladder cancer. Ann Oncol. 2017;28(suppl. 5): v395–v402.
43. Flannery K, Cao X, He J, et al.Survival rates and health care costs for patients with advanced bladder cancer treated and untreated with chemotherapy. Clin Genitourin Cancer. 2018;16(4) e909–e917.
44. Malangone-Monaco E, Wilson K, Varker H, et al. A real-world study of chemotherapy treatment and costs in metastatic urothelial cancer (mUC) patients in the United States. J Clin Oncol. 2017;35(15):e16009–e16009. doi:10.1200/JCO.2017.35.15_suppl.e16009
45. Rao S, Gooden K, Landsmen-Blumberg P, et al.Treatment patterns and economic burden of illness in patients with advanced bladder cancer receiving second-line therapy. J Clin Oncol 2017;35(6_suppl):320. doi:10.1200/JCO.2017.35.6_suppl.320.
 © 2019 The Author(s). This work is published and licensed by Dove Medical Press Limited. The full terms of this license are available at https://www.dovepress.com/terms.php and incorporate the Creative Commons Attribution - Non Commercial (unported, v3.0) License.
By accessing the work you hereby accept the Terms. Non-commercial uses of the work are permitted without any further permission from Dove Medical Press Limited, provided the work is properly attributed. For permission for commercial use of this work, please see paragraphs 4.2 and 5 of our Terms.
© 2019 The Author(s). This work is published and licensed by Dove Medical Press Limited. The full terms of this license are available at https://www.dovepress.com/terms.php and incorporate the Creative Commons Attribution - Non Commercial (unported, v3.0) License.
By accessing the work you hereby accept the Terms. Non-commercial uses of the work are permitted without any further permission from Dove Medical Press Limited, provided the work is properly attributed. For permission for commercial use of this work, please see paragraphs 4.2 and 5 of our Terms.