")
Back to Journals » ClinicoEconomics and Outcomes Research » Volume 11
Budget Impact Of Eltrombopag As First-Line Treatment For Severe Aplastic Anemia In The United States
Authors Tremblay G, Said Q, Roy AN, Cai B, Ashton Garib S, Hearnden J, Forsythe A
Received 7 August 2019
Accepted for publication 9 October 2019
Published 12 November 2019 Volume 2019:11 Pages 673—681
DOI https://doi.org/10.2147/CEOR.S226323
Checked for plagiarism Yes
Review by Single anonymous peer review
Peer reviewer comments 2
Editor who approved publication: Prof. Dr. Dean Smith
Gabriel Tremblay,1 Qayyim Said,2 Anuja Nidumolu Roy,2 Beilei Cai,2 Shan Ashton Garib,1 Jaclyn Hearnden,1 Anna Forsythe1
1Purple Squirrel Economics, New York, NY, USA; 2Novartis Pharmaceutical Corporation, East Hanover, NJ, USA
Correspondence: Gabriel Tremblay
Purple Squirrel Economics, 4 Lexington Ave, Suite 15K, New York, NY 10010, USA
Tel +1 418 317 5627
Email [email protected]
Background: Severe aplastic anemia (SAA) is a rare autoimmune condition resulting in low blood cell counts across lineages. Immunosuppressive therapy (IST) has demonstrated low response, toxicity, and risk of transformation. In a Phase I/II trial, the addition of eltrombopag to first-line IST increased response rates relative to an IST-only historical cohort.
Methods: A model was developed to estimate the budget impact of treating SAA with eltrombopag-based therapy from a US private healthcare system perspective. A simulated cohort of newly diagnosed SAA patients based on the total US population received 6 months of IST ± eltrombopag and were followed for 1 year, with mutually exclusive patient cohorts entering in years 1, 2, and 3. The model assessed the budget impact of first-year treatment for each cohort without considering subsequent years. At 6 months, responders in either arm received maintenance therapy (low-dose cyclosporine), and non-responders received 6 months of second-line eltrombopag monotherapy. Costs considered included first-line, maintenance, and second-line therapy, administration, routine care, mortality, and adverse events (AEs). All cost data were reported in 2018 US dollars.
Results: The annual incidence of aplastic anemia was 0.000234%, with 83.8% of cases assumed to be SAA. Based on trial data, 94% of patients receiving eltrombopag and IST responded versus 66% of patients receiving IST, with a 0.3% reduction in the annual risk of mortality for the eltrombopag + IST group. Use of first-line eltrombopag in a model SAA population based on the total US population increased overall costs by $50 million over 3 years. First-line drug costs accounted for an increase of $69 million, while improved response produced $19 million in secondary therapy cost savings. Sensitivity analyses confirmed the robustness of the analysis.
Conclusion: High response rates combined with reduced rescue medication use and mortality in patients treated with eltrombopag and IST mediated higher medication costs.
Keywords: budget impact analysis, costs, eltrombopag, severe aplastic anemia, thrombopoietin receptor agonist, United States
Introduction
Severe aplastic anemia (SAA) is a rare and potentially life-threatening autoimmune disorder of bone marrow that affects approximately two people per million in Europe;1 in the absence of robust US epidemiology data, it is assumed that the incidence is similar in the US.2 Due to immune-mediated destruction of progenitor cells, the bone marrow fails to produce sufficient blood cells.3 Patients cannot achieve adequate levels of peripheral multilineage blood cells, resulting in neutropenia, anemia, and thrombocytopenia.3 The debilitating symptoms experienced by patients include frequent infections, bleeding, and fatigue.3 These symptoms, individually or combined, have a significant impact on patient survival and quality of life.4 Mild or moderate forms of aplastic anemia may not require treatment, while the severe form requires immediate medical intervention to prevent complications.5 SAA worsens with time as progenitor cell populations dwindle. Ideally, the anemia’s originating cause is identified and remedied.5 A retrospective chart review of patients in the US and France found that patients with SAA have high healthcare resource utilization, with frequent red blood cell and platelet transfusions, hospitalizations, emergency room visits, and office visits.6
The goal of SAA treatment is to increase the populations of healthy blood cells. Treatment options for SAA have historically included hematopoietic stem cell transplantation (HSCT) and immunosuppressive therapy (IST).7,8 Older patients (>50 years) are rarely recommended for HSCT, due to comorbidities and the risks of the procedure, including GVHD, and receive IST instead.9 For transplant-eligible patients, human leukocyte antigen-identical sibling donors are preferred. If no donor is available, IST is promptly initiated. Immunosuppressive therapy impedes blood cell destruction so that populations may be eventually replenished. However, nearly one-third of patients (30%) do not respond to IST.8 Additionally, IST is associated with severe side effects, including a potential transformation to leukemia.10,11 Patients who are unable to undergo HSCT and who do not adequately respond to IST may become dependent on frequent, time-consuming blood transfusions, with significant consequences for the quality of life.12,13 Transfusions are expensive and resource-intensive. Further, patients become refractory with time, and the benefits of transfusion decline.14
Not all patients achieve full hematologic recovery following IST;8 thus, many patients require more advanced therapeutic options to achieve adequate blood counts. Eltrombopag is an oral thrombopoietin-receptor agonist that interacts with the transmembrane domain of the thrombopoietin receptor, augmenting peripheral blood cell levels across lineages and thereby reconstituting the bone marrow and leading to increased blood cell counts.15 In an early trial, approximately 45% of immunosuppression-refractory SAA patients responded to eltrombopag as a single agent.16 Similar results were seen in a 2017 prospective phase 1–2 study, in which patients received eltrombopag in addition to IST. After 6 months, the overall response rates were from 80% to 94%; a historical cohort of IST-only patients achieved overall response rates of 66%.17 In the US, eltrombopag is currently indicated in combination with IST for the first-line treatment of SAA, and as monotherapy for the treatment of patients with SAA who have had an insufficient response to IST.15
As a new treatment option for SAA, uptake of the eltrombopag–IST combination regimen could have budgetary implications. As it excludes eltrombopag, the existing literature on the budgetary consequences of SAA treatment is out-of-date. Here we present a budget impact model to analyze the relative expense of eltrombopag as first-line therapy for SAA.
Methods
Model Characteristics: Perspective, Time Horizon, Structure
Net budgetary impact was approached from a US healthcare system perspective, incorporating drug costs for primary and secondary therapy, routine medical costs, adverse event (AE) costs, and mortality costs. Complete and incomplete response rates were considered in calculations of treatment duration.17 A three-year time horizon was specified. Monthly costs were multiplied by the treatment duration, and yearly totals were summed to estimate cumulative impact.
To populate this framework, the model considered three main types of data: 1) the population of SAA patients, specifically those ineligible for HSCT with an insufficient response to IST and 2) the treatment market shares and their expected dynamics, 3) the various costs associated with SAA treatment.
All costs are reported in US dollars. Prices were adjusted for inflation using a 3.6% consumer price index (per the US Bureau of Labor).18 Figure 1 illustrates the model conceptual framework, which was developed in line with the International Society for Pharmacoeconomics and Outcomes Research (ISPOR) guidance on budget impact analyses.19
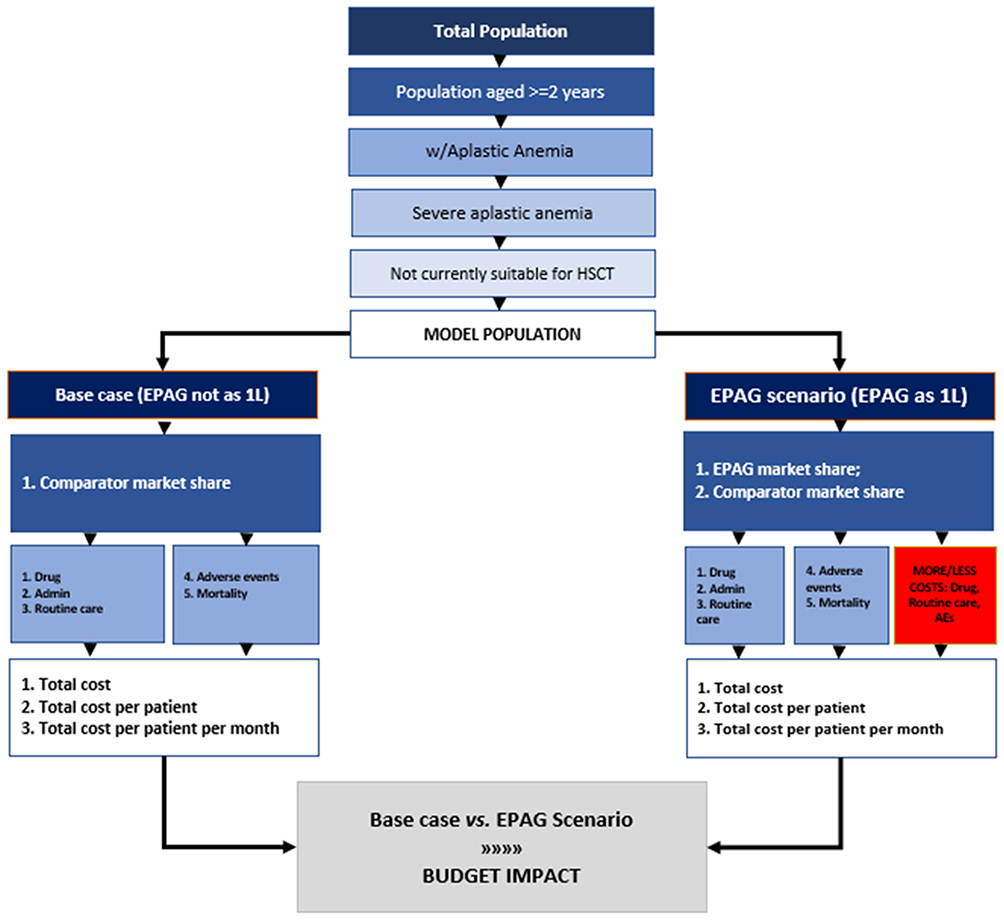 |
Figure 1 Graphical illustration of the model conceptual framework.Notes: Scenario names are in very dark blue; treatments are in dark blue; resource utilization is in light blue. The red box indicates where the EPAG scenario may be differentiated from the base case. White indicates economic endpoints, and gray denotes the budget impact incremental scenario. Abbreviations: 1L, first-line; EPAG, eltrombopag; HSCT, hematopoietic stem cell transplantation. |
Model Population
The model population was based on the total US population. A total population approach is often used in orphan diseases, as it can offer better validity for low incidence diseases or small subgroups.
In 2018, the population of the US was 328,033,240 with an estimated annual growth rate of 0.71%. Of the 98% of the population aged >2 years, 0.000234% have aplastic anemia. Within the aplastic anemia population, 83.8% have the severe form of the disorder.1 The target population was defined as patients with SAA who had an insufficient response to IST and who were considered currently unsuitable candidates for HSCT, corresponding to an estimated 100%.20 These values were applied in Table 1; population values are rounded to the nearest whole. It was assumed that 100% of SAA patients were beneficiaries of a private health plan that covered 100% of their drug costs.
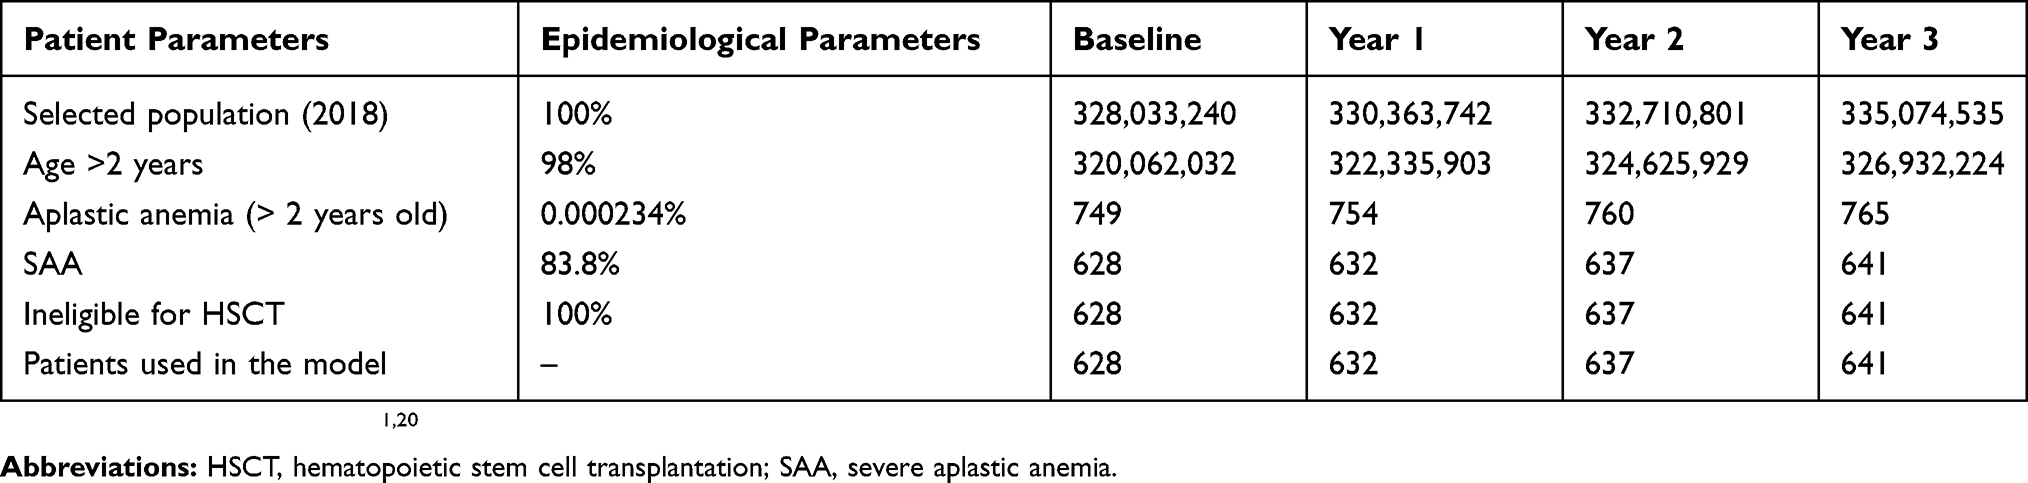 |
Table 1 Epidemiological Parameters For SAA Patients In The US |
Treatment Parameters
Medication Dosing And Costs
Table 2 presents medication monthly dosing based on Food and Drug Administration product information (eltrombopag) or Townsley et al 2017 (h-ATG, cyclosporine) and costs obtained from RED BOOK Online® (Truven Health Analytics; average wholesale prices).15,17 It was assumed that medication prices largely were not subjected to a Medicare discount, because the median age of patients in the Townsley clinical trial was 32 years, and only 13% of patients in the trial were >65 years of age. Medication costs did not include wastage; vial sharing and pill splitting were assumed to have occurred. Body surface area was 1.82 m2, and weight was 84.15 kg in the base case. Townsley reported a male:female ratio of 54%:46% and a median age of 32 years in the trial. Therefore, male:female weight in kilograms was 90.5:76.7, and weighted body weight was 84.152 kg (90.5*0.54+76.7*0.46).
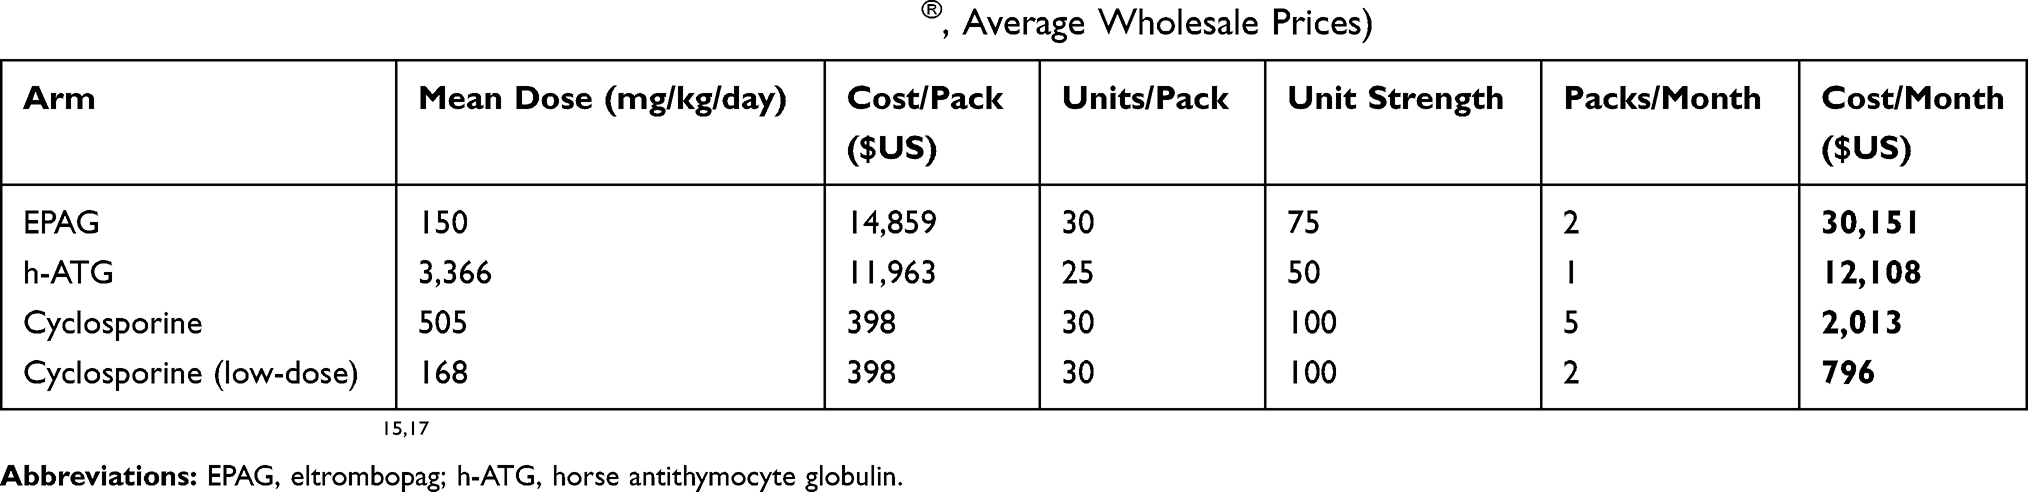 |
Table 2 Drug Costs (Source Of Costs: RED BOOK Online®, Average Wholesale Prices) |
Primary therapy consisted of eltrombopag, horse antithymocyte globulin (h-ATG), and cyclosporine or only h-ATG and cyclosporine (IST).
Market Share
In the base case scenario, IST was assigned 100% of the market share. In its first year post-introduction as first-line therapy for SAA, eltrombopag plus IST assumed 10% of the market share. In years 2 and 3, it assumed 20% and 30%, respectively. Market share estimates were based on the manufacturer’s internal data and published data.6
Duration
In the model, patients received primary therapy of IST or eltrombopag plus IST for 6 months. Upon achieving a complete response, patients began low-dose cyclosporine for the remainder of the year (maintenance therapy). In the base case (ie, first-line therapy of h-ATG + cyclosporine without eltrombopag), patients who did not achieve a complete or partial response switched to secondary therapy composed of eltrombopag.6
Response Rates
Response rates were based on data from the RACE Trial (NCT02099747). The rate of complete response for patients treated with eltrombopag and IST was 58.06%, versus 10.00% for patients treated with IST only (historical therapy).17 The partial response rate with eltrombopag plus IST was 35.48% versus 56.00% for IST.17 The total proportion of patients with response was therefore 93.54% for eltrombopag plus IST versus 66.00% for h-ATG and cyclosporine (Figure 2).
Complete response was defined as an absolute neutrophil count of ≥1000 per cubic millimeter, a hemoglobin level of ≥10 g per deciliter, and a platelet count of ≥100,000 per cubic millimeter. Nonresponse was defined as blood counts that continued to meet the Camitta criteria for SAA. Partial response was defined as blood counts that no longer met the criteria for SAA but also did not meet the criteria for a complete response.17
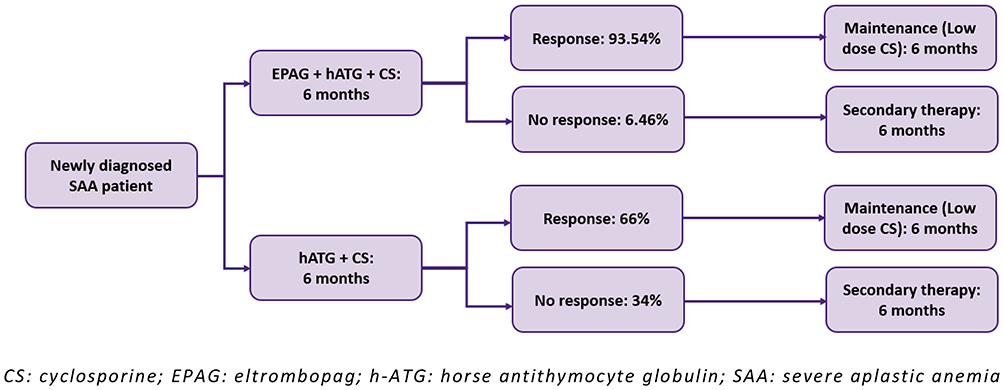 |
Figure 2 Treatment Pathway.Abbreviations: CS, cyclosporine; EPAG, eltrombopag; h-ATG, horse antithymocyte globulin; SAA, severe aplastic anemia. Note: Data from Townsley et al.17 |
Routine Care
In addition to the costs of drugs, the costs of routine care, AEs, and mortality were included in calculations of total financial impact for each treatment. Routine care describes the costs attributed to SAA patients for the delivery of auxiliary medical services, such as ER visits, hospitalizations, scans or tests, and specialist and general practitioner visits. Routine care cost is a product of the average number of patients who use a given service (eg, computed tomography [CT] scan) over a month multiplied by the frequency of the resource used (by that patient) per month, as calculated in Table 3. Monthly utilization data for all resources were converted from annual data reported in Peffault De Latour, R. et al, 2017.6 This study assessed resource utilization rates before and after EPAG use. These rates were adopted assuming the patterns of resource use with or without EPAG are similar to patterns of use before and after EPAG identified in Peffault De Latour’s study, the only relevant reference found in the existing literature.6
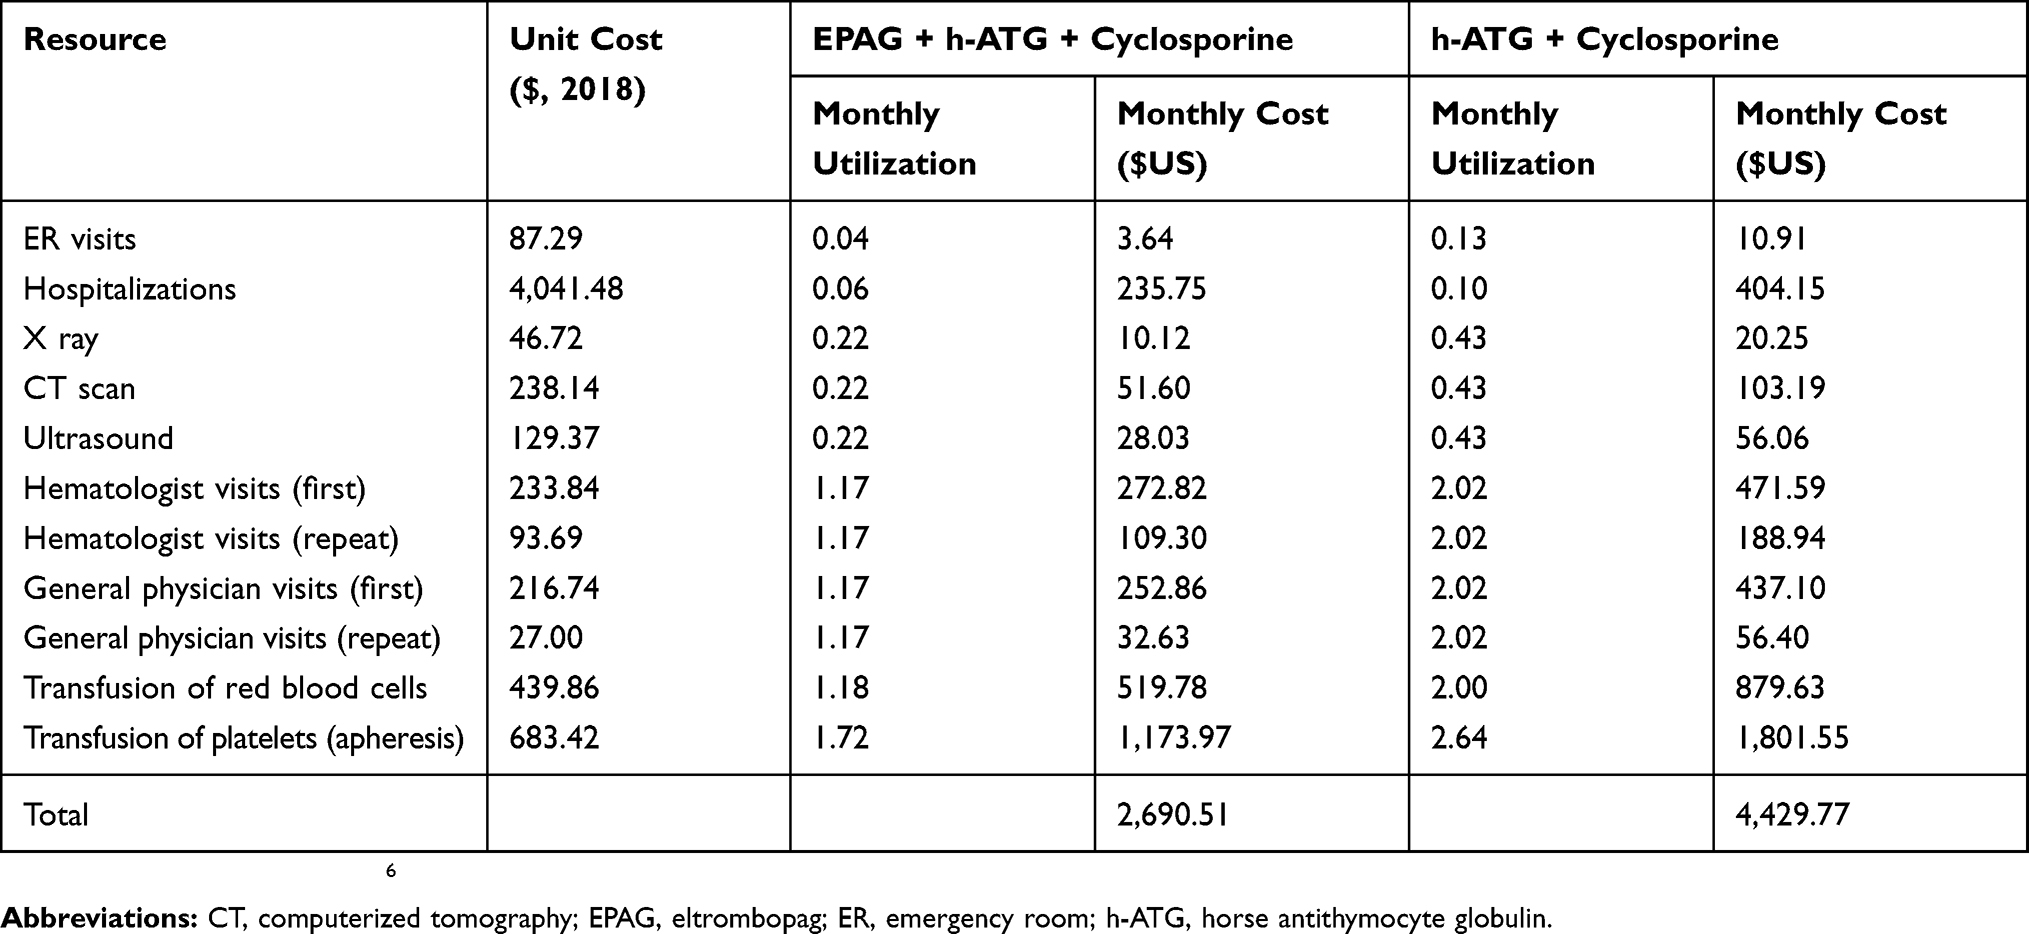 |
Table 3 Routine Care Costs (Source Of Cost Data: HCUPnet For Inpatient Treatment; CPT Codes For Outpatient Treatment) |
Adverse Events
AE costs were calculated as the product of the prevalence of a particular AE multiplied by the cost of that AE. The prevalence of each AE, as indicated by clinical trial data, and the resulting costs are presented in Table 4. No data were reported or are available on AEs for the historical cohort in Townsley 2017; it is therefore assumed that the prevalence of AEs associated with EPAG-based therapy reported in Townsley 2017 is incremental to the historical cohort AEs.17 The average cost of an AE was calculated by combining the average unit costs, obtained from HCUPnet, for inpatient treatment; the costs of outpatient AE management, based on CPT codes for testing, screening and imaging, physician visits, and emergency visits); and the rates of inpatient and outpatient treatment.21 The proportion of AEs that required inpatient treatment was dictated by the percentage of serious AEs in the clinical trial calculated as the % of SAEs vs. grade 3/4 AEs. In the current analysis, 2.00% of the AEs are severe, and 98.00% are grade 3/4. The sum of costs for all AEs makes up the total cost of AEs for each therapy.
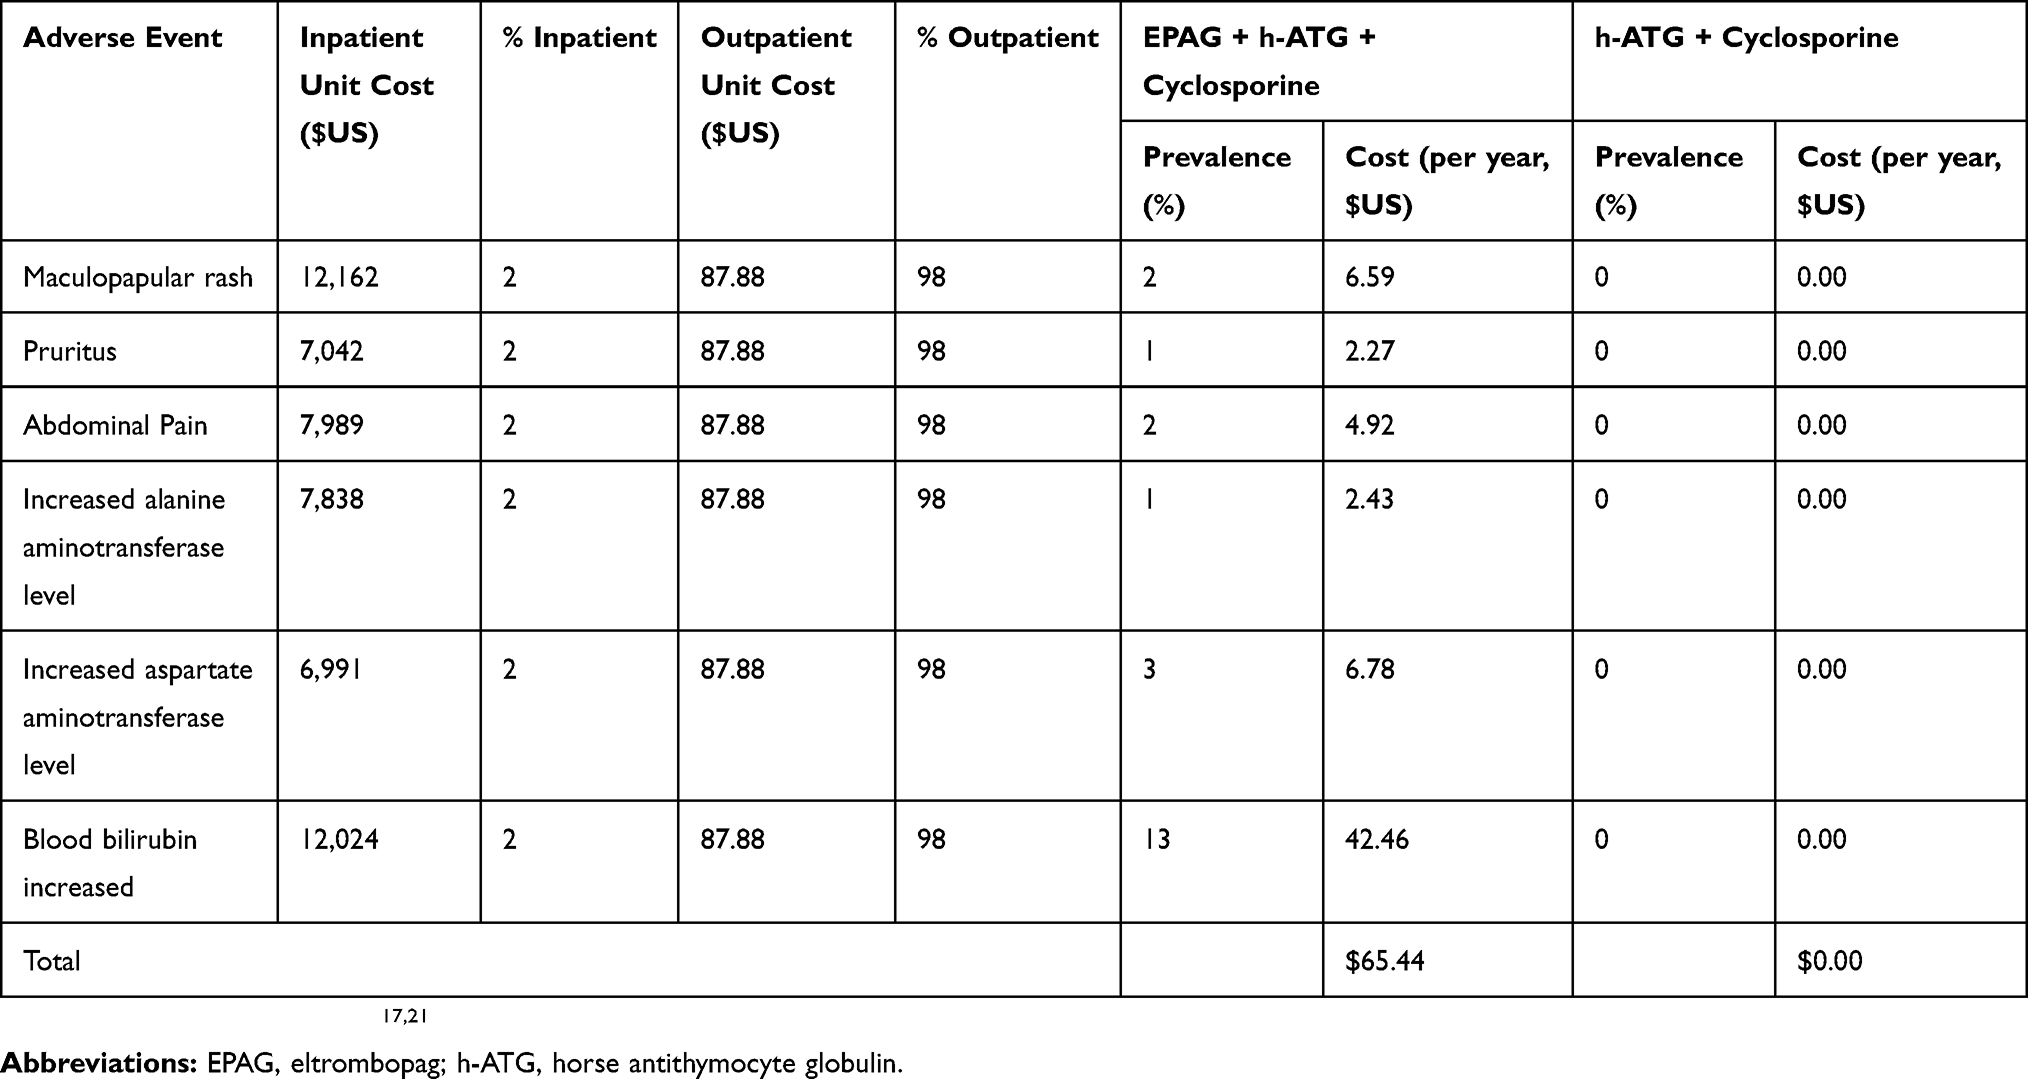 |
Table 4 Prevalence And Costs Of Adverse Events (Source Of Cost Data: HCUPnet For Inpatient Treatment; CPT Codes For Outpatient Treatment) |
Mortality
Mortality rates were derived based on clinical trial data (survival benefit). Mortality costs were derived from the product of the number of patients who died in a given year in a given therapy arm multiplied by the calculated cost of SAA mortality in the US, ie, costs of hospitalization and palliation for terminal patients.21
Survival Benefit
Survival estimates were based on data from the Townsley clinical trial.17 The proportion of patients treated with eltrombopag plus IST who survived after 1 year was 98.90%, calculated as 100% - 1.10% (100% - mortality rate for eltrombopag plus IST).17 The proportion of patients treated with only IST who survived was 98.60% in year 1.
Results
Population
Based on the total US population, 628 SAA patients were considered at baseline. With the introduction of eltrombopag, it was estimated that 10%, 20%, and 30% of targeted SAA patients would join its treatment population: 63 patients in year 1, 127 in year 2, and 192 in year 3.
Therapies
Costs
The costs of base case and eltrombopag scenarios are compared in Table 5. Annual primary therapy drug costs from years 1 to 3 went from $55 to $56 million in a base case scenario and from $67 to $91 million in an eltrombopag uptake scenario. Greater rates of response with eltrombopag resulted in reduced secondary therapy and routine care costs. Neither conventional treatment with IST nor eltrombopag-based treatment was associated with significant costs due to AEs. Rare AEs experienced by patients on eltrombopag-based therapy generated low costs.
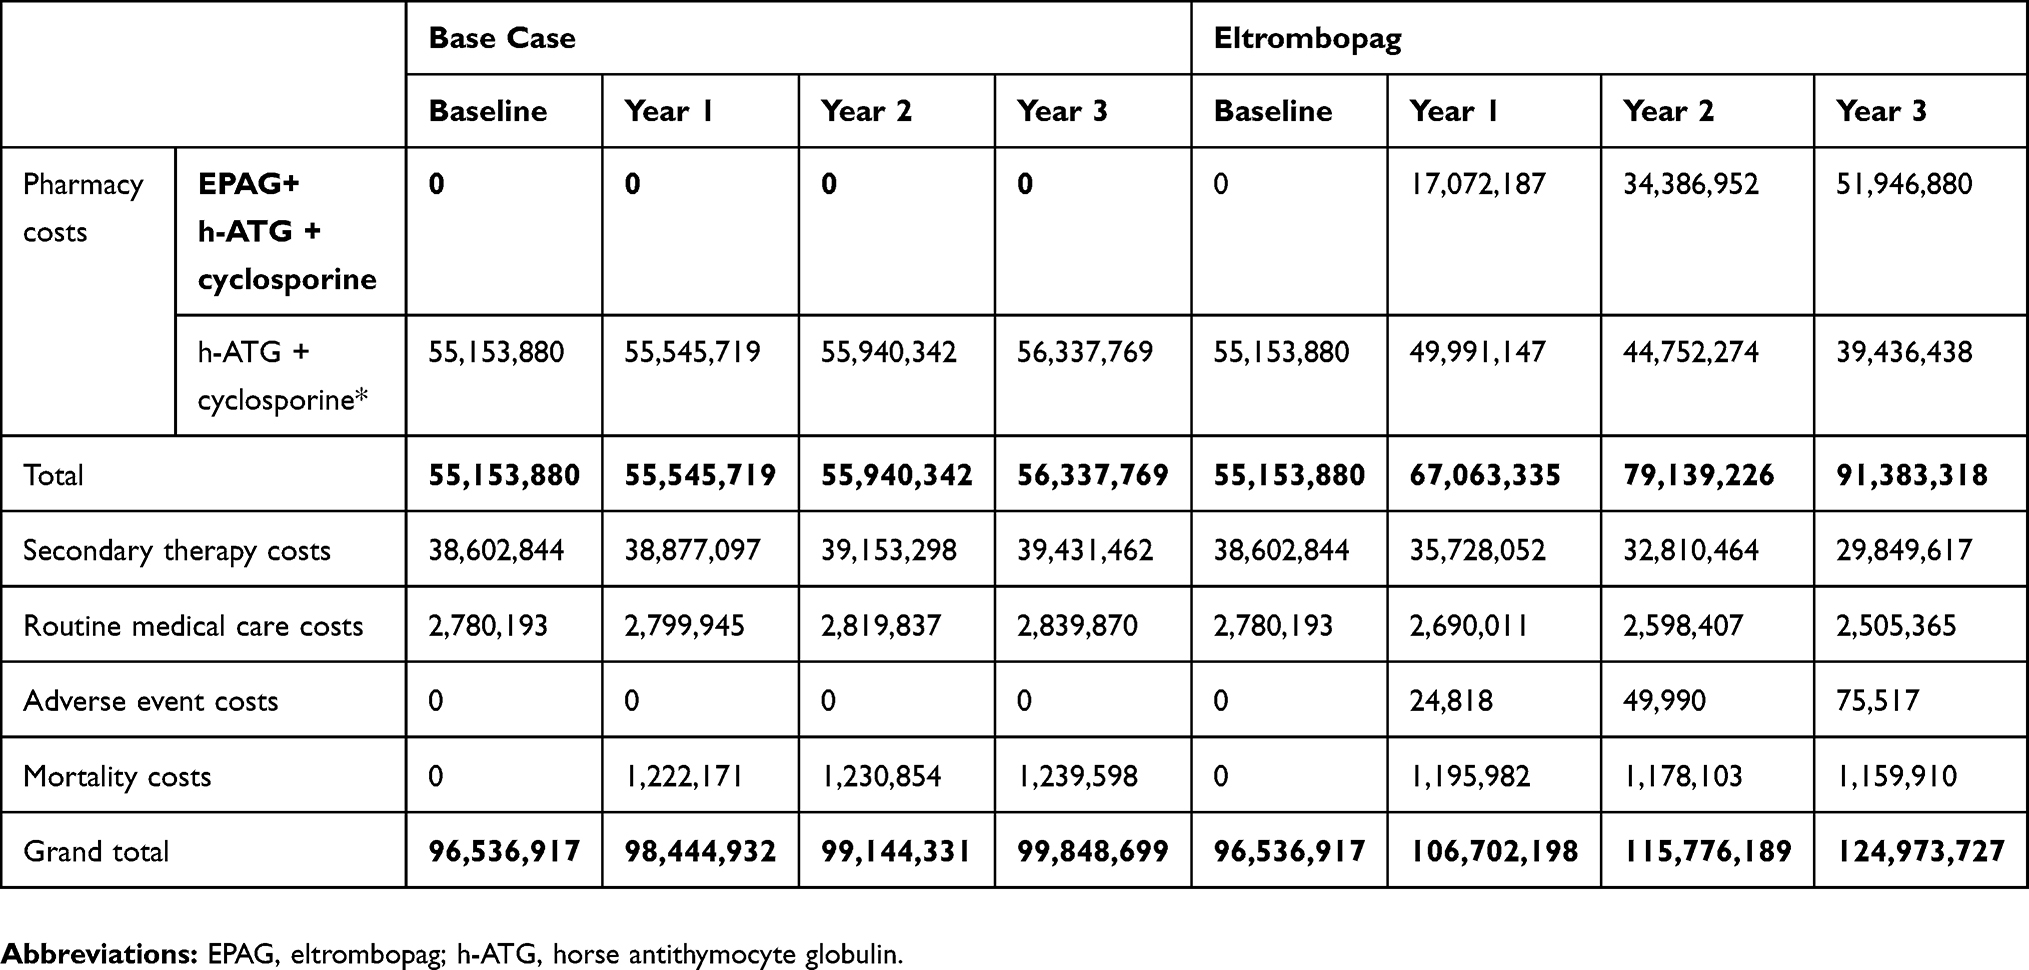 |
Table 5 Total Costs (US$) |
Net Budget Impact
Total drug, routine care, AE, and mortality costs are summed for each treatment in Table 5. These figures were compared to generate net budget impact. The estimated yearly net budget impact of the use of eltrombopag as first-line therapy for SAA is presented in Table 6 from a US healthcare system perspective. Over a three-year time horizon, we estimated that an additional $50 million in funding would be required, despite cost offsets due to the reduced costs of secondary therapy, routine care, and mortality. Table 6 presents the absolute, relative, and per person in the US per month budgetary impact of the introduction of eltrombopag for the first-line treatment of adult SAA patients who are not currently suitable for HSCT.
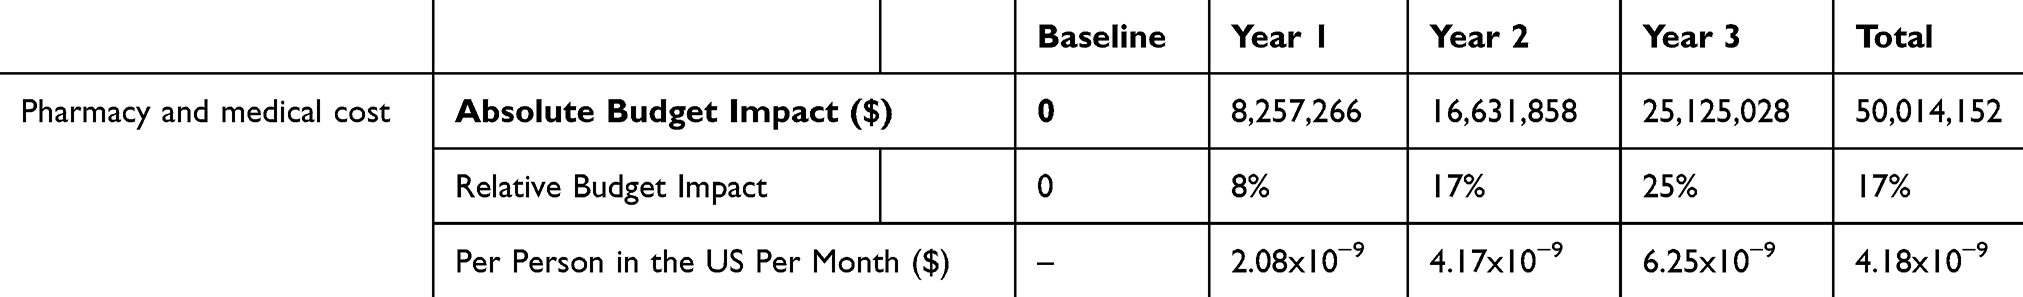 |
Table 6 Budget Impact Of Eltrombopag As First-Line Therapy For SAA |
Deterministic Sensitivity Analysis
Sensitivity analyses were performed, with each assumption varied individually ±20% to evaluate the sensitivity of the result to a fixed modification of the variable. In this analysis, variations in the cost of eltrombopag, the incidence of SAA, and rates of complete response while on eltrombopag had the greatest impact. Figure 3 summarizes the assumptions tested and the results of these tests.
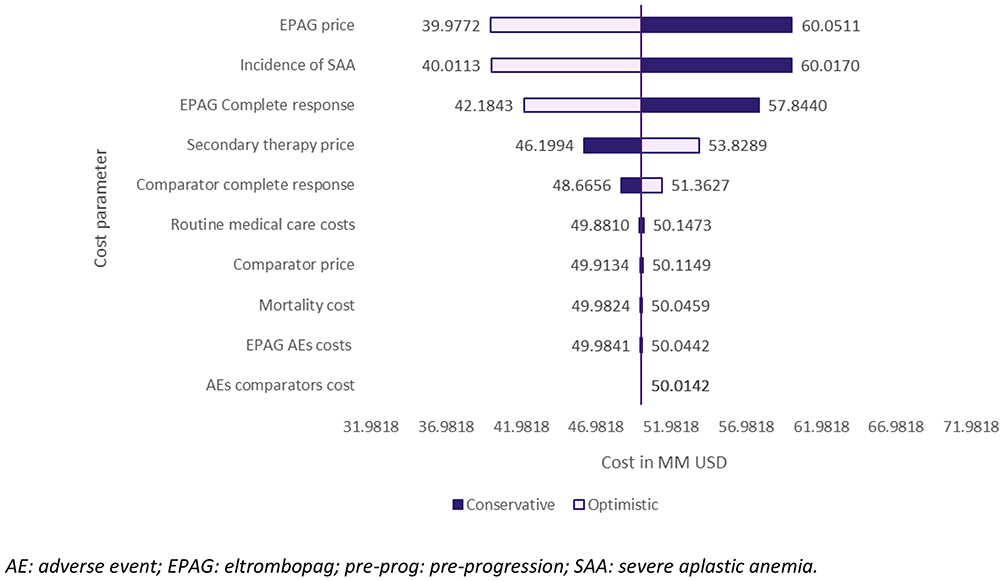 |
Figure 3 Sensitivity analysis results (US$, over 3 years). Abbreviations: AE, adverse event; EPAG, eltrombopag; pre-prog: pre-progression; SAA, severe aplastic anemia. |
Discussion
The anticipated costs of eltrombopag treatment were explored and applied to a representative population of SAA patients in the US. The use of eltrombopag for the first-line treatment of all US SAA patients would result in an increase in costs of $50 million over 3 years, despite cost offsets of $19 million. In this analysis, eltrombopag supplemented current treatments. The increase in costs was therefore related to the cost of eltrombopag for primary therapy, while secondary therapy, routine care, and mortality costs were reduced. Sensitivity analyses supported the primary analysis but highlighted the importance of eltrombopag drug costs, secondary therapy costs, and the rates of complete response associated with the comparator.
Though comprehensive, certain limitations appertain to this analysis, and there are opportunities for additional research to allow for a more comprehensive model. The market share values were based in part on the manufacturer’s internal estimates; their accuracy was therefore limited. There is limited research on the incidence and prevalence of SAA; the estimates of patient flow in this analysis would benefit from additional epidemiologic research on SAA in the US. Additional data on the impact of SAA on patient productivity could enhance the analysis of indirect costs. The model does not account for Medicare patients and others covered by health plans that may apply discounts; this conservative assumption means that there is likely to be an overestimate of the budget impact. The model used clinical trial data as the source of the response rate for the standard of care; this approach does not incorporate real-world treatment patterns in which patients may be untreated or undertreated. As the trial length was only 6 months, long-term treatment pathways were difficult to predict. Longer-term data could help to refine assumptions relating to treatment duration and duration of response. Further, mortality data were not collected in the relevant trials and were therefore modelled. Otherwise, the model was constructed using a methodological approach and robust clinical trial data. The model’s conclusions were confirmed by sensitivity analyses and should be considered sound.
This analysis highlights that there are additional costs—primarily medication costs—associated with first-line therapy with eltrombopag for adult SAA patients whose treatment options are limited. These additional costs are partially offset by high response rates, reduced rescue medication use, and reduced mortality relative to other available treatment options.
Author contributions
All authors contributed to data analysis, drafting or revising the article, gave final approval of the version to be published, and agree to be accountable for all aspects of the work.
Disclosure
Qayyim Said and Beilei Cai are employees of Novartis Pharmaceutical Corporation. Anuja Nidumolu Roy received services related to preparation and submission of manuscript from Purple Squirrel Economics, during the conduct of the study and is an employee of Novartis and owns its stock. Gabriel Tremblay, Shan Ashton Garib, Jaclyn Hearnden, and Anna Forsythe are employees of Purple Squirrel Economics. The authors report no other conflicts of interest in this work
References
1. Montané E, Ibáñez L, Vidal X, et al. Epidemiology of aplastic anemia: a prospective multicenter study. Haematologica. 2008;93(4):518–523. doi:10.3324/haematol.12020
2. Young NS, Kaufman DW. The epidemiology of acquired aplastic anemia. Haematologica. 2008;93(4):489–492. doi:10.3324/haematol.12855
3. Aplastic Anemia. Aplastic anemia & MDS international foundation. Available from: https://www.aamds.org/diseases/aplastic-anemia. Accessed September 12, 2019.
4. Brodsky RA, Jones RJ. Aplastic anaemia. Lancet Lond Engl. 2005;365(9471):1647–1656. doi:10.1016/S0140-6736(05)66515-4
5. Aplastic Anemia | National Heart, Lung, and Blood Institute (NHLBI). Available from: https://www.nhlbi.nih.gov/health-topics/aplastic-anemia.
6. Peffault De Latour R, Huynh L, Ivanova JI, et al. A retrospective chart review to assess burden of illness among patients with severe aplastic anemia with insufficient response to immunosuppressive therapy. Blood. 2017;130(Suppl 1):678.
7. Sureda A, Bader P, Cesaro S, et al. Indications for allo- and auto-SCT for haematological diseases, solid tumours and immune disorders: current practice in Europe, 2015. Bone Marrow Transplant. 2015;50(8):1037–1056. doi:10.1038/bmt.2015.6
8. Killick SB, Bown N, Cavenagh J, et al. Guidelines for the diagnosis and management of adult aplastic anaemia. Br J Haematol. 2016;172(2):187–207. doi:10.1111/bjh.13853
9. Heublein S, Wehner F, Höchsmann B, Hochhaus A, Hartmann M, La Rosée P. Modelling cost effectiveness of horse antithymocyte globulin for treating severe aplastic anaemia in Germany. Ann Hematol. 2013;92(6):825–830. doi:10.1007/s00277-013-1688-2
10. Marsh JCW, Ball SE, Cavenagh J, et al. Guidelines for the diagnosis and management of aplastic anaemia. Br J Haematol. 2009;147(1):43–70. doi:10.1111/j.1365-2141.2009.07842.x
11. Dolberg OJ, Levy Y. Idiopathic aplastic anemia: diagnosis and classification. Autoimmun Rev. 2014;13(4–5):569–573. doi:10.1016/j.autrev.2014.01.014
12. Groth M, Singer S, Niedeggen C, et al. Development of a disease-specific quality of life questionnaire for patients with aplastic anemia and/or paroxysmal nocturnal hemoglobinuria (QLQ-AA/PNH)-report on phases I and II. Ann Hematol. 2017;96(2):171–181. doi:10.1007/s00277-016-2867-8
13. Guinan EC. Diagnosis and management of aplastic anemia. Hematol Am Soc Hematol Educ Program. 2011;2011:76–81. doi:10.1182/asheducation-2011.1.76
14. Meehan KR, Matias CO, Rathore SS, et al. Platelet transfusions: utilization and associated costs in a tertiary care hospital. Am J Hematol. 2000;64(4):251–256. doi:10.1002/1096-8652(200008)64:4<251::aid-ajh3>3.0.co;2-n
15. Novartis. Promacta US Prescribing Information. NJ: Novartis Pharmaceuticals Corporation; 2019.
16. Desmond R, Townsley DM, Dumitriu B, et al. Eltrombopag restores trilineage hematopoiesis in refractory severe aplastic anemia that can be sustained on discontinuation of drug. Blood. 2014;123(12):1818–1825. doi:10.1182/blood-2013-10-534743
17. Townsley DM, Scheinberg P, Winkler T, et al. Eltrombopag added to standard immunosuppression for aplastic anemia. N Engl J Med. 2017;376(16):1540–1550. doi:10.1056/NEJMoa1613878
18. US Department of Labor. U.S. Bureau of Labor Statistics; 2016. https://www.bls.gov/.
19. Sullivan SD, Mauskopf JA, Augustovski F, et al. Budget impact analysis-principles of good practice: report of the ISPOR 2012 budget impact analysis good practice II task force. Value Health J Int Soc Pharmacoeconomics Outcomes Res. 2014;17(1):5–14. doi:10.1016/j.jval.2013.08.2291
20. Huynh L, Ivanova J, Totev T, et al. PSY90 - health resource burden among patients with severe aplastic anemia who have had insufficient response to immunosuppressive therapy: a retrospective chart review study. Value Health. 2018;21:S259–S260. doi:10.1016/j.jval.2018.04.1732
21. US Department of Health and Human Services. Healthcare Cost and Utilization Project (HCUP).; 2014. https://www.hcup-us.ahrq.gov/.
 © 2019 The Author(s). This work is published and licensed by Dove Medical Press Limited. The full terms of this license are available at https://www.dovepress.com/terms.php and incorporate the Creative Commons Attribution - Non Commercial (unported, v3.0) License.
By accessing the work you hereby accept the Terms. Non-commercial uses of the work are permitted without any further permission from Dove Medical Press Limited, provided the work is properly attributed. For permission for commercial use of this work, please see paragraphs 4.2 and 5 of our Terms.
© 2019 The Author(s). This work is published and licensed by Dove Medical Press Limited. The full terms of this license are available at https://www.dovepress.com/terms.php and incorporate the Creative Commons Attribution - Non Commercial (unported, v3.0) License.
By accessing the work you hereby accept the Terms. Non-commercial uses of the work are permitted without any further permission from Dove Medical Press Limited, provided the work is properly attributed. For permission for commercial use of this work, please see paragraphs 4.2 and 5 of our Terms.